The Year in Charts - Kem C. Gardner Policy Institute · 2019-04-29 · The Year in Charts...
20
The Year in Charts UTAH’S HOUSING MARKET 2018 By James Wood
Transcript of The Year in Charts - Kem C. Gardner Policy Institute · 2019-04-29 · The Year in Charts...

The Year in Charts U T A H ’ S H O U S I N G M A R K E T 2 0 1 8
By James Wood
C O N T E N T S
2 Residential Construction, Best Year Since 2006
3 High Density Multifamily Housing Hits Record Level
4 Condominium/Townhome Construction at All-Time High
5 Top Ranked Cities: Herriman, St. George, and Salt Lake City Are Leaders in Residential Construction
6 New Homes Affordable to Fewer Households
7 Housing Shortage Persists, but Eased in 2018
I Residential Construction
8 Sales of Existing Homes at Record Levels, 2016-2018
9 Demand for Existing Homes Outstrips Listings
10 Housing Prices Increases Accelerate
12 Affordable Cities See Largest Price Increases
13 Pace of Sales Benefits Sellers, Frustrates Buyers
14 In Second Half of 2018 Sales Slump, but Prices Firm
15 Mortgage Payment Jumps as Prices and Interest Rates Increase
16 Rising Rents Price Some Out of the Market
17 Low Vacancy Rates Persist for Fifth Year
II Residential Real Estate Market

The Year in Charts summarizes the performance of Utah’s housing market in 2018. The following 25 charts provide a record of current conditions, show long-term trends, and highlight important changes underway in the home building and real estate markets. The charts are divided into two major groups: (1) Residential Construction and (2) Residential Real Estate Sales.
By almost any measure, 2018 was another exceptional year for Utah’s home building and real estate industries. Sales of new and existing homes were brisk, apartment and condominium construction was at an all-time high, and the demand for rental units remained exceptionally strong. Builders, realtors, and landlords benefit–
ted from strong housing demand; however, for households trying to buy or rent, conditions were not so upbeat. Both home prices and rental rates increased significantly in 2018, adding to several past years of escalating prices, which produced heightened concerns about deteriorating housing affordability.
The Year in Charts: U T A H ’ S H O U S I N G M A R K E T 2 0 1 8
Ivory-Boyer Real Estate Center The Year in Charts Residential Construction 1

I Residential Construction
Residential Construction, Best Year Since 2006
The number of residential building permits issued in Utah in 2018 was the highest in 12 years and marked the eighth year of gradual increases. Home building’s recovery from the Great Recession has been long and almost leisurely. The period from 2010 to 2018 represents the slowest recovery of any Utah housing cycle dating back to the 1940s. As we shall see in later charts, this unusually slow recovery contributed to Utah’s current housing shortage. A number of factors caused the slow recovery, but none more critical than the rapidly
rising prices of new homes. High prices have affected housing preferences, shaped patterns of new residential development, and generated a move to high density housing. In 2018, solid demographic and economic growth supported increased levels of building activity, distinguished by a bubble free market, in sharp contrast to the 2004-2006 period. Forecasts suggest a modest slowdown is likely in the near future. While 2018, with 24,226 new dwelling units, may not be the peak of this cycle it is very likely within a year of the peak.
23,737
28,285
9,066
24,226
0
5,000
10,000
15,000
20,000
25,000
30,000
1990
1991
1992
1993
1994
1995
1996
1997
1998
1999
2000
2001
2002
2003
2004
2005
2006
2007
2008
2009
2010
2011
2012
2013
2014
2015
2016
2017
2018
Chart 1: Number of Residential Building Permits Issued in Utah
Source: Ivory-Boyer Construction Database, Kem C. Gardner Policy Institute.
The Year in Charts Ivory-Boyer Real Estate CenterResidential Construction2

High Density Multifamily Housing Hits Record Level
Prior to 2008, single-family homes averaged 70 to 75 percent of new residential construction, but since the Great Recession their share has dropped substantially. Most recently, in 2018, only 54 percent of all new residential units were single-family homes while 46 percent were multifamily units; either condominiums, town homes, or apartment units. Building permits were
issued for 11,025 multifamily units in 2018, the highest number on record. The shift to multifamily has been most pronounced since 2014 as new home prices have forced many households to pursue more affordable multifamily housing alternatives. Consequently, over the past few years, more high density housing has been built in Utah than in any time in the state’s housing history.
Chart 2 Single-Family and Multifamily Permits as Percent of Total Building Permits Issued in Utah
Source: Ivory-Boyer Construction Database, Kem C. Gardner Policy Institute.
Chart 3 Building Permits Issued for Single-Family and Multifamily Units in Utah
Source: Ivory-Boyer Construction Database, Kem C. Gardner Policy Institute.
10.8%
46.1%
89.2%
53.9%
0.0%
20.0%
40.0%
60.0%
80.0%
100.0%19
91
1993
1995
1997
1999
2001
2003
2005
2007
2009
2011
2013
2015
2017
Percent Multifamily Units Percent Single Family Units
9,864
11,025
20,912
8,690
12,760
0
5,000
10,000
15,000
20,000
25,000
1991
1993
1995
1997
1999
2001
2003
2005
2007
2009
2011
2013
2015
2017
Multifamily Units Single Family Units
Chart 2: Single-Family and Multifamily Permits as Percent of Total Building Permits Issued in Utah
Chart 3: Building Permits Issued for Single-Family and Multifamily Units in Utah
Source: Ivory-Boyer Construction Database, Kem C. Gardner Policy Institute.
Ivory-Boyer Real Estate Center The Year in Charts Residential Construction 3

Condominium/Townhome Construction at All-Time High
The multifamily housing boom is driven by high levels of both condominium/townhome and apartment construction. What distinguishes 2018 from past years is the record number of condominium units. In 2018, permits were issued for 5,728 condominium/townhome units, an all-time high. For the first time in ten years the number of permits issued for condominium/townhome units was higher than apartment units. While the apartment boom has been underway for five years the
surge in condominium/townhome development has occurred in just the past two years. The number of condominium/townhome units increased by 89 percent, from 3,000 units in 2016 to over 5,700 units in 2018. Nearly one in four new residential units statewide was a condominium/townhome unit in 2018. The demand is expected to remain very strong for these affordable homeownership units, likely pushing the number of new condominium/townhome units above 6,000 units in 2019.
4,551
5,728
5,327
6,742
5,185
0
1,000
2,000
3,000
4,000
5,000
6,000
7,000
8,00019
91
1992
1993
1994
1995
1996
1997
1998
1999
2000
2001
2002
2003
2004
2005
2006
2007
2008
2009
2010
2011
2012
2013
2014
2015
2016
2017
2018
Condominium and Townhome Units Apartment Units
Chart 4: Building Permits Issued for Condominium and Townhome and Apartment Units in Utah
Source: Ivory-Boyer Construction Database, Kem C. Gardner Policy Institute.
The Year in Charts Ivory-Boyer Real Estate CenterResidential Construction4

0 200 400 600 800 1000 1200
249Orem
378South Jordan
475Midvale
615Lehi
1,084Herriman
0 200 400 600 800
337Blu�dale
342Herriman
378Millcreek
604Draper
749Salt Lake City
0 500 1,000 1,500 2,000 2,500
898Draper
1,092South Jordan
1,357St. George
1,444Lehi
2,053Herriman
0 200 400 600 800 1000
604Eagle Mountain
627Herriman
659South Jordan
829Lehi
940St. George
Top Ranked Cities: Herriman, St. George, and Salt Lake City Are Leaders in Residential Construction
For the second consecutive year, Herriman led all Utah cities in residential construction activity. The city issued 2,053 residential building permits in 2018. Herriman was far and away the leader in condominium/townhome permits with a total of 1,084 units, which carried the city to the number one ranking. The leader in single-family construction in 2018 was St. George with 940 units, the sixth consecutive year St. George has held the number one spot. A fair share of St George’s single-family activity is supported by the second home market. St. George, Lehi,
and South Jordan have been locked into the top three spots in single-family construction for the past eight years. The perennial leader in apartment development is Salt Lake City, which has been the leader for five consecutive years in apartment construction. In 2018, Salt Lake City issued building permits for 749 apartment units. Of the 28,000 new apartment units developed statewide since 2014, one out of four units—6,661 units—have been located in Salt Lake City.
Chart 5: Top Five Cities by Residential Building Permits Issued, 2018
0 200 400 600 800 1000 1200
249Orem
378South Jordan
475Midvale
615Lehi
1,084Herriman
0 200 400 600 800
337Blu�dale
342Herriman
378Millcreek
604Draper
749Salt Lake City
0 500 1,000 1,500 2,000 2,500
898Draper
1,092South Jordan
1,357St. George
1,444Lehi
2,053Herriman
0 200 400 600 800 1000
604Eagle Mountain
627Herriman
659South Jordan
829Lehi
940St. George
Chart 6: Top Five Cities by Permits Issued for Single-Family Units, 2018
Chart 7: Top Five Cities by Building Permits Issued for Condominium and Townhome Units, 2018
Chart 8: Top Five Cities by Building Permits Issued for Apartment Units, 2018
Source: Ivory-Boyer Construction Database, Kem C. Gardner Policy Institute.
Ivory-Boyer Real Estate Center The Year in Charts Residential Construction 5

New Homes Affordable to Fewer Households
The median sales price of a new home in Salt Lake County in 2018 was $418,376 up 61 percent from the median price in 2010. Three other Wasatch Front counties have had similar rates of increase; in Weber County the median price is up 50 percent, in Utah County 62 percent, and in Davis County 71 percent. The rapid rise in new home costs, due primarily to higher land, labor, and material costs, has reduced the size of the potential
buyer’s market and damaged housing affordability. For example, 60 percent of the households in Davis County were able to afford the median priced new home in 2010, but that share dropped to only 42 percent by 2018. Affordability was hurt most in Weber County where the share of households able to afford the median priced home dropped from 50 percent in 2010 to 30 percent in 2018.
Source: Metrostudy and Kem C. Gardner Policy Institute.
Chart 10: Percent of Households Able to Afford Median Priced New Single-Family Home in Wasatch Front Counties
30%
40%
35%
42%
50%
59%
47%
60%
0% 10% 20% 30% 40% 50% 60% 70%
Weber County
Utah County
Salt Lake County
Davis County
$391,403
$376,942
$418,376
$402,762
$262,048
$232,522
$258,776
$235,390
$0 $50 $100 $150 $200 $250 $300 $350 $400 $450
Weber County
Utah County
Salt Lake County
Davis County
2010 2018
2010 2018
(thousands)
Chart 9: Median Sales Price of New Single-Family Home in Wasatch Front Counties
Source: Metrostudy.
The Year in Charts Ivory-Boyer Real Estate CenterResidential Construction6

Housing Shortage Persists, but Eased in 2018
From 1970 to 2010 the number of new housing units outnumbered the increase in households by about 12 percent. This surplus of dwelling units was absorbed by the second home market and changes in vacancy rates; however, this historic relationship was upended by the Great Recession. Since 2010, new households have outnumbered new housing units by over 40,000 households. Construction of new homes has not keep pace with household growth resulting in a housing shortage accompanied by rapidly rising home prices and rents, low vacancy rates, multiple offers on for sale
homes, and the doubling-up of households. Almost 11 percent of the population in households are relatives or nonrelatives in doubled-up situations. A total of 333,000 doubled-up persons. In 2018, the first sign of some relief for these doubled-up households emerged. The number of new housing units outnumbered new households by about 1,000 units. Although the housing shortage will persist for some time, the gap between units and households has been closing over the past few years and finally turned positive in 2018.
24,4
60
22,6
15
20,9
98
17,6
31 20,2
10 24,1
52
24,4
26
25,9
99
23,1
39
9,06
6
9,06
5
11,2
67 14,9
51 18,7
88
17,6
67 20,0
23 22,9
68
24,2
00
-15,394-13,550
-9,731
-2,680-1,422
-6,485-4,403
-3,031
1,06
0
-20,000
-15,000
-10,000
-5,000
0
5,000
10,000
15,000
20,000
25,000
30,000
2010 2011 2012 2013 2014 2015 2016 2017 2018
Increase in Households Number of New Housing Units Shortage of Units Surplus of Units
Chart 11: Utah’s Housing Shortage Measured by Annual Increase in Households and Housing Units
Source: Ivory-Boyer Construction Database and Kem C. Gardner Policy Institute.
Ivory-Boyer Real Estate Center The Year in Charts Residential Construction 7

Sales of Existing Homes at Record Levels, 2016-2018
Real estate sales statewide have been at record levels for the past three years, averaging about 45,000 sales annually. In 2018, single-family sales totaled 35,486 homes, the third highest year on record, while condominium/townhome sales hit an all-time record of 10,154 units. The strength of condominium/townhomes sales parallels the record level of construction of
condominium/townhomes discussed above. In both cases, condominium/townhome sales and new construction, are driven by buyers in search of affordable homeownership options. This buyer’s rush to “get in” has produced three exceptional years for real estate agents and brokers.
II Residential Real Estate MarketChart 12: Sales of Single-Family Homes and Condominium/Townhome Units in Utah
Source: UtahRealEstate.com
42,46945,640
34,868
35,486
7,601 10,154
0
5,000
10,000
15,000
20,000
25,000
30,000
35,000
40,000
45,000
50,000
2000
2001
2002
2003
2004
2005
2006
2007
2008
2009
2010
2011
2012
2013
2014
2015
2016
2017
2018
Total Closings Single Family Condominiums and Townhomes
The Year in Charts Ivory-Boyer Real Estate CenterResidential Real Estate Market8

Demand for Existing Homes Outstrips Listings
The number of residential listings statewide has steadily increased over the past six years, reaching 62,600 in 2018, the fourth highest year on record. Only the three atypical years (2006-2008) leading up to the Great Recession had more listings than 2018. The four Wasatch Front counties accounted for 80 percent of statewide listings in 2018. Realtors, almost universally, complain of a scarcity of listings, but the data show relatively high levels of listings in recent years. The difference between the data and the
anecdotes is explained by the unusually high demand for housing. The shortage of listings combined with strong demand results in a very high percentage of sold listings. Over the past four years more than 70 percent of residential listings have been sold, far above the historic average of 55 percent. In 2018, 72.9 percent of residential listings were sold statewide and in the Wasatch Front counties 74.6 percent were sold.
83,464
62,612
69,90649,636
30,000
40,000
50,000
60,000
70,000
80,000
90,000
2000
2001
2002
2003
2004
2005
2006
2007
2008
2009
2010
2011
2012
2013
2014
2015
2016
2017
2018
2000
2001
2002
2003
2004
2005
2006
2007
2008
2009
2010
2011
2012
2013
2014
2015
2016
2017
2018
State Wasatch Front Counties State Wasatch Front Counties
72.9%
74.6%
0.0%
10.0%
20.0%
30.0%
40.0%
50.0%
60.0%
70.0%
80.0%
90.0%
Chart 13: Number of Listings of Residential Units in Utah and Wasatch Front Counties(includes single-family, condominiums/townhomes)
Source: UtahRealEstate.com
Chart 14: Residential Sales as a Percent of Total Listings in Utah and Wasatch Front Counties(includes single-family, condominiums/townhomes)
Source: UtahRealEstate.com
Ivory-Boyer Real Estate Center The Year in Charts Residential Real Estate Market 9

Housing Prices Increases Accelerate
The median sales price of homes and condominiums/townhomes continued to accelerate in 2018. Price increases for single-family homes have gone from 4.3 percent in 2014 to 10.7 percent in 2018. Condominiums/townhomes have followed a similar pattern with prices accelerating from a 4.8 percent increase in 2015 to 11.9 percent in 2018. Certainly low mortgage rates have been a major factor facilitating the acceleration of housing prices, along with the state’s high rate of demographic and economic growth. These forces have combined to fuel Utah’s housing demand and higher housing prices.
By 2018, the median sales price of a home statewide was $321,000 and $235,000 for a condominium/townhome. The median home price in the Salt Lake Metropolitan Area of $341,000 ranks 23rd out of 175 metropolitan areas surveyed quarterly by the National Association of Realtors. The Salt Lake Metropolitan area ranked in the top 15 percent of all metropolitan areas in median sales price; considerable higher than some cities in neighboring states; Boise, $263,800, Phoenix $272,700, and Las Vegas $295,100.
Chart 15: Percent Increase in the Median Sales Price of a Single-Family Home in Utah
-10.0%
-15.0%
-5.0%
0.0%
5.0%
10.0%
15.0%
20.0%
1.0%
3.6%
0.7%
6.2%
5.7%
9.6%
15.8
%
0.0%
-3.0
%
-6.3
%
-8.7
%
0.7%
13.6
%
6.5%
4.8%
8.2%
10.9
%
11.9
%
2001
2002
2003
2004
2005
2006
2007
2008
2009
2010
2011
2012
2013
2014
2015
2016
2017
2018
-15.0%
-10.0%
-5.0%
0.0%
5.0%
10.0%
15.0%
20.0%2.
1%
1.0%
0.6%
3.2%
11.2
%
16.3
%
13.8
%
-1.5
%
-4.5
%
-6.4
%
-8.8
%
6.2%
13.4
%
4.3% 6.
8% 8.2% 9.
4% 10.7
%
2001
2002
2003
2004
2005
2006
2007
2008
2009
2010
2011
2012
2013
2014
2015
2016
2017
2018
$144,400
$227,500 $182,700
$321,000
$109,900
$165,000$137,000
$235,000
$0
$50,000
$100,000
$150,000
$200,000
$250,000
$300,000
$350,000
2000
2001
2002
2003
2004
2005
2006
2007
2008
2009
2010
2011
2012
2013
2014
2015
2016
2017
2018
Single Family Condominium and Townhome
Source: UtahRealEstate.com
The Year in Charts Ivory-Boyer Real Estate CenterResidential Real Estate Market10

Chart 16: Percent Increase in the Median Sales Price of a Condominiums/Townhome Unit in Utah
-10.0%
-15.0%
-5.0%
0.0%
5.0%
10.0%
15.0%
20.0%
1.0%
3.6%
0.7%
6.2%
5.7%
9.6%
15.8
%
0.0%
-3.0
%
-6.3
%
-8.7
%
0.7%
13.6
%
6.5%
4.8%
8.2%
10.9
%
11.9
%
2001
2002
2003
2004
2005
2006
2007
2008
2009
2010
2011
2012
2013
2014
2015
2016
2017
2018
-15.0%
-10.0%
-5.0%
0.0%
5.0%
10.0%
15.0%
20.0%
2.1%
1.0%
0.6%
3.2%
11.2
%
16.3
%
13.8
%
-1.5
%
-4.5
%
-6.4
%
-8.8
%
6.2%
13.4
%
4.3% 6.
8% 8.2% 9.
4% 10.7
%
2001
2002
2003
2004
2005
2006
2007
2008
2009
2010
2011
2012
2013
2014
2015
2016
2017
2018
$144,400
$227,500 $182,700
$321,000
$109,900
$165,000$137,000
$235,000
$0
$50,000
$100,000
$150,000
$200,000
$250,000
$300,000
$350,000
2000
2001
2002
2003
2004
2005
2006
2007
2008
2009
2010
2011
2012
2013
2014
2015
2016
2017
2018
Single Family Condominium and Townhome
-10.0%
-15.0%
-5.0%
0.0%
5.0%
10.0%
15.0%
20.0%
1.0%
3.6%
0.7%
6.2%
5.7%
9.6%
15.8
%
0.0%
-3.0
%
-6.3
%
-8.7
%
0.7%
13.6
%
6.5%
4.8%
8.2%
10.9
%
11.9
%
2001
2002
2003
2004
2005
2006
2007
2008
2009
2010
2011
2012
2013
2014
2015
2016
2017
2018
-15.0%
-10.0%
-5.0%
0.0%
5.0%
10.0%
15.0%
20.0%
2.1%
1.0%
0.6%
3.2%
11.2
%
16.3
%
13.8
%
-1.5
%
-4.5
%
-6.4
%
-8.8
%
6.2%
13.4
%
4.3% 6.
8% 8.2% 9.
4% 10.7
%
2001
2002
2003
2004
2005
2006
2007
2008
2009
2010
2011
2012
2013
2014
2015
2016
2017
2018
$144,400
$227,500 $182,700
$321,000
$109,900
$165,000$137,000
$235,000
$0
$50,000
$100,000
$150,000
$200,000
$250,000
$300,000
$350,000
2000
2001
2002
2003
2004
2005
2006
2007
2008
2009
2010
2011
2012
2013
2014
2015
2016
2017
2018
Single Family Condominium and Townhome
Source: UtahRealEstate.com
Chart 17: Median Sales Price for Single-Family Home and Condominium/Townhome in Utah
Ivory-Boyer Real Estate Center The Year in Charts Residential Real Estate Market 11
Affordable Cities See Largest Price Increases
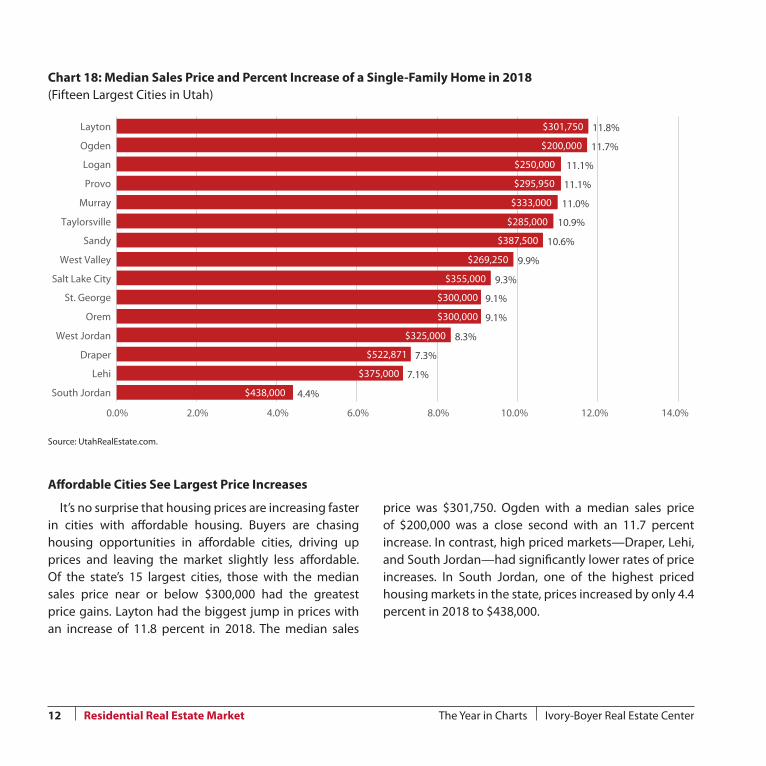
It’s no surprise that housing prices are increasing faster in cities with affordable housing. Buyers are chasing housing opportunities in affordable cities, driving up prices and leaving the market slightly less affordable. Of the state’s 15 largest cities, those with the median sales price near or below $300,000 had the greatest price gains. Layton had the biggest jump in prices with an increase of 11.8 percent in 2018. The median sales
price was $301,750. Ogden with a median sales price of $200,000 was a close second with an 11.7 percent increase. In contrast, high priced markets—Draper, Lehi, and South Jordan—had significantly lower rates of price increases. In South Jordan, one of the highest priced housing markets in the state, prices increased by only 4.4 percent in 2018 to $438,000.
Chart 18: Median Sales Price and Percent Increase of a Single-Family Home in 2018 (Fifteen Largest Cities in Utah)
Source: UtahRealEstate.com.
$438,000
$375,000
$522,871
$325,000
$300,000
$300,000
$355,000
$269,250
$387,500
$285,000
$333,000
$295,950
$250,000
$200,000
$301,750
4.4%
7.1%
7.3%
8.3%
9.1%
9.1%
9.3%
9.9%
10.6%
10.9%
11.0%
11.1%
11.1%
11.7%
11.8%
0.0% 2.0% 4.0% 6.0% 8.0% 10.0% 12.0% 14.0%
South Jordan
Lehi
Draper
West Jordan
Orem
St. George
Salt Lake City
West Valley
Sandy
Taylorsville
Murray
Provo
Logan
Ogden
Layton
The Year in Charts Ivory-Boyer Real Estate CenterResidential Real Estate Market12

Pace of Sales Benefits Sellers, Frustrates Buyers
In 2018, a “for sale” home typically sold within three weeks. The time span between listing and closing is known as the cumulative days on market (CDOM). The CDOM over the past 20 years has averaged 51 days,
more than twice as long as the 21 days in 2018. The CDOM’s exceptionally low level in recent years is a strong indicator of a housing shortage.
Chart 19: Cumulative Days on Market for a Single-Family Home in Utah Average CDOM is 51 days.
Source: UtahRealEstate.com.
63
69 70 70
52
40
26
41
77
83
77
83
52
34
46
28
18 20 21
0
10
20
30
40
50
60
70
80
9020
00
2001
2002
2003
2004
2005
2006
2007
2008
2009
2010
2011
2012
2013
2014
2015
2016
2017
2018
Ivory-Boyer Real Estate Center The Year in Charts Residential Real Estate Market 13

1. Why the Housing Market is Slumping Despite a Booming Economy, Neil Irwin, New York Times, November 15, 2018. Case-Shiller: Home Price Growth Continues to Lag, Alcynna Lloyd, Housing Wire, December 26, 2018.
Chart 20: Monthly Percent Change in Sales and Median Price of Single-Family Homes, Wasatch Front Counties 2018(year over change)
4.4%
13.2%
12.8%12.3%
-15.0%
-10.0%
-5.0%
0.0%
5.0%
10.0%
15.0%
20.0%
25.0%
Janu
ary
Febr
uary
Mar
ch
Apr
il
May
June July
Aug
ust
Sept
embe
r
Oct
ober
Nov
embe
r
Dec
embe
r
% change in Sales % Change in Median Sales Price
Source: UtahRealEstate.com.
The Year in Charts Ivory-Boyer Real Estate CenterResidential Real Estate Market14
In Second Half of 2018 Sales Slump, but Prices Firm
During the last half of 2018, homes sales and prices nationally softened producing headlines of a housing slump.1 To be clear, home prices at the national level didn’t decline but rather the rate of increase slowed whereas the number of homes sold did decline. How did the Wasatch Front real estate market perform in the last half of the year? A look at the monthly year-over data shows that single-family sales first registered a decline
in August with a 2.3 percent drop, which accelerated to 13.2 percent by December, thus following the national trend. Housing prices, however, didn’t show any signs of decelerating in the second half of the year. Counter to the national trend, home prices in the Wasatch Front increased at a consistent double-digit level in five of the last six months of the year.

Mortgage Payment Jumps as Prices and Interest Rates Increase
For many households, the dream of homeownership is seriously threatened by the rapid rise in home prices. The extent of that threat is shown by a simple example. In 2013, the monthly mortgage payment for the median priced home statewide was $1,167. Five years later,
that mortgage payment had increased by 56 percent to $1,821. During that same period, household income increased by only 20 percent. For many families, the possibility of homeownership is slipping away in the wake of double-digit housing price increases.
Chart 21: Mortgage Payment for the Median Priced Home in Selected Counties
$1,390
$1,798
$1,943
$2,014
$1,810
$1,821
$849
$1,124
$1,220
$1,299
$1,161
$1,167
$0 $500 $1,000 $1,500 $2,000 $2,500
Weber
Washington
Utah
Salt Lake
Davis
State
2013 2018
Source: UtahRealEstate.com and Kem C. Gardner Policy Institute.
Ivory-Boyer Real Estate Center The Year in Charts Residential Real Estate Market 15

Rising Rents Price Some Out of the Market
Renters also feel price pressure. In 2018, it took an income of $51,000 to afford the average two bedroom two bath unit in Salt Lake County. That two bedroom unit rents for $1,294, an increase of $100 in the last year. While two bedroom rents increased by eight percent renter’s income statewide increased a by only one percent. Consequently, the housing affordability crisis is even more dire for renters than homeowners. During past periods of rapidly rising housing prices, in the 1970s and 1990s, affordability was less an issue for renters.
In today’s market many households are not only priced out of the ownership market, but also the rental market. This distinguishing characteristic is likely due to the housing shortage, which was not present in past cycles. Rising rents means large numbers of renters face severe housing cost burdens. One in five renter households—nearly 60,000 renters—pay at least 50 percent of their income for housing costs. These households have the highest risk of homelessness.
Chart 22: Percent Increase in Rental Rates in Wasatch Front Counties, 2018
Chart 23: Rental Rates by Type of Unit in Wasatch Front Counties, 2018
Source: 2018 Greater Salt Lake Area Multifamily Marker Report, CBRE.
8.8% 9.1%
8.3%
7.9% 8.2%
3.3%
11.8
%
4.8%
9.3%
2.7%
6.0%
7.3%
5.6%
9.8%
5.1%
13.5
%
5.7%
16.4
%
4.5%
10.4
%0.0%
2.0%
4.0%
6.0%
8.0%
10.0%
12.0%
14.0%
16.0%
18.0%
One Bedroom
TwoBedroomOne Bath
TwoBedroomTwo Bath
ThreeBedroomTwo Bath
Overall
Salt Lake Utah Davis Weber
One Bedroom
TwoBedroomOne Bath
TwoBedroomTwo Bath
ThreeBedroomTwo Bath
Overall
Salt Lake Utah Davis Weber
$997 $1
,056
$1,2
94 $1,4
54
$1,1
34
$975
$974
$1,2
40
$1,5
10
$1,1
22
$915 $1
,008 $1
,143
$1,3
63
$1,0
14
$806
$795
$1,1
07
$1,1
26
$878
$0
$200
$400
$600
$800
$1,000
$1,200
$1,400
$1,600
The Year in Charts Ivory-Boyer Real Estate CenterResidential Real Estate Market16

Chart 24: Vacancy Rates in Wasatch Front Counties, 2007-2018*
Table 25: Vacancy Rates in Wasatch Front Counties for Selected Years
Low Vacancy Rates Persist for Fifth Year
Since 2014 low vacancy rates have defined the local rental market. For five consecutive years vacancy rates in the Wasatch Front counties have been below five percent. This is the longest period of low rates on record; a consequence of: (1) Utah’s housing shortage, (2) a modest shift in preferences from ownership to renting, (3) changing demographics, and (4) the high cost of homeownership. In 2018, vacancy rates were unchanged
in most markets with the exception of Utah County where they increased from 4.1 percent to 4.7 percent. Current vacancy rates are only a fraction of their peak levels during the Great Recession. In 2009, vacancies rates were as high as 9.0 percent in Weber County and 8.6 percent in Salt Lake County. In 2018, vacancy rate in Weber and Salt Lake counties were 2.8 percent and 3.9 percent respectively.
*vacancy rate for 2018 is mid-year estimate. Source: CBRE, 2018 First Half, Greater Salt Lake Area Multifamily Market Report.
3.9%
4.7%
3.8%
2.8%
0.0%
1.0%
2.0%
3.0%
4.0%
5.0%
6.0%
7.0%
8.0%
9.0%
10.0%
2007
2008
2009
2010
2011
2012
2013
2014
2015
2016
2017
2018
Salt Lake Utah Davis Weber
8.6%
7.0%
8.0%
9.0%
3.9% 4.1%
3.6%
3.1%
3.9%
4.7%
3.8%
2.8%
0.0%
1.0%
2.0%
3.0%
4.0%
5.0%
6.0%
7.0%
8.0%
9.0%
10.0%
Salt Lake Utah Davis Weber
2009 2017 2018 Mid-year
Ivory-Boyer Real Estate Center The Year in Charts Residential Real Estate Market 17

Kem C. Gardner Policy Institute I 411 East South Temple Street, Salt Lake City, Utah 84111 I 801-585-5618 I gardner.utah.edu
Partners in the Community The following individuals and entities help support the research mission of the Kem C. Gardner Policy Institute.
Legacy PartnersThe Gardner CompanyIntermountain HealthcareLarry H. & Gail Miller Family FoundationMountain America Credit UnionMitt and Ann RomneySalt Lake City CorporationSalt Lake CountyUniversity of Utah HealthUtah Governor’s Office of Economic Development
Zions Bank
Executive PartnersMark and Karen BouchardThe Boyer CompanyIvory HomesSalt Lake ChamberSorenson Impact Center
WCF Insurance
Sustaining PartnersClyde CompaniesDominion EnergyStaker Parson Companies
The Ivory-Boyer Real Estate Center partnered with the Kem C. Gardner Policy Institute to prepare this report. Both entities are located in the David Eccles School of Business. Together they seek to share data and analysis and train real estate professionals to support a vibrant housing, construction, and real estate industry in Utah. To learn more visit www.eccles.utah.edu or contact the Eccles School at 801-581-5588.
Ivory-Boyer Real Estate Center Advisory BoardDana BairdScott BatesRoger BoyerAndrew BybeePhil CookFlyn Dawson
Rocky DerrickJeff DukeFred Fairclough, Jr.Rob FetzerMarlise FisherJeff Gochnour
Clark IvoryBarb JohnsonRonda LandaBob MooreMichael MorrisShaun Nielson
Kip PaulWalt PlumbMike RoderickMichael W. SansomRick Woodbury
Kem C. Gardner Policy Institute Advisory BoardConveners
Michael O. LeavittMitt Romney
Board
Scott Anderson, Co-ChairGail Miller, Co-ChairDoug AndersonDeborah BayleCynthia A. BergRoger BoyerWilford ClydeSophia M. DiCaro
Cameron DiehlLisa EcclesSpencer P. EcclesMatt EyringKem C. GardnerChristian GardnerNatalie GochnourClark IvoryRon JibsonMike S. LeavittKimberly Gardner MartinDerek MillerAnn Millner
Sterling Nielsen Cristina OrtegaJason PerryTaylor RandallJill Remington LoveBrad RencherJosh RomneyCharles W. SorensonJames Lee SorensonVicki VarelaRuth V. WatkinsTed Wilson
Ex Officio (invited)
Governor Gary HerbertSpeaker Brad WilsonSenate President
Stuart AdamsRepresentative Brian KingSenator Karen MayneMayor of Salt Lake CountyMayor Jackie Biskupski