The Y Chromosome Pool of Jews as Part of the Genetic Landscape of the Middle...
18
Am. J. Hum. Genet. 69:1095–1112, 2001 1095 The Y Chromosome Pool of Jews as Part of the Genetic Landscape of the Middle East Almut Nebel, 1 Dvora Filon, 2 Bernd Brinkmann, 4 Partha P. Majumder, 5 Marina Faerman, 3 and Ariella Oppenheim 1 1 Department of Hematology, Hebrew University–Hadassah Medical School, 2 Hadassah University Hospital, and 3 Laboratory of Biological Anthropology and Ancient DNA, Hebrew University–Hadassah School of Dental Medicine, Jerusalem; 4 Institut fu ¨ r Rechtsmedizin, Westfa ¨lische Wilhelms-Universita ¨t, Mu ¨nster, Germany; and 5 Anthropology and Human Genetics Unit, Indian Statistical Institute, Calcutta A sample of 526 Y chromosomes representing six Middle Eastern populations (Ashkenazi, Sephardic, and Kurdish Jews from Israel; Muslim Kurds; Muslim Arabs from Israel and the Palestinian Authority Area; and Bedouin from the Negev) was analyzed for 13 binary polymorphisms and six microsatellite loci. The investigation of the genetic relationship among three Jewish communities revealed that Kurdish and Sephardic Jews were indistinguishable from one another, whereas both differed slightly, yet significantly, from Ashkenazi Jews. The differences among Ashkenazim may be a result of low-level gene flow from European populations and/or genetic drift during isolation. Admixture between Kurdish Jews and their former Muslim host population in Kurdistan appeared to be negligible. In comparison with data available from other relevant populations in the region, Jews were found to be more closely related to groups in the north of the Fertile Crescent (Kurds, Turks, and Armenians) than to their Arab neighbors. The two haplogroups Eu 9 and Eu 10 constitute a major part of the Y chromosome pool in the analyzed sample. Our data suggest that Eu 9 originated in the northern part, and Eu 10 in the southern part of the Fertile Crescent. Genetic dating yielded estimates of the expansion of both haplogroups that cover the Neolithic period in the region. Palestinian Arabs and Bedouin differed from the other Middle Eastern populations studied here, mainly in specific high-frequency Eu 10 haplotypes not found in the non-Arab groups. These chromosomes might have been introduced through migrations from the Arabian Peninsula during the last two millennia. The present study contributes to the elucidation of the complex demographic history that shaped the present-day genetic landscape in the region. Introduction The Middle East played a crucial role in early human history. Its strategic location at the crossroads of three continents facilitated the movements of peoples and the spread of novel technologies and ideas. At the beginning of the Neolithic period (∼10,500 years ago), the Fertile Crescent of the Middle East was one of the few centers in which the transition from hunting-gathering to per- manent settlement and farming took place (Bar-Yosef 1995). Previous genetic studies suggested that demic dif- fusion of Neolithic farmers, rather than cultural trans- mission, was responsible for the dispersal of domesti- cates and technological innovations from the Middle East to Europe, North Africa, and southwest Asia (Cav- alli-Sforza et al. 1994; Richards et al. 2000; Semino et al. 2000; Quintana-Murci et al. 2001). Received June 18, 2001; accepted for publication August 27, 2001; electronically published September 25, 2001. Address for correspondence and reprints: Dr. Ariella Oppenheim, Department of Hematology, Hebrew University–Hadassah Medical School, Jerusalem 91120, Israel. E-mail: [email protected]. 2001 by The American Society of Human Genetics. All rights reserved. 0002-9297/2001/6905-0018$02.00 Polymorphisms on the nonrecombining part of the Y chromosome have become powerful tools for the in- vestigation of genetic diversity in males, complementing the information from the maternally inherited mtDNA. Y chromosome variants were shown to be much more localized geographically than mtDNA or autosomal polymorphisms (Seielstad et al. 1998). The study of population history has gained enormous momentum with the recent introduction of a large number of new binary or biallelic Y chromosome polymorphic markers (Underhill et al. 2000). The typing of these markers in a set of worldwide populations led to a comprehensive and detailed Y chromosome phylogeny. When microsatellites are analyzed within a haplo- group classified by binary polymorphisms, a measure of diversity is added that allows evaluation of inter- population affinities at fine resolution (Hurles et al. 1999; Helgason et al. 2000; Nebel et al. 2000; Thomas et al. 2000; Kayser et al. 2001). In addition, microsat- ellite variation provides an estimation of time depth and, hence, facilitates the investigation of the origin and spread of haplogroups and permits placement of the genealogical projections in the context of known or sur- mised historical events (Zerjal et al. 1997; Hurles et al.
Transcript of The Y Chromosome Pool of Jews as Part of the Genetic Landscape of the Middle...

Am. J. Hum. Genet. 69:1095–1112, 2001
1095
The Y Chromosome Pool of Jews as Part of the Genetic Landscapeof the Middle EastAlmut Nebel,1 Dvora Filon,2 Bernd Brinkmann,4 Partha P. Majumder,5 Marina Faerman,3and Ariella Oppenheim1
1Department of Hematology, Hebrew University–Hadassah Medical School, 2Hadassah University Hospital, and 3Laboratory of BiologicalAnthropology and Ancient DNA, Hebrew University–Hadassah School of Dental Medicine, Jerusalem; 4Institut fur Rechtsmedizin,Westfalische Wilhelms-Universitat, Munster, Germany; and 5Anthropology and Human Genetics Unit, Indian Statistical Institute, Calcutta
A sample of 526 Y chromosomes representing six Middle Eastern populations (Ashkenazi, Sephardic, and KurdishJews from Israel; Muslim Kurds; Muslim Arabs from Israel and the Palestinian Authority Area; and Bedouin fromthe Negev) was analyzed for 13 binary polymorphisms and six microsatellite loci. The investigation of the geneticrelationship among three Jewish communities revealed that Kurdish and Sephardic Jews were indistinguishablefrom one another, whereas both differed slightly, yet significantly, from Ashkenazi Jews. The differences amongAshkenazim may be a result of low-level gene flow from European populations and/or genetic drift during isolation.Admixture between Kurdish Jews and their former Muslim host population in Kurdistan appeared to be negligible.In comparison with data available from other relevant populations in the region, Jews were found to be moreclosely related to groups in the north of the Fertile Crescent (Kurds, Turks, and Armenians) than to their Arabneighbors. The two haplogroups Eu 9 and Eu 10 constitute a major part of the Y chromosome pool in the analyzedsample. Our data suggest that Eu 9 originated in the northern part, and Eu 10 in the southern part of the FertileCrescent. Genetic dating yielded estimates of the expansion of both haplogroups that cover the Neolithic periodin the region. Palestinian Arabs and Bedouin differed from the other Middle Eastern populations studied here,mainly in specific high-frequency Eu 10 haplotypes not found in the non-Arab groups. These chromosomes mighthave been introduced through migrations from the Arabian Peninsula during the last two millennia. The presentstudy contributes to the elucidation of the complex demographic history that shaped the present-day geneticlandscape in the region.
Introduction
The Middle East played a crucial role in early humanhistory. Its strategic location at the crossroads of threecontinents facilitated the movements of peoples and thespread of novel technologies and ideas. At the beginningof the Neolithic period (∼10,500 years ago), the FertileCrescent of the Middle East was one of the few centersin which the transition from hunting-gathering to per-manent settlement and farming took place (Bar-Yosef1995). Previous genetic studies suggested that demic dif-fusion of Neolithic farmers, rather than cultural trans-mission, was responsible for the dispersal of domesti-cates and technological innovations from the MiddleEast to Europe, North Africa, and southwest Asia (Cav-alli-Sforza et al. 1994; Richards et al. 2000; Semino etal. 2000; Quintana-Murci et al. 2001).
Received June 18, 2001; accepted for publication August 27, 2001;electronically published September 25, 2001.
Address for correspondence and reprints: Dr. Ariella Oppenheim,Department of Hematology, Hebrew University–Hadassah MedicalSchool, Jerusalem 91120, Israel. E-mail: [email protected].
� 2001 by The American Society of Human Genetics. All rights reserved.0002-9297/2001/6905-0018$02.00
Polymorphisms on the nonrecombining part of the Ychromosome have become powerful tools for the in-vestigation of genetic diversity in males, complementingthe information from the maternally inherited mtDNA.Y chromosome variants were shown to be much morelocalized geographically than mtDNA or autosomalpolymorphisms (Seielstad et al. 1998). The study ofpopulation history has gained enormous momentumwith the recent introduction of a large number of newbinary or biallelic Y chromosome polymorphic markers(Underhill et al. 2000). The typing of these markers ina set of worldwide populations led to a comprehensiveand detailed Y chromosome phylogeny.
When microsatellites are analyzed within a haplo-group classified by binary polymorphisms, a measureof diversity is added that allows evaluation of inter-population affinities at fine resolution (Hurles et al.1999; Helgason et al. 2000; Nebel et al. 2000; Thomaset al. 2000; Kayser et al. 2001). In addition, microsat-ellite variation provides an estimation of time depthand, hence, facilitates the investigation of the origin andspread of haplogroups and permits placement of thegenealogical projections in the context of known or sur-mised historical events (Zerjal et al. 1997; Hurles et al.

1096 Am. J. Hum. Genet. 69:1095–1112, 2001
Table 1
Y Chromosome Haplogroup Distribution
NUMBERa DEFINITIONb
HAPLOGROUP FREQUENCIES IN
MuslimKurds
(n p 95)
KurdishJews
(n p 99)
SephardicJews
(n p 78)
AshkenaziJews
(n p 79)
PalestinianArabs
(n p 143)Bedouin(n p 32)
1 NTGCATGGG�AG .168 .202 .295 .114 .084 02 NCGCATCGG�AG NT .168 .061 .115 .063 .063 .0633 (Eu 19) NTGCATGGG�AA .116 .040 .039 .127 .014 .0947 NCGCATCCG�AA 0 0 0 0 .014 09 (Eu 9) NCGCATCGG�AG PG .284 .152 .154 .240 .168 .0319 (Eu 10) NCGCATCGG�AG PT .116 .222 .128 .190 .384 .62521 PCACATCGG�AG .074 .121 .192 .228 .203 .18726 NCGCATGGG�AG .042 .192 .077 .038 .070 028 NCGCATGGG�GG .032 .010 0 0 0 0
a Designation is as presented by Rosser et al. (2000) and Semino et al. (2000).b Haplogroups are defined by the allele status at 13 binary markers in the following order: YAP, 92r7, SRY4064,
SRY�465, sY81, Tat, M9, M13, M17, M20, SRY10831, p12f2 and M172. P p YAP insert/p12f2 deletion present(8-kb allele); N p no YAP insert/p12f2 deletion (10-kb allele); G� p guanine present; G� p guanine deleted.
1998; Quintana-Murci et al. 2001). Particular high-fre-quency modal haplotypes have been shown to be as-sociated with genealogies defined by religious status(Thomas et al. 1998) or surnames that are transmittedalong male lines (Sykes and Irven 2000). The Cohenmodal haplotype (CMH) has been described as the sig-nature haplotype of the paternally inherited Jewishpriesthood (Thomas et al. 1998).
Previous investigations based on binary Y chromo-some polymorphisms suggested a common origin forJewish and non-Jewish populations living in the MiddleEast (Santachiara-Benerecetti et al. 1993; Hammer etal. 2000). Our recent study of high-resolution micro-satellite haplotypes demonstrated that a substantial por-tion of Y chromosomes of Jews (70%) and of Palesti-nian Muslim Arabs (82%) belonged to the samechromosome pool (Nebel et al. 2000). Of those Pales-tinian chromosomes, approximately one-third formeda group of very closely related haplotypes that were onlyrarely found in Jews. Altogether, the findings indicateda remarkable degree of genetic continuity in both Jewsand Arabs, despite their long separation and the widegeographic dispersal of Jews.
In the present study, we examined the genetic rela-tionship among three Jewish communities, the Ashke-nazi, Sephardic, and Kurdish Jews, who were geograph-ically separated from each other for many centuries. Bycomparing data from these groups with data from otherrelevant populations, we looked for information abouthow the Y chromosomes of Jews fit into the geneticlandscape of the Middle East.
Material and Methods
Study PopulationsAshkenazi Jews.—DNA samples were extracted from
mouth swabs collected from 79 paternally unrelated,
otherwise randomly selected, self-designated Ashkena-zim in Israel. The Ashkenazi subjects’ paternal familiescame from various parts of Europe, spanning areas fromGermany, in the west, to Russia, in the east.
Sephardic Jews.—DNA samples were extracted frommouth swabs collected from 78 paternally unrelated,otherwise randomly selected, self-designated SephardicJews in Israel. Here the term “Sephardic Jews” refers toJews from Mediterranean and Middle Eastern countries.Our sample consisted of two groups. The first, desig-nated the “North African sample” (55 subjects), com-prised 37 individuals from North African countries (pri-marily Morocco), 13 from Turkey, 3 from the IberianPeninsula, and 2 from Bulgaria. The second group wasdesignated the “Iraqi sample” (23 subjects), and it con-tained 20 Jews from Iraq and 3 from Syria.
Kurdish Jews.—Y chromosomes of 99 Kurdish Jewsfrom all over Israel, unrelated at the paternal great-grandfather level, were analyzed. Most of the DNA sam-ples (79) were anonymously obtained from the DNAcollection established in our laboratory for the study ofhematological disorders. The remainder (20 samples)were collected, by mouth swab, from randomly selectedvolunteers of self-identified Kurdish Jewish descent. Thepaternal ancestors of the majority of the subjects hadlived in northern Iraq.
Muslim Kurds.—Ninety-five DNA samples of MuslimKurds were obtained, as described elsewhere (Brink-mann et al. 1999). The large majority of the subjectsoriginated from northern Iraq.
Palestinian Arabs.—Data on 17 Y chromosome poly-morphisms of 143 Muslim Arabs residing in Israel andthe Palestinian Authority Area (designated in other re-ports as “Israeli & Palestinian Arabs [I & P Arabs]”)were as reported elsewhere (Nebel et al. 2000, 2001).

Nebel et al.: Y Chromosomes of Jews and Middle Easterners 1097
Figure 1 Network of Y chromosome haplogroups (Hgs) based on the 13 binary polymorphisms analyzed. Unblackened circles representhaplogroups observed in the six Middle Eastern populations. The area of each circle is proportional to the frequency of the haplogroup in thetotal sample. Small blackened circles denote unobserved haplogroups. Arrows indicate the direction of the defining mutation. The haplogroupclassification follows Rosser et al. (2000), except for the “Eu” designations, which are classified according to Semino et al. (2000). Hg 7 is theroot. Eu 10 and Eu 9 are sublineages of Hg 9 that are distinguished by the mutation at M172. Hg 3 and Eu 19 appear phylogeneticallyequivalent in our sample. Hg 3 is defined by the reverse mutation at SRY10831 and Eu 19 by the polymorphism at M17.
The same specimens were typed, in the present study,for two additional markers (p12f2 and M172).
Bedouin.—Anonymous DNA samples of 30 male Bed-ouin from the Negev were obtained from the NationalLaboratory for the Genetics of Israeli Populations, TelAviv University. Two additional samples were from ourDNA depository.
Other populations.—Data on 122 Russians, 112Poles, 41 Byelorussians, 167 Turks, 89 Armenians, 126Spaniards, 385 Portuguese, and 129 North Africans(Berbers and Arabs described by Rosser et al. [2000]),along with data on 89 Syrians, 31 Jordanians, and 30Lebanese (R. Villems and S. Rootsi, unpublished data)were used for comparison at the haplogroup level.
The volunteers gave written informed consent beforesamples were collected. The study was approved by theHebrew University committee for ethics in research.
Typing of Y Chromosome DNA Polymorphisms
DNA samples were typed for 11 binary Y chromo-some polymorphisms (YAP [DYS287], 92r7, SRY4064,SRY�465, sY81 [DYS271], Tat, M9, M13, M17, M20,and SRY10831) and for 6 microsatellite loci (DYS19,DYS388, DYS390, DYS391, DYS392, and DYS393), as
described by Thomas et al. (1999). Haplogroup defini-tions, based on the allelic state at the binary markers,are presented in table 1.
Chromosomes classified on the basis of analysis of theabove 11 binary polymorphisms as belonging to hap-logroup 2� (Hg 2�) were further analyzed for p12f2[DYS11] and M172, in a duplex PCR assay. The markerp12f2 distinguishes Hg 9 from Hg 2 (Bosch et al. 1999;Rosser et al. 2000), and M172 (Underhill et al. 2000)subdivides Hg 9 into the two lineages Eu 9 and Eu 10(Semino et al. 2000). Typing of p12f2 was based on theabsence (Hg 9) or presence (Hg 2) of an 88-bp PCRproduct (Rosser et al. 2000). As an internal control, a148-bp product encompassing the M172 polymorphismwas coamplified using the primers M172-F 5′-atcccccaa-acccattttgatgcat-3′ and M172-R 5′-ggatccatcttcactcaatg-ttg-3′. PCR amplification was performed in 10 mM Tris-HCl (pH 8.3), 50 mM KCl, 2.5 mM MgCl2, 0.2 mMof each dNTP, 0.2 mM of each p12f2 primer, 0.3 mM ofeach M172 primer, and 0.2 U of AmpliTaq Gold (Perkin-Elmer, Roche Molecular Systems). Cycling conditionswere as follows: initial denaturation and AmpliTaq Goldactivation at 94�C for 10 min; 30–35 cycles of dena-turation at 94�C for 30 s, annealing at 58�C for 45 s,

1098 Am. J. Hum. Genet. 69:1095–1112, 2001
Table 2
Analysis of Genetic Differentiation: Pairwise FST Values between Populations
PopulationMuslimKurds
KurdishJews
SephardicJews
AshkenaziJews
PalestinianArabs
Kurdish Jews .032a … … … …Sephardic Jews .023b .012c … … …Ashkenazi Jews .016b .024b .021b … …Palestinian Arabs .069a .030d .059a .026d …Bedouin .183a .129a .178a .125a .043b
NOTE.—Analysis is based on frequencies of haplogroups defined by 13 binaryY chromosome polymorphisms.
a .P ! .001b ..05 1 P 1 .005c .P 1 .05d ..005 1 P 1 .001
Figure 2 Unrooted NJ tree depicting relationships among the six Middle Eastern populations, based on DA distances. The distance matrixis calculated using frequencies of haplogroups defined by 13 binary Y chromosome polymorphisms.
and extension at 72�C for 45 s. The final cycle endedwith an additional extension of 10 min at 72�C. A sub-sequent restriction digest of the PCR products withNlaIII (New England Biolabs) allowed us to differentiatebetween the M172 T allele (not cut) and the G allele(cut into a 122-bp and a 26-bp fragment). NlaIII diges-tion of p12f2 resulted in a 57-bp and a 31-bp fragmentin all the samples. The digestion products were visualizedon 3.5% NuSieve (FMC Bioproducts) agarose gels.
Statistical and Genealogical Analyses
Haplotype diversity (h) and its sampling variance (v)were estimated as described by Nei (1987). The rela-tionships among populations were studied by construct-ing unrooted neighbor-joining (NJ) trees that were basedon the genetic distance (DA) (Nei 1987), using Y chro-mosome haplogroup frequencies. The software packageDISPAN was used to calculate the DA matrix and phy-logenetic analyses. The software package Arlequin (ver-sion 1.1) was used to compute FST values and to performpopulation differentiation tests (Raymond and Rousset1995) and analyses of molecular variance (AMOVA)
(Excoffier et al. 1992). At the haplogroup level, AMOVAwas applied to estimate variance components and F sta-tistics, by taking into account both frequency and mo-lecular content of haplogroups at different levels of hi-erarchical subdivision (among population groups,among populations within groups, and within popula-tions). For this purpose, we generated a distance matrixthat was based on the number of mutation steps betweenall haplogroup pairs and on the known Y chromosomehaplogroup genealogy (fig. 1). At the microsatellite hap-lotype level, FST values between population pairs werecalculated using the sum of squared allele-size differences(RST) as a measure of haplotype distance (Michalakisand Excoffier 1996). Microsat (version 1.5d) was ap-plied to compute the genetic distance measure “averagesquare distance” (ASD) (Goldstein et al. 1995). NJ hap-lotype trees on ASD were drawn with the PhylogenyInference Package PHYLIP (version 3.5c).
Genealogical relationships among microsatellite hap-lotypes within haplogroups Eu 9 and Eu 10 were re-constructed using the program Network 2.0d (Bandeltet al. 1995; Bandelt et al. 1999). To adequately deal

Nebel et al.: Y Chromosomes of Jews and Middle Easterners 1099
Figure 3 Simplified network relating the five modal haplotypes found in the six Middle Eastern populations. The haplotypes are definedby alleles at six microsatellite loci in the order DYS19, DYS388, DYS390, DYS391, DYS392, and DYS393. Lines between the haplotypesrepresent single-microsatellite mutation steps. The frequency of the modal haplotypes in each population is shown. AJ p Ashkenazi Jews; SJp Sephardic Jews; KJ p Kurdish Jews; PA p Palestinian Arabs; B p Bedouin; MK p Muslim Kurds; MH p modal haplotype; and CMH pCohen modal haplotype. Note that the CMH and the MH of the Muslim Kurds are only one microsatellite mutation step apart but occur ondifferent haplogroup backgrounds (Eu 10 and Eu 9, respectively).
Table 3
Proportions of Haplotypes (ht) and Chromosomes (ch) Shared by PopulationPairs
PopulationMuslimKurds
KurdishJews
SephardicJews
AshkenaziJews
PalestinianArabs
Kurdish Jewsht .213 … … … …ch .314
Sephardic Jewsht .208 .296 … … …ch .289 .390
Ashkenazi Jewsht .263 .214 .296 … …ch .345 .292 .382
Palestinian Arabsht .133 .142 .153 .198 …ch .160 .198 .167 .225
Bedouinht .024 .027 .053 .082 .157ch .016 .017 .055 .099 .217
with the fast-evolving microsatellite loci, the reduced me-dian (RM) ( ) and median-joining (MJ) ( ) al-r p 2 e p 0gorithms were applied sequentially (Forster et al. 2000).Moreover, a weighting scheme was used to compensatefor the widely differing mutation rates at the six micro-satellites. On the basis of locus diversity, the following
weights were assigned: DYS388 and DYS390 p 1,DYS391 p 2, DYS393 p 3, and DYS19 and DYS392p 4. According to Forster et al. (2000), length variationof different segments within one compound microsat-ellite locus can lead to artifacts in the network construc-tion. Therefore, the complex DYS390 repeat region was

1100 Am. J. Hum. Genet. 69:1095–1112, 2001
Table 4
Genetic Variance within and between Population Groups
POPULATION
JEWSa
TRANS-CAUCASIANSb ARABSc
EASTERN
EUROPEANSd
F P F P F P F P
Jews .011 .092 … … … … … …Transcaucasians .006 .089 .000 .411 … … … …Arabs .062 !.001 .079 !.001 .021 .018 … …Eastern Europeans .215 !.001 .222 !.001 .396 !.001 .030 .006
NOTE.—The analysis is based on data of haplogroups defined by nine Y chromosomebinary polymorphisms (without M13, M17, M20, and M172). Variance component iscalculated within (FST, diagonal) and between (FCT, below diagonal) population groups.
a Ashkenazi, Sephardic, and Kurdish Jews.b Palestinians, Jordanians, Syrians, Lebanese, and Bedouin.c Muslim Kurds, Armenians, and Turks.d Russians, Byelorussians, and Poles.
sequenced in two Ashkenazi and three Sephardic Jews.In all samples, only one component, the n segment, wasfound to be variable.
The start of rapid expansion of Eu 9 and Eu 10chromosomes within the populations studied here wasestimated by use of the mean variance of microsatelliterepeats (Slatkin 1995; Kittles et al. 1998) averagedacross the six loci analyzed. The generation time wasset at 25 years (as a mean of the commonly used es-timates) and at 35 years (as suggested by Tremblayand Vezina [2000]). The average microsatellite-mu-tation rate for the six loci was set at 1.8 # 10�3 (95%confidence interval [CI] 9.8 # 10�4 to 3.1 # 10�3)(Quintana-Murci et al. 2001).
Results
Genetic Relationships among the Six Middle EasternPopulations
The genetic affinity among the six populations—Ashkenazi, Sephardic and Kurdish Jews, Muslim Kurds,Palestinian Arabs, and Bedouin—was first assessed atthe level of the 13 binary polymorphisms. The 526 Ychromosomes were classified into nine haplogroups (ta-ble 1). The genealogical relationship of the haplogroupsis shown in figure 1. In Sephardic Jewish communitiesfrom both North Africa and Iraq, the haplogroup dis-tribution was very similar (Population DifferentiationTest; ). Therefore, in subsequent analyses, the twoP 1 .05groups were pooled as Sephardic Jews. The pairwise FST
values were statistically significant for all populationpairs, except for Kurdish and Sephardic Jews (table 2).Ashkenazi Jews differed slightly from the other two Jew-ish communities. Kurdish and Sephardic Jews also clus-tered together on an unrooted NJ tree (fig. 2). Interest-ingly, the position of the Muslim Kurds on this tree isbetween Kurdish and Sephardic Jews on the one hand
and Ashkenazim on the other. The most-distant groupfrom the four non-Arab populations were the Bedouin.
We further examined the relationship among the pop-ulations by incorporating microsatellites in the construc-tion of haplotypes. The six microsatellite loci defined250 different haplotypes within the nine haplogroups(Appendix). Haplotype diversity was high ( ) inh 1 .970all populations, except for the Bedouin, who exhibiteda low value ( ) (Appendix). Microsatellite hap-h p .923lotype variance among the populations was assessed byuse of AMOVA in a pairwise manner. The pattern ob-tained was similar to that observed at the haplogrouplevel (not shown). Notably, we found that the variancebetween the North African and Iraqi Sephardic sampleswas insignificant ( ; ), thereby justify-F p .013 P 1 .05ST
ing the pooling of the two data sets.The relationship of the five modal haplotypes that
were found in the six populations is presented in figure3. The most-frequent haplotype in all three Jewishgroups (the CMH [haplotype 159 in the Appendix]) seg-regated on a Eu 10 background, together with the threemodal haplotypes in Palestinians and Bedouin (haplo-types 144, 151, and 166). The dominant haplotype ofthe Muslim Kurds (haplotype 114) was only one micro-satellite-mutation step apart from the CMH and the mo-dal haplotype of the Bedouin, but it belonged to hap-logroup Eu 9. The three modal haplotypes in thePalestinians and Bedouin were entirely restricted to thetwo Arab populations. On the other hand, chromosomeswith the modal haplotypes of the Jews and of the MuslimKurds were observed in all the populations except theBedouin. The three Jewish communities had many ad-ditional haplotypes in common with Muslim Kurds (ta-ble 3). They shared more haplotypes and chromosomeswith Muslim Kurds than with either Palestinians orBedouin.
Nebel et al.: Y Chromosomes of Jews and Middle Easterners 1101
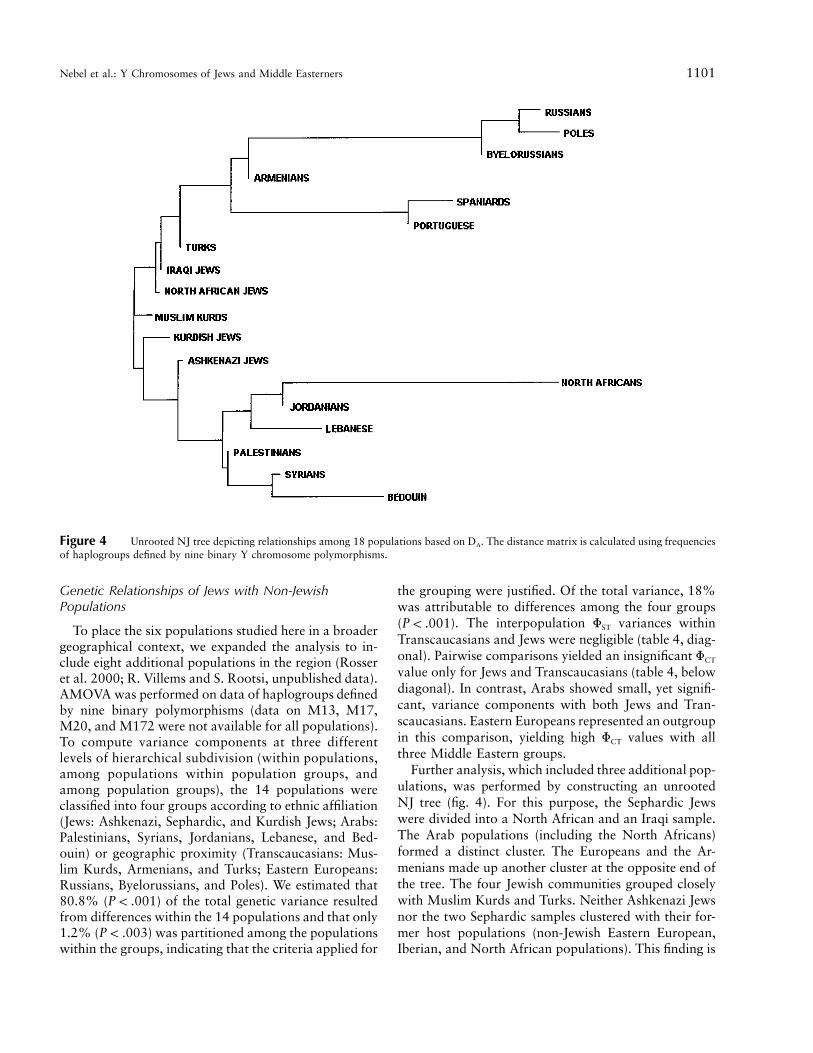
Figure 4 Unrooted NJ tree depicting relationships among 18 populations based on DA. The distance matrix is calculated using frequenciesof haplogroups defined by nine binary Y chromosome polymorphisms.
Genetic Relationships of Jews with Non-JewishPopulations
To place the six populations studied here in a broadergeographical context, we expanded the analysis to in-clude eight additional populations in the region (Rosseret al. 2000; R. Villems and S. Rootsi, unpublished data).AMOVA was performed on data of haplogroups definedby nine binary polymorphisms (data on M13, M17,M20, and M172 were not available for all populations).To compute variance components at three differentlevels of hierarchical subdivision (within populations,among populations within population groups, andamong population groups), the 14 populations wereclassified into four groups according to ethnic affiliation(Jews: Ashkenazi, Sephardic, and Kurdish Jews; Arabs:Palestinians, Syrians, Jordanians, Lebanese, and Bed-ouin) or geographic proximity (Transcaucasians: Mus-lim Kurds, Armenians, and Turks; Eastern Europeans:Russians, Byelorussians, and Poles). We estimated that80.8% ( ) of the total genetic variance resultedP ! .001from differences within the 14 populations and that only1.2% ( ) was partitioned among the populationsP ! .003within the groups, indicating that the criteria applied for
the grouping were justified. Of the total variance, 18%was attributable to differences among the four groups( ). The interpopulation FST variances withinP ! .001Transcaucasians and Jews were negligible (table 4, diag-onal). Pairwise comparisons yielded an insignificant FCT
value only for Jews and Transcaucasians (table 4, belowdiagonal). In contrast, Arabs showed small, yet signifi-cant, variance components with both Jews and Tran-scaucasians. Eastern Europeans represented an outgroupin this comparison, yielding high FCT values with allthree Middle Eastern groups.
Further analysis, which included three additional pop-ulations, was performed by constructing an unrootedNJ tree (fig. 4). For this purpose, the Sephardic Jewswere divided into a North African and an Iraqi sample.The Arab populations (including the North Africans)formed a distinct cluster. The Europeans and the Ar-menians made up another cluster at the opposite end ofthe tree. The four Jewish communities grouped closelywith Muslim Kurds and Turks. Neither Ashkenazi Jewsnor the two Sephardic samples clustered with their for-mer host populations (non-Jewish Eastern European,Iberian, and North African populations). This finding is
1102 Am. J. Hum. Genet. 69:1095–1112, 2001
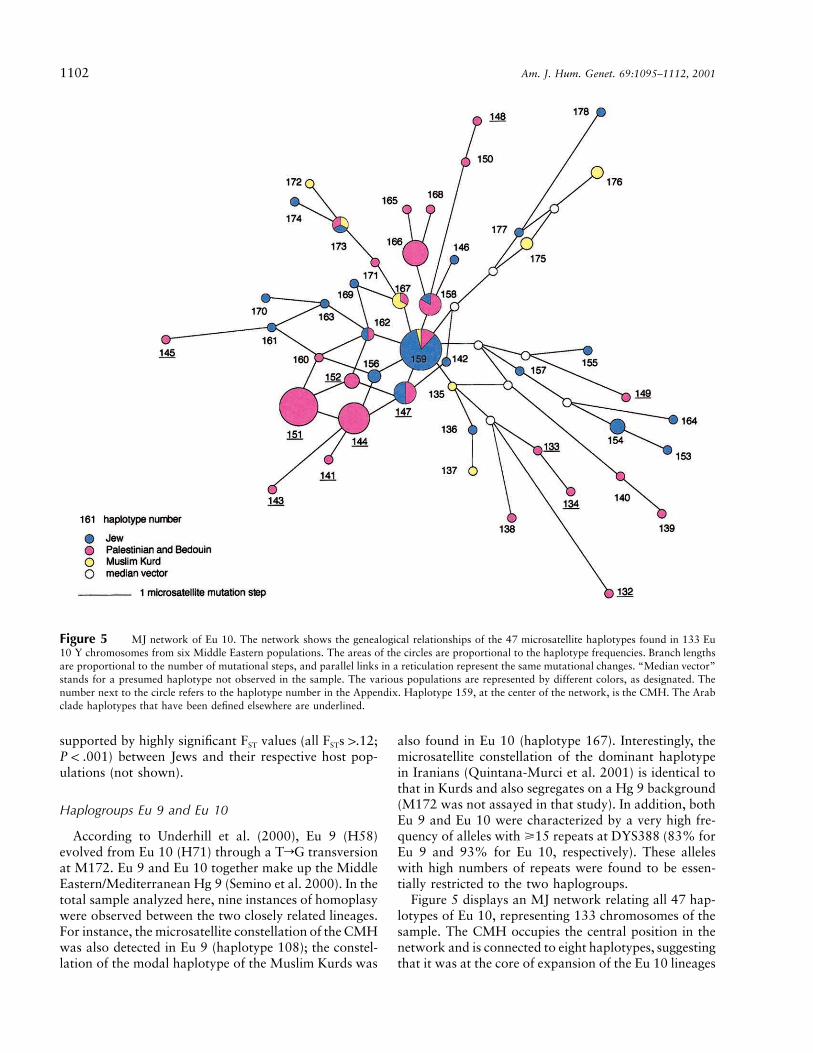
Figure 5 MJ network of Eu 10. The network shows the genealogical relationships of the 47 microsatellite haplotypes found in 133 Eu10 Y chromosomes from six Middle Eastern populations. The areas of the circles are proportional to the haplotype frequencies. Branch lengthsare proportional to the number of mutational steps, and parallel links in a reticulation represent the same mutational changes. “Median vector”stands for a presumed haplotype not observed in the sample. The various populations are represented by different colors, as designated. Thenumber next to the circle refers to the haplotype number in the Appendix. Haplotype 159, at the center of the network, is the CMH. The Arabclade haplotypes that have been defined elsewhere are underlined.
supported by highly significant FST values (all FSTs 1.12;) between Jews and their respective host pop-P ! .001
ulations (not shown).
Haplogroups Eu 9 and Eu 10
According to Underhill et al. (2000), Eu 9 (H58)evolved from Eu 10 (H71) through a TrG transversionat M172. Eu 9 and Eu 10 together make up the MiddleEastern/Mediterranean Hg 9 (Semino et al. 2000). In thetotal sample analyzed here, nine instances of homoplasywere observed between the two closely related lineages.For instance, the microsatellite constellation of the CMHwas also detected in Eu 9 (haplotype 108); the constel-lation of the modal haplotype of the Muslim Kurds was
also found in Eu 10 (haplotype 167). Interestingly, themicrosatellite constellation of the dominant haplotypein Iranians (Quintana-Murci et al. 2001) is identical tothat in Kurds and also segregates on a Hg 9 background(M172 was not assayed in that study). In addition, bothEu 9 and Eu 10 were characterized by a very high fre-quency of alleles with �15 repeats at DYS388 (83% forEu 9 and 93% for Eu 10, respectively). These alleleswith high numbers of repeats were found to be essen-tially restricted to the two haplogroups.
Figure 5 displays an MJ network relating all 47 hap-lotypes of Eu 10, representing 133 chromosomes of thesample. The CMH occupies the central position in thenetwork and is connected to eight haplotypes, suggestingthat it was at the core of expansion of the Eu 10 lineages

Nebel et al.: Y Chromosomes of Jews and Middle Easterners 1103
in the populations studied. The two modal haplotypesin Palestinian Arabs, on the other hand, lie at the pe-riphery of the network and have fewer links to neigh-bors. In the MJ network of Eu 9, the modal haplotypeof the Muslim Kurds (haplotype 114) is in the centerwith nine links radiating from it (not shown).
Eu 10 was the most frequent haplogroup amongPalestinian Arabs and Bedouin (table 1), with a low hap-lotype diversity ( ) in both populations. Forty-h p .82two percent of the haplotypes and 47% of the chro-mosomes in Eu 10 were only observed in the two Arabpopulations. Palestinians had ∼42% of their Eu 10 chro-mosomes in common with Bedouin but had only 11%in common with the other four populations. The com-monalities with the other four populations resulted fromthe sharing of low-frequency haplotypes. In contrast, inall the other haplogroups (except Hg 7, which was ob-served in only two Palestinian individuals in the pre-sent study), Palestinians shared 20%–46% of their chro-mosomes with the four non-Arab populations. Thus, thegenetic distinctiveness of the Palestinian Arabs is mainlyseen in the presence of specific high-frequency Eu 10haplotypes not found in non-Arab groups.
Elsewhere, 12 haplotypes of the Palestinian Arabs,including their two modal haplotypes, were reported toform a clade on an NJ tree (designated as “Arab clade”),with a moderate bootstrap value (Nebel et al. 2000).The tree was constructed with haplotypes of Arabs,Jews, and Welsh that belonged to a haplogroup definedby only six binary markers. It actually represented acompound of the six haplogroups Hg 2, Hg 7, Hg 26,Hg 28, Eu 9, and Eu 10. In the present study, the Arabclade haplotypes were all found to be part of Eu 10,confirming their genetic clustering. However, as shownin figure 5, the Arab clade haplotypes are dispersedthroughout the Eu 10 network, indicating that they donot represent a separate genealogical lineage but are anintegral part of this haplogroup. On an NJ tree of Eu10 haplotypes, nine of these haplotypes grouped in twoneighboring branches but without any bootstrap sup-port (not shown).
We have performed genetic dating on the basis of mi-crosatellite variation (Slatkin 1995; Kittles et al. 1998).For a generation time of 25 years, the estimate for thestart of the expansion of Eu 9 was 7,038 years ago (95%CI 12,900–4,100 years ago), and that of Eu 10 was6,426 years ago (95% CI 11,800–3,700 years ago). Theexpansion of Hg 9, which includes both Eu 9 and Eu10, was dated to 7,492 years ago (95% CI 13,760–4,350years ago). For a generation time of 35 years, the datefor Eu 9 was 9,854 years ago (95% CI 18,095–5,705years ago), and the date for Eu 10 was 8,997 years ago(95% CI 16,520–5,215 years ago). The expansion ofHg 9 was estimated to have begun 10,488 years ago(95% CI 19,265–6,090 years ago).
Discussion
Genetic Relationships among Jewish Communities
It is believed that the majority of contemporaryJews descended from the ancient Israelites that hadlived in the historic land of Israel until ∼2000 yearsago. Many of the Jewish diaspora communities wereseparated from each other for hundreds of years.Therefore, some divergence due to genetic drift and/oradmixture could be expected. However, although Ash-kenazi Jews were found to differ slightly from Sephardicand Kurdish Jews, it is noteworthy that there is, overall,a high degree of genetic affinity among the three Jewishcommunities. Moreover, neither Ashkenazi nor Sephar-dic Jews cluster adjacent to their former host popula-tions, a finding that argues against substantial admixtureof males. These findings are in accordance with thosedescribed by Hammer et al. (2000).
Ashkenazi Jews.—Ashkenazi Jews consolidated into adistinct ethnicity in Germany during the Middle Agesand spread eastwards to Poland and Russia in the 13thcentury (Ben-Sasson 1976). Previous studies of Y chro-mosome polymorphisms reported a small European con-tribution to the Ashkenazi paternal gene pool (Santa-chiara-Benerecetti et al. 1993; Hammer et al. 2000). Inour sample, this low-level gene flow may be reflected inthe Eu 19 chromosomes, which are found at elevatedfrequency (12.7%) in Ashkenazi Jews and which are veryfrequent in Eastern Europeans (54%–60%; Semino etal. 2000). Alternatively, it is attractive to hypothesizethat Ashkenazim with Eu 19 chromosomes representdescendents of the Khazars, originally a Turkic tribefrom Central Asia, who settled in southern Russia andeastern Ukraine and converted en masse to Judaism inthe ninth century of the present era, as described byYehuda Ha-Levi in 1140 A.D. (Dunlop 1954).
Kurdish Jews.—The Jews of Kurdistan lived—untiltheir immigration to Israel in the early 1950s—as aclosed ethnic isolate, mostly in northern Iraq and Iranand in eastern Turkey. According to an old tradition,the Jews of Kurdistan are descendents of the Ten Tribesfrom the time of the Assyrian exile in 723 B.C. (Roth1972). Genetically, Kurdish Jews are not closer to Mus-lim Kurds than are Sephardim or Ashkenazim, suggest-ing that reciprocal male gene flow between Jews in Kurd-istan and their Muslim host population was below thedetectable level. The acceptance of Judaism by the rulersand inhabitants of the Kurdish Kingdom of Adiabene inthe first century of the Common Era resulted in the as-similation of non-Jews into the community (Brauer1993). This recorded conversion does not appear to havehad a considerable effect on the Y chromosome pool ofthe Kurdish Jews.
Sephardic Jews.—Iraqi and North African Jews are

1104 Am. J. Hum. Genet. 69:1095–1112, 2001
Figure 6 Geographical distribution of Eu 9 and Eu 10. The haplogroups are represented by different shades of grey as designated. Thenumber in each pie indicates the population analyzed. The data are from Semino et al. (2000) for the following populations: 1 p Sardinians;2 p central-northern Italians; 3 p Calabrians; 4 p Greeks; 5 p Macedonians; 6 p Ukrainians; 7 p Turks; 8 p Lebanese; 10 p Syrians;and 12 p Georgians. Data from the present study are from the following populations: 9 p Jews; 11 p Palestinian Arabs; and 13 p MuslimKurds.
both considered to belong to the ethnically heteroge-neous group of Sephardim, although the two commu-nities were probably separated for 1,000 years. The Jew-ish community in Iraq was formed by deportees duringthe Assyrian and Babylonian exiles (723 and 586 B.C.)and by waves of immigrants in subsequent centuries.Communities in various North African countries and inthe Iberian Peninsula were established primarily in thecourse of the Muslim conquest in the seventh and eighthcenturies. After their expulsion from Spain in 1492 A.D.,Jews were dispersed in North Africa and Southern Eu-rope (Ben-Sasson 1976). The two Sephardic communi-ties and Kurdish Jews are very closely related to eachother. Thus, these populations seem to have preserved,to a large extent, their original Y chromosome pools.
Genetic Relationships among Middle EasternPopulations
In a report published elsewhere, we recently showedthat Jews and Palestinian Arabs share a large portion oftheir Y chromosomes, suggesting a common ancestry(Nebel et al. 2000). Surprisingly, in the present study,Jews were found to be even closer to populations in thenorthern part of the Middle East than to several Arabpopulations. It is worth mentioning that, on the basisof protein polymorphisms, most Jewish populationscluster very closely with Iraqis (Livshits et al. 1991) and
that the latter, in turn, cluster very closely with Kurds(Cavalli-Sforza et al. 1994). These findings are consistentwith known cultural links that existed among popula-tions in the Fertile Crescent in early history.
Muslim Kurds.—The Kurds are considered an ancientautochthonous population (Kinnane 1970; Pelletiere1984) who may even be the descendants of the shepherdswho first populated the highlands during the Neolithicperiod (Comas et al. 2000). Although Kurdistan cameunder the successive dominion of various conquerors,including the Armenians, Romans, Byzantines, Arabs,Ottoman Turks, and Iraqis (Kinnane 1970), they maybe the only western Asian group that remained relativelyunmixed by the influx of invaders, because of their pro-tected and inhospitable mountainous homeland (Pelle-tiere 1984). The Y chromosome variation of MuslimKurds falls within the spectrum observed in other pop-ulations (Turks and Armenians) living in the same re-gion. The three populations are closer to Jews and Arabsthan to Europeans. This is in good agreement with dataon classical markers (Cavalli-Sforza et al. 1994). How-ever, on the basis of mtDNA polymorphisms, Kurds werereported to be more closely related to Europeans thanto Middle Easterners (Comas et al. 2000).
Palestinian Arabs and Bedouin.—Bedouin are largelynomadic Arab herders, with a tribal organization. Theylive in all Arab countries, constituting about one tenth

Nebel et al.: Y Chromosomes of Jews and Middle Easterners 1105
of the population (Cavalli-Sforza et al. 1994). The Bed-ouin population of the Negev desert was found to bemost distant from Jews and Muslim Kurds and to beclosely related only to Palestinians. Both these Arabpopulations differ from the other Middle Eastern groupssampled for the present study, mainly in having a higherfrequency of Eu 10 chromosomes, the majority of whichthey share with each other. Traditional marriage prac-tices—such as male polygamy, a high rate of consan-guineous marriages, and patrilocality—may have en-hanced the low haplogroup and haplotype diversity ofthe Negev Bedouin, as was suggested elsewhere for theBedouin tribes in the Sinai Peninsula (Salem et al. 1996).
We propose that the Y chromosomes in PalestinianArabs and Bedouin represent, to a large extent, earlylineages derived from the Neolithic inhabitants of thearea and additional lineages from more-recent popula-tion movements. The early lineages are part of the com-mon chromosome pool shared with Jews (Nebel et al.2000). According to our working model, the more-re-cent migrations were mostly from the Arabian Peninsula,as is seen in the Arab-specific Eu 10 chromosomes thatinclude the modal haplotypes observed in Palestiniansand Bedouin. These haplotypes and their one-step mi-crosatellite neighbors constitute a substantial portion ofthe total Palestinian (29%) and Bedouin (37.5%) Ychromosome pools and were not found in any of thenon-Arab populations in the present study. The periph-eral position of the modal haplotypes, with few links inthe network (fig. 5), suggests that the Arab-specific chro-mosomes are a result of recent gene flow. Historical re-cords describe tribal migrations from Arabia to thesouthern Levant in the Byzantine period, migrations thatreached their climax with the Muslim conquest 633–640A.D.; Patrich 1995). Indeed, Arab-specific haplotypeshave been observed at significant frequencies in MuslimArabs from Sena (56%) and the Hadramaut (16%) inthe Yemen (Thomas et al. 2000). Thus, although Y chro-mosome data of Arabian populations are limited, itseems very likely that populations from the Arabian Pen-insula were the source of these chromosomes. The ge-netic closeness, in classical protein markers, of Bedouinto Yemenis and Saudis (Cavalli-Sforza et al. 1994) sup-ports an Arabian origin of the Bedouin. The alternativeexplanation for the distribution of the Arab-specific hap-lotypes (i.e., random genetic drift) is unlikely. It is dif-ficult to imagine that the different populations in theYemen and the southern Levant, in which Arab-specificchromosomes have been detected at moderate-to-highfrequencies, would have drifted in the same direction.
Linguistics.—The high degree of genetic similarity ofthe Middle Eastern populations studied here is not re-flected in linguistic affinity. The Kurdish language is re-lated to Persian and belongs to the Indo-European fam-ily, which sets the Kurds apart from the Semitic-speaking
Jews and Arabs and from the Turkic speakers in Turkey(Pelletiere 1984). Like Kurdish, the Armenian languageis also of Indo-European origin, but it forms a separatebranch within the western group of this family. The highgenetic affinity across major language divisions thereforesuggests that the Y chromosome pool of Middle Easternpopulations is ancient and predates the emergence orintroduction of different languages into the region.
Geographical and Historical Origins of Eu 9 and Eu 10
Eu 9 and Eu 10 make up the Middle Eastern/Medi-terranean Hg 9. They are characterized by a very highfrequency of DYS388 alleles with �15 repeats, whichare restricted to these two haplogroups. This findingconfirms our previous hypotheses, which postulated thatlow- and high-repeat number DYS388 alleles segregatein distinct haplogroups, that high-score repeats are thehallmark of Hg 9 and, hence, that DYS388 is a usefulMiddle Eastern–specific marker (Nebel et al. 2001).
Hg 9 was shown to have spread from the ZagrosMountains in northwestern Iran (Quintana-Murci et al.2001). Our data confirm the Middle Eastern origin ofHg 9. Its two sublineages (Eu 9 and Eu 10) show clearopposite clines, with a north-south frequency gradientin the Middle East that decreases for Eu 9 and increasesfor Eu 10 (fig. 6). Thus, the possible place of origin forEu 9 could be in the northern part of the Fertile Crescentand that for Eu 10 in the southern part. However, sincedata for some relevant populations are not available,this interpretation should be regarded with caution.
The dates for the start of expansion of Hg 9 foundhere (∼10,500 and 7,500 years ago, based on generationtimes of 35 or 25 years, respectively) are in good agree-ment with estimates published elsewhere (Quintana-Murci et al. 2001). This range of dates and the onesobtained for Eu 9 (∼9,800–7,000 years ago) and Eu 10(∼9,000–6,400 years ago) cover the Neolithic period andthe beginning of the Chalcolithic period in the region(Bar-Yosef 1995; Levy 1995). These estimates and thegeographic distribution of both Eu 9 and Eu 10 supportthe model of demic diffusion from the Middle East dur-ing the Neolithic period (Semino et al. 2000).
The p12f2 deletion defining Hg 9 has been dated toyears ago (Hammer et al. 2000). The14,800 � 9,700
discrepancy between the older mutation age obtained bycoalescence dating (Hammer et al. 2000) and the esti-mates based on microsatellite variation (Quintana-Murci et al. 2001 and the present study) may be theresult of any of the following: (a) a lag between themutation event proper and the expansion of the lineageit defines, (b) microsatellite saturation, (c) overestima-tion of the microsatellite-mutation rate, or (d) samplingbias (Bosch et al. 1999).
In the present sample, the modal haplotype of the

1106 Am. J. Hum. Genet. 69:1095–1112, 2001
Muslim Kurds is at the core of Eu 9, and the CMHis at the center of Eu 10, attesting to the antiquity ofboth haplotypes. Their close microsatellite constella-tions (they differ by only one microsatellite mutation)suggest that the expansion and genetic divergence ofthe two haplogroups followed closely the TrG trans-version that split Eu 9 from Eu 10. The high degreeof homoplasy between Eu 9 and Eu 10, together withtheir very similar microsatellite allele spectra, corrob-orates this hypothesis.
In conclusion, the present study shows that the MiddleEastern populations we analyzed are closely related andthat their Y chromosome pool is distinct from that ofEuropeans. Genetic dating performed in the presentstudy, together with age estimates reported elsewhere(reviewed by Bosch et al. 1999), suggests that the majorhaplogroups observed in our sample are much older thanthe populations in which they are found. Thus, the com-mon genetic Middle Eastern background predates theethnogenesis in the region. The study demonstrates thatthe Y chromosome pool of Jews is an integral part ofthe genetic landscape of the region and, in particular,
that Jews exhibit a high degree of genetic affinity topopulations living in the north of the Fertile Crescent.
Acknowledgments
We wish to thank Professor Richard Villems and Siiri Rootsi(Estonian Biocentre, Tartu, Estonia) for sharing their typingdata before publication. We are grateful to Dr. Mark Thomas(Department of Biology, University College London, UnitedKingdom) for inviting A.N. to type the Kurdish samples in hislaboratory. We thank Professor Israel Eph’al (Department ofHistory of the Jewish People, Hebrew University of Jerusalem,Israel), and Professor Sergio della Pergola (A. Harman Instituteof Contemporary Jewry, Hebrew University of Jerusalem, Is-rael) for historical insights. We would like to acknowledge Dr.Peter Forster (McDonald Institute for Archaeological Re-search, University of Cambridge, United Kingdom) for helpfulsuggestions regarding the use of the Network program. Specialthanks to Dr. Mira Korner (The National Genome Center atthe Hebrew University of Jerusalem, Israel) for assistance andadvice in DNA typing. This work was supported by a researchgrant from the Israeli Ministry of Science, Culture and Sport.
Appendix
Table A1
Distribution of Y Chromosome Haplotypes in Six Middle Eastern Populations
HAPLOTYPE
NUMBER
ALLELE STATUS AT POPULATIONa
TOTALDYS19 DYS388 DYS390 DYS391 DYS392 DYS393 AJ SJ KJ MK PA B
Hg 11 16 13 23 10 13 13 1Iq 12 16 13 23 10 10 14 1NA 13 16 12 23 10 10 14 1Iq 1 24 15 12 24 11 13 13 1 1 25 15 12 24 10 13 13 2 26 15 12 24 10 13 12 1 17 15 12 23 11 13 13 3 38 15 12 23 10 10 14 1Iq 19 15 12 22 10 15 13 1NA 110 14 12 26 11 13 13 1Ib 111 14 12 25 11 13 13 1Iq 112 14 12 25 11 13 12 1 113 14 12 25 10 14 12 1 114 14 12 25 10 13 13 1 115 14 12 24 11 14 12 1 1Iq 2 2 1 716 14 12 24 11 13 13 1 117 14 12 24 11 13 12 1 4 2 3 1018 14 12 24 10 14 12 2 3NA 1 619 14 12 24 10 13 13 2 220 14 12 24 10 13 12 1NA 121 14 12 24 10 12 12 1NA 122 14 12 23 11 14 12 3 323 14 12 23 11 13 12 1 124 14 12 23 10 13 13 1 1 225 14 12 23 10 10 14 2T, 2Iq 4 8
(continued)
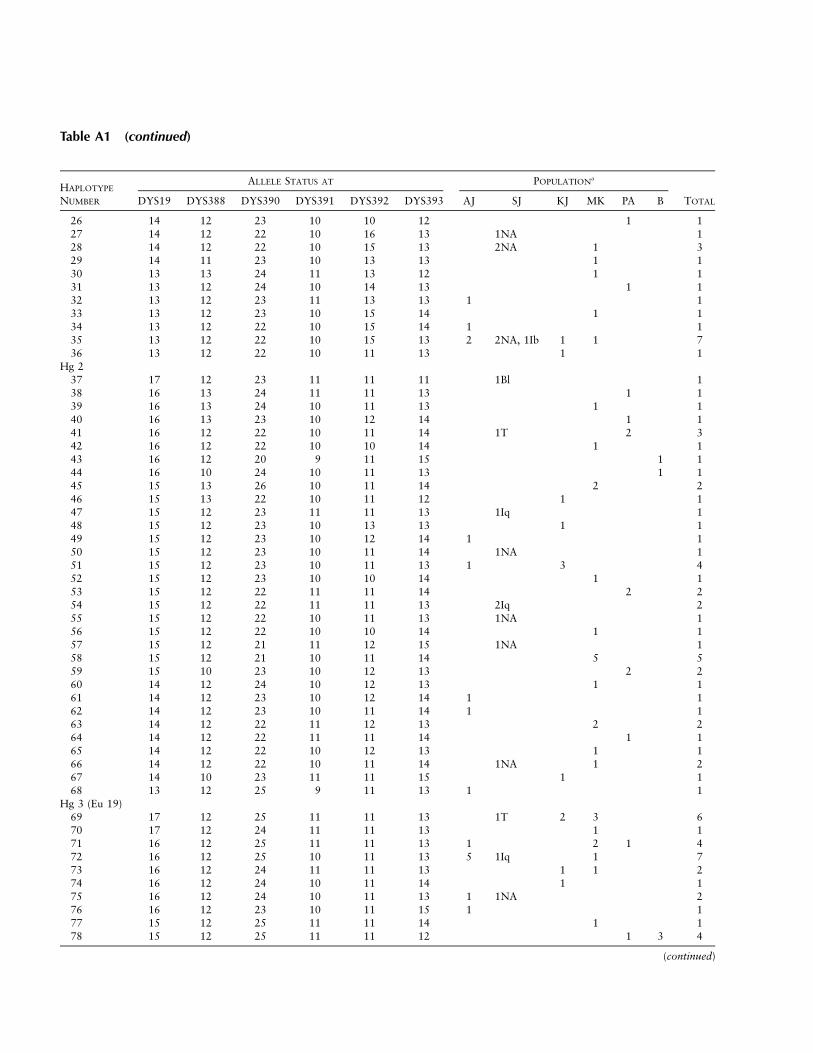
Table A1 (continued)
HAPLOTYPE
NUMBER
ALLELE STATUS AT POPULATIONa
TOTALDYS19 DYS388 DYS390 DYS391 DYS392 DYS393 AJ SJ KJ MK PA B
26 14 12 23 10 10 12 1 127 14 12 22 10 16 13 1NA 128 14 12 22 10 15 13 2NA 1 329 14 11 23 10 13 13 1 130 13 13 24 11 13 12 1 131 13 12 24 10 14 13 1 132 13 12 23 11 13 13 1 133 13 12 23 10 15 14 1 134 13 12 22 10 15 14 1 135 13 12 22 10 15 13 2 2NA, 1Ib 1 1 736 13 12 22 10 11 13 1 1
Hg 237 17 12 23 11 11 11 1Bl 138 16 13 24 11 11 13 1 139 16 13 24 10 11 13 1 140 16 13 23 10 12 14 1 141 16 12 22 10 11 14 1T 2 342 16 12 22 10 10 14 1 143 16 12 20 9 11 15 1 144 16 10 24 10 11 13 1 145 15 13 26 10 11 14 2 246 15 13 22 10 11 12 1 147 15 12 23 11 11 13 1Iq 148 15 12 23 10 13 13 1 149 15 12 23 10 12 14 1 150 15 12 23 10 11 14 1NA 151 15 12 23 10 11 13 1 3 452 15 12 23 10 10 14 1 153 15 12 22 11 11 14 2 254 15 12 22 11 11 13 2Iq 255 15 12 22 10 11 13 1NA 156 15 12 22 10 10 14 1 157 15 12 21 11 12 15 1NA 158 15 12 21 10 11 14 5 559 15 10 23 10 12 13 2 260 14 12 24 10 12 13 1 161 14 12 23 10 12 14 1 162 14 12 23 10 11 14 1 163 14 12 22 11 12 13 2 264 14 12 22 11 11 14 1 165 14 12 22 10 12 13 1 166 14 12 22 10 11 14 1NA 1 267 14 10 23 11 11 15 1 168 13 12 25 9 11 13 1 1
Hg 3 (Eu 19)69 17 12 25 11 11 13 1T 2 3 670 17 12 24 11 11 13 1 171 16 12 25 11 11 13 1 2 1 472 16 12 25 10 11 13 5 1Iq 1 773 16 12 24 11 11 13 1 1 274 16 12 24 10 11 14 1 175 16 12 24 10 11 13 1 1NA 276 16 12 23 10 11 15 1 177 15 12 25 11 11 14 1 178 15 12 25 11 11 12 1 3 4
(continued)

1108
Table A1 (continued)
HAPLOTYPE
NUMBER
ALLELE STATUS AT POPULATIONa
TOTALDYS19 DYS388 DYS390 DYS391 DYS392 DYS393 AJ SJ KJ MK PA B
79 15 12 25 10 11 13 2 280 15 12 24 11 11 14 1 181 15 12 24 11 11 13 1 1
Hg 782 15 11 22 10 11 13 1 183 14 15 23 9 11 12 1 1
Hg 9 (Eu 9)84 16 16 23 10 11 13 1 185 16 16 23 9 11 12 1 186 16 15 23 10 11 12 1 187 16 15 22 11 11 12 1 188 16 14 24 10 11 12 1 189 16 12 23 10 11 12 1 190 15 16 24 10 11 12 1 1 291 15 16 23 9 11 12 3 392 15 16 22 9 11 12 1 193 15 15 25 11 11 13 1T 194 15 15 24 10 11 12 2 5 795 15 15 23 11 11 12 1 196 15 15 23 10 11 12 1 1NA 1 1 497 15 15 23 9 11 13 1NA 198 15 15 22 10 11 13 1 199 15 15 22 10 11 12 2 1 3100 15 15 22 10 8 12 1 1101 15 14 23 9 11 13 1 1102 15 13 25 10 11 12 1 1103 15 12 24 11 11 12 1NA 1104 14 18 23 10 11 12 1 1105 14 17 23 10 11 12 1Iq 1 2 1 5106 14 17 22 9 10 12 1 1107 14 16 24 10 11 12 1 1108 14 16 23 10 11 12 3 1 4109 14 16 23 10 11 11 2 2110 14 16 23 9 11 16 1 1111 14 15 26 10 11 12 2 2112 14 15 25 10 11 12 1 1113 14 15 23 10 11 13 1 1114 14 15 23 10 11 12 1 2NA 2 9 2 16115 14 15 23 10 11 10 1 1116 14 15 22 11 11 13 2 2117 14 15 22 10 11 13 1 1118 14 15 22 10 11 12 1 1NA 2 4119 14 15 22 10 11 11 1T 1120 14 15 22 9 11 13 1Iq 2 3121 14 15 22 9 11 12 1 1 2122 14 14 25 11 11 12 1 1123 14 14 24 10 11 13 1 1124 14 14 24 10 11 12 4 1 5125 14 14 23 11 11 12 1 1126 14 14 22 10 11 12 1 1127 14 13 24 10 11 12 1NA 1 2128 13 17 23 10 11 12 1 1129 13 15 24 10 11 12 1 1130 13 15 23 10 11 12 1Iq 1131 13 11 22 10 11 12 1 1
(continued)

1109
Table A1 (continued)
HAPLOTYPE
NUMBER
ALLELE STATUS AT POPULATIONa
TOTALDYS19 DYS388 DYS390 DYS391 DYS392 DYS393 AJ SJ KJ MK PA B
Hg 9 (Eu 10)132 15 18 23 12 11 13 1 1133 15 17 23 11 11 12 1 1134 15 17 22 11 11 12 1 1135 15 16 23 10 11 12 1 1136 15 16 23 10 11 11 1 1137 15 16 22 10 11 11 1 1138 15 15 24 11 11 12 1 1139 15 13 23 10 12 13 1 1140 15 13 23 10 12 12 1 1141 14 17 24 11 11 12 1 1142 14 17 24 10 11 12 1 1143 14 17 23 13 11 12 1 1144 14 17 23 11 11 12 12 12145 14 17 23 11 11 11 1 1146 14 17 23 10 11 13 1T 1147 14 17 23 10 11 12 1 1NA, 1Iq 2 1 6148 14 17 22 12 11 13 1 1149 14 17 22 11 12 12 1 1150 14 17 22 11 11 13 1 1151 14 17 22 11 11 12 20 3 23152 14 17 22 10 11 12 3 3153 14 16 26 10 13 12 1 1154 14 16 25 10 13 12 3 3155 14 16 23 11 12 13 1 1156 14 16 23 11 11 12 1 1 2157 14 16 23 10 13 12 1 1158 14 16 23 10 11 13 1 5 6159 14 16 23 10 11 12 6 2NA, 2S, 1Ib 10 1 3 25160 14 16 22 11 11 12 1 1161 14 16 22 11 11 11 1 1162 14 16 22 10 11 12 1 1 2163 14 16 22 10 11 11 1 1164 14 15 24 10 14 12 1T 1165 14 15 23 10 11 14 1 1166 14 15 23 10 11 13 1 7 8167 14 15 23 10 11 12 1 2 3168 14 15 22 10 11 13 1 1169 14 15 22 10 11 12 1NA 1170 14 15 22 10 11 11 1 1171 14 14 23 10 11 12 1 1172 14 13 24 10 11 12 1 1173 14 13 23 10 11 12 1 1 1 3174 14 13 22 10 11 12 1 1175 13 16 25 10 11 12 2 2176 13 15 25 11 11 12 2 2177 13 15 24 10 11 12 1 1178 13 13 24 10 10 12 1 1
Hg 21179 16 12 25 10 11 14 1 1180 16 12 24 10 11 13 1 1181 16 12 23 10 11 13 1 1182 16 12 22 9 12 13 1Iq 1 2183 15 14 23 11 11 12 1NA 1184 15 13 24 11 11 13 1 1
(continued)

Table A1 (continued)
HAPLOTYPE
NUMBER
ALLELE STATUS AT POPULATIONa
TOTALDYS19 DYS388 DYS390 DYS391 DYS392 DYS393 AJ SJ KJ MK PA B
185 15 12 24 11 11 13 1 1186 15 12 24 10 11 14 1 1187 15 12 24 10 11 13 1 1NA 2 4188 15 12 24 9 11 13 1 1189 15 12 23 10 11 13 1 1190 15 12 22 10 11 13 1 1191 14 15 24 10 11 13 1 1192 14 13 25 10 13 13 1 1193 14 13 24 10 11 13 1 1194 14 13 24 10 11 12 1 1195 14 12 26 10 11 13 1 1196 14 12 25 10 11 14 2 2197 14 12 25 10 11 13 1 1 2198 14 12 25 9 11 13 1 1199 14 12 24 11 11 13 1 1200 14 12 24 10 11 14 1 1S 2 4201 14 12 24 10 11 13 1 1 1 2 5202 14 12 24 10 11 12 1 1203 14 12 23 10 11 13 1Iq 3 4204 14 12 22 11 11 13 1NA 1205 13 13 26 10 11 14 1 1206 13 13 24 11 12 13 1 1207 13 12 26 10 11 14 4 4208 13 12 25 11 11 13 1T 1209 13 12 25 10 12 13 1 1210 13 12 25 10 11 14 1 1211 13 12 25 10 11 13 3 1Bl 3 7212 13 12 25 9 11 14 2 2213 13 12 24 11 12 13 1 1214 13 12 24 10 11 14 1 1215 13 12 24 10 11 13 3 1NA, 1T 5216 13 12 24 10 11 12 2 2217 13 12 24 10 11 11 1 1218 13 12 24 10 10 13 1 1219 13 12 24 9 11 14 1 1220 13 12 24 9 11 13 1 1T 1 3221 13 12 23 11 11 13 1 1222 13 12 23 10 11 13 1 1NA 1 1 1 5223 13 12 23 10 10 13 1T 1224 13 12 23 9 11 13 1 1225 13 12 22 10 11 13 2Iq 1 3226 11 12 23 10 12 13 1 1
Hg 26227 15 12 24 10 14 13 2NA 1 3228 15 12 23 11 13 15 1 1229 15 12 23 10 14 13 1 1230 15 12 23 10 13 13 1 1231 15 12 23 9 13 13 1 1232 14 14 26 10 13 13 1 1233 14 12 24 11 13 13 1 1234 14 12 24 10 13 13 1 1235 14 12 24 10 13 12 1 1236 14 12 23 11 13 13 1NA 1237 14 12 23 10 15 13 2 2238 14 12 23 10 14 13 6 1 7
(continued)

Nebel et al.: Y Chromosomes of Jews and Middle Easterners 1111
Table A1 (continued)
HAPLOTYPE
NUMBER
ALLELE STATUS AT POPULATIONa
TOTALDYS19 DYS388 DYS390 DYS391 DYS392 DYS393 AJ SJ KJ MK PA B
239 14 12 23 10 14 12 1 1240 14 12 23 10 13 13 1 1Iq 6 3 11241 14 12 22 11 13 12 1 1242 14 12 22 10 14 11 1 1243 14 12 22 10 13 13 1 1244 14 12 22 10 13 12 2 2245 13 12 24 10 13 13 2 2246 13 12 23 10 13 13 1NA, 1T 2
Hg 28247 15 12 23 10 14 12 1 1248 14 12 23 10 13 11 1 1249 14 12 22 10 14 11 1 1250 13 12 22 11 16 11 1 1
Total 79 78 99 95 143 32 526h b .986 .990 .977 .985 .971 .923v c .005 .004 .006 .006 .008 .029
a AJ p Ashkenazi Jew; SJ p Sephardic Jew; KJ p Kurdish Jew; MK p Muslim Kurd; PA p Palestinian Arab; B p Bedouin; NA p NorthAfrica; Iq p Iraq; T p Turkey; S p Syria; Ib p Iberian Peninsula; Bl p Bulgaria.
b h p Haplotype diversity.c v p Sampling variance.
Electronic-Database Information
URLs for software mentioned in this article are as follows:
Arlequin, http://anthropologie.unige.ch/arlequinDISPAN, http://med-humgen14.bu.edu/ota/tatsuya.htmlMicrosat, http://lotka.stanford.edu/microsat.htmlNetwork, http://www.fluxus-engineering.comPHYLIP, http://evolution.genetics.washington.edu/phylip.html
References
Bandelt H-J, Forster P, Rohl A (1999) Median-joining net-works for inferring intraspecific phylogenies. Mol Biol Evol16:37–48
Bandelt H-J, Forster P, Sykes B, Richards M (1995) Mito-chondrial portraits of human populations using median net-works. Genetics 141:743–753
Bar-Yosef O (1995) Earliest food producers: pre-pottery Neo-lithic. In: Levy T (ed) The archaeology of society in the HolyLand. Leicester University Press, London, pp 190–204
Ben-Sasson H (1976) A history of the Jewish people. HarvardUniversity Press, Cambridge
Bosch E, Calafell F, Santos FR, Perez-Lezaun A, Comas D,Benchemsi N, Tyler-Smith C, Bertranpetit J (1999) Variationin short tandem repeats is deeply structured by genetic back-ground on the Y chromosome. Am J Hum Genet 65:1623–1638
Brauer E (1993) The Jews of Kurdistan. Wayne State UniversityPress, Detroit
Brinkmann C, Forster P, Schurenkamp M, Horst J, Rolf B,
Brinkmann B (1999) Human Y-chromosomal STR haplo-types in a Kurdish population sample. Int J Legal Med 112:181–183
Cavalli-Sforza L, Menozzi P, Piazza A (1994) The history andgeography of human genes. Princeton University Press,Princeton, NJ
Comas D, Calafell F, Bendukidze N, Fananas L, BertranpetitJ (2000) Georgian and Kurd mtDNA sequence analysisshows a lack of correlation between languages and femalegenetic lineages. Am J Phys Anthropol 112:5–16
Dunlop D (1954) The history of the Jewish Khazars. PrincetonUniversity Press, Princeton, NJ
Excoffier L, Smouse P, Quattro J (1992) Analysis of molecularvariance inferred from metric distances among DNA hap-lotypes: application to human mitochondrial DNA restric-tion data. Genetics 131:479–491
Forster P, Rohl A, Lunnemann P, Brinkmann C, Zerjal T, Tyler-Smith C, Brinkmann B (2000) A short tandem repeat–basedphylogeny for the human Y chromosome. Am J Hum Genet67:182–196
Goldstein D, Ruiz-Linares A, Cavalli-Sforza LL, Feldman M(1995) An evaluation of genetic distances for use with mi-crosatellite loci. Genetics 139:463–471
Hammer MF, Redd AJ, Wood ET, Bonner MR, Jarjanazi H,Karafet T, Santachiara-Benerecetti SA, Oppenheim A, Jo-bling MA, Jenkins T, Ostrer H, Bonne-Tamir B (2000) Jew-ish and Middle Eastern non-Jewish populations share a com-mon pool of Y-chromosome biallelic haplotypes. Proc NatlAcad Sci USA 97:6769–6774
Helgason A, Sigurdardottir S, Nicholson J, Sykes B, Hill EW,Bradely DG, Bosnes V, Gulcher JR, Ward R, Stefansson K

1112 Am. J. Hum. Genet. 69:1095–1112, 2001
(2000) Estimating Scandinavian and Gaelic ancestry in themale settlers of Iceland. Am J Hum Genet 67:697–717
Hurles ME, Irven C, Nicholson J, Taylor PG, Santos FR,Loughlin J, Jobling MA, Sykes BC (1998) European Y-chro-mosomal lineages in Polynesians: a contrast to the popu-lation structure revealed by mtDNA. Am J Hum Genet 63:1793–1806
Hurles ME, Veitia R, Arroyo E, Armenteros M, BertranpetitJ, Perez-Lezaun, Bosch E, Shlumukova M, Cabon-ThomsenA, McElreavey K, Lopez de Munain L, Rohl A, Wilson IJ,Singh L, Pandya A, Santos FR, Tyler-Smith C, Jobling MA(1999) Recent male-mediated gene flow over a linguisticbarrier in Iberia, suggested by analysis of a Y-chromosomalDNA polymorphism. Am J Hum Genet 65:1437–1448
Kayser M, Brauer S, Weiss G, Schiefenhovel W, Underhill P,Stoneking M (2001) Independent histories of human Y chro-mosomes from Melanesia and Australia. Am J Hum Genet68:173–190
Kinnane D (1970) The Kurds and Kurdistan. Oxford Univer-sity Press, London
Kittles R, Perola M, Peltonen L, Bergen AW, Aragon RA, Virk-kunen M, Linnoila M, Goldman D, Long JC (1998) Dualorigins of Finns revealed by Y chromosome haplotype var-iation. Am J Hum Genet 62:1171–1179
Levy T (1995) Cult, metallurgy and rank societies: the Chal-colithic period (ca. 4500–3500 BCE). In: Levy T (ed) Thearchaeology of society in the Holy Land. Leicester UniversityPress, London, pp 226–244
Livshits G, Sokal R, Kobyliansky E (1991) Genetic affinitiesof Jewish populations. Am J Hum Genet 49:131–146
Michalakis Y, Excoffier L (1996) A generic estimation of pop-ulation subdivision using distances between alleles with spe-cial reference for microsatellite loci. Genetics 142:1061–1064
Nebel A, Filon D, Hohoff C, Faerman M, Brinkmann B, Op-penheim A (2001) Haplogroup-specific deviation from thestepwise mutation model at the microsatellite loci DYS388and DYS392. Eur J Hum Genet 9:22–26
Nebel A, Filon D, Weiss D, Weale M, Faerman M, OppenheimA, Thomas M (2000) High-resolution Y chromosome hap-lotypes of Israeli and Palestinian Arabs reveal geographicsubstructure and substantial overlap with haplotypes ofJews. Hum Genet 107:630–641
Nei M (1987) Molecular evolutionary genetics. Columbia Uni-versity Press, New York
Patrich J (1995) Church, state and the transformation of Pal-estine: the Byzantine period (324–640 CE). In: Levy T (ed)The archaeology of society in the Holy Land. Leicester Uni-versity Press, London, pp 470–487
Pelletiere S (1984) The Kurds: an unstable element in the Gulf.Westview Press, Boulder, CO
Quintana-Murci L, Krausz C, Zerjal T, Sayar H, Hammer MF,Mehdi SQ, Ayub Q, Qamar R, Mohyuddin A, RadhakrishnaU, Jobling MA, Tyler-Smith C, McElreavey K (2001) Y-chro-mosome lineages trace diffusion of people and languages insouthwestern Asia. Am J Hum Genet 68:537–542
Raymond M, Rousset F (1995) An exact test for populationdifferentiation. Evolution 49:1280–1283
Richards M, Macaulay V, Hickey E, Vega E, Sykes B, GuidaV, Rengo C et al (2000) Tracing European founder lineages
in the Near Eastern mtDNA pool. Am J Hum Genet 67:1251–1276
Rosser Z, Zerjal T, Hurles M, Adojaan M, Alavantic D, Amo-rim A, Amos W, et al (2000) Y-chromosomal diversity inEurope is clinal and influenced by geography, rather thanby language. Am J Hum Genet 67:1526–1543
Roth C (1972) Encyclopedia Judaica. Keter, Jerusalem, pp1296–1299
Salem A-H, Badr F, Gaballah M, Paabo S (1996) The geneticsof traditional living: Y-chromosomal and mitochondriallineages in the Sinai Peninsula. Am J Hum Genet 59:741–743
Santachiara-Benerecetti A, Semino O, Passarino G, Torroni A,Brdicka R, Fellous M, Modiano G (1993) The commonNear Eastern origin of Ashkenazi and Sephardi Jews sup-ported by Y-chromosome similarity. Ann Hum Genet 57:55–64
Seielstad M, Minch E, Cavalli-Sforza L (1998) Genetic evi-dence for a higher female migration rate in humans. NatGenet 20:278–280
Semino O, Passarino G, Oefner PJ, Lin AA, Arbuzova S, Beck-man LE, De Benedictis G, Francalacci P, Kouvatsi A, Lim-borska S, Marcikiae M, Mika A, Mika B, Primorac D, San-tachiara-Benerecetti AS, Cavalli-Sforza LL, Underhill, PA(2000) The genetic legacy of Paleolithic Homo sapiens sap-iens in extant Europeans: a Y chromosome perspective. Sci-ence 290:1155–1159
Slatkin M (1995) A measure of population subdivision basedon microsatellite allele frequencies. Genetics 139:457–462
Sykes B, Irven C (2000) Surnames and the Y chromosome.Am J Hum Genet 66:1417–1419
Thomas MG, Bradman N, Flinn H (1999) High throughputanalysis of 10 microsatellite and 11 diallelic polymorphismson the human Y chromosome. Hum Genet 105:577–581
Thomas MG, Parfitt T, Weiss DA, Skorecki K, Wilson JF, leRoux M, Bradman N, Goldstein DB (2000) Y chromosomestraveling south: the Cohen modal haplotype and the originsof the Lemba—the “Black Jews of Southern Africa.” Am JHum Genet 66:674–686
Thomas MG, Skorecki K, Ben-Ami H, Parfitt T, Bradman N,Goldstein DB (1998) Origins of Old Testament priests. Na-ture 394:138–140
Tremblay M, Vezina H (2000) New estimates of intergener-ational time intervals for the calculation of age and originof mutations. Am J Hum Genet 66:651–658
Underhill PA, Shen P, Jin L, Lin AA, Jin L, Passarino G, YangWH, Kauffman E, Bonne-Tamir B, Bertranpetit J, Franca-lacci P, Ibrahim M, Jenkins T, Kidd JR, Mehdi SQ, SeielstadMT, Wells RS, Piazza A, Davis RW, Feldman MW, Cavalli-Sforza LL, Oefner P (2000) Y chromosome sequence vari-ation and the history of human populations. Nat Genet 26:358–361
Zerjal T, Dashnyam B, Pandya A, Kayser M, Roewer L, SantosFR, Schiefenhovel W, Fretwell N, Jobling MA, Harihara S,Shimizu K, Semjidmaa D, Sajantila A, Salo P, Crawford MH,Ginter EK, Evgrafov OV, Tyler-Smith C (1997) Genetic re-lationships of Asians and Northern Europeans, revealed byY-chromosomal DNA analysis. Am J Hum Genet 60:1174–1183