THE WORLD OIL PALM MARKET TODAY - Grepalma
24
THE WORLD OIL PALM MARKET TODAY Speaker: Dr. James Fry, LMC International, UK
Transcript of THE WORLD OIL PALM MARKET TODAY - Grepalma

THE WORLD OIL PALM MARKET
TODAY
Speaker: Dr. James Fry,
LMC International, UK

1. First, I review the behaviour of the prices of leading oils - palm, soybean, rapeseed and sunflower – in relation to petroleum.
2. I will explain how this link has developed and the key role of biofuels.
3. There has emerged an oils “price band”, which is a trading range in which all vegetable oil prices trade, with crude oil prices acting as the floor to the trading range for vegetable oils.
4. Then I examine the recent trends in oil palm output in the world’s largest palm oil producers: Malaysia and Indonesia.
5. In view of the importance of petroleum prices for palm oil and other vegetable oils, I turn to an explanation of the way in which the development of efficient technologies for the extraction of shale oil in the US has transformed the petroleum market and, with it, the future levels of vegetable oil prices, via the price band just mentioned.
6. Finally, I conclude with a summary of the lessons to draw from my presentation, together with an outline of the prospects for palm oil prices over the next six months.
Outline of my presentation today
2
Vegetable oil price movements

Here you can see the price band for Rotterdam vegetable oils prices, with Brent crude oil as a floor. All vegetable oils now trade in a price range above Brent, where prices are all in $/tonne, and this price band is now clearly very well established.
Monthly Rotterdam vegetable oils and petroleum prices, 2003-2019
This plots EU oils prices alongside Brent North Sea crude oil
4
0
300
600
900
1,200
1,500
1,800
2,100
Jan-03 Jan-05 Jan-07 Jan-09 Jan-11 Jan-13 Jan-15 Jan-17 Jan-19
Ve
geta
ble
an
d C
rud
e O
ils (U
S$ t
on
ne
)
Soybean Palm Rapeseed Sunflower Brent

This is a bit clearer. You see several times when EU CPO prices fell to the level of Brent North Sea crude oil. At that point, CPO prices in South East Asia are below crude oil prices because CPO producers must pay export taxes and sea freight to deliver palm oil to the EU. When palm oil becomes a competitive fuel, biofuel demand increases and lifts the CPO price.
Monthly vegetable and mineral oils prices in the EU since 2013
This is the same data but displays prices only since 2013
5
0
200
400
600
800
1,000
1,200
1,400
Jan-13 Jan-14 Jan-15 Jan-16 Jan-17 Jan-18 Jan-19
Ve
geta
ble
an
d C
rud
e O
ils (U
S$ t
on
ne
)
Soybean Palm Rapeseed Sunflower Brent

There have been several times when CPO’s premium over Brent in Rotterdam fell to zero (the prices were the same) or
even briefly negative (CPO was cheaper than crude oil). This diagram confirms that the CPO premium over Brent crude
oil inside Indonesia is always lower, due to sea freight costs and export taxes.
Daily CPO premium over Brent crude oil in Rotterdam and inside Indonesia
If we focus solely on the premium of CPO over crude oil
6
-300
-200
-100
0
100
200
300
400
500
Aug-12
Pre
miu
m o
f CP
O o
ver
Bre
nt
cru
de
, $/t
on
ne
CIF Rotterdam Inside Indonesia

Thee were several times in the past year when CPO, especially inside Indonesia, but even in the EU in October, was a much cheaper source of fuel than crude oil. No subsidy was needed then to sell biodiesel at lower prices than diesel fuel.
Daily CPO premium in the past 12 months in Rotterdam and inside Indonesia
This is the same diagram over a shorter period
7
-200
-100
0
100
200
300
400
Aug-17 Nov-17 Feb-18 Jun-18 Sep-18 Dec-18 Apr-19 Jul-19
Pre
miu
m o
f C
PO
ove
r B
ren
t cr
ud
e,
$/t
on
ne
CIF Rotterdam Inside Indonesia

One reason is that Indonesian biodiesel exports react quickly to the competitiveness of local CPO vs. Singapore gasoil, with which biodiesel competes as a fuel. A large CPO discount vs. gasoil helps to boost biodiesel demand, such as for export. This increases demand for CPO to make the biodiesel and reduces world palm oil stocks, which in turn raises CPO prices.
The main reason why petroleum sets the floor to EU CPO prices
Moving average of biodiesel exports vs. the local CPO premium over gasoil
0
30
60
90
120
150
180
210
240
-400
-300
-200
-100
0
100
200
300
400
Jan-11 Jan-12 Jan-13 Jan-14 Jan-15 Jan-16 Jan-17 Jan-18 Jan-19
Mo
ving ave
rage o
f PM
E exp
orts '0
00
ton
ne
s
Ind
on
esi
a C
PO
pre
miu
m v
s. g
aso
il, $
/to
nn
e
Indonesian CPO premium over gasoil Biodiesel exports

This plots the EU CPO premium over crude oil (the CPO price minus the Brent price) against Malaysian palm oil stocks, which are the only stocks that are trusted by the market. Higher stocks imply a lower premium; and lower stocks a higherpremium. The CPO supply-demand balance (via stocks) sets the premium over Brent, not the actual CPO price.
Stocks determine the CPO premium over crude petroleum
Monthly EU CPO premium over Brent vs. MPOB palm oil stocks
1,200
1,500
1,800
2,100
2,400
2,700
3,000
3,300
-100
0
100
200
300
400
500
600
Jan-09 Jan-11 Jan-13 Jan-15 Jan-17 Jan-19
MP
OB
palm
oil sto
cks, '00
0 to
nn
es
EU p
rem
ium
ove
r B
ren
t, U
S$ p
er
ton
ne
EU CPO Premium over Brent Average Premium MPOB Stocks

The EU premia for other vegetable oils over CPO have recently increased significantly. Large palm oil supplies have made CPO into a competitive oil in the export market and palm oil is capturing market share from the other oils in price-sensitive importing countries, notably China and India.
We must not forget about other oils
Daily EU premium for the three leading soft oils over CPO
-100
0
100
200
300
400
500
Jun-12 Jun-13 Jun-14 Jun-15 Jun-16 Jun-17 Jun-18 Jun-19
EU p
rem
ium
ove
r C
PO
, US$
pe
r to
nn
e
Sunflower oil Rapeseed oil Soybean oil

This emphasises the point I made in the previous slide about the competitiveness of palm oil today. In the EU, CPO is trading between $150 and $200 per tonne below sunflower and soybean oils, and $350 below rapeseed oil,
This again is the same diagram over a shorter period
Daily EU premium for the three leading soft oils over CPO since Jan 2017
-50
0
50
100
150
200
250
300
350
400
450
Jan-17 May-17 Sep-17 Jan-18 May-18 Sep-18 Jan-19 May-19 Sep-19
EU p
rem
ium
ove
r C
PO
, US$
pe
r to
nn
e
Sunflower oil Rapeseed oil Soybean oil

Recent trends in palm oil output

Monthly palm oil production in Malaysia from 2015 to 2019
Malaysian output began 2019 at a record pace
13
Malaysia publishes excellent monthly statistics. From these, we see that CPO output this year has been consistently ahead of 2018 levels, but has struggled to keep up with 2017 levels and has fallen behind the 2015 performance ever since April.
1.0
1.1
1.2
1.3
1.4
1.5
1.6
1.7
1.8
1.9
2.0
2.1
Jan Feb Mar Apr May Jun Jul Aug
Mo
nth
ly C
PO
pro
du
ctio
n, m
illio
n t
on
ne
s
2015 2016 2017 2018 2019

Quarterly year-on-year growth of palm oil production in Indonesia and Malaysia
Indonesian and Malaysian production cycles are out of step
14
My colleagues work hard to estimate Indonesian production, as its output is well over double the size of Malaysia’s. In
the past Indonesia and Malaysia moved in step with one another. After the 2015-16 El Niño, their year-on-year changes
in quarterly output (i.e., Q2 2019 on Q2 2018) have moved in opposite directions; when one is up, the other is down.
-40%
-30%
-20%
-10%
0%
10%
20%
30%
40%
Q1.12 Q1.13 Q1.14 Q1.15 Q1.16 Q1.17 Q1.18 Q1.19
Ye
ar-o
n-y
ear
gro
wth
in C
PO
ou
tpu
t, %
Malaysia Indonesia
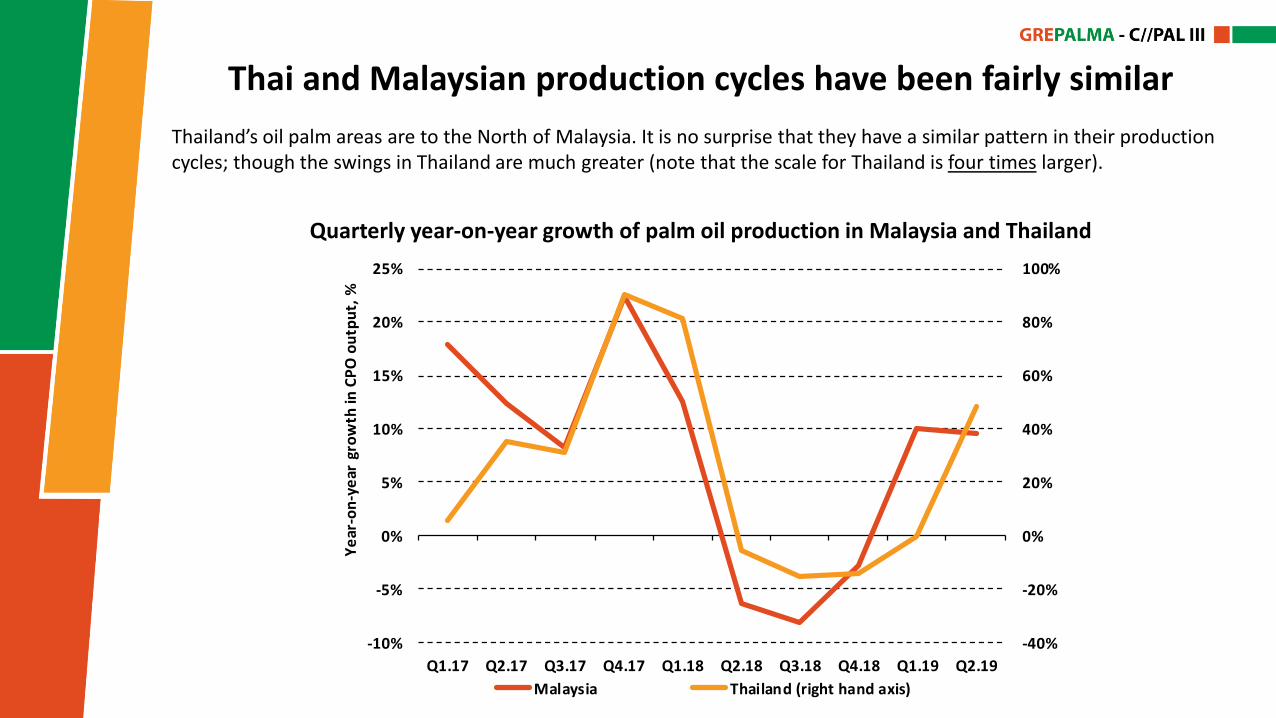
Quarterly year-on-year growth of palm oil production in Malaysia and Thailand
Thai and Malaysian production cycles have been fairly similar
15
Thailand’s oil palm areas are to the North of Malaysia. It is no surprise that they have a similar pattern in their production cycles; though the swings in Thailand are much greater (note that the scale for Thailand is four times larger).
-40%
-20%
0%
20%
40%
60%
80%
100%
-10%
-5%
0%
5%
10%
15%
20%
25%
Q1.17 Q2.17 Q3.17 Q4.17 Q1.18 Q2.18 Q3.18 Q4.18 Q1.19 Q2.19
Ye
ar-o
n-y
ear
gro
wth
in C
PO
ou
tpu
t, %
Malaysia Thailand (right hand axis)

Quarterly year-on-year growth of CPO output in Indonesia, PNG and Colombia
Indonesian, PNG and Colombian cycles are similar right now
16
Although Indonesia’s cycles currently are quite different from those in nearby Malaysia, they follow the same broad pattern as that in Papua New Guinea and recently that in Colombia, far away on the other side of the Pacific Ocean.
-40%
-30%
-20%
-10%
0%
10%
20%
30%
40%
50%
60%
Q1.17 Q2.17 Q3.17 Q4.17 Q1.18 Q2.18 Q3.18 Q4.18 Q1.19 Q2.19
Ye
ar-o
n-y
ear
gro
wth
in C
PO
ou
tpu
t, %
PNG Indonesia Colombia

Long run trends in palm oil output

Moving averages of the growth in palm areas in the four largest producers
The growth is oil palm areas is clearly slowing dramatically
18
Only Thailand (where palm is replacing rubber) is seeing an upturn in its area growth rate. Pressure from NGOs has made plantations uneasy about expanding. This means that, in the future, the underlying growth in CPO output will lag behind global growth in vegetable oil demand unless CPO yields increase, a challenge after the past decade without yield growth.
0%
2%
4%
6%
8%
10%
12%
14%
16%
18%
1983 1988 1993 1998 2003 2008 2013 2018
Ye
ar-o
n-y
ear
are
a gr
ow
th, i
n 5
yr
ave
rage
Malaysia Indonesia Thailand Colombia
Crude oil, the key factor behind CPO prices
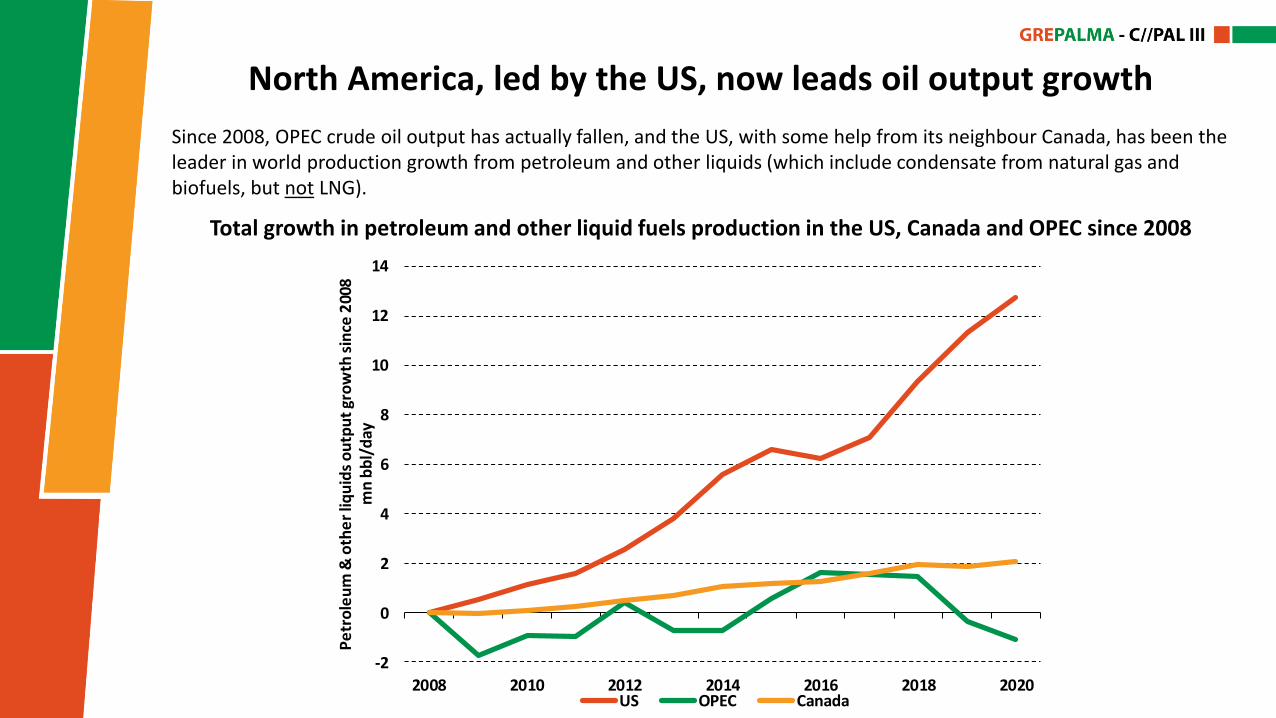
Since 2008, OPEC crude oil output has actually fallen, and the US, with some help from its neighbour Canada, has been the leader in world production growth from petroleum and other liquids (which include condensate from natural gas and biofuels, but not LNG).
North America, led by the US, now leads oil output growth
Total growth in petroleum and other liquid fuels production in the US, Canada and OPEC since 2008
20
-2
0
2
4
6
8
10
12
14
2008 2010 2012 2014 2016 2018 2020
Pe
tro
leu
m &
oth
er
liqu
ids
ou
tpu
t gr
ow
th s
ince
200
8
mn
bb
l/d
ay
US OPEC Canada
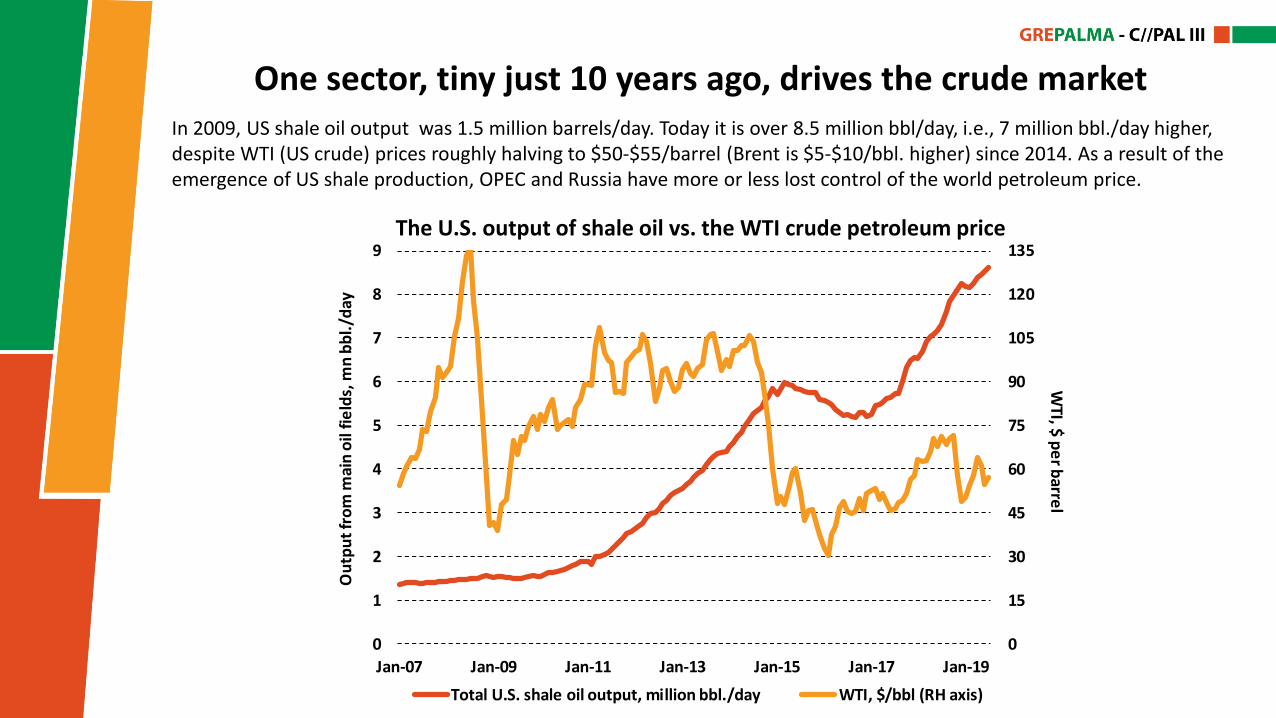
In 2009, US shale oil output was 1.5 million barrels/day. Today it is over 8.5 million bbl/day, i.e., 7 million bbl./day higher, despite WTI (US crude) prices roughly halving to $50-$55/barrel (Brent is $5-$10/bbl. higher) since 2014. As a result of the emergence of US shale production, OPEC and Russia have more or less lost control of the world petroleum price.
One sector, tiny just 10 years ago, drives the crude market
The U.S. output of shale oil vs. the WTI crude petroleum price
21
0
15
30
45
60
75
90
105
120
135
0
1
2
3
4
5
6
7
8
9
Jan-07 Jan-09 Jan-11 Jan-13 Jan-15 Jan-17 Jan-19
WTI, $
pe
r barre
l
Ou
tpu
t fr
om
mai
n o
il fi
eld
s, m
n b
bl.
/day
Total U.S. shale oil output, million bbl./day WTI, $/bbl (RH axis)
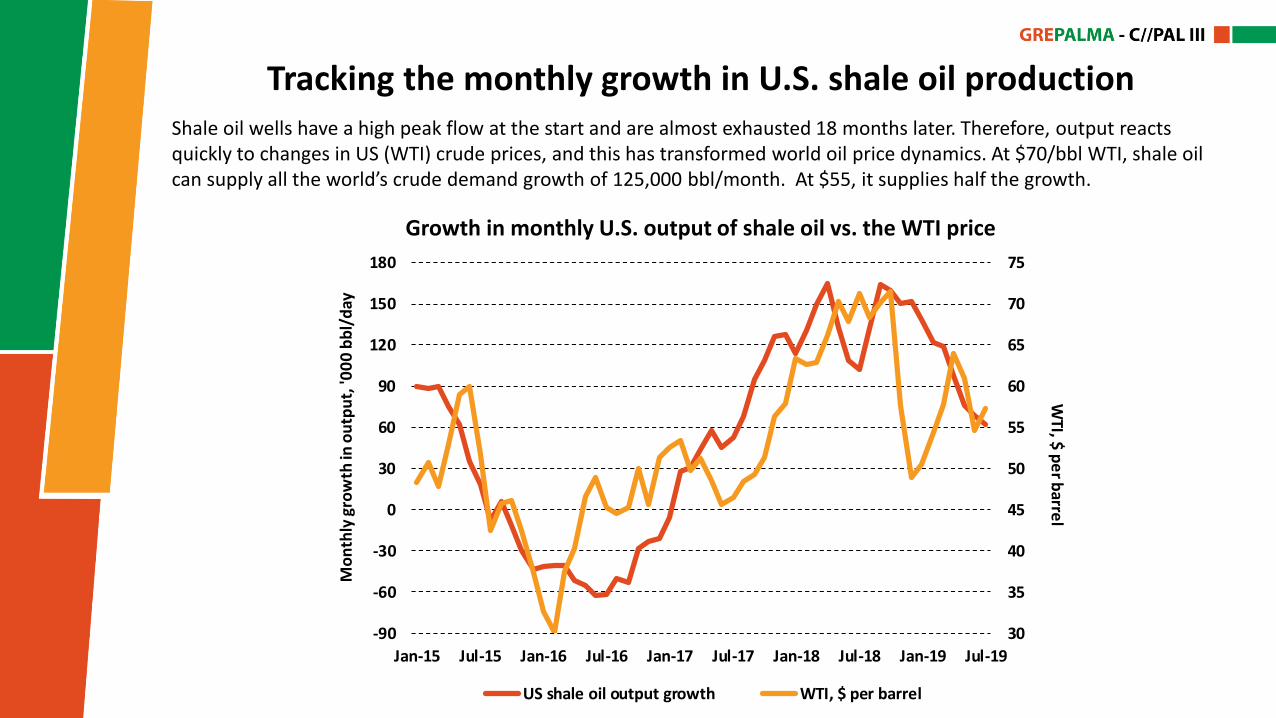
Shale oil wells have a high peak flow at the start and are almost exhausted 18 months later. Therefore, output reacts quickly to changes in US (WTI) crude prices, and this has transformed world oil price dynamics. At $70/bbl WTI, shale oil can supply all the world’s crude demand growth of 125,000 bbl/month. At $55, it supplies half the growth.
Tracking the monthly growth in U.S. shale oil production
Growth in monthly U.S. output of shale oil vs. the WTI price
22
30
35
40
45
50
55
60
65
70
75
-90
-60
-30
0
30
60
90
120
150
180
Jan-15 Jul-15 Jan-16 Jul-16 Jan-17 Jul-17 Jan-18 Jul-18 Jan-19 Jul-19
WTI, $
pe
r barre
l
Mo
nth
ly g
row
th in
ou
tpu
t, '0
00
bb
l/d
ay
US shale oil output growth WTI, $ per barrel

1. You should divide your analysis of vegetable oil prices into two main parts. First, you must study and do your best to understand what drives world crude oil prices. Then you must analyse the behaviour of the premium of the individual vegetable oils, among which palm oil is by far the most important, above the crude oil price.
2. For palm oil, the monthly MPOB stock figure is the main indicator that the market follows as a guide to the global palm oil market balance.
3. For other vegetable oils, you must monitor their supply-demand balances in relation to the size of palm oil stocks. These determine their spreads over CPO, and these spreads persuade customers who are flexible in their choice of vegetable oils to switch between these oils. (Remember: palm is the only oil crop that is processed immediately after harvesting. Other oil crops can be stored as seeds and are only crushed when there is a demand for their products.)
4. Looking ahead, unless the Middle East explodes, crude oil is now led by US shale. The EU CPO price floor will be where WTI fluctuates between $55 and $70/bbl; with Brent $5/bbl. higher.
5. Later this year, Malaysian palm oil stocks will rise on a seasonal basis, keeping the CPO price in check, but as we get into 2020, its stocks will fall, helped by the large rise in Indonesia’s biodiesel mandate, and this will pull CPO further above crude oil prices per tonne.
Conclusions from my presentation
23

THANK YOU VERY MUCH FOR YOUR KIND ATTENTION
Oxford New York Kuala Lumpur
4th Floor, Clarendon House52 Cornmarket Street
Oxford OX1 3HJ
UK
1350 Avenue of the Americas, Floor 2New York, NY 10019
USA
SO-30-8Menara 1
No3 Jalan BangsarKL Eco City
59200 Kuala LumpurMalaysia
T +44 1865 791737F +44 1865 791739
T +1 (212) 586-2427F +1 (212) 257-6441
T +603 2202 1414
[email protected] [email protected] [email protected]
www.Lmc.co.uk
This presentation and its contents are to be held confidential by the client, and are not to be disclosed, in whole or in part, in any manner, to a third party without the prior written consent of LMC International.
While LMC has endeavoured to ensure the accuracy of the data, estimates and forecasts contained in this presentation, any decisions based on them (including those involving investment and planning) are at the client’s own risk.
LMC International can accept no liability regarding information analysis and forecasts contained in this presentation.
© LMC International, 2019All rights reserved