The World of Moving Averages - NUS Investment Society · The World of Moving Averages ... •A...
39
The World of Moving Averages Du Yan (Technical Analysis & FOREX)
Transcript of The World of Moving Averages - NUS Investment Society · The World of Moving Averages ... •A...

The World of Moving Averages
Du Yan
(Technical Analysis & FOREX)

What is it?
• A moving average (MA) is a trend indicator that dynamically calculates the mean average of prices over a defined number of past periods
• Each period may be a minute, an hour or a day, etc.


20 SMA
20 SMA = Average closing prices of last 20
periods

20 SMA
20 EMA

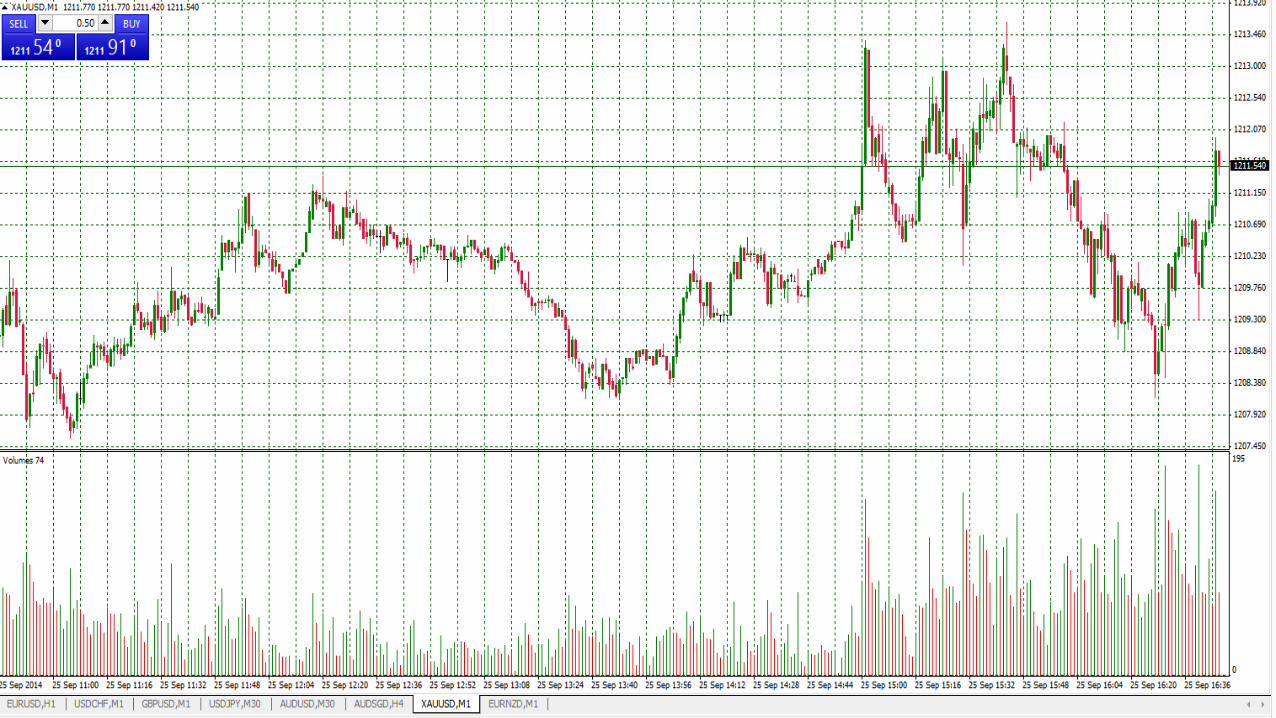
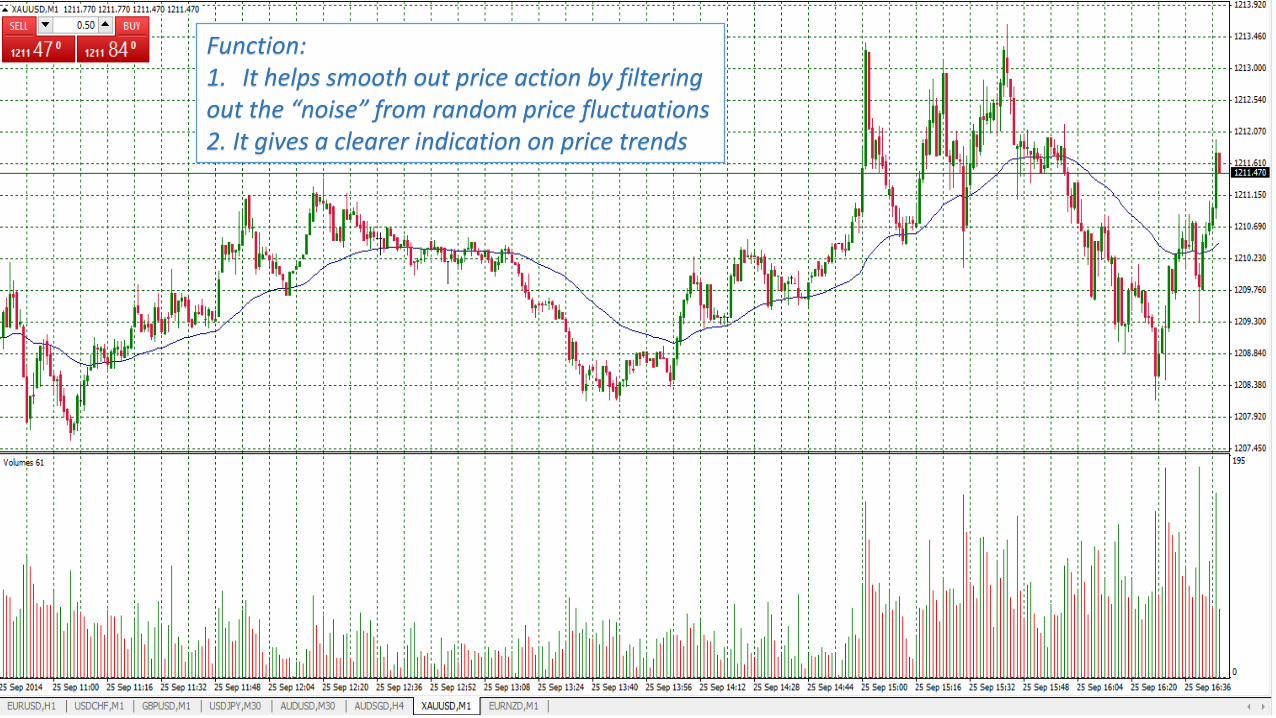
Function: 1. It helps smooth out price action by filtering out the “noise” from random price fluctuations 2. It gives a clearer indication on price trends

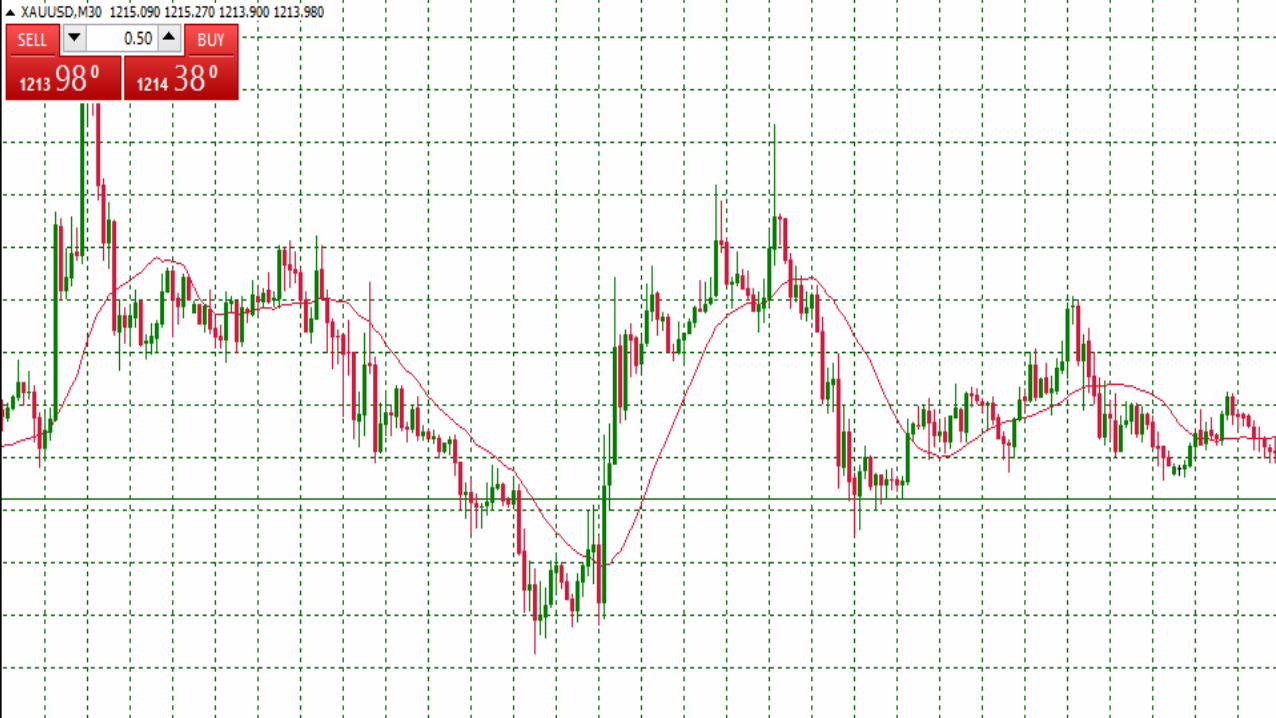
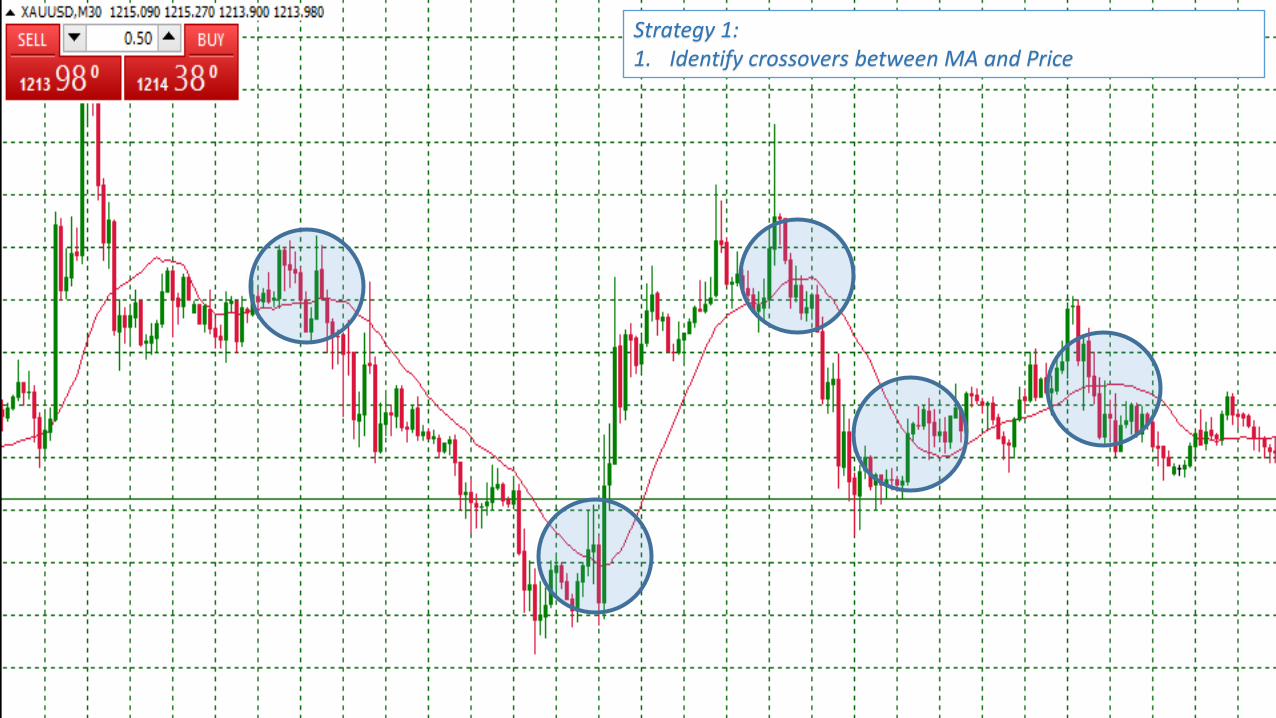
Strategy 1: 1. Identify crossovers between MA and Price
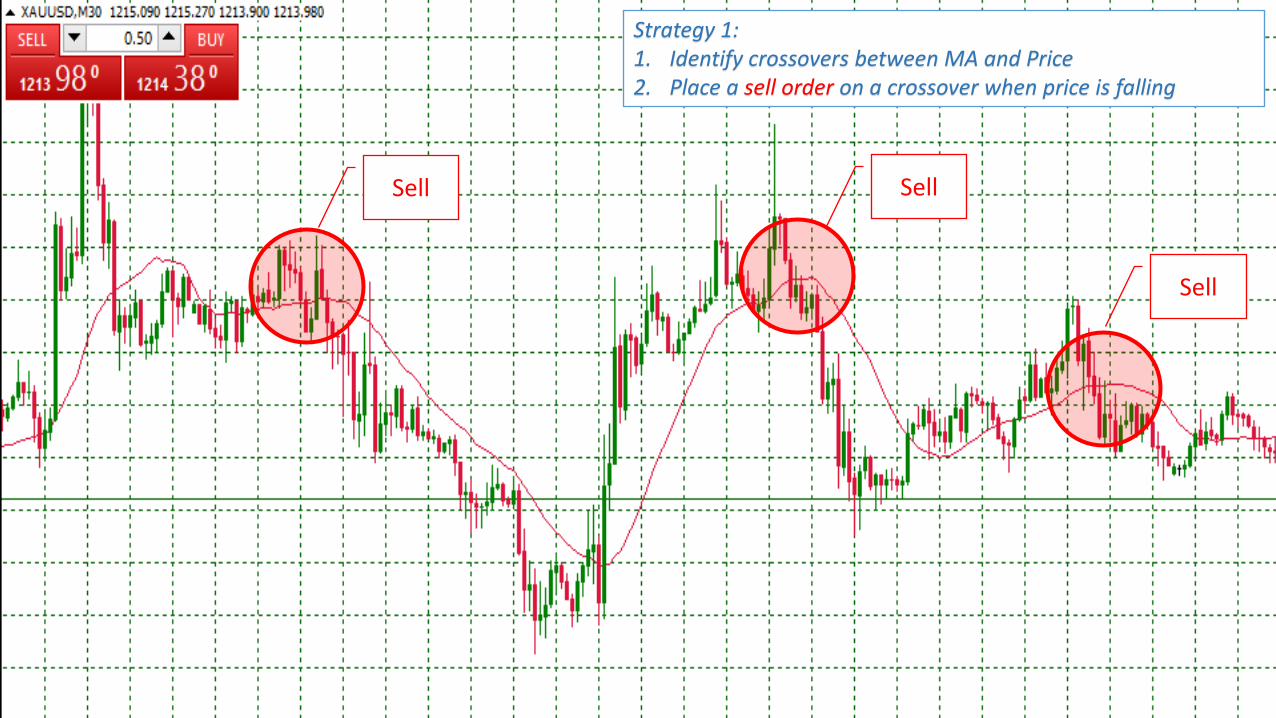
Sell Sell
Sell
Strategy 1: 1. Identify crossovers between MA and Price 2. Place a sell order on a crossover when price is falling
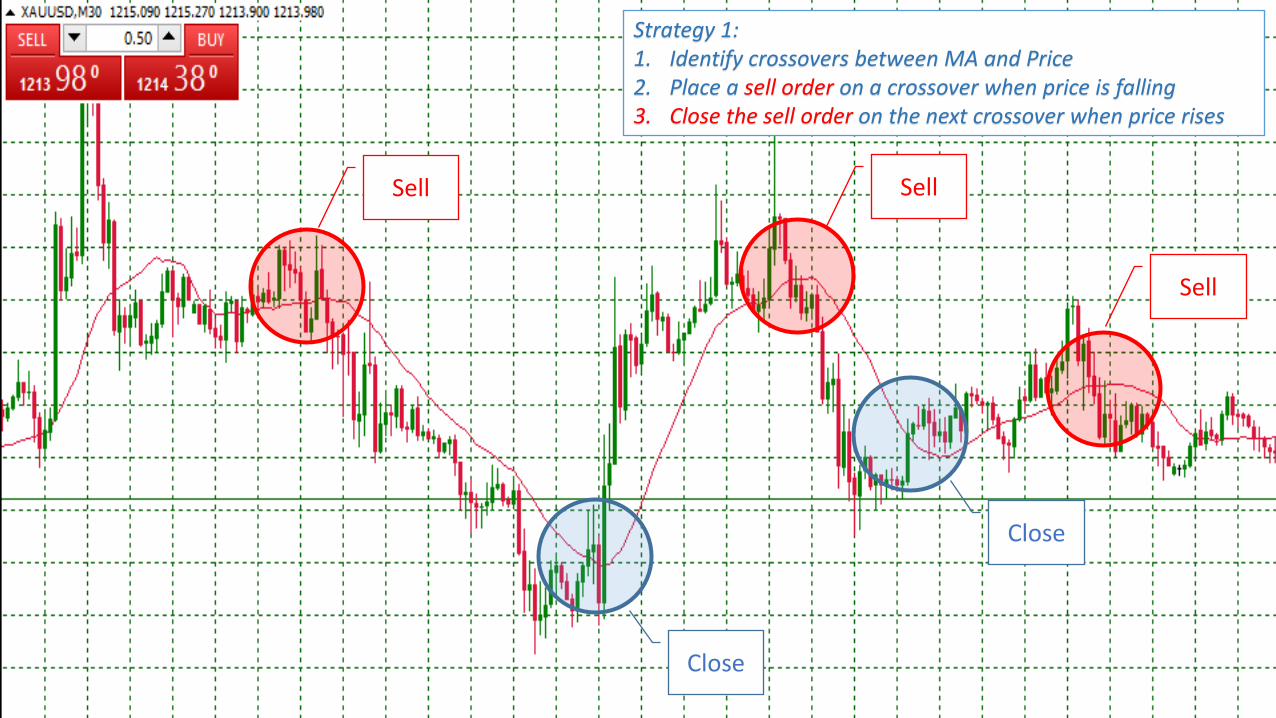
Strategy 1: 1. Identify crossovers between MA and Price 2. Place a sell order on a crossover when price is falling 3. Close the sell order on the next crossover when price rises
Sell Sell
Sell
Close
Close

Strategy 1: 1. Identify crossovers between MA and Price 2. Place a buy order on a crossover when price is rising
Buy
Buy
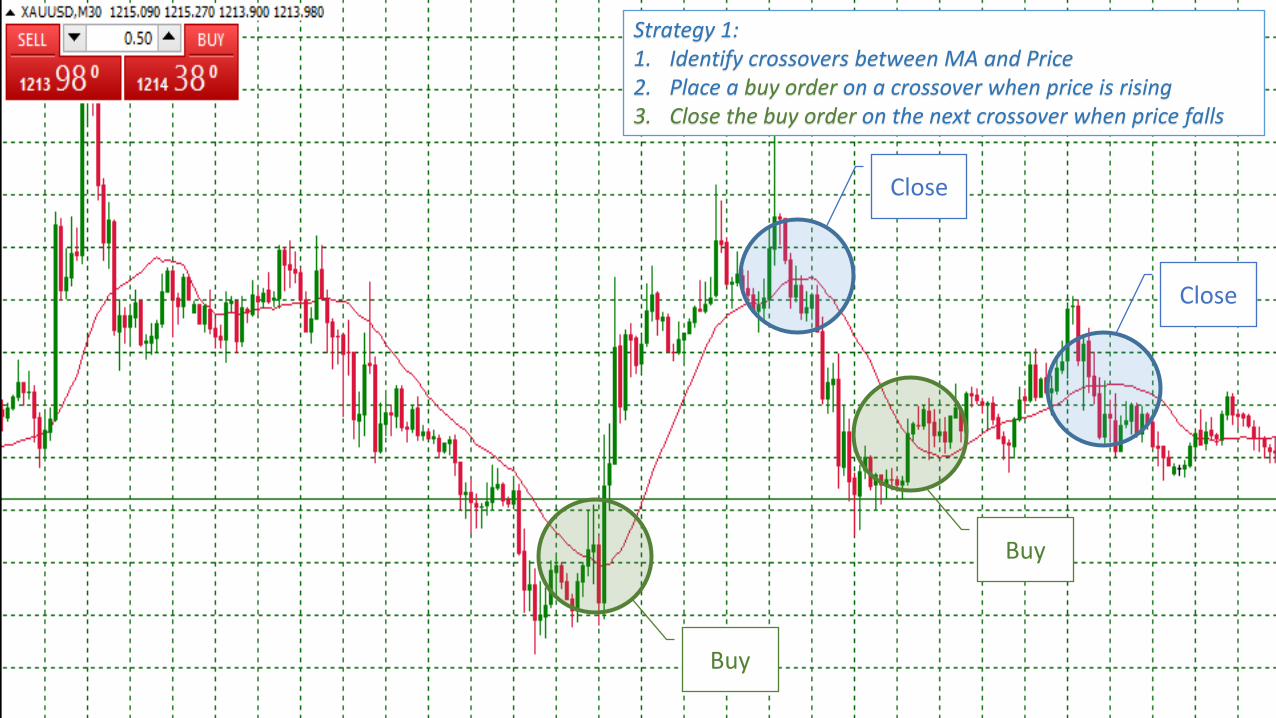
Strategy 1: 1. Identify crossovers between MA and Price 2. Place a buy order on a crossover when price is rising 3. Close the buy order on the next crossover when price falls
Buy
Buy
Close
Close

What about all these crossovers?

Strategy 2: 1. Use >1 MA (50 EMA & 20 EMA) to confirm trend reversal
20 EMA
50 EMA

Strategy 2: 1. Use several MAs (50 EMA & 20 EMA) 2. A strong trend reversal occurs when price cross all MAs and
MAs cross each other
MAs did not cross each other.
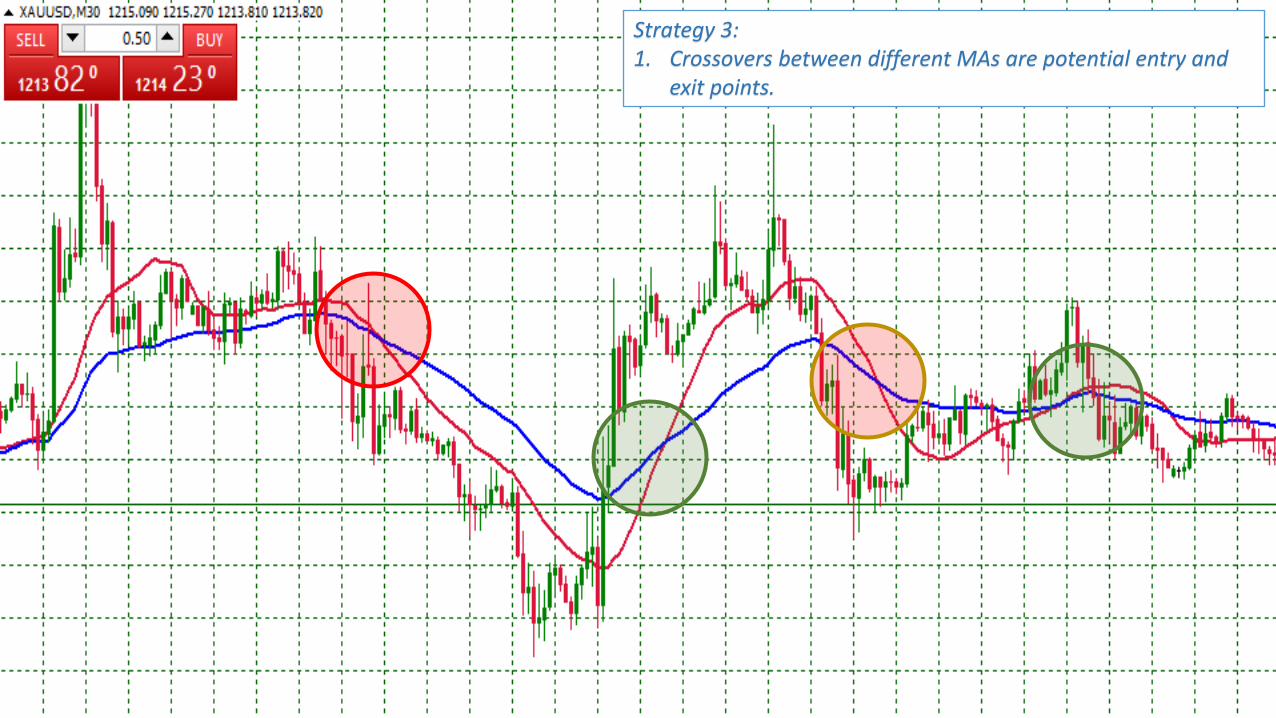
Strategy 3: 1. Crossovers between different MAs are potential entry and
exit points.
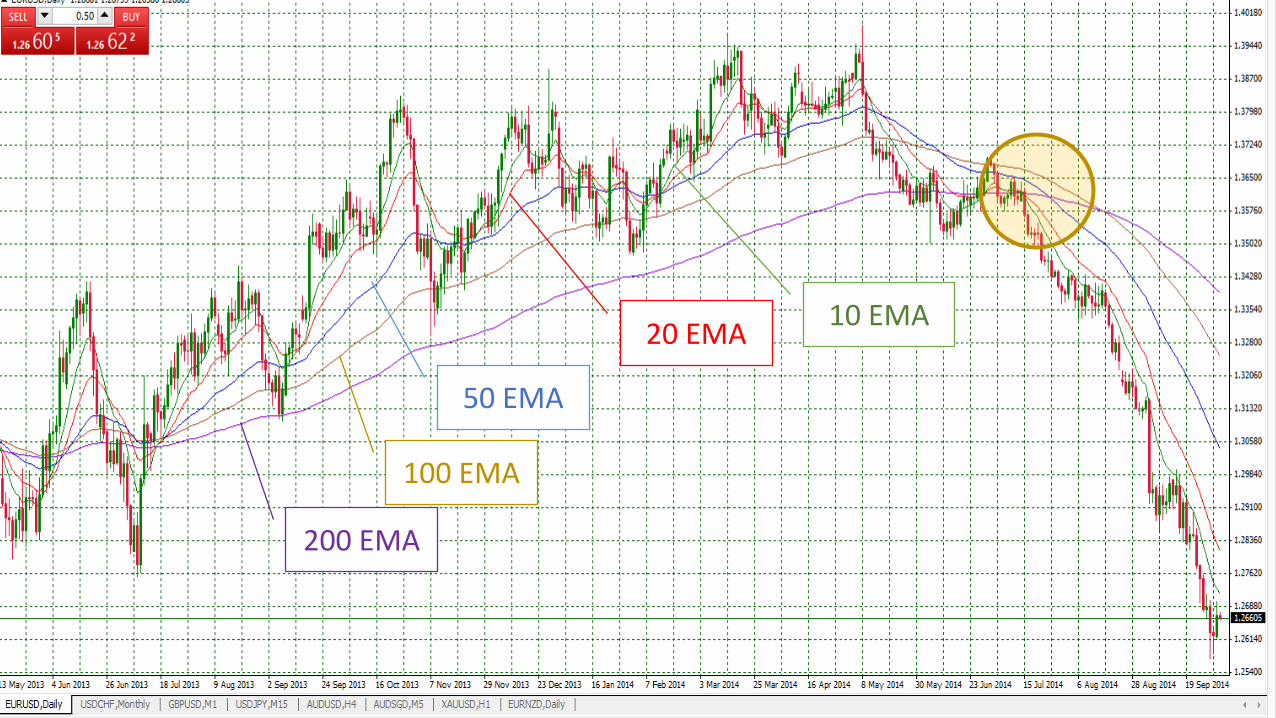
200 EMA
100 EMA
50 EMA
20 EMA 10 EMA
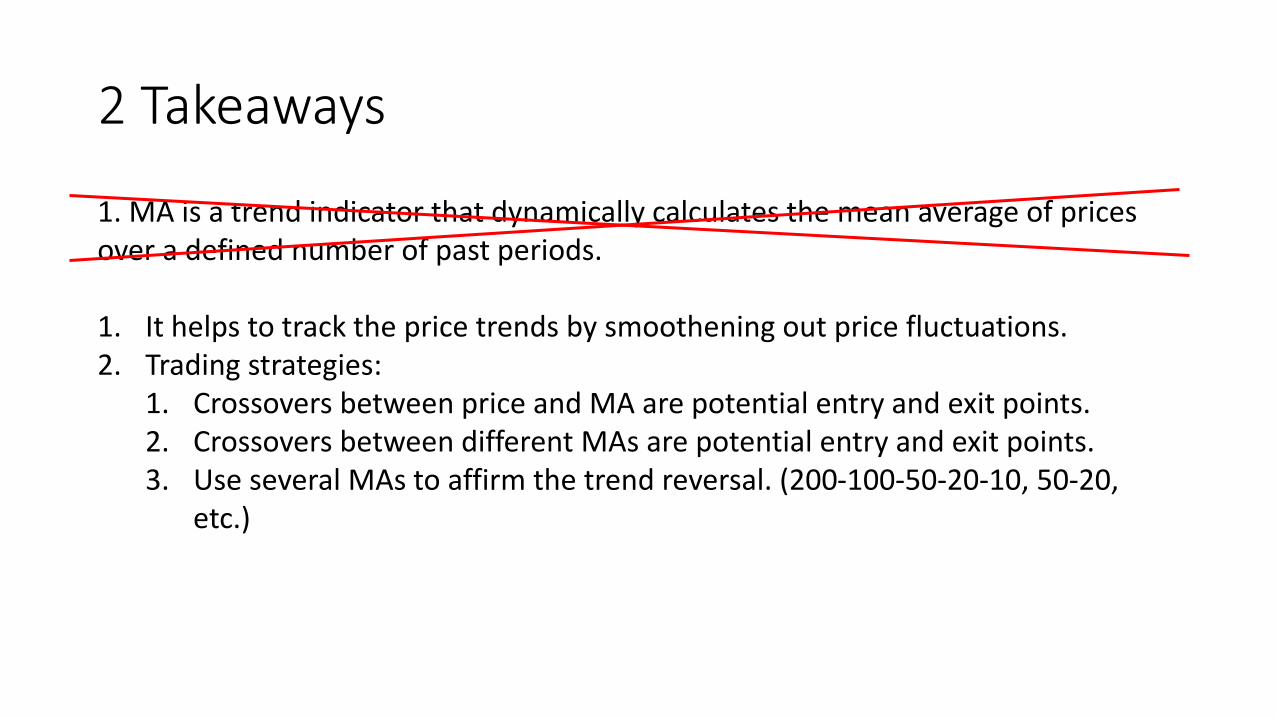
2 Takeaways
1. MA is a trend indicator that dynamically calculates the mean average of prices over a defined number of past periods.
1. It helps to track the price trends by smoothening out price fluctuations. 2. Trading strategies:
1. Crossovers between price and MA are potential entry and exit points. 2. Crossovers between different MAs are potential entry and exit points. 3. Use several MAs to affirm the trend reversal. (200-100-50-20-10, 50-20,
etc.)


MOVING AVERAGE CONVERGENCE
DIVERGENCE
or
MACD By Chia Yikai

MACD
12 EMA
26 EMA
-14 EMA

SIGNAL LINE – 9 SMA OF THE MACD
HISTOGRAM – DIFFERENCE BETWEEN MACD AND SIGNAL LINE
NOW I GET IT!
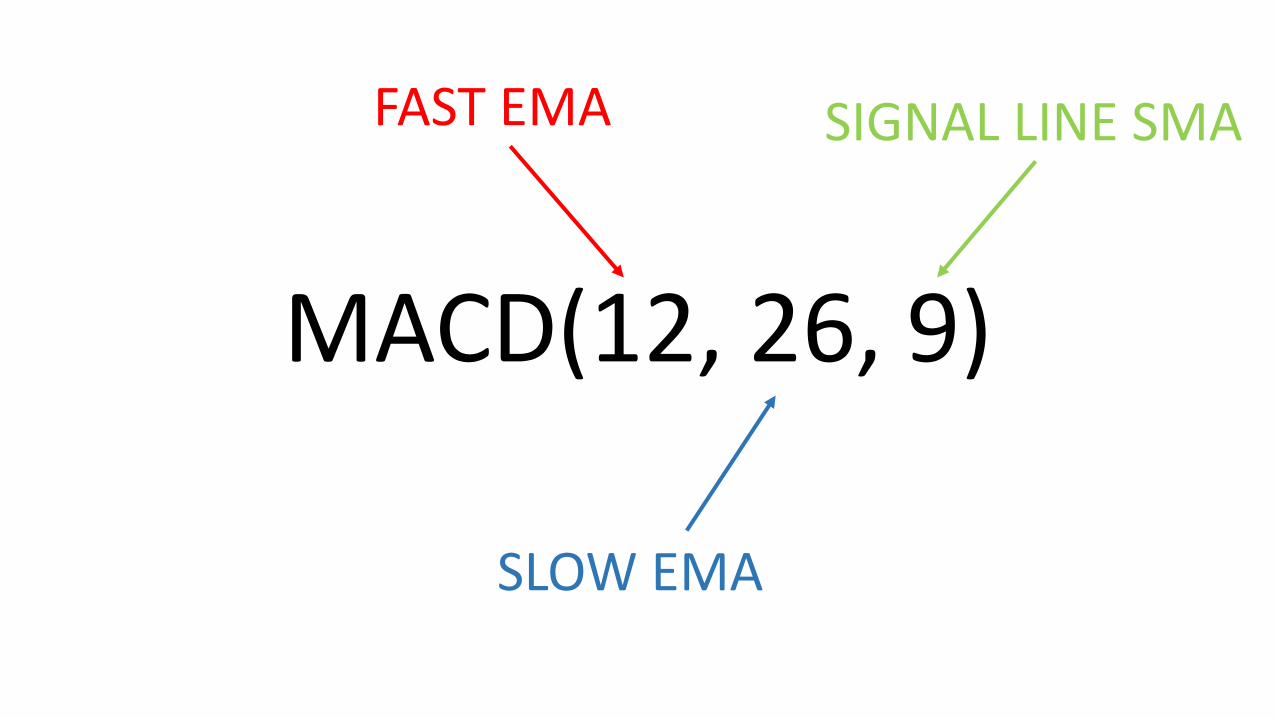
MACD(12, 26, 9)
FAST EMA
SLOW EMA
SIGNAL LINE SMA
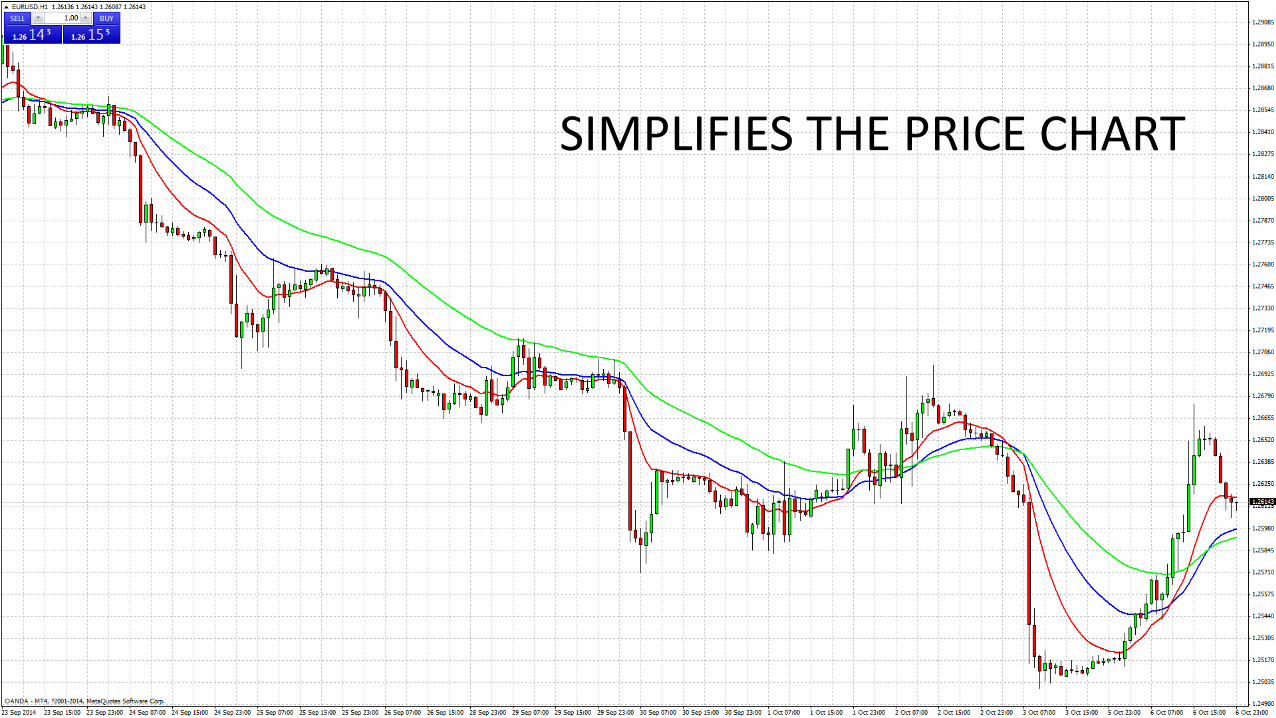
SIMPLIFIES THE PRICE CHART

SHOWS THE DIFFERENCE BETWEEN TWO MOVING AVERAGES
SMOOTHENS THE MACD
SHOWS THE DIFFERENCE BETWEEN THE MACD AND THE SIGNAL LINE
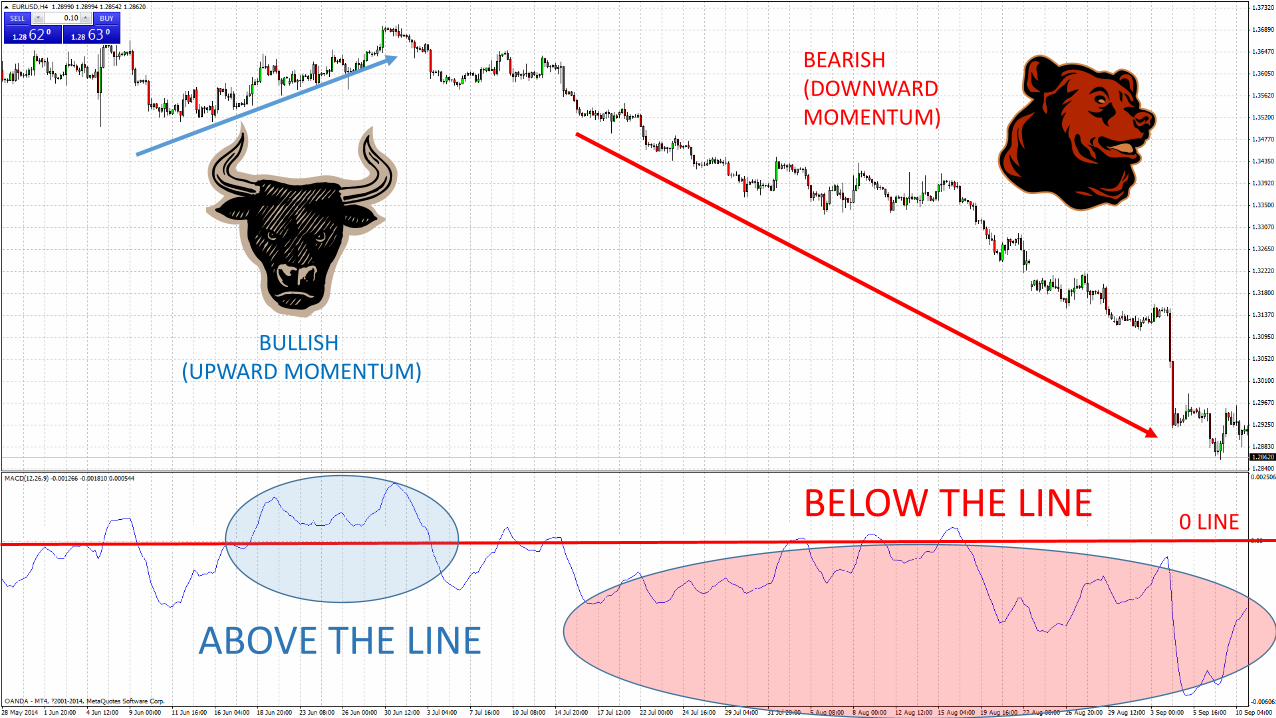
0 LINE
ABOVE THE LINE
BULLISH (UPWARD MOMENTUM)
BELOW THE LINE
BEARISH (DOWNWARD MOMENTUM)
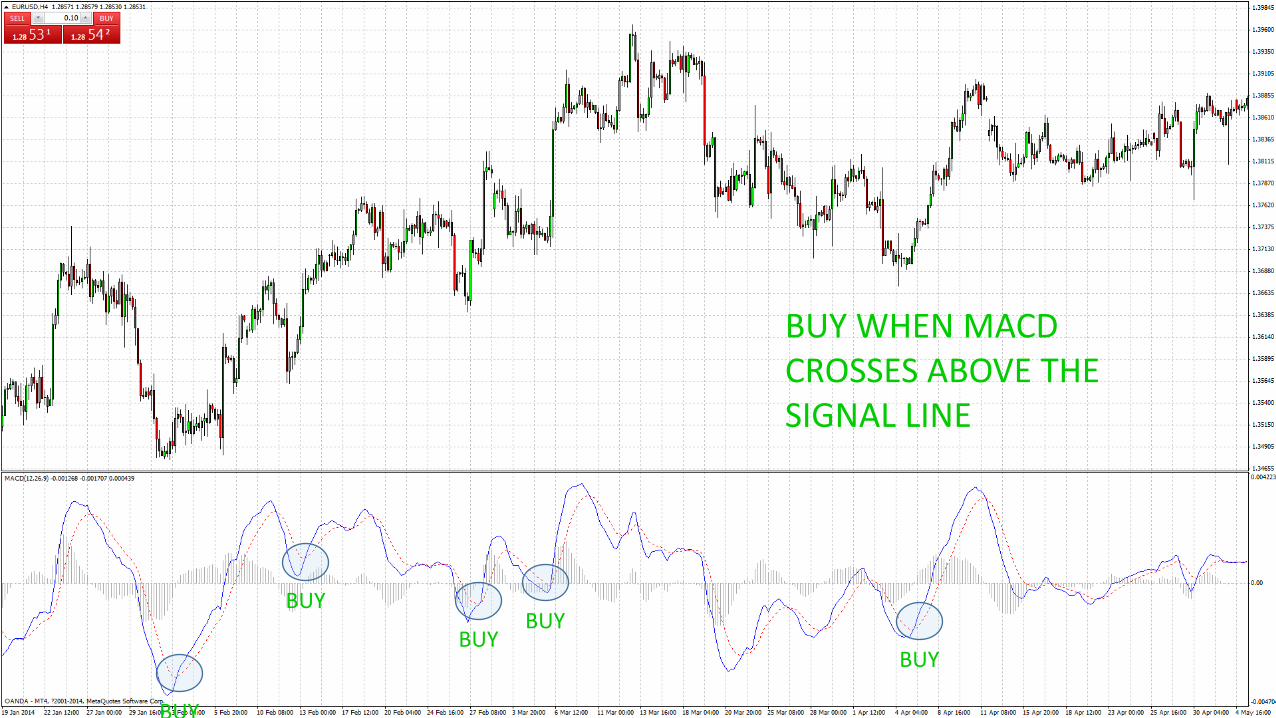
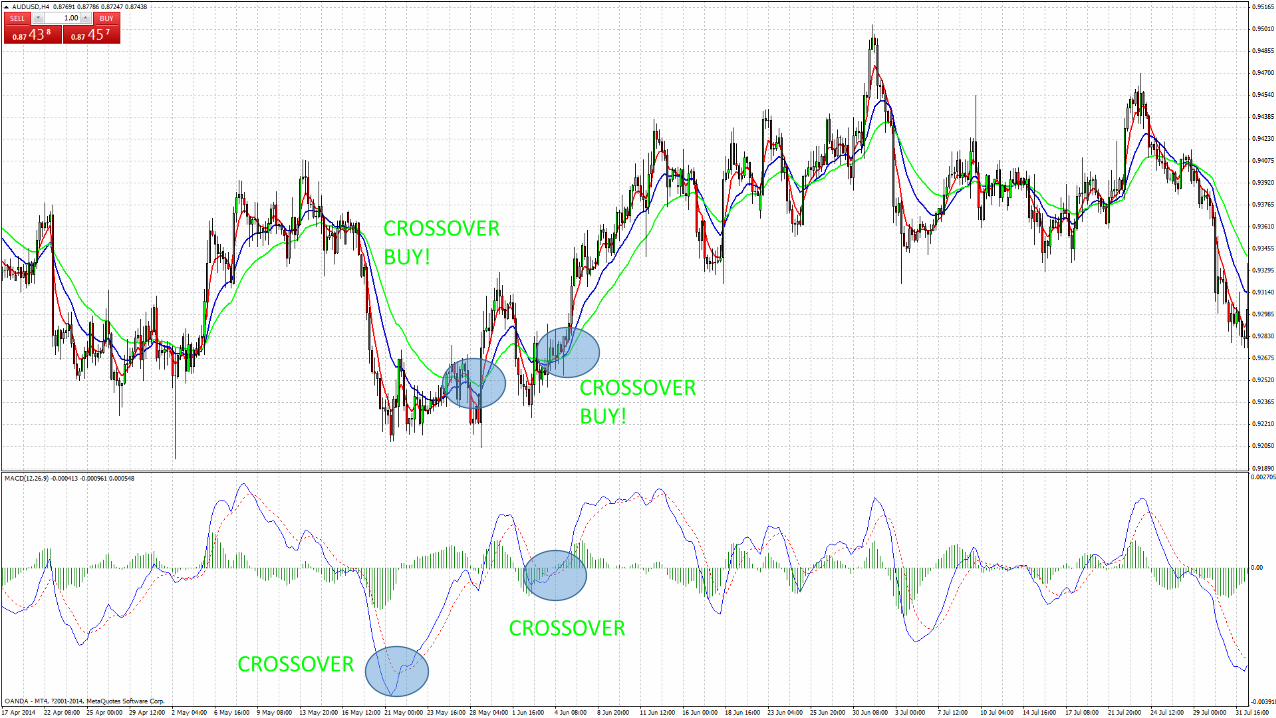
BUY WHEN MACD CROSSES ABOVE THE SIGNAL LINE
BUY
BUY
BUY BUY
BUY
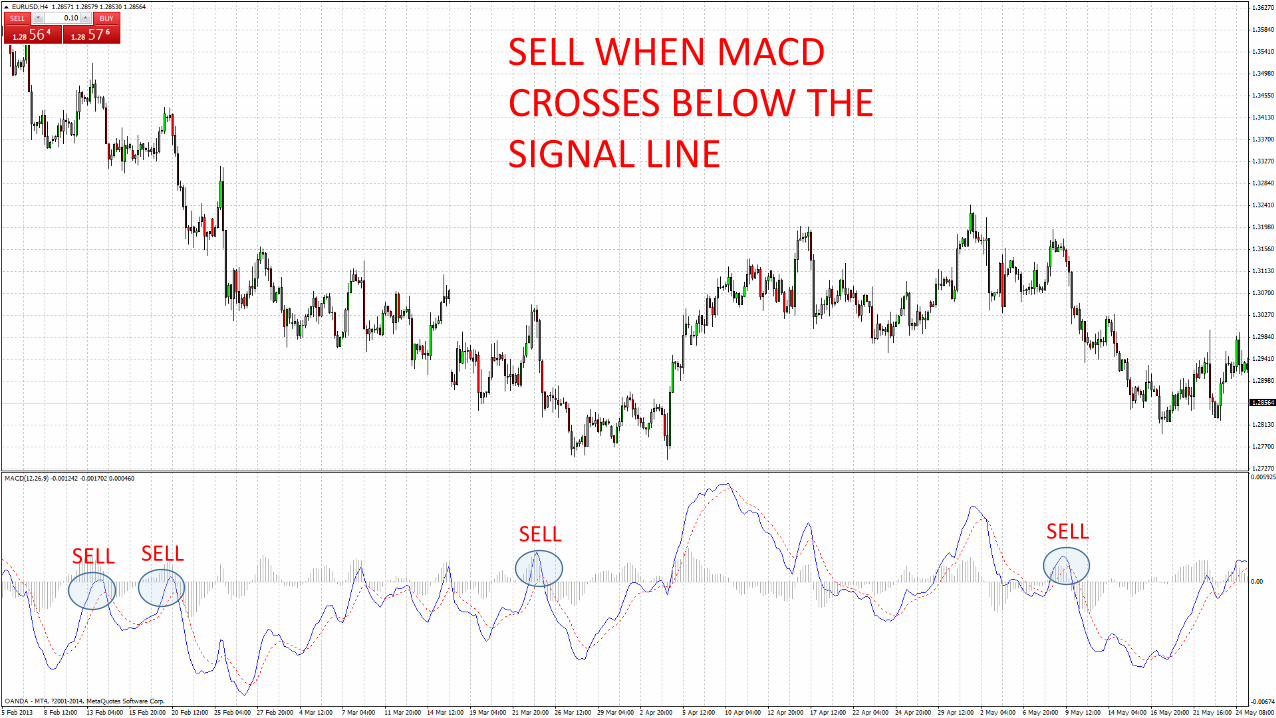
SELL WHEN MACD CROSSES BELOW THE SIGNAL LINE
SELL SELL SELL SELL
MACD IS NOT
FOOLPROOF

PRICE DROPPED

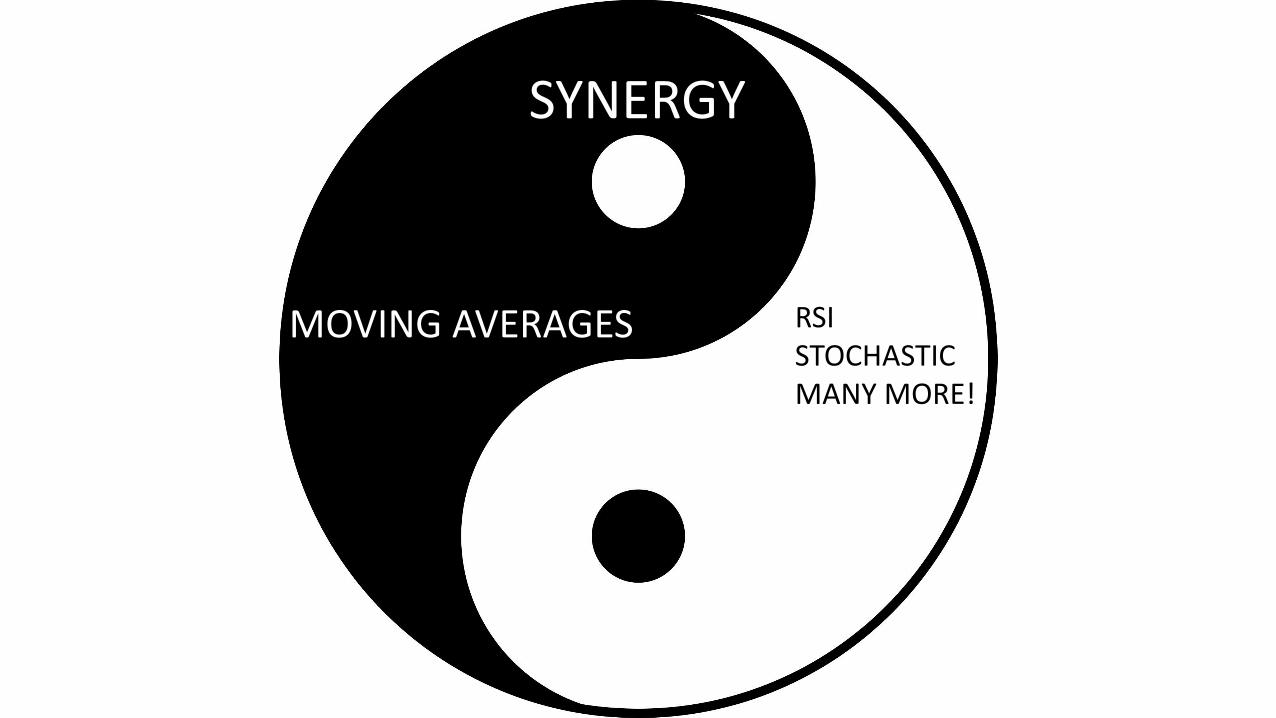
SYNERGY
MOVING AVERAGES RSI STOCHASTIC MANY MORE!

CROSSOVER
CROSSOVER SELL!
CROSSOVER BUY!
CROSSOVER
CROSSOVER
CROSSOVER BUY!
CROSSOVER
CROSSOVER BUY!

THANK YOU
AND
HAPPY TRADING!