The World of International Economics - web.uconn.eduweb.uconn.edu/ahking/Econ3422Chap1.pdf ·...
25
The World of International Economics Copyright © 2010 by The McGraw-Hill Companies, Inc. All rights reserved. McGraw-Hill/Irwin Chapter 1
Transcript of The World of International Economics - web.uconn.eduweb.uconn.edu/ahking/Econ3422Chap1.pdf ·...

The World of
International
Economics
Copyright © 2010 by The McGraw-Hill Companies, Inc. All rights reserved.McGraw-Hill/Irwin
Chapter 1
1-2
Introduction
International trade and finance have never been
more important.
Signs of globalization are everywhere.

1-4
International Finance Questions:
We’ll explore these questions:
• What is a country’s balance of payments? (Chap. 19)
• How are exchange rates determined? (Chaps. 20 –
22)
• What macroeconomic effects does trade cause?
(chaps. 23 -24)
• How policies differ under fixed vs. flexible rates?
(Chaps. 25 – 27)
• What policies (fixed vs. flexible exchange rate)
should countries pursue? (Chap. 28 – 29)

1-55
Chapter Objectives
1. Why international trade?
2. Facts about world merchandise trade
Geographical Composition of Trade
Commodity Composition of Trade
3. World trade in service
4. Facts about the international trade of the United States
5. Growing importance and interdependence of trade
6. World trade in Assets

1-6
The Nature of Merchandise Trade
The volume and value of world exports have
grown tremendously.
The value of global exports was $15.8 trillion in
2008; it was $2 trillion in 1985.
Over the past 40 years, global trade has grown
faster than global production (Table 1).
• This means that more and more of the final
goods produced are being exported

1-7
1-9
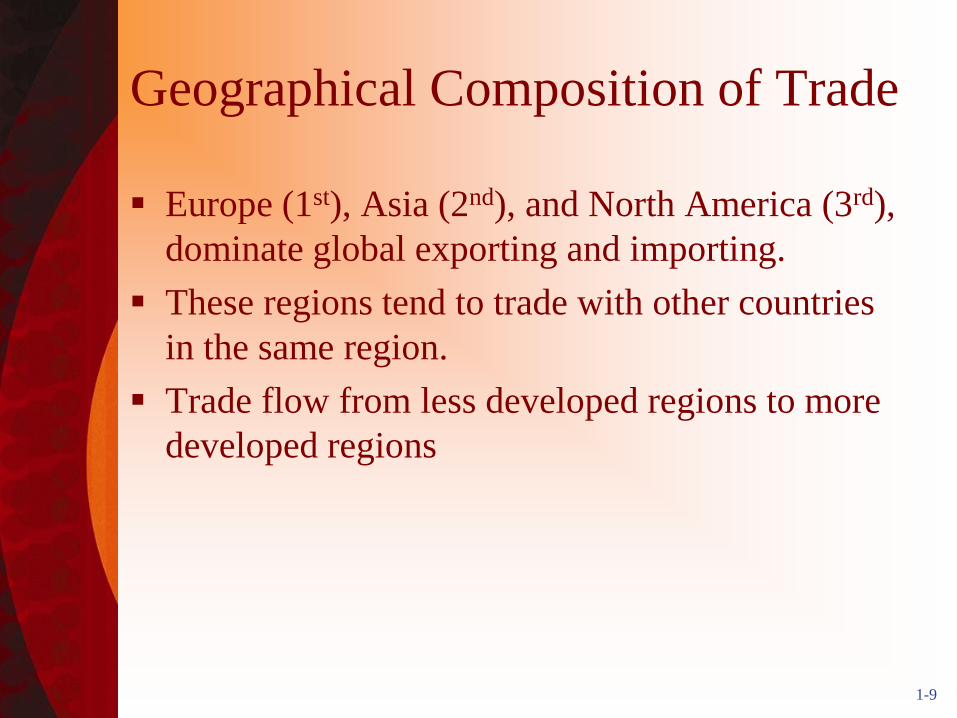
Geographical Composition of Trade
Europe (1st), Asia (2nd), and North America (3rd),
dominate global exporting and importing.
These regions tend to trade with other countries
in the same region.
Trade flow from less developed regions to more
developed regions

1-10
Merchandise Exports and Imports by Region, 2007 (billions of dollars)
Value of Exports Share Value of Imports Share
North America $1,853.5 13.3% 2,707.5 19.0%
South and Central America 499.2 3.6 456.0 3.2
Europe 5,772.2 41.4 6,060.8 42.5
Commonwealth of Indep. States 510.3 3.7 377.6 2.7
Africa 424.1 3.0 358.9 2.5
Middle East 759.9 5.4 479.3 3.4
Asia 4,131.0 29.6 3,804.3 26.7
World $13,950.0 100.0% $14,244.0 100.0%

1-11

1-12
Top 10 Merchandise Exporters, 2007
Value
$, billions, Percentage
Country Share
Germany $1,326.4 9.5%
China 1,217.8 8.7
United States 1,162.5 8.3
Japan 712.8 5.1
France 553.4 4.0
Netherlands 551.3 4.0
Italy 491.5 3.5
United Kingdom 437.8 3.1
Belgium 430.8 3.1
Canada 419.0 3.0

1-13
Top 10 Merchandise Importers, 2007
Value
$, billions, Percentage
Country Share
United States $2,020.4 14.2%
Germany 1,058.6 7.4
China 956.0 6.7
Japan 621.1 4.4
United Kingdom 619.6 4.4
France 615.2 4.3
Italy 504.5 3.5
Netherlands 491.6 3.5
Belgium 413.2 2.9
Canada 389.6 2.7
1-15
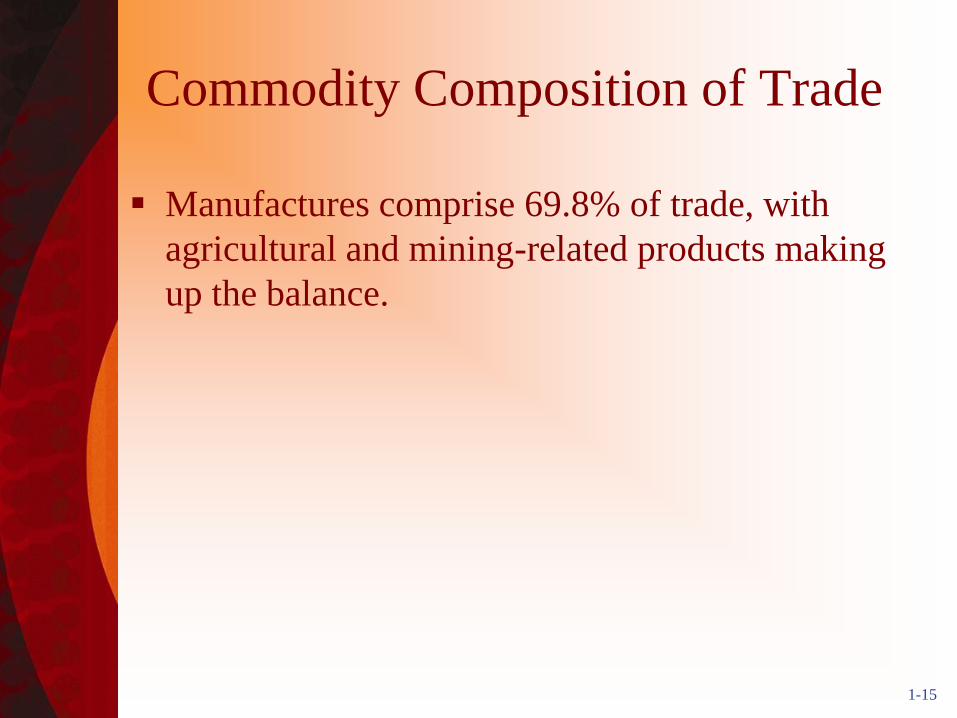
Commodity Composition of Trade
Manufactures comprise 69.8% of trade, with
agricultural and mining-related products making
up the balance.

1-16
Composition of World Merchandise Exports
(billions of U.S. $)
Product Category Value in
2007
Share in
2007
Share in
1980
Agricultural Products $1,128 8.3% 14.7%
Mining Products $2,659 19.5% 27.7%
Manufactures $9,500 69.8% 53.9%

1-17
Trade and the U.S.
The U.S. trades the most with our NAFTA
partner, Canada , followed by China, and then
Mexico
Top three trading (exports + imports) regions are
Asia, North America, and EU countries.
1-18
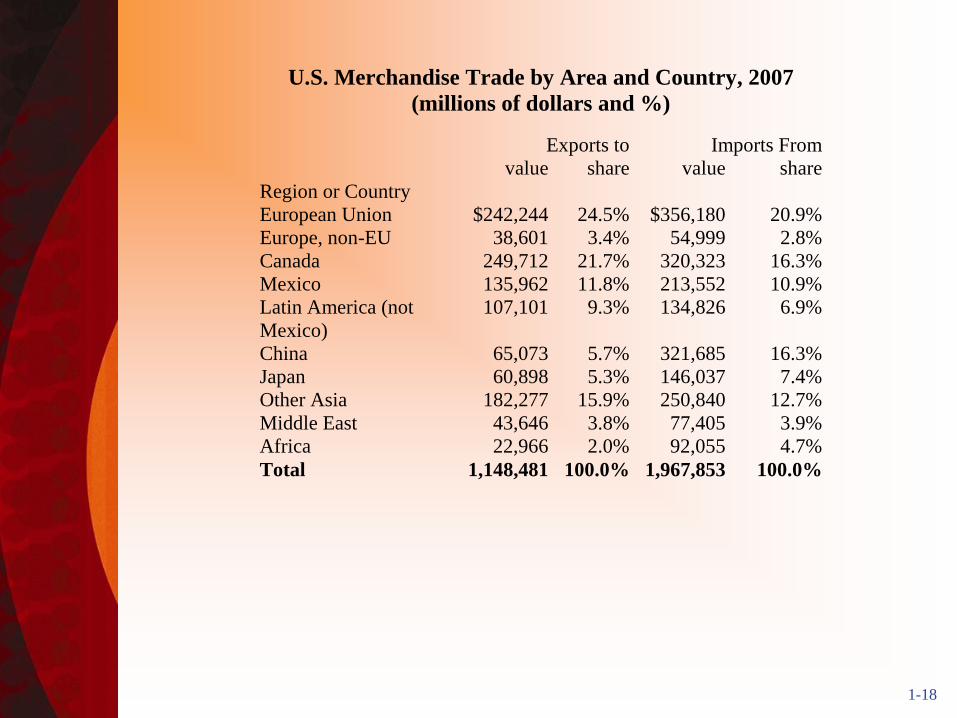
U.S. Merchandise Trade by Area and Country, 2007
(millions of dollars and %)
Exports to Imports From
value share value share
Region or Country
European Union $242,244 24.5% $356,180 20.9%
Europe, non-EU 38,601 3.4% 54,999 2.8%
Canada 249,712 21.7% 320,323 16.3%
Mexico 135,962 11.8% 213,552 10.9%
Latin America (not
Mexico)
107,101 9.3% 134,826 6.9%
China 65,073 5.7% 321,685 16.3%
Japan 60,898 5.3% 146,037 7.4%
Other Asia 182,277 15.9% 250,840 12.7%
Middle East 43,646 3.8% 77,405 3.9%
Africa 22,966 2.0% 92,055 4.7%
Total 1,148,481 100.0% 1,967,853 100.0%

1-19
Commodity Composition of U.S.
Trade
The U.S. tends to export capital goods and
industrial supplies.
The U.S. tends to import consumer goods and
industrial supplies.

1-20
Commodity Composition of U.S. Trade, 2007
(billions of dollars and %)
Exports to Imports From
value share value share
Foods, feeds, beverages $84.3 7.3% $81.7 4.2%
Industrial supplies/materials 316.4 27.5% 639.4 32.5%
Capital goods (non-auto) 447.4 39.0% 444.5 22.6%
Automotive 121.0 10.5% 258.9 13.2%
Consumer goods 146.1 12.7% 478.5 24.3%
Other goods 33.3 2.9% 64.9 3.3%
Total 1,148.5 100.0% 1,967.9 100.0%

1-21

1-22

1-23
Trade in Services
Over $3 trillion annually (2007).
About 20% of total trade (closer to 30% for
U.S.).
The industrialized countries also dominate.
Growing faster than world trade in merchandise
since the 1970s, since the major trading
countries’ economies are now more service
oriented.

1-24

1-27
The Changing Degree on Economic
Interdependence
The relative importance of trade has grown for
most countries.
The relative importance of trade for all countries
together has also grown.
International Interdependence ratio (roughly
export of goods and services as a % of GDP)

1-28
International Interdependence for Selected Countries and Groups of
Countries, 1970 – 2007 (exports as a % of GDP)
1970 2007
Industrialized Countries:
Australia 14% 21%
Belgium 52% 89%
Canada 23% 36%
France 16% 27%
Germany NA 47%
Italy 16% 29%
Japan 11% 16%
Netherlands 42% 75%
United Kingdom 23% 26%
United States 6% 11%
Developing Countries:
Argentina 9% 25%
Chile 15% 47%
China 3% 42%
Czech Republic NA 80%
India 4% 21%
Kenya 30% 26%
Mexico 6% 28%
Nigeria 8% 40%

1-29
World trade in assets
World financial markets are becoming more integrated, i.e., countries become more financially interdependent (Table 2, Chapter 19)
World trade in assets (capital flows)
• Increase in banks’ international lending
• Trade in stocks and bonds, foreign direct investment (FDI)

1-30
Chapter 19, Table 2