The world financial instability and the Euro zone crisis - Chapter 2 Jacques SAPIR CEMI-EHESS
18
The world financial instability and the Euro zone crisis - Chapter 2 Jacques SAPIR CEMI-EHESS
-
Upload
sierra-king -
Category
Documents
-
view
24 -
download
0
description
The world financial instability and the Euro zone crisis - Chapter 2 Jacques SAPIR CEMI-EHESS. 2. The sovereign debt issue. 1. The sovereign debt general increase in the Euro zone has been a direct consequence of the crisis. - PowerPoint PPT Presentation
Transcript of The world financial instability and the Euro zone crisis - Chapter 2 Jacques SAPIR CEMI-EHESS

The world financial instability and the Euro zone crisis -
Chapter 2
Jacques SAPIRCEMI-EHESS

2.
The sovereign debt issue

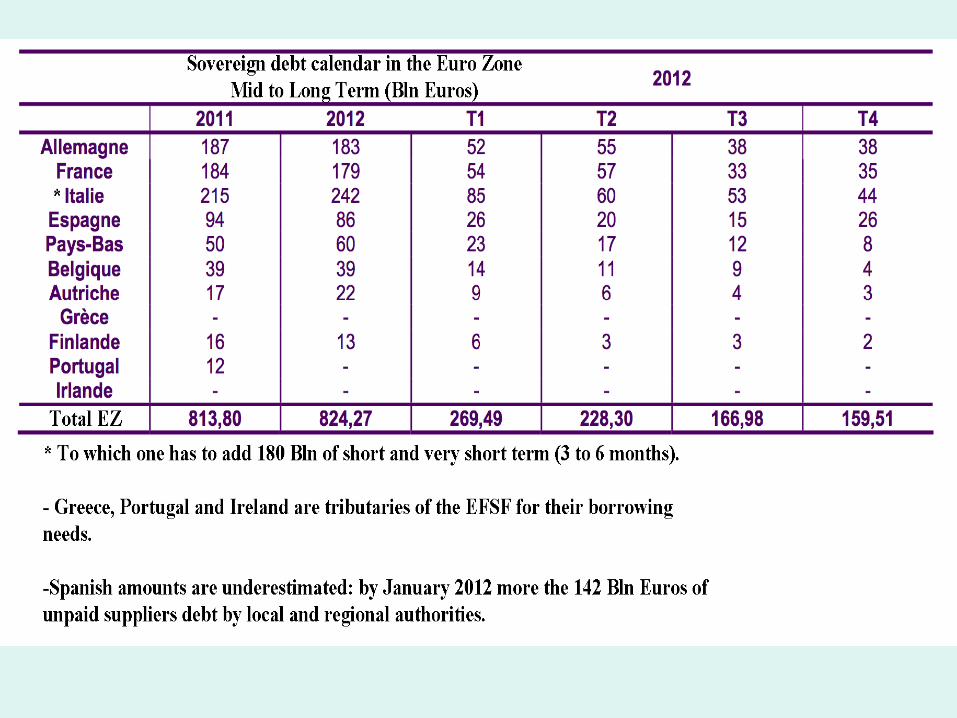
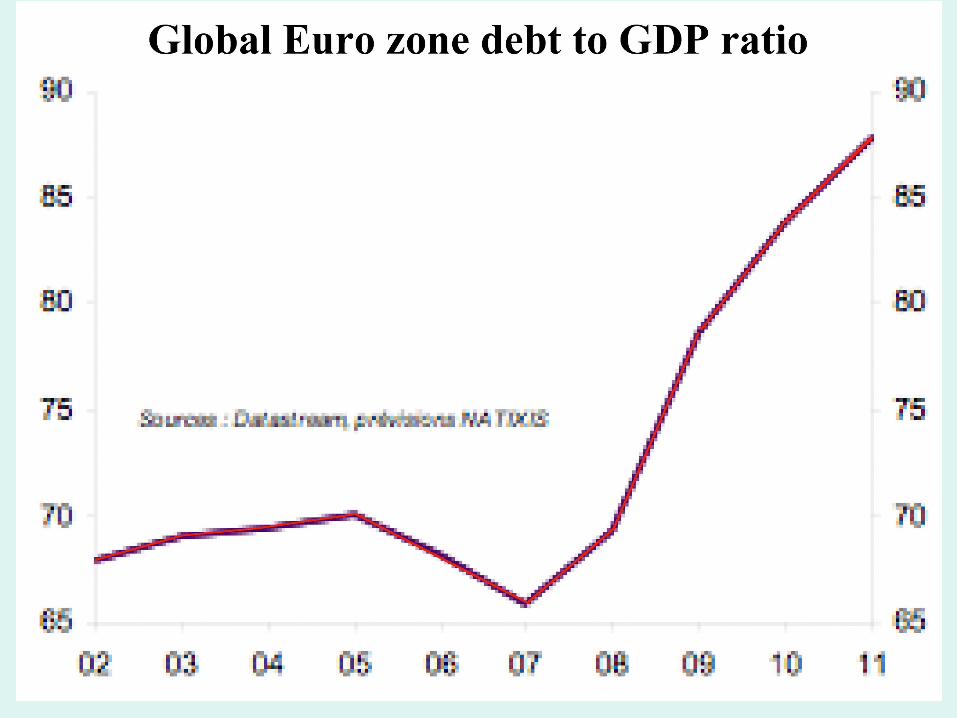
• 1. The sovereign debt general increase in the Euro zone has been a direct consequence of the crisis.
• A debt level inferior before the crisis to what was the situation in the USA and Japan.
– The specific US situation.
– The Japanese problem.
• A sharp reaction to the crisis.
• A typical “asymmetrical shock” situation?
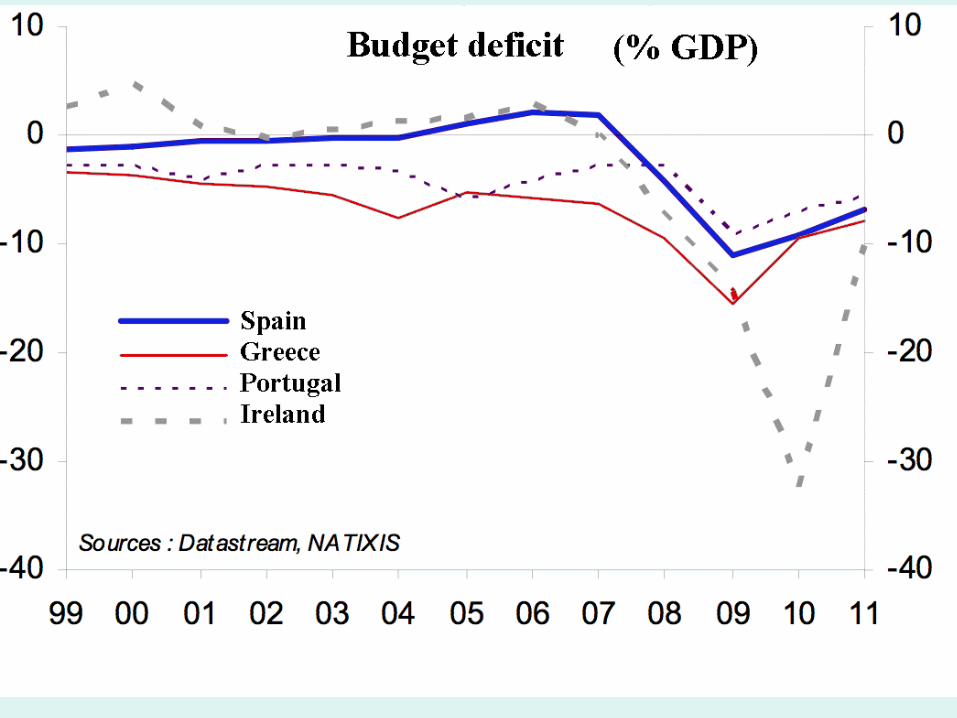

• 2. However economic divergence has played and important role.
• The Euro zone has been since its creation a low-growth zone among industrialized countries.
• Inflation has not been standardized despite the fact that monetary policy has been the same for every country.
• The burden of unemployment (in static and in dynamic) is not the same for every country.

Taux de croissance du PIB à prix constants. Moyenne par période Average 2001-2011 Average 2001-2007 Average 2007-2011 Australia 3,1% 3,4% 3,1% Canada 2,1% 2,6% 1,4% Norway 1,8% 2,3% 1,2% Sweden 1,8% 3,0% 0,5% Swyzerland 1,7% 2,0% 1,6% United Kingdom 1,6% 2,6% 0,4% USA 1,9% 2,4% 1,3% Euro Zone 1,1% 1,9% 0,4% OECD 1,8% 2,4% 1,1% SOURCES : Base de données de l’OCDE. Pour 2011, estimations. Pour 2010, chiffres provisoires. Sources et méthodes, (http://www.oecd.org/eco/sources-and-methods

Average inflation rate among Euro zone countries
Moyenne 2001-2007 Moyenne 2007-2011 Austria 1,7 1,4 Belgium 2,2 1,7 Finland 1,2 1,8 France 2,1 1,4 Germany 1,1 1,2 Greece 3,2 2,7 Irleand 3,2 -1,1 Italy 2,6 1,9 Luxembourg 3,6 1,8 Netherlands 2,6 1,4 Portugal 3,0 1,5 Spain 4,1 1,4
Zone Euro 2,2 1,4
Total OCDE 2,6 1,8
Dispersion data in the Euro zone
2001 2002 2003 2004 2005 2006 2007 2008 2009 2010 Average inflation rate 2,5 2,6 2,2 1,9 1,9 1,9 2,4 2,0 1,0 0,8 Standard deviation 58,5% 42,5% 72,2% 50,1% 58,6% 78,6% 28,8% 66,8% 147,9% 148,3% Source : OCDE et CEMI-EHESS
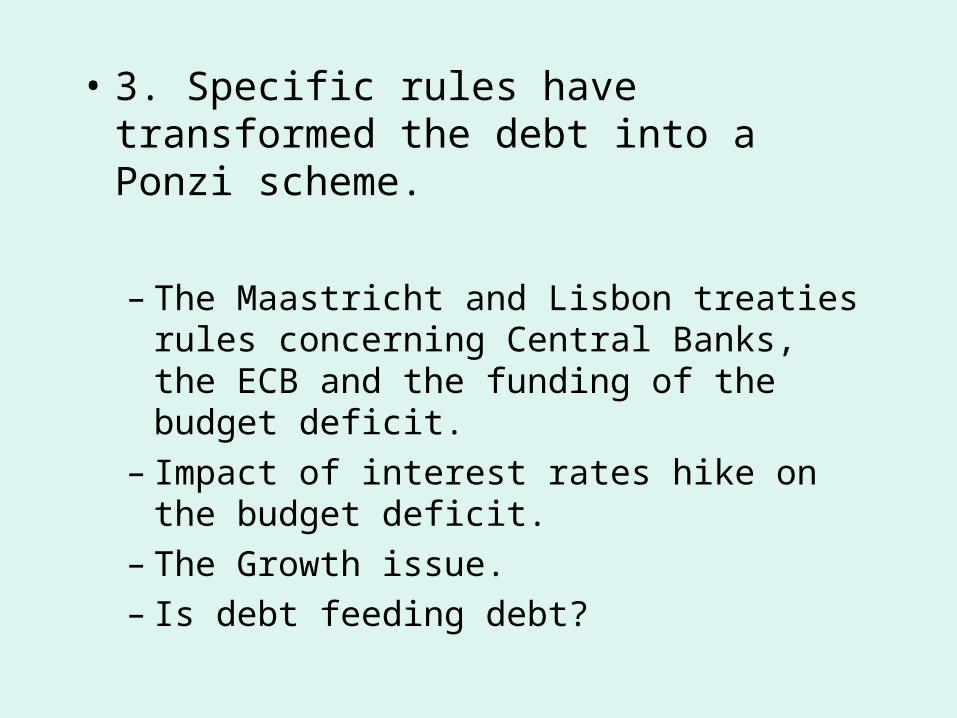
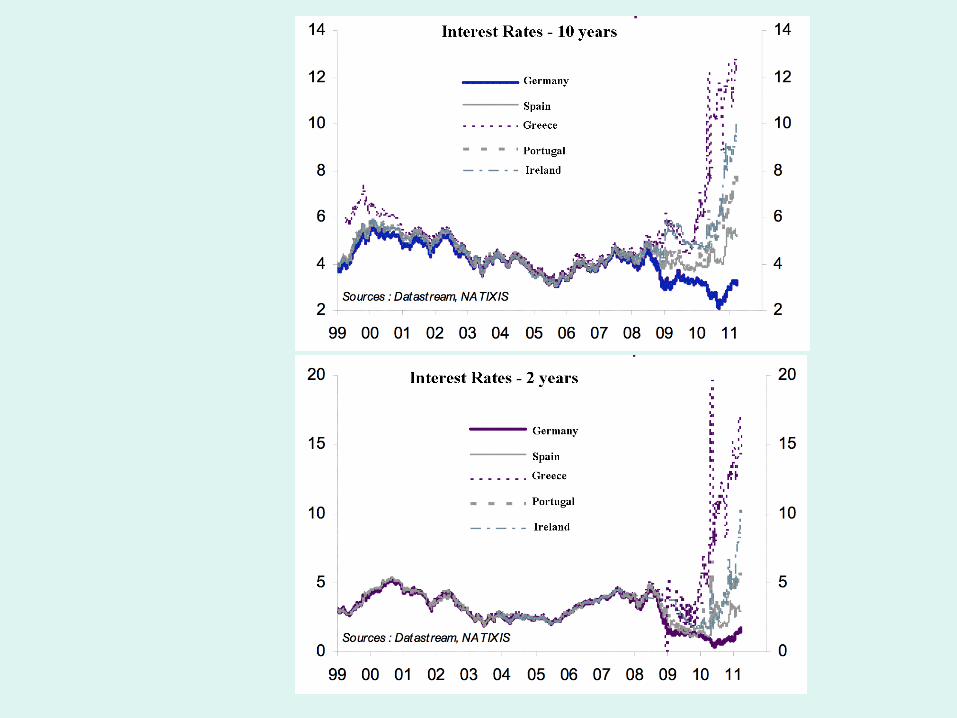
• 3. Specific rules have transformed the debt into a Ponzi scheme.
– The Maastricht and Lisbon treaties rules concerning Central Banks, the ECB and the funding of the budget deficit.
– Impact of interest rates hike on the budget deficit.
– The Growth issue.– Is debt feeding debt?


• 4. The Greek case.
– Was the huge increase of the debt to GDP ratio the result of the framing of data?
– What are income sources of the Greek economy.
– Rescue plans: n°1 and n°2.– What is the situation, now?– How could a default be avoided?


Total amount to be funded till 2019 under the current deficit assumptions
A B C Reinbursements Deficit Total
2012 31,28 20,65 51,93 2013 22,86 16,19 39,05 2014 31,32 11,52 42,84 2015 19,98 6,61 26,59 2016 13,35 6,91 20,26 2017 20,83 7,24 28,07 2018 9,83 7,57 17,40 2019 23,82 7,93 31,75 Total 173,27 84,62 257,89

• 5. Could the Euro zone adjust to the situation without breaking its back?– What is the actual situation?– Austerity plans and their cumulative effects.
– Historical precedents.» Germany (Brünning)
» GB (MacDonald)
– The comparison with Russia (1993-1998).
– The deflationary spiral.– Budget Cuts are inducing massive a recession.
– The recession is inducing a contraction of Budget revenues.
– Is there a solution?
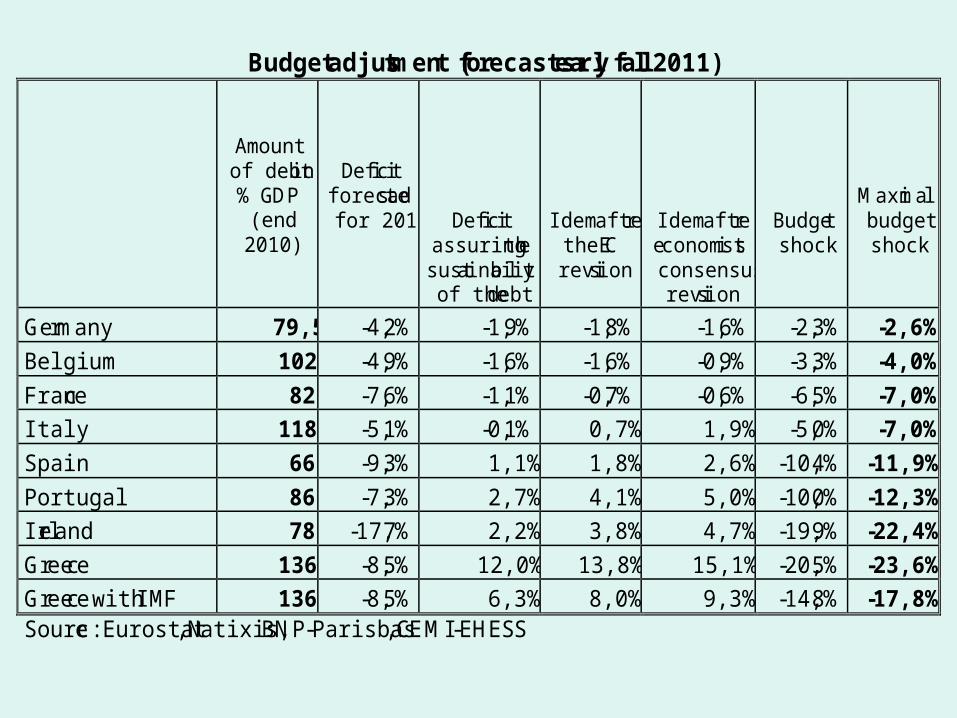
Budget adjustment (forecasts early fall 2011)
Amount of debt in % GDP
(end 2010)
Deficit forecasted for 2011
Deficit assuring the
sustainability of the debt
Idem after the EC revision
Idem after economists consensus revision
Budget shock
Maximal budget shock
Germany 79,5 -4,2% -1,9% -1,8% -1,6% -2,3% -2,6%
Belgium 102 -4,9% -1,6% -1,6% -0,9% -3,3% -4,0%
France 82 -7,6% -1,1% -0,7% -0,6% -6,5% -7,0%
Italy 118 -5,1% -0,1% 0,7% 1,9% -5,0% -7,0%
Spain 66 -9,3% 1,1% 1,8% 2,6% -10,4% -11,9%
Portugal 86 -7,3% 2,7% 4,1% 5,0% -10,0% -12,3%
Ireland 78 -17,7% 2,2% 3,8% 4,7% -19,9% -22,4%
Greece 136 -8,5% 12,0% 13,8% 15,1% -20,5% -23,6%
Greece with IMF 136 -8,5% 6,3% 8,0% 9,3% -14,8% -17,8% Source : Eurostat, Natixis, BNP-Parisbas, CEMI-EHESS