The work values of secondary teachers : a comparative ...
127
Portland State University Portland State University PDXScholar PDXScholar Dissertations and Theses Dissertations and Theses 1983 The work values of secondary teachers : a The work values of secondary teachers : a comparative study by teaching assignment comparative study by teaching assignment Charlotte Marie Klampe Portland State University Follow this and additional works at: https://pdxscholar.library.pdx.edu/open_access_etds Part of the Health and Physical Education Commons, and the Psychology Commons Let us know how access to this document benefits you. Recommended Citation Recommended Citation Klampe, Charlotte Marie, "The work values of secondary teachers : a comparative study by teaching assignment" (1983). Dissertations and Theses. Paper 3271. https://doi.org/10.15760/etd.3261 This Thesis is brought to you for free and open access. It has been accepted for inclusion in Dissertations and Theses by an authorized administrator of PDXScholar. Please contact us if we can make this document more accessible: [email protected].
Transcript of The work values of secondary teachers : a comparative ...

Portland State University Portland State University
PDXScholar PDXScholar
Dissertations and Theses Dissertations and Theses
1983
The work values of secondary teachers : a The work values of secondary teachers : a
comparative study by teaching assignment comparative study by teaching assignment
Charlotte Marie Klampe Portland State University
Follow this and additional works at: https://pdxscholar.library.pdx.edu/open_access_etds
Part of the Health and Physical Education Commons, and the Psychology Commons
Let us know how access to this document benefits you.
Recommended Citation Recommended Citation Klampe, Charlotte Marie, "The work values of secondary teachers : a comparative study by teaching assignment" (1983). Dissertations and Theses. Paper 3271. https://doi.org/10.15760/etd.3261
This Thesis is brought to you for free and open access. It has been accepted for inclusion in Dissertations and Theses by an authorized administrator of PDXScholar. Please contact us if we can make this document more accessible: [email protected].
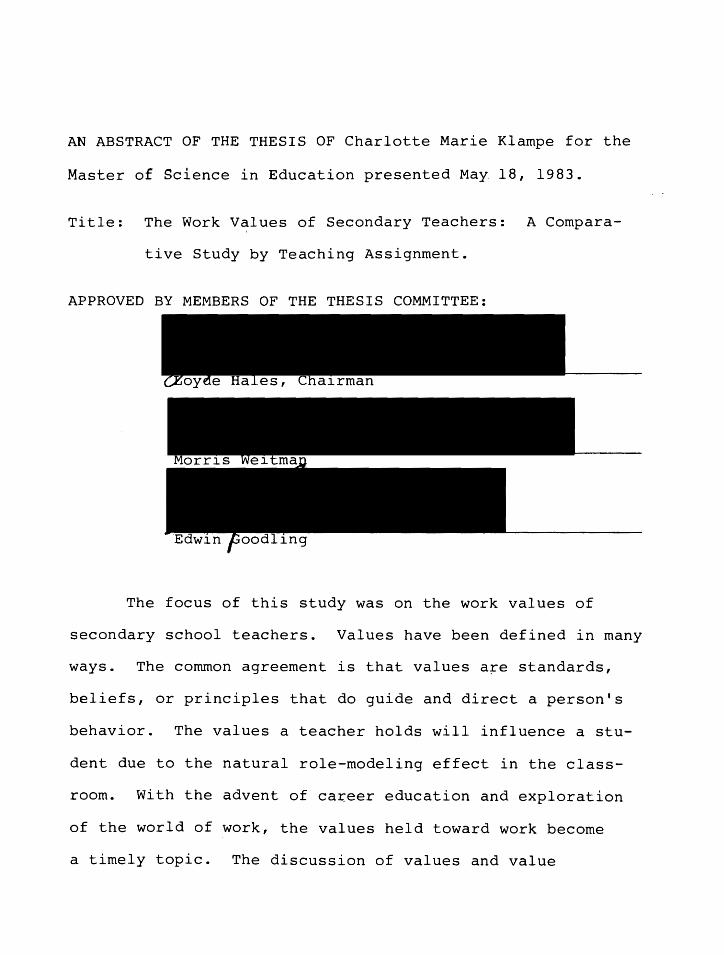
AN ABSTRACT OF THE THESIS OF Charlotte Marie Klampe for the
Master of Science in Education presented May 18, 1983.
Title: The Work Values of Secondary Teachers: A Compara-
tive Study by Teaching Assignment.
APPROVED BY MEMBERS OF THE THESIS COMMITTEE:
Hales, Chairman
Morris
The focus of this study was on the work values of
secondary school teachers. Values have been defined in many
ways. The common agreement is that values a~e standards,
beliefs, or principles that do guide and direct a person's
behavior. The values a teacher holds will influence a stu-
dent due to the natural role-modeling effect in the class-
room. With the advent of career education and exploration
of the world of work, the values held toward work become
a timely topic. The discussion of values and value

clarification in all aspects of a person's life is one that
is becoming very popular in education.
2
Teachers from 12 Oregon junior and senior high
schools, both urban and rural, provided data for this study.
The 220 teachers in the sample were from 16 different teach
ing areas. Biographical information was listed by frequency
and percentage. The teachers had a median age of 42.17 and
were split 48% males and 51% females. The median years of
teaching experience was 12.77 years.
The study participants completed the Ohio Work Values
Inventory (OWVI) and a biographical data sheet. The means,
standard deviations, and medians of the OWVI scales were
calculated for the total teacher sample. Frequency and per
centages were also listed for each of the 11 OWVI scales.
The range of means for the total sample on the OWVI
scales was 16.18 points. The results showed that secondary
teachers placed the most value on Task Satisfaction, Self
Realization, and Altruism and the least value on Prestige,
Object Orientation, and Solitude.
A multivariate analysis of variance was performed with
subject areas as the independent variable and the scales
of the OWVI as the dependent variable. The statistical
hypothesis was rejected, and univariate analyses of variance
were performed on the 11 dependent variables.
Two statistical hypotheses were rejected at the .05
level. Significant differences were found among groups for

3
Control and Self-Realization. All pair-wise mean compari
sons were performed on these two variables, with one statis
tical hypothesis rejected in the pair-wise comparisons of
means. Math/Computer Science teachers placed lesser value
on Self-Realization than did Business teachers.
Scale means were listed by sex of the teacher. A mul
tivariate analysis of variance was performed with sex as
the independent variable and the OWVI scales as the depen
dent variable. The statistical hypothesis was rejected,
and univariate analyses of variance were performed on the
11 dependent variables, with four being rejected at the .05
level. Significant differences were found; female teachers
placed more value on Self-Realization. Males placed sig
nificantly higher value on Solitude, Prestige, and Object
Orientation than did the female teachers.

THE WORK VALUES OF SECONDARY/TEACHERS: A
COMPARATIVE STUDY BY TEACHING ASSIGNMENT
by
CHARLOTTE MARIE KLAMPE
A thesis submitted in partial fulfillment of the requirements for the degree of
MASTER OF SCIENCE in
EDUCATION
Portland State University
1983

TO THE OFFICE OF GRADUATE STUDIES AND RESEARCH:
The members of the Committee approve the thesis of
Charlotte Marie Klampe presented May 18, 1983.
L~yde Hales, Chairman
APPROVED:
Carol A. Burden, Head, Department of Special Programs
RaiiChYean of Graduate Studies and Research S. E.

ACKNOWLEDGEMENTS
Acknowledgement is due to all faculty members at Port
land State University who have stimulated and guided my
interest in this study, and in general course work through
out the last year. I am grateful to Dr. Morris Weitman and
Dr. Edwin Goodling for their interest and assistance in the
progress and completion of this research project, and for
serving on my thesis committee.
Particular appreciation is given to Dr. Loyde Hales,
advisor and chairman of my committee. His intellectual
abilities and design expertise contributed greatly to this
work. His assistance in organizing and analyzing the data
was invaluable.
Appreciation is expressed to all the members of my
family who helped in scoring and compiling data. I thank
my husband, Norman, and my parents, Margaret and Eldon Crab
tree, for their support and encouragement during this
project. I thank my children, John and Gretchen, for their
understanding and patience.
Deepest appreciation goes to two people who did, dur
ing their lives, and even today, continue to afford great
influence in my life. To my Grandmother, Esther, a thank
you for being so supportive of my educational aspirations,
and for always being my biggest cheerleader, I know you

iv
would be very proud. Also, to my dear friend Pat, who
taught me more than he will ever know. His constant friend
ship and unquestioning love made me a better person.

Dedicated to:
the loving memory of
Esther Johanna Gragg
and
Patrick Steven Carmichael
v

TABLE OF CONTENTS
ACKNOWLEDGEMENTS
LIST OF TABLES . . . . . . . . . . . . . . . . . . .
CHAPTER
I
II
INTRODUCTION
Introduction to the Problem
Statement of the Problem .
Impetus for the Study
Purpose of the Study .
Limitations
Delimitations
Definition of Terms
Outline of Chapters
REVIEW OF RELATED LITERATURE
An Introduction to Values
Values Clarification and Education
Characteristics of Human Values
Work Values of Other Groups
Teachers and Work Values . • • • . • . .
The Teacher as a Value Builder . .
The Teacher as a Role Model
PAGE
iii
viii
1
1
5
5
6
7
7
8
11
12
12
14
16
18
24
29
31

CHAPTER
III
IV
v
METHODOLOGY . . . . . . •
Design of the Study . . . . . . . . . . Subjects . . . . .
Instrumentation . . . . . . . . . . Biographical Data Sheet Ohio Work Values Inventory
Procedures . . . . . .
Statistical Methods
PRESENTATION OF THE DATA
Description of the Sample
Principal Findings
Descriptive Data: Total Teacher Sample
Data: By Subject Area Data: by Sex of the Teacher
ANALYSIS OF DATA
Summary of the Study .
Conclusions . . . . . . . . . . . . . .
vii
PAGE
35
35
35
36
41
43
45
45
51
73
73
75
Recommendations for Further Research . . 77
A SELECTED BIBLIOGRAPHY . 79
APPENDIX 85
A OHIO WORK VALUES INVENTORY 85
B BIOGRAPHICAL DATA SHEET . • • 86
c COVER LETTER TO STUDY PARTICIPANTS 87
D OWVI SCALE-SCORE PERCENTAGES 89
E SCHOOLS PARTICIPATING IN THE STUDY 113
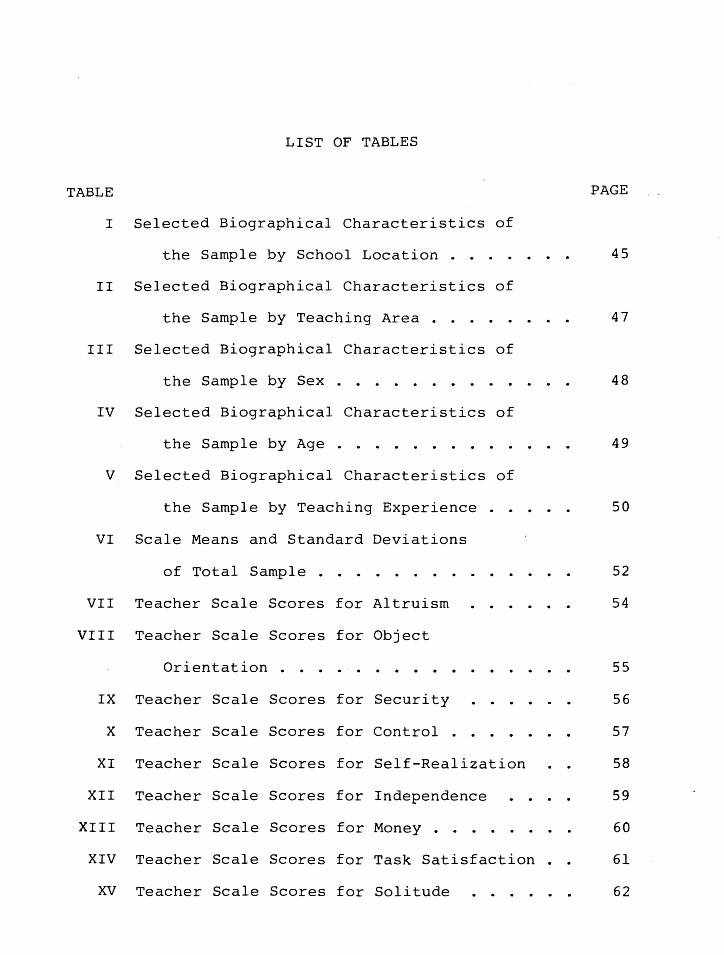
LIST OF TABLES
TABLE PAGE
I Selected Biographical Characteristics of
the Sample by School Location . . . . . . . 45
II Selected Biographical Characteristics of
the Sample by Teaching Area . . . . . . . . 47
III Selected Biographical Characteristics of
the Sample by Sex . . . . . . . . . . . . . 48
IV Selected Biographical Characteristics of
the Sample by Age . . . . . . . . . . . . . 49
v Selected Biographical Characteristics of
the Sample by Teaching Experience . . . . . 50
VI Scale Means and Standard Deviations
of Total Sample . . . . . . . . . . . . . . 52
VII Teacher Scale Scores for Altruism . . . . . . 54
VIII Teacher Scale Scores for Object
Orientation . . . . . . . . . . . . . . . . 55
IX Teacher Scale Scores for Security . . . . . . 56
x Teacher Scale Scores for Control . . . . . . . 57
XI Teacher Scale Scores for Self-Realization . . 58
XII Teacher Scale Scores for Independence . . . . 59
XIII Teacher Scale Scores for Money . . . . . . . . 60
XIV Teacher Scale Scores for Task Satisfaction . . 61
xv Teacher Scale Scores for Solitude . . . . . . 62

ix
TABLE PAGE
XVI Teacher Scale Scores for Ideas/Data . . . . . 63
XVII Teacher Scale Scores for Prestige . . . . . . 64
XVIII OWVI Scale-Score Means by Subject Area . . . . 65
XIX OWVI Scale-Score Rankings by Subject Area . . 66
xx OWVI Scale-Score Analysis of Variance by
Teaching Area . . . . . . . . . . . . . . . 69
XXI OWVI Scale-Score Means by Sex of
the Teacher . . . . . . . . . . . . . . . . 70
XXII OWVI Scale-Score Analysis of Variance by
Sex of the Teacher . . . . . . . . . . . . 72

CHAPTER I
INTRODUCTION
Introduction to the Problem
In recent years the trend toward the study of values,
attitudes, and value clarification has become a topic in
a variety of disciplines. In the field of education, the
focus on values is not only evident in curriculum planning,
goals, and objectives, but also in the more personal realm
of focus on the values educators should, or do, teach in
the classroom.
With the increased popularity of defining educational
objectives according to Bloom's taxonomy of cognitive and
affective domains, both the "intellectual" and the "feeling
or emotional" parts of learning are desired. Attempts to
measure learning or behavior on both scales is the current
trend.
On the highest level on the affective scale, Bloom,
Krathwohl, and Masia (1974, p. 184) describe the behavior
of characterization by a value or value complex.
The generalized set is that which gives an internal consistency to the system of attitudes and values at any particular moment . . . It is sometimes spoken of as a determining tendency, an orientation toward phenomena, or a predisposition to act in a certain way . . . It is a persistent and consistent response to a family of related situations or
objects. It may often be an unconscious set which guides action without conscious forethought ... it is a basic orientation which enables the individual to reduce and order the complex world about him and to act consistently and effectively in it
. the objectives are so encompassing that they tend to characterize the individual almost completely.
What a person values in life determines greatly his/
2
her behavioral pattern and interactions with others. Values
and the role they play in the world of work (work values)
are perceived as being the highest and most permanent. In-
terests and attitudes, although important, are less influen-
tial, and fall lower on the taxonomy according to Bloom et
al. (1974). Katz (1963) and Perrone (1965) stressed the
importance of a consideration of values in career planning.
Several researchers have developed instruments with
which to measure work values. Included are: Occupational
Rating Scale (Hammond, 1956), Vocational Values Inventory
(Stefflre, 1962), Work Values Inventory (Super, 1968), and
Ohio Work Values Inventory (Hales & Fenner, 1973a). The
latter is the most recent and has been subjected to a number
of subsequent studies.
When discussing the theoretical foundation of the Ohio
Work Values Inventory (OWVI), Fenner and Hales (1973a,
pp. 1-2) state the following:
The theoretical foundations of the instrument, along with much of its basic rationale, can be traced to five primary sources: an analysis of the values used in previous investigations; the personalityneed theory, as postulated by Maslow (1954) and adapted to a theory of occupational choice by
by Roe (1956), self theory, as postulated by Combs and Snygg (1959); and worker-functions, as identified by the United States Department of Labor.
On the basis of these considerations, the authors
identified 11 work values and the capability of the instru-
ment to measure them was substantiated by a factor analysis
(Fenner & Hales, 1973a). Other studies measuring work
values using the OWVI are cited in subsequent chapters of
this text.
As described by Hales and Fenner (1972a) and Gribben
and Lohnes (1965), the values related to the world of work
3
begin to form in early childhood and these values enter into
pre-adolescent vocational behavior, continuing to exert an
influence in adult life. The existence of values as a part
of personality was recognized by Holland (1973) when he de-
termined that a personality type is created by "an increas-
ing differentiation of preferred activities, interests,
competencies and values" (p. 12).
This research examines the work values held by second-
ary teachers. All people have their own personal set of
values relating to a variety of aspects in their lives.
Because the world of work has become such an important part
of the educational system, with the advent of career educa-·
tion and vocational awareness programs, the influence of
the teacher in this area is evident. Hales (1977) reported
the following:

School professionals are increasingly being asked to take a part in helping young people become more aware of their value orientations, the process by which values are shaped, and the integration of these into their consideration of work plans. Studies of the world of work and career planning are rapidly becoming an integral part of elementary and middle school curricula. Children are being encouraged to develop an awareness of their value orientations, to understand the processes by which work values are shaped, and to integrate their work values in career planning. (p. 1)
Sarason (1973) speaks of the effect of role models
on a child. The author suggests that children do not just
naturally conform to standards set for them. They fre-
quently take on as their own the standards, values, and
attitudes of the persons with whom they identify. Children
do not indiscriminately imitate all responses made by all
potential models; they will pick and choose. The author
points to an example of the relationship between model and
observer.
The relationship between the model and the observer (which it may not be possible to describe entirely in terms of observable events) can influence the observer's thinking processes as well as his overt behavior. For example, it may be necessary that the acquisition of skills for novel and creative thinking be preceded by acquisition of the ability to explore unlikely paths to solutions. The teacher who provides students with examples of this form of adventurousness may help them develop that unique orientation often necessary for creative thought. (p. 11)
Every teacher is a value builder, whether or not he wants to be or recogniz,es this fact. He has no choice about it ... teaching behavior does contribute to the kinds of need concepts students form; the need concepts are the roots of values. (Tyson & Carroll, 1970, p. 262)
4

5
If the teacher is to assume this responsibility of
value builder and clarifier for students, it is also impor
tant for the teacher to have a clearly defined personal
value system. Along with this, the teachers must be recep
tive and open to a variety of value systems that may not
match or agree with their own. When speaking of effective
teachers, Garrett (1971, p. 26) proposed "that we need inde
pendent, facilitating, and non-rigid teachers who are open
to experiences, including experiences for others and experi
ences for themselves."
Statement of the Problem
The following question provides the principal focus
of this study: what are the work values of secondary school
teachers? Secondly, do the values towards work held by
teachers differ by subject area?
Impetus for the Study
The observation and study of individual differences
have been of interest to the author for some time. As a
Home Economist with specialization in Child Development and
from many years as a secondary classroom teacher, it has
been interesting to observe human characteristics and
traits.
The informal groupings and alliances within faculty
groups are evident by simple observation. It has been
observed by the author that these cliques are often formed
by subject area taught. These friendships not only seem
to thrive within the professional relationship, but also
carry over to informal and social interactions as well. It
is very common to see the P.E. teachers or coaches sit to
gether, the history teachers group together, etc., whether
it be in the lunchroom, faculty meetings, or committee
assignments.
Since alliances of any kind need some type of common
bond to continue, the study of common values among subject
areas is an interesting one to pursue. Narrowing down the
values to those relating to the world of work is a logical
one, because the study participants have similar roles in
the field of education.
Purpose of the Study
6
The purpose of this study was to determine the general
work values held by classroom teachers. The data obtained
was subjected to further examination to determine differ
ences which may exist among teachers with different teaching
assignments.
Information gained in this type of study can be used
in a variety of ways. One penefit could be in evaluating
and planning curriculum. It could also help administrators
understand and work more effectively with their staff. The
results of this study could be used to help teachers
7
understand areas of common agreement or the differences
among peers in the same or other disciplines. When teachers
are more aware of their own personal work values, they can
make a conscious effort not to impose their own values on
the student in their classrooms.
Limitations
An attempt was made to seek out teachers in all sub
ject areas, but the resulting sample contained proportion
ately larger numbers in some fields of teaching. Although
this may weaken the reliability of scores within these
smaller groups, the obtained distribution of teachers by
subject areas is somewhat typical of the makeup in a second
ary school staff.
Delimitations
The delimitations of this study reflect the possible
generalizations based upon the specific sample selected,
and the particular theory and definitions used by Hales and
Fenner.
The population sampled, secondary school teachers,
also delimited the study. In generalizing this study's re
sults, one should take into account the characteristics of
the population sampled.
Hales and Fenner's 11 work values delimited the scope
of the study. The 11 work values as described by Hales and

Fenner should not be interpreted as an exhaustive list of
work values, nor should they be viewed as identical to the
work values defined.
Definition of Terms
8
The following terms are defined to enable readers to
interpret general words which have been given specific, spe
cial meaning by Hales and Fenner (1973a). Additional terms
have been defined because of their relevance to the study.
Altruism scale--Signifies the importance given to the
opportunity for involvement with other people in a helping,
supportive, or service role. A quality of interpersonal
giving by the valuer characterizes the relationships which
are developed in the work (Hales & Fenner, 1973a, p. 9).
Control scale--Indicates the importance of having an
opportunity to take a leadership role or responsibility for
other workers in the conduct of their work. The job itself
gives the person an influencing or decision-making role with
regard to the planning, supervision, and evaluation of
workers (Hales & Fenner, 1973a, p. 9).
Ideas/Data scale--Indicates the importance of having
an opportunity to work with facts and ideas. A high score
on this scale signifies a preference for dealing with, mak
ing sense out of, creating, and communicating ideas (Hales
& Fenner, 1973a, p. 10).

9
Independence scale--Signif ies the importance of work
which allows the person to determine his own working condi
tions. A high scorer on this scale prefers to be free from
close supervision and to structure his own hours and methods
of working. An element of control--the desire for mastery
over the work environment--is expressed in this value.
Thus, the scale may be related to the Control scale which
reflects a managerial factor regarding people (Hales &
Fenner, 1973a, p. 9).
Money scale--Indicates the importance of work which
enables the person to mave a substantial income--more than
enough to assure basic needs. The value reflects a mate
rialistic outlook--one in which the person's desires for
material satisfactions and the psychological gratifications
attendant upon wealth can be realized (Hales & Fenner,
1973a, p. 9).
Object Orientation--Expresses the valuation of
handling, tending, or manipulating physical objects such
as utensils, materials, tools, or apparatus. The value re
lated to work which involves making, fixing, operating, or
changing the appearance of things, the results of which tend
to be readily apparent and measurable (Hales & Fenner,
1973a, p. 9).
Prestige scale--Concerns the desire for work which
will bring a person recognition and acclaim. An aspect of
10
this value is the opportunity to meet or associate with im
portant people (Hales & Fenner, 1973a, p. 10).
Secondary teachers--Includes all teachers assigned
and certifi~d to teach seventh grade through twelfth grade.
Security scale--Concerns the desire for work which
is steady and dependable. The work may be full-time, part
time, or seasonal but it is quite immune to unpredictable
layoff or dismissal. Since a guarantee of income is re
flected in high valuation of security, the value tends to
be related to other rewards-of-work values, money, and pres
tige (Hales & Fenner, 1973a, p. 9).
Self-Realization--Expresses a preference toward work
which permits the individual to utilize his skills, abili
ties, or talents. The work affords opportunities and chal
lenges for continued personal growth and realization of
one's full potential (Hales & Fenner, 1973a, p. 9).
Solitude scale--Relates the preference for work situa
tions characterized by the absence of close relationships
with other people. The work can be done largely by one per
son and it usually affords either few or brief structured
personal encounters (Hales & Fenner, 1973a, p. 10).
Subject area--Refers to the specific area a teacher
is certified to teach. If a teacher is certified in more
than one area, the subjects were classified in the area that
occupies over 50% of their instructional time.

11
Task Satisfaction scale--Concerns the importance asso
ciated with work that generally is interesting and enjoy
able. The work tasks are the kinds that an individual can,
for the most part, look forward to doing (Hales & Fenner,
1973a, p. 10).
Outline of Chapters
Chapter I presented a rationale for the study, state
ment of problem, purpose, limitations, delimitations, and
definition of terms. Chapter II contains the review of re
lated literature. Chapter III describes the methodology
of the study. This includes design, subjects, instrumenta
tion, procedures, and statistical methods. Chapter IV in
cludes the presentation of the data, description of the
sample, and principal findings. Chapter V concludes this
paper with a summary of the study, conclusions, and recom
mendations for further research.
CHAPTER II
REVIEW OF RELATED LITERATURE
Literature to be reviewed includes a brief overview
of the study of values and value clarification in prepara
tion for a more extensive discussion of the research relat-
ing to work values. Included also is a discussion of the
teacher's role as a value builder and role model.
An Introduction to Values
It has become fashionable in recent years to speak
of the school's "hidden curriculum"--school experiences
that result in unintended, unplanned, even unsuspected and
undesired student learning. The "hidden" curriculum is
typically contrasted with the "formal" curriculum--the
experiences purposely planned to accomplish the intended,
although often not explicitly stated, goals and objectives
of the various curriculum areas. The hidden curriculum
includes the unintended implications of content and of
teaching behavior, as well as the many noninstructional
encounters that students have with teachers and other school
personnel. Much of the hidden curriculum has to do with
values, even in subjects that are frequently considered
"value free"--such as science and mathematics.
13
Before proceeding further an operational definition
of values is needed. Several authors have given their own
definition to the concept of values. Oliver and Shaver
(1966); Shaver and Berlack (1968); Shaver and Larkins (1969)
would generally agree on the following definition:
Values are our standards and principles for judging work. They are the criteria by which we judge 'things' (people, objects, ideas, actions and situations) to be good, worthwhile, desirable; or on the other hand, bad, worthless despicable; or, of course, somewhere in between these extremes. We apply our values consciously. Or they may function unconsciously, as part of the influence of our frames of reference, without our being aware of the standards implied by our decisions. (Oliver & Shaver, 1974, p. 15)
Rokeach (1973) describes a value as:
. • . an enduring belief that a specific mode of conduct or end-state of existence is personally or socially preferable to an opposite or converse mode of conduct or end-state of existence . • . it is a 'standard' that guides and determines action, attitudes toward objects and situations, ideology, presentations of self to others, evaluations, judgments, justifications, comparisons of self with others, and attempts to influence others. (pp. 5, 25)
Present in both of these definitions, and others, is
agreement on the great influence that values hold in our
personal and professional lives. The values held by a per-
son will guide his/her behavior, interactions with others,
and in all areas of life.
Values held by people encompass many parts of their
lives. Values can be determined and examined in such areas
as: values held toward family and friends, moral values,

religious or spiritual values, social values, educational
values, and (as examined in this paper) values related to
work.
14
Another important distinction should be made between
values and value judgements. Value judgements are asser
tions we make based on our values (Shaver & Strong, 1976).
A similar yet important distinction can be made between the
closely related topics of values and attitudes. An atti
tude, as commonly defined by psychologists, is a number of
interrelated beliefs and feelings focused on some object,
individual action, person, situation, or thing. Attitudes
are affected by a multitude of factors, including factual
beliefs people hold and their values. The term "values"
denotes a standard of worth and is a more fundamental frame
of reference (Shaver & Strong, 1976).
Values Clarification and Education
Louis Raths first used the term "values clarification"
in the late fifties. Based on John Dewey's (1939) book,
Theory of Valuation, Raths refined Dewey's ideas and created
values clarification strategies based on the recorded
thoughts of the great philosopher. Raths also was inter
ested in the emotional needs of human beings. According
to Simon and de Sherbinin (1975), Raths' works in this area
"went even further than that of Abraham Maslow." Purpel
and Ryan (1976) state that the concept of values and value

15
clarification has become extremely popular since the origi-
nal Raths book. There are growing numbers of books avail-
able to educators that try to teach them to become value
clarifiers for their students. Teachers widely report that
"values clarification works, they feel that it turns kids
on in what is otherwise largely irrelevant curriculum"
(Purpel & Ryan, 1976).
On reporting the benefits of value clarification in
the classroom Raths, Harmin, and Simon (1978) list the
following:
--An increase in self-direction and trust in oneself (including more self-acceptance).
--A maturation of expressed values •. --An improvement in the learning climate (more par-
ticipation, more responsibility for what happens, more interest in learning).
--An improvement in learning outcomes (especially in reading).
--A venting of personal pressures (expressing fears and problems).
--An increase in hope and faith (more confidence that problems can be solved, progress is possible, personal power can be marshaled).
--An improvement in student-teacher relations (more feeling on the part of students that teachers are helpful and kind; more feeling on the part of teachers that students are worthy of respect and affection) .... (p. 249)
The author points out that this approach may not be
as effective in all classrooms and with all teachers, but
that the majority of teachers find that getting students
and themselves closer to their values, greatly helps the
curriculum and other factors in the classroom.

16
Characteristics of Human Values
The noted psychologist, Rogers, has written exten-
sively on the importance of and problems relating to values.
He sees the world culture changing drastically, and the ef-
feet on values and relationships between people as in a
great pattern of change. No longer are the values of the
past held as sacred. Not only are the youth of today rebel-
ling against parental guidance in some areas of their lives,
but the patterns of behavior and attitudes of the general
population seem to be in a state of re-evaluation and col-
lapse in others.
Men question whether there are, or can be any universal values. It is often felt that we may have lost, in our modern world, all possibility of any general or cross-cultural basis for values. One natural result of this uncertainty and confusion is that there is an increasing concern about, interest in, and a searching for, a sound or meaningful value approach which can hold its own in today's world. (Rogers, 1973)
The values an adult holds are learned and adopted
through life experiences. A child spills milk, the parent
tells the child that he is naughty. The child spills again
and repeats out loud, "I'm naughty, I spilled my milk."
The child is trying to behave in terms of values set by an-
other, in this case to hold the love of a parent. A young
man observes that his parents respond much more favorably
when he suggests going to medical school instead of being
a back-up musician for a rock group. Rogers suggests that
because these values are not based on his own valuing, they

17
tend to be fixed and rigid, instead of fluid and capable
of change to meet new experiences. Rogers stresses the
importance of any value system being open and receptive to
change for the person to experience the positive evolu-
tionary change of maturation.
Rogers (1973) lists some of the commonly introjected
(rigid) values held by adults. These values are often
widely discrepant from the evidence supplied by the person's
experiences.
Sexual desires and behaviors are mostly bad. The sources of this construct are many--parents, churches, teachers.
Disobedience is bad. Here parents and teachers combine with the military to emphasize this concept. To obey is good. To obey without question is even better.
Making money is the highest good. The sources of this conceived value are too numerous to mention.
Learning an accumulation of scholarly facts is highly desirable.
Browsing and aimless exploratory reading for fun is undesirable. The source of these last two concepts is apt to be in the educational system.
Communism is utterly bad. Here the government is a major source.
To love thy neighbor is the highest good. This concept comes from the church, perhaps from the parents.
Cooperation and teamwork are preferable to acting alone. Here companions are an important source.
Cheating is clever and desirable. The peer group again is the origin. (pp. 80-81)
As is evident from this discussion, the values an
adult holds are influenced by many people. The values one
adopts may not be based on personal experiences but rather
on the interaction with others, and the perceived acceptance

18
of these actions by those influential people with whom one
interacts.
Work Values of Other Groups
The values toward work have been documented by several
researchers in the field. Super developed his Work Values
Inventory in 1968, and it has been used to describe and draw
comparisons between a variety of groups. Hales and Fenner
developed the Ohio Work Values Inventory in 1973. It has
also been used in research, classroom use, and for guidance
procedures.
Previously discussed in prior chapters are the 11
values associated with the OWVI. Listed below are the
values associated with the Work Values Inventory developed
by Super (1970).
Intrinsic Factors
Achievement Altruism Creativity Aesthetics Intellectual Stimulation Management
Extrinsic Factors
Associates Economic Returns Independence Prestige Security Supervisory Relations Surroundings Variety Way of Life
When looking at the work values held by a variety of
different groups, a review of recent studies is necessary.
Vanderink (1980), using the Super inventory, studied the
work values of clerical workers and students in preparation
for clerical positions. Thomas (1973) investigated
19
the effect of social class, race, and sex on the work
values of ninth-grade students in a large metropolitan area.
Measures of work values were obtained using Super's Work
Values Inventory. Significant differences between black
and white students appeared for the variables of Associates,
Altruism, Variety, and Intellectual Stimulation. Males and
females varied on Creativity and Altruism. Where signifi
cant differences appeared.between blacks and whites, white
students in all cases expressed greater value for each of
the work value constructs. In general, black females of
low social position scored low on the work value scales
(Thomas, 1973).
Super's Work Values Inventory was administered to 391
entering community college freshmen in Massachusetts. Grace
(1974) listed the following results: Altruism was shown
to be positively related to being female; Economic Return
was positively related to being male, especially for those
in the business administration program; liberal arts' males
tended to be more altruistic and security minded; the
secretarial group showed a high value orientation to Sur
roundings, but also rated Economic Returns and Supervisory
Relations as important.
Work values have not only been used as a descriptive
instrument but also as a predictive device. The next two
cited studies point to additional uses for work values
research. Even though these studies were predictive in

nature, the existence of measurable work values for the
groups is evident.
20
Gade and Perterson (1977) studied the correlation be
tween work values and vocational maturity for women and men.
They found that general work values could only be used as
reliable predictors of vocational maturity for women.
Drummond, Pinette, and Smith (1977) used Super's Work
Values Inventory as one of three scales to determine the
best predictor of reading achievement in a reading course
at a community college. Five scales of the inventory con
tributed 13.2% of the variance in predicting reading
achievement.
Values have been shown to have predictive value in
determining human goal direction. Krause (1970) studied
the relationship between work values and college majors.
A random sample of 180 males, representing Holland's six
categories of vocational choice (Realistic, Intellectual,
Social, Conventional, Enterprising, and Artistic) were ad
ministered a modified version of Super's Work Values Inven
tory. The six groups varied significantly on nine of the
18 values: social welfare, freedom in work, satisfactory
supervision, creativity, variety, material esteem, status,
family esteem, and religious esteem. The author suggested
that these results seem to indicate that vocational counsel
ing should take these differences of values by college ma
jors into account when planning programs for students.
21
An extensive study of necessary work values, habits,
and attitudes was conducted in Missouri during the late
1970s, using workers, supervisors, teachers, and students
in various classifications. This study useq an instrument
entitled the Affective Work Competencies Inventory (AWCI).
This inventory does not deal with values of work, but corn-
petencies relating to the world of work, all in the affec-
tive domain. Examples of the fifteen clustered categories
are:
1. Ambitious 2. Cooperative/Helpful 3. Adaptable/Resourceful 4. Considerate/Courteous 5. Independent/Initiating 6. Accurate/Quality of Work 7. Careful/Alert/Perceptive 8. Pleasant/Friendly/Cheerful 9. Responsive/Follow Directions
10. Emotionally Stable/Judgemental/Poised 11. Persevering/Patient/Enduring/Tolerant 12. Neat/Orderly/Personal Appearance/Manner 13. Dependable/Punctual/Reliable/Responsible 14. Efficient/Quantity of Work/Achieving/Speedy 15. Dedicated/Devoted/Honest/Loyal/Conscientious (Beach, 1978a, p. 17)
Although findings from this report are too numerous
to rnention\in detail, some of the significant findings were
that mean composite AWCI scores for
1. vocational students were greater than for academic students;
2. workers were greater than for vocational students;
3. occupational areas significantly differed; 4. female workers were significantly higher than
for male workers; and 5. teachers, supervisors, and workers differed. (Beach, 1978b)

22
Hales and Fenner (1972a) examined the work values of
fifth-, eighth-, and eleventh-grade students in three Ohio
public schools, using the Ohio Work Values Inventory (OWVI).
A multivariate analysis of variance was performed, with
grade level serving as the independent variable. The uni-
variate F-ratios for Altruism and Self-Realization were sig-
nificant. The fifth- and eighth-grade subjects valued
altruistic jobs and work that permit self-realization less
than did the eleventh-grade students.
Using the findings of various studies (Scott & Day,
1972; Slocum & Hand, 1971) that suggest that personality and
occupational choice are related and those of other scholars
that evidence a link between values and personality, Hartman
(1977) studied the relationship between personality and work
values. Two instruments were administered to a sample of
1,072 second-year students in two-year Ohio technical col-
leges, the OWVI and Vocational Preference Inventory (VPI).
In discussing the results of this study, Hales and
Hartman (1978) suggest:
. that people of differing personality types do tend to differ in the importance attached to various work values. Of the fifteen pair-wise comparisons, five were significant. The work values on which the pairs of personality types differed varied from pair to pair, and this variation seems to be reasonable. For example, the Realistic type placed greater value on Object Orientation than did the Artistic type; the Social type placed greater value on Altruism than did the Conventional type. Consequently the expectation that personality and work values are related was supported by this study. (p. 19)
23
In another study of work values, using the OWVI,
A. K. Hales (1977) compared the work values of practicing
nurses and nurses in training. The author states that the
profile of practicing nurses is distinctive, with the scale
means ranging 17 points. Practicing nurses placed consider
able value on Task Satisfaction, Self-Realization, and
Altruism and relatively little value on Prestige, Object
Orientation, and Solitude. The work values of practicing
nurses did not significantly vary from those of nurse
trainees. The author concluded that the measures of work
values from a student nurse sample can be used to generate
an occupational/professional profile.
Considerable research has been completed regarding
the differences in work values according to sex. The OWVI
was administered to a sample of 168 sixth-grade pupils in
a southeastern Ohio town of 36,000 residents. A two-factor,
multivariate analysis of variances was performed, with sex
and social class as independent variables. The multivariate
F-ratio was significant for sex but not for social class
or interaction. Three univariate F-ratios for sex were sig
nificant. Females placed greater value on Altruism, but
lesser value on Object Orientation and Solitude, than did
the males (Hales & Fenner, 1973b).
In a study of self-concept, sex, and work values,
Hales and Yackee (1974) studied the responses of 99 fifth
grade pupils to the OWVI. The multivariate F-ratio and four
24
univariate F-ratios for sex were significant: Object Orien
tation, Control, Ideas/Data, and Prestige. The girls placed
less value than did the boys on all four.
When comparing the effect of personality, sex, and
work values, Hales and Hartman (1978) performed a multivari
ate analysis of variance on 115 undergraduate students at
Ohio University. The multivariate F was significant for
the sex main effect. Seven univariate F-ratios were also
significant. The means for females were above the means
for males on Altruism, Task Satisfaction, and Self
Realization, but were below the means for males on Control,
Money, Solitude, and Prestige.
Teachers and Work Values
With the advent of career education and career aware
ness programs in the schools, from the elementary school
level to post-secondary institutions, the world of work and
the preparation of students for these positions have re
ceived widespread attention. In the late 1960s the impor
tance of developing highly effective vocational programs
contributed to the rise in numbers of community colleges
and the expansion of other vocational training programs.
Not only did the interest in career planning change
the typical vocational preparation program, but it also was
helpful in redefining and analyzing the programs for profes
sional and more traditional college-bound students in a

25
variety of fields. Work and the career options became an
item for study, for exploration, and for choices established
after a thorough research of the desired job or profession.
There has been widespread research into the reaction
and importance that teachers place on career education pro-
grams. Smith (1974) studied the attitudes of teachers to-
ward work in Tennessee. Teachers from city and country
schools, 81 in each group, were administered an 18-item
questionnaire. The findings showed that city teachers were
more favorable than country teachers toward guidance and
counseling for career development, student follow-up after
graduation, work-related and hands-on experiences for
teachers, and student work-study arrangements.
Both groups had 100% agreement on the following two
statements:
1. Teachers should appreciate the values of many types of work.
2. Students should become familiar with many different careers. (Smith, 1974, p. 4)
Many different studies and papers address the topic
of teacher attitudes toward career education. When looking
for research into work values as they relate to teachers,
the data is not as extensive.
A study using Super's WVI was conducted by Handley
and Shill (1973). They compared the vocational education
teachers' evaluation of pre-service professional training
as related to their work values and attitudes toward

26
students and teaching. Pre-service preparation for teaching
was assessed by the Preservice Teacher Education Question-
naire, work values by the WVI, and a special scale measured
attitudes toward teaching and students. The attitudes which
teachers held toward their jobs and students were also sig-
nificantly correlated with their own ratings of pre-service
preparation. Significant relationships were discovered be-
tween the subjects' perception of their level of preparation
for teaching and selected work values which they held.
A multiple correlation of .45 was found between the
15 measured work values and the attitudes which the voca-
tional educator held toward teaching. Factors which moti-
vated them in their job which were associated with Prestige,
Surroundings, Altruism, and Way of Life were significantly
related to the descriptions which teachers gave their jobs.
In a paper presented in 1981 by the Queensland Board
of Teacher Education (Australia), the background characteris-
tics, work experience, extent of contact with the world of
work, and attitudes towards work of teachers in secondary
schools were examined. The report summarizes the results
as follows:
On the one hand, it could be argued that there is little evidence to support the contention that teachers lead an "ivory tower" existence, neither having nor wanting any direct contact with the world of work through previous employment, or having contact with other occupations as children . teachers considered that one means of placing more emphasis on helping students to prepare for the world of work would be to relate the curriculum to

more practical real-life situations encountered by the students. (p. 26)
27
In a related discussion of teachers' attitudes toward
students, Mitchell (1976) pointed out that the teachers'
attitudes and judgements, whether correct or incorrect, are
based on their own background and biases. Because of this
innate attitude or value system, the teacher often misinter-
prets behaviors or differing attitudes prematurely. "An
effort to change such behavior calls for awareness of its
presence and its consequences. That task, in itself, is
awesome" (Mitchell, 1976, p. 303).
The author continued by pointing out that teacher
attitudes and expectations can affect positively or ad-
versely student achievement, teacher behavior, and student
behavior.
The crux of the matter regarding the student is, in part, whether the teacher's expectations were right or wrong, but more importantly the flexibility and adaptability of the teacher to adjust her response based on new information. (Mitchell, 1967, p. 309)
The concept of the American work ethic is the preva-
lent backbone of education. Education became a prerequisite
for upward mobility and a unique part of the American work
ethic. Curry (1976) described the American work ethic of
the past as centered around one or more of the following
themes:
1. Hard work is the key to success. 2. Whatever the task you find yourself doing,
do it well.

3. Individual dignity and fulfillment in our society can only be given in and through work. (p. 227)
28
The author continued to point to these goals as being
admirable for any individual, but mostly to the benefit of
society. Today the meaning and value of work are changing
for many Americans. The author identified the following
changes, which he sees as evolving in the new work ethic;
these should have implications for all vocational and educa-
tional programs.
1. The definition and meaning of work will be redefined and broadened.
2. There will be a shift in emphasis from a goal of maximum output to utilization of maximum human potential.
3. The jobs of the future will provide for the satisfaction of higher order needs (self-esteem, social satisfaction, and self-actualization).
4. Occupations will be chosen on the basis of a realistic self-image, as awareness of the tasks involved in the occupation, and a systematic narrowing down or weeding out alternative.
5. Equal opportunity will be provided for entrance into any occupation regardless of race, sex, or age.
6. There will be revamping of values, integrity, and attitudes associated with work.
7. The labor force will move in the direction of more service-oriented occupations at a rapid rate.
8. The association of leisure time or avocational activities with the meaning of work will need to be classified. (Curry, 1976, p. 228)
In this shift from maximum production output to maxi-
mum utilization of human resources, the need for value
clarification, exploration of the self, and a realistic
self-image will become an integral part of the educational
system (Curry, 1976).

29
The Teacher as a Value Builder
The concept of a change in values along the maturation
process is clearly evident and substantiated in the litera-
ture. The teacher not only instructs the child in regular
curricular subjects, but the mere fact that the child will
often spend more time with teachers during the day than with
parents, points to the enormous responsibility the educators
must assume in the building of values. Senesh (1976} corn-
rnents on this idea.
Children must be taught that values exist, and that there are hierarchies in values. Teachers must point out that values can help children to build a better world--otherwise children will wander in a wasteland which we have helped to create • • • We must realize that the process of internalizing and applying humane values is a never ending process: the horizon is always beyond us. (p. 285}
In their discussion of what teachers can do about
values, Harrnin and Simon (1973) suggest that teachers have
three main alternatives in dealing with value development:
(1) do nothing about such development; (2) transmit a pre-
existing set of values to students; or (3) help students
find their own values.
In choosing to do nothing about value development,
the educator probably believes that this area is the domain
of family and significant others in the student's life.
But the reality of schooling is that it is impossible to do nothing. When a teacher says that it is important to master a lesson to get good grades to get into college to get a good job to earn a good salary, he is obviously promoting several values--

a work ethic, a future orientation, and materialism, to name a few. (Harmin & Simon, 1971)
In transmitting a pre-existing set of values to stu-
dents, the educator is first faced with the question, "Are
30
these values universal, right,_ desirable, or good?" Harmin
and Simon (1973) offer the following approaches to transmit-
ting values:
1. Model Approach ... people try to behave in ways that reflect the values they want to transmit.
2. Reward and Punishment Approach ... the person first identifies desirable behavior and then, by judicious rewards, encouragement, and the like, encourages the repetition of that behavior.
3. Explanatory Approach ... the person explains the reason for existing standards and adult beliefs.
4. Nagging Approach ..• the person frequently reminds students what is right and wrong and what is expected of them without attending to whether or not the students understand the reasons for those standards.
5. Manipulation Approach ... a person manipulates environment or the experiences to which students are exposed so as to favor certain value outcomes.
6. Transmittal Liberal Arts Approach ... educators who take this approach want students to read widely, think deeply, and experience broadly. They trust that life experiences and thoughtful study provide a route to absolute values. (pp. 7-11)
In choosing the third alternative approach to value
development, that of helping students find their own set
of values, the previously discussed sections on value clari-
fication apply. Most educators agree that this way of look-
ing at values is the best for the student and will provide
the optimal growth and maturation of each student.
31
The Teacher as a Role Model
One of the most important factors in the development
of values is that of the role models that persons have had
in their lives. Kirschenbaum and Simon (1973) discuss the
role of models in students' lives. They list a variety of
models: parents, teachers, religious leaders, peers, sports
figures, and movie, television, and recording stars. All
present some type of influence and the young person has to
go through a selected choosing process to sort out a variety
from the various models.
We believe that teachers need to sacrifice some of their neutrality and "objectivity" and become real human beings to the students--human beings with feelings, goals, values, and contradictions they are willing to reveal and discuss, just as they would like their students to do. (Kirschenbaum & Simon, 1973)
In discussing the relation of adolescents to non-
parental adults, Elkind (1971) describes three typical pat-
terns. The first is to treat all adults as merely exten-
sions of the parents. Thus, the interactions of adolescents
in this behavior mode would greatly depend on the relation-
ship they have with their parents. If a child accepts and
obeys the parent without question he/she is likely to react
the same with other adults. Children who rebel against par-
ental authority are likely to respond to other adults in
the same manner.
Another approach is to treat adults as the opposites
of parents, and to idealize them. Such people can often
32
be of considerable value to the adolescent, provided they
do not further undermine the parents and do not accept all
the negatives about parents that the child is expounding.
The most difficult approach to handle as an adult is
the one where the child assumes that adults are so different
and extreme that it is impossible to communicate with them.
In this situation, the positive influences the adult tries
to impart to the child are greeted with hostility and fear.
Being a model is a part of teaching that no teacher
can escape. Pullias and Young (1968, p. 68) describe this
relationship.
Being an example arises out of the very nature of teaching, and when a teacher refuses to accept and constructively use this role he seriously reduces his effectiveness; what may be even more important, he refuses to face the reality of his situation as a teacher. This role properly conceived need not be a burden nor be, nor appear to be, presumptuous. Accepted and used with skill and humility this role greatly enriches the meaning of teaching.
Oftentimes it is felt that models must be of a certain
biographical makeup to be effective. In a study conducted
by Freese and West (1972), the authors found that adoles-
cents are not too concerned about the age of the teacher,
the sex of the teacher, the experience of the teacher in
the system, or the grade received in the course the previous
semester. Adolescents seem able to consider the teacher
as a person, and how the teacher interacts apart from se-
lected personal biographical descriptors.

The quality and power of the teacher's example vary in terms of the nature and effectiveness of the teacher ... In a sense, the more effective the teacher the more powerful he is as an example. (Pullias & Young, 1968, p. 70)
33
When trying to determine how teachers provide role modeling
to students, the list could be extremely long. Pullias and
Young list the following avenue through which example ex-
presses the power of modeling: basic attitudes, speech and
diction, work habits, attitude toward experience and mis-
takes, dress, human relations, thought processes, neurotic
behavior, taste, judgement, health, and general style of
life.
In summarizing the role of the teacher as a model,
it is evident from the literature that the values held by
educators do affect the students in the classroom. The
values held by a teacher or educator do influence the be-
havior of that individual and the way that person interacts
with students, other teachers, parents, and administrators.
But as a role model, the teacher is caught between
two different and sometimes opposing views and sets of
values. Shaver and Strong (1976, p. 71) describe the situa-
tion where educators must respond as both "agents" and
"professionals."
An agent is a person empowered to act for someone else. In this sense, school people--teachers, administrators, counselors, and others--have been given the authority to carry out certain educational functions for the society. Each teacher represents the society in the classroom and during other school interactions.

But how about citizen pressure groups? Or even more telling for the individual teacher, how about vocal parents who individually or in groups tend to exert their influence directly on the teacher rather than on the formal decision makers--school boards and legislatures? What should the impact of citizens, individually or collectively, be on your instructional decisions, especially your decisions about values?
34
When this pressure is combined with the teacher's role
as a professional, the situation can become volatile. A
professional brings to his or her relationships expertise
in a specialized area, and is backed by special knowledge
and experience. A professional frequently interacts with
others within a frame of ethics shaped by members of the
profession. These professional roles often conflict with
the agent roles a teacher encounters.
In addition to this conflict, the teacher has his or
her own set of values that may be very different from either
the values of the profession or those generally held by the
society. Providing an atmosphere in the classroom where
all values can be explored and the communication and ex-
change can be open is the objective for educators. System-
atic review of all the influencing factors is needed to
provide for an environment where students and teachers can
explore their own respective values and those relating to
all areas of their lives, including those relating to the
world of work.
CHAPTER III
METHODOLOGY
Design of the Study
The research design was that of a descriptive, ex post
facto study. Information was collected from a sample of
Oregon secondary teachers, using a written inventory and
biographical sheet. The two research objectives were:
(1) to determine the work values held by secondary teachers,
and (2) to determine if any differences exist between
teachers in a variety of teaching areas.
Subjects
Two hundred twenty Oregon certified teachers, who
teach seventh through twelfth grade, were participants in
this study. Separating teachers by grade level showed that
18% taught grade seven and eight and the remainder taught
ninth through twelfth grade.
Teachers from urban high schools and junior highs in
the upper Willamette Valley made up the majority of the
sample. Teachers from rural schools in the same area
totaled 18% of the sample. Teachers from 12 different
schools provided data for this study. See Appendix E for
a complete listing of specific schools.
36
Prior to contacting possible participants, the re
searcher met with building administrators or district office
personnel to explain the research study being conducted and
gain approval in each district. All school districts con
tacted agreed to participate in the study, provided teachers
could do so on a voluntary basis. In some instances, the
researcher was able to meet with faculty groups to explain
the study and request participation. In.other cases, the
principal attached a memo to the inventory, biographical
sheet, and cover letter and placed the information in
teachers' mailboxes. Inventories from 193 teachers were
gained in this manner.
The remaining 27 subjects were gained by requesting
participants in education classes at Portland State Univer
sity that have a large majority of secondary teachers.
Instrumentation
The data was obtained, utilizing two instruments: a
biographical data sheet and a copy of the Ohio Work Values
Inventory, in booklet form.
Biographical Data Sheet
Selected demographic characteristics of the sample
are reported by frequency and percentage of occurrence, for
descriptive purposes, in Chapter IV. The descriptors in
cluded the following: sex, age, years of teaching experi
ence, and area of teaching assignment (see Appendix B).

Ohio Work Values Inventory
This section of the paper will include a discussion
of the development, reliability and validity of the Ohio
Work Values Inventory (1973a).
Development. Fenner and Hales (1973a) said that
The Ohio Work Values Inventory (OWVI) was developed to provide a way for individuals to assess the importance they attach to those qualities of work which are personally rewarding and fullfilling. (Fenner & Hales, 1973a, p. 1)
The concept of values has been defined in many ways.
37
When reviewing the emergence of a value system which relates
values to attitudes, needs, and interests, Fenner (1972,
p. 24) indicated that values have the following
characteristics:
1. They serve as judgement standards and criteria; 2. they result from and are constantly being recon
structed within the person by means of a dynamic process;
3. they seem to involve both needs of the individual and valuations of the culture;
4. they tend to have abiding rather than transitory meaning to the person; and
5. they have generalized, inclusive, moral nature rather than specific, concrete, structured character.
The specific concept of work values has been trichoto-
mized by both Rosenberg (1957) and Ginzberg, Axlerod, and
Heime (1951). Ginzberg et al. labeled their trichotomy in-
trinsic, extrinsic, and concomitant. Rosenberg's categories
were self-expression, things obtained from work, and inter-
personal relations. Expanding these further, Super (1968)
and Crites (1969) found five dimensions of work values.

Hendrix and Super's five factors were labeled intrinsic,
extrinsic, and concomitant, self-expression and autonomy.
Although there has been no agreement upon the struc-
turing of work values, Hales and Fenner's OWVI used Ginz-
berg's scheme. Fenner (1972) stated that
The classificatory scheme initially proposed by Ginzberg and associated and subsequently adopted by Super offers an accurate, complete and workable system of classification. This system subdivides extrinsic values into a rewards-of-work grouping and a situate or concomitant value group. (p. 29)
38
Fenner and Hales (1973a, p. 8), in their manual, clas-
sified the 11 work values in the following manner. Listed
also are brief descriptions of each value.
Intrinsic values
A. Altruism--helping others B. Object Orientation--making, handling things C. Self-Realization--using your abilities & skills D. Task Satisfaction--liking the tasks you do E. Ideas/Data--using ideas, facts
Extrinsic values
A. Rewards of Work 1. Control--being in charge of others 2. Money--being paid well 3. Prestige--being known for your work 4. Security--having steady work
B. Situate 1. Independence--being your own boss 2. Solitude--not working closely with others
In discussing the criteria used in evaluating items,
Fenner an~ Hales (1973a, p. 2) said:
For each value, items were written, evaluated in terms of reading difficulty, singleness of interpretation, face validity, occupational orientation, clarity and generality, and submitted to field trials and revisions.

39
The results of the field trials were used to revise items
and to select items. Hales and Fenner (1973b, p. 21) said,
in regard to item selection, that
... After each pilot study, correlations of each item (a) with its own scale (item set), (b) with each of other scales, and (c) with total score were obtained. To be retained for the next stage of development, an item had to exhibit a higher correlation with its own scale than with other scales and exhibit a low-to-moderate correlation with total score. Items which met these criteria were retained; other items were revised or rejected.
Reliability. Reliability studies with the OWVI indi-
cate that the scales are reliable. Fenner and Hales (1973b,
p. 2), in reporting on a study of 2,174 elementary and
secondary school children, grades five to eight, said:
The results of the reliability study were favorable .... All coefficients were reasonably high for the different grade levels, for boys and girls separately within grade levels, and for different social classes. The lowest coefficient alpha was .72 for Task Satisfaction for sixth grade girls. With the exception of Task Satisfaction for the fifth and eighth grade samples, all test-retest coefficients were above .71. Most of the coefficient alphas were above .85 and most of the test-retest coefficients were above .80.
In an unpublished study of 932 second-year students
in two-year technical colleges, Hartman and Hales (1977)
administered the OWVI and the VPI. Of relevance to this
portion of the review, they found that coefficient alphas
for the OWVI ranged from a low of .79 to a high of .94.
Validity. The primary evidence for the validity of
the OWVI rests on the procedures used in constructing the
scales and the subsequent subjugation of the items of the

40
inventory to a factor analysis. When OWVI protocols from
1,976 subjects (fifth- through eighth-grade pupils) were
submitted to a principal components analysis, using a veri-
max orthogonal rotation, Fenner and Hales (1973a, p. 2)
found 11 factors which corresponded to the 11 scales of the
OWVI. They said that:
... the seven items of each scale appear to belong empirically as well as logically to the scale to which assigned. . . . Also, evidence for construct validity of the OWVI is found in the identification of the eleven factors, with each factor corresponding to a specific scale on the instrument, and in the factor loadings of the items.
In a study by Hales and Hartman (1977, pp. 1-2), the
OWVI was administered to 1,112 second-year technical college
students. A principal components factor analysis was per-
formed, using an oblique rotation. They found that the most
appropriate analysis required limiting the number of factors
to ten, resulting in the combination of two values (Self-
Realization and Task Satisfaction).
It was decided to use a principal components approach and request 11 factors. Again, nine of the factors exhibited perfect correspondence with nine of the scales of the OWVI .•.. However, the items on two scales (Self-Realization and Task Satisfaction) were confounded on two factors, the authors decided to reduce the model to 10 factors to see where the confounded items might load. All 14 items of the Self-Realization and Task Satisfaction scales loaded on the same factor. The other nine factors remained identical, in terms of the items loaded on them, with nine factors of the 11-factor model.
. . . The combination of these two scales into one factor is not particularly surprising nor does it seriously affect the construct validity of the inventory. Both scales were perceived by the authors of the OWVI as two aspects of self-actualization

as postulated in a self-theory approach to personality, and difficulty was encountered by the authors, during the construction of the inventory, in separating the two scales. Since the items logically belong where they are assigned on the two scales and since the two aspects of self-actualization are important theoretically and in terms of people's perceptions of the world of work, it is reasonable to maintain them as separate scales.
A correlational study between the scales of the OWVI
and the scales of the Scales of Values by Allport, Vernon,
41
and Lindzey (1960) was conducted by Fenner and Hales (1973b,
p. 5), using a sample of 188 eleventh-grade students. The
results were in general agreement with the predictions that
they made.
Twenty-one of the correlations between the scale values of the OWVI and the scales on the Scale of Values were significant at the .05 alpha level. . . . The major findings were that those scoring high on Theoretical Man tended to value Object Orientation and Solitude but exhibited little valuing of Altruism and Self-Realization. The Economic Man tended to value Object Orientation but not Altruism. The Aesthetic Man exhibited little valuing of Money and Prestige. The Social Man tended to value Altruism and Self-Realization, but not Object Orientation, Control and Independence. The Political Man tended to value Control, Independence, Money and Prestige, but exhibited little valuing of Altruism. Finally, those scoring high on the Religious Man scale tended to value Altruism and SelfRealization, but not Object Orientation. Evidence of criterion-related validity was found.
Procedures
The two instruments were combined into one booklet
with an accompanying cover letter (see Appendix C). Book-
lets and information were distributed to 460 teachers in
their mailboxes or during a faculty meeting. Completed

inventories were returned by 193 teachers, which indicated
a response rate of 44%. This shows a little better than
the usual response of 40% expected with this type of pro-
cedure (Best, 1981, p. 168).
42
A follow-up reminder one week after initial contact
was placed in each teacher's mailbox. No data was available
as to how many teachers responded initially versus after
the reminder. Teachers returned completed booklets to a
box provided by the researcher that was placed in the main
office of each school.
Contacts made at Portland State University were made
in a similar manner. Classes were presented information
and participation requested on a voluntary basis. Partici
pants returned booklets to their instructor the following
week. Fifty-six booklets were administered in this manner,
with 27 returned, a response rate of 48%.
Combining these two groups yielded 220 usable inven
tories. Eleven booklets were discarded because the partici
pant did not answer each question on the OWVI or, in some
cases, inadvertently missed an entire page.
Since booklets were placed in teacher mailboxes only,
those booklets that did not have biographical data completed
were added to the large teacher pool, but not used in spe
cific small sample analysis. For those inventories that
were missing part of the data, the remaining data was used
whenever possible.

Statistical Methods
Each Ohio Work Values Inventory (OWVI) was hand
scored by the researcher. When the scores for all 11 of
43
the scales were completed on each participant, the biograph
ical data and inventory scale scores were codified for com
puter analysis using the Statistical Package for the Social
Sciences (Nie, Null, Jenkins, Steinbrenner & Bent, 1975).
The biographical data and OWVI scale scores were
analyzed for the total sample; the OWVI scale scores were
also analyzed by sex and selected teaching area.
Frequency and percentage tables were constructed on
the biographical data. Tables show the breakdown of the
total sample by sex, age, years of teaching experience,
school location, and teaching area. OWVI score frequencies
with percentages were also expressed for selected teaching
areas.
The means, standard deviations, and medians of the
OWVI scores were calculated for the total teacher sample
and expressed tabularly.
For the total sample, a multivariate analysis of vari
ance, with the subject of teaching as the independent vari
able and work values as the dependent variable, was per
formed on OWVI scale scores. Alpha was set at .OS. This
procedure was used in testing the statistical hypothesis
that: There will be no significant difference in work

44
values among teachers within different teaching areas.
In the event that the statistical hypothesis for the multi-
variate analysis of variance was rejected, a univariate
analysis of variance was performed on each scale, with alpha
at .05 for each comparison. In each analysis of variance,
in the event that the statistical hypothesis
(µl = µ2 . . µj) was rejected, the appropriate research
hypothesis that not all population means were equal was
accepted. In this situation, all pair-wise mean comparisons
were made, using Tukey's test for "honest significant dif-
ferences" (Hopkins & Glass, 1978, pp. 358-364). When three
or more levels of an independent variable were involved,
each of these comparisons took a general form of µl = µ2 ,
with the research hypotheses being that µ > µ2 and µ1 < µ 2 .
The procedures described above, using teaching areas
as the independent variable, were replicated to test the
secondary hypothesis, using sex as the independent variable.
The second statistical hypothesis was that: There will be
no significant differences in work values among teachers
according to their sex.

CHAPTER IV
PRESENTATION OF THE DATA
Description of the Sample
The sample used in this study was drawn from 12 junior
and senior high schools in Oregon. Data was collected from
220 teachers who teach seventh through twelfth grades.
These schools were categorized by school location, either
rural or urban (see Table I). The size of the school, as
determined by pupil enrollment, ranged from 300 to 1,200
students.
TABLE I
SELECTED BIOGRAPHICAL CHARACTERISTICS OF THE SAMPLE BY SCHOOL LOCATION
Location Frequency
Urban 178
Rural 41
Not Answered 1
Total 220
Percent
80.9
18.6
0.5
100.0
Adjusted Percent
81. 3
18.7
100.0
The sample drew from a wide variety of teaching
fields. The biographical data sheet used by the researcher

46
listed 16 categories. There were respondents in each of
the areas listed on the data sheet, with substantially
higher numbers in the "core" or required subject areas.
This was expected, due to the larger number of teachers em
ployed by school districts in those subject areas (see
Table II).
According to Oregon certification regulations, a
teacher must be certified in a subject area that accounts
for over 50% of their teaching assignment. Because of this
provision, the subject area checked by each participant is
the one he/she is specifically trained to teach.
The sample was categorized by sex, with exact per
centages on Table III. The proportion of male to female
was nearly 50/50.
The average age of the study participants was 42.17
(median). The range of ages was from 23-62 years. Fre
quencies and percentages are listed on Table IV.
The years of teaching experience listed by partici
pants ranged from 1-41 years. The total sample had an
average of 12.77 years of teaching experience (median) (see
Table V).

TABLE II
SELECTED BIOGRAPHICAL CHARACTERISTICS OF THE SAMPLE BY TEACHING AREA
Teaching Area Frequency Percent
Agriculture 1 0
Art 3 1
Business/Personal Finance 26 12
English/Language Arts 30 14
Foreign Language 13 6
History 15 7
Horne Economics 11 5
Industrial Arts/Shop 10 5
Mathematics/Computer Science 27 13
Music 5 2
Physical Education/Health 27 13
Science--Biological 9 4
Science--General 9 4
Science--Physical 8 4
Special Education 17 8
Speech/Drama 2 1
Total 213 100
47

Sex
Male
Female
TABLE III
SELECTED BIOGRAPHICAL CHARACTERISTICS OF THE SAMPLE BY SEX
Adjusted Frequency Percent Percent
105 47.7 48.6
111 50.5 51.4
Not Answered 4 1.8 0
Total 220 100.0 100.0
48

49
TABLE IV
SELECTED BIOGRAPHICAL CHARACTERISTICS OF THE SAMPLE BY AGE
Age Frequency Percent
60-62 4 1.9
57-59 5 2.3
54-56 9 4.2
51-53 6 2.8
48-50 15 7.0
45-47 16 7.5
42-44 27 12.6
39-41 21 9.8
36-38 29 13.6
33-35 33 15.4
30-32 26 12.1
27-29 16 7.5
24-26 6 2.8
21-23 1 . 5
Total 214 100.0
Descriptive Statistics
Mean----------------39.39
Standard Deviation-- 8.52
Median--------------42.17

TABLE V
SELECTED BIOGRAPHICAL CHARACTERISTICS OF THE SAMPLE BY TEACHING EXPERIENCE
Years of Teaching Experience Frequency Percent
39-41 1 • 5
36-38 0 • 0
33-35 2 1.0
30-32 7 3.3
27-29 11 5.2
24-26 9 4.2
21-23 10 4.7
18-20 20 9.4
15-17 28 13.l
12-14 31 14.6
9-11 35 16.4
6-8 27 12.6
3-5 16 7.5
0-2 16 7.5
Total 213 100.0
Descriptive Statistics
Mean----------------13.77
Standard Deviation-- 8.02
Median--------------12.77
50

51
Principal Findings
Information included in this section falls into three
major groupings. First is the descriptive data on the total
teacher sample. Following that information is data and re
sults by subject area, and this section concludes with data
by sex of the teacher.
Descriptive Data: Total Teacher Sample
The OWVI scale means, standard deviations, and medians
for the total teacher sample are presented in Table VI.
Seven is the lowest possible score and 35 the highest. The
range in mean scores was 16.182, with the range of standard
deviations being 4.945.
The values of the secondary school teachers, in order
from highest to lowest perceived importance, are:
1. Task Satisfaction--liking the task you do
(33.018);
2. Self-Realization--using your abilities and skills
(31.736);
3. Altruism--helping others (28.632);
4. Ideas/Data--using ideas and facts (27.468);
5. Independence--being your own boss (26.005);
6. Security--having steady work (25.814);
7. Money--being paid well (24.864);
8. Control--being in charge of others (21.450);

52
TABLE VI
SCALE MEANS AND STANDARD DEVIATIONS AND MEDIANS OF TOTAL SAMPLE
Scales Mean S.D. Median
Altruism 28.632 4.778 29.262
Object Orientation 18.168 6.928 16.794
Security 25.814 5.972 26.192
Control 21.450 5.970 21.350
Self-Realization 31.736 3.097 32.533
Independence 26.005 4.974 26.088
Money 24.864 7.525 24.944
Task Sa ti sf action 33.018 2.580 34.071
Solitude 16.836 5.248 16.767
Ideas/Data 27.468 4.819 27.935
Prestige 18.895 6.426 18.571
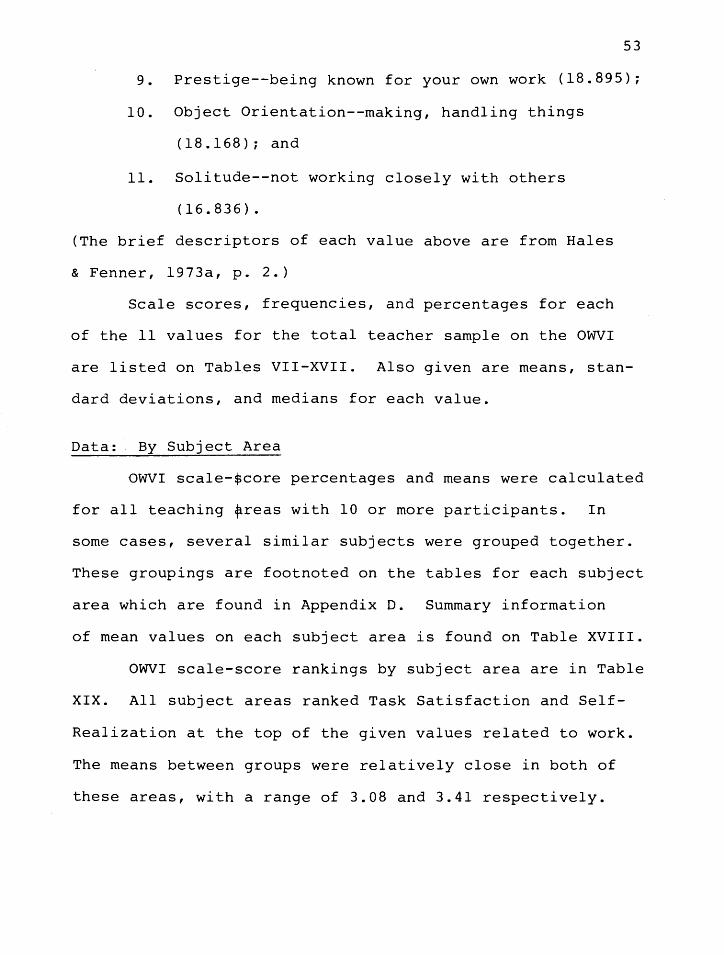
l I
53
9. Prestige--being known for your own work (18.895);
10. Object Orientation--making, handling things
(18.168); and
11. Solitude--not working closely with others
(16.836).
(The brief descriptors of each value above are from Hales
& Fenner, 1973a, p. 2.)
Scale scores, frequencies, and percentages for each
of the 11 values for the total teacher sample on the OWVI
are listed on Tables VII-XVII. Also given are means, stan-
dard deviations, and medians for each value.
Data: By Subject Area
OWVI scale-tcore percentages and means were calculated
for all teaching treas with 10 or more participants. In
some cases, several similar subjects were grouped together.
These groupings are footnoted on the tables for each subject
area which are found in Appendix D. Summary information
of mean values on each subject area is found on Table XVIII.
OWVI scale-score rankings by subject area are in Table
XIX. All subject areas ranked Task Satisfaction and Self-
Realization at the top of the given values related to work.
The means between groups were relatively close in both of
these areas, with a range of 3.08 and 3.41 respectively.

Score
35 34 33 32 31 30 29 28 27 26 25 24 23 22 21 20 19 18 17 16 15 14 13 12 11 10
9 8
TABLE VII
TEACHER SCALE SCORES FOR ALTRUISM
Frequency
18 19 12 22 31 13 21 12 16 15 11
9 9 6 4 2 2 l 5 0 0 0 0 l 0 0 0 l
Percent
8 9 5
10 10
6 10
5 7 7 5 4 4 3 2 l l 0 2 0 0 0 0 0 0 0 0 0
Descriptive Statistics
Mean----------------28.632
Standard Deviation-- 4.778
Median--------------29.262
Cumulative Percent
100 92 83 78 68 58 52 43 37 30 23 18 18 10
7 5 5 4 3 l l l l l 0 0 0 0
54
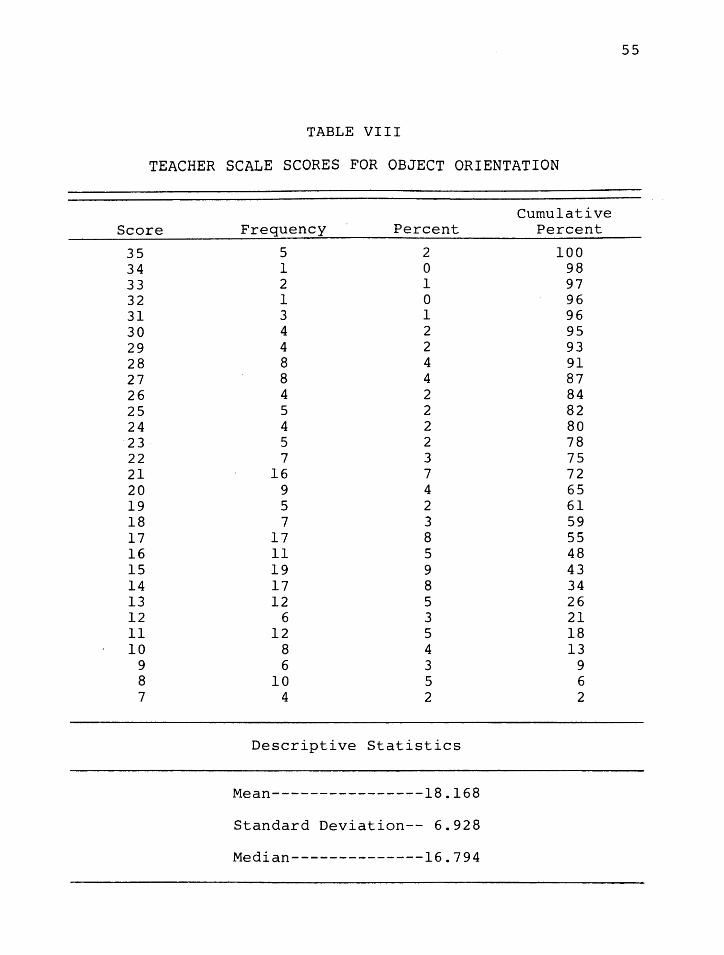
55
TABLE VIII
TEACHER SCALE SCORES FOR OBJECT ORIENTATION
Cumulative Score Frequency Percent Percent
35 5 2 100 34 1 0 98 33 2 1 97 32 1 0 96 31 3 1 96 30 4 2 95 29 4 2 93 28 8 4 91 27 8 4 87 26 4 2 84 25 5 2 82 24 4 2 80 23 5 2 78 22 7 3 75 21 16 7 72 20 9 4 65 19 5 2 61 18 7 3 59 17 17 8 55 16 11 5 48 15 19 9 43 14 17 8 34 13 12 5 26 12 6 3 21 11 12 5 18 10 8 4 13
9 6 3 9 8 10 5 6 7 4 2 2
Descriptive Statistics
Mean~---------------18.168
Standard Deviation-- 6.928
Median--------------16.794

56
TABLE IX
TEACHER SCALE SCORES FOR SECURITY
Cumulative Score Frequency Percent Percent
35 18 8 100 34 9 4 92 33 10 5 88 32 13 6 83 31 10 5 77 30 6 3 73 29 1 0 70 28 20 9 70 27 19 9 60 26 13 6 52 25 15 7 46 24 2 1 39 23 9 4 38 22 21 10 34 21 16 7 25 20 8 4 .17 19 8 4 14 18 2 1 10 17 2 1 9 16 7 3 8 15 5 2 5 14 1 0 3 13 2 1 2 12 1 0 1 11 0 0 1 10 0 0 1
9 2 1 1
Descriptive Statistics
Mean----------------25.814
Standard Deviation-- 5.972
Median--------------26.192

Score
35 34 33 32 31 30 29 28 27 26 25 24 23 22 21 20 19 18 17 16 15 14 13 12 11 10
9 8
TABLE X
TEACHER SCALE SCORES FOR CONTROL
Frequency Percent
3 1 4 2 2 1 3 1 1 0 5 2 5 2
10 5 14 6 12 5
7 3 12 5 15 7 14 6 20 9 21 10 11 5
5 2 7 3
12 5 8 4 5 2 7 3 3 1 4 2 5 2 3 1 2 1
Descriptive Statistics
Mean----------------21.450
Standard Deviation-- 5.970
Median--------------21.350
57
Cumulative Percent
100 99 97 96 95 94 92 90 85 79 73 70 65 58 51 42 33 28 25 22 17 13 11
8 6 5 2 1
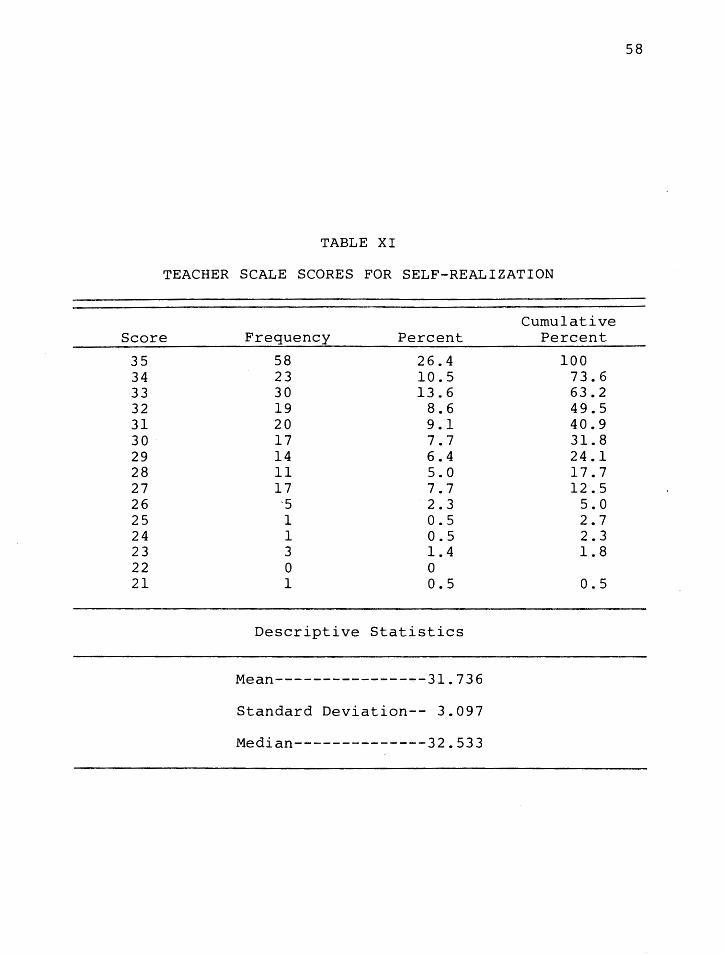
TABLE XI
TEACHER SCALE SCORES FOR SELF-REALIZATION
Score
35 34 33 32 31 30 29 28 27 2625242322 21
Frequency Percent
58 26.4 23 10.5 30 13.6 19 8.6 20 9.1 17 7.7 14 6.4 11 5.0 17 7.7
5 2.3 1 0.5 1 0.5 3 1.4 0 0 1 0.5
Descriptive Statistics
Mean----------------31.736
Standard Deviation-- 3.097
Median--------------32.533
Cumulative Percent
100 73.6 63.2 49.5 40.9 31. 8 24.1 17.7 12.5
5.0 2.7 2.3 1. 8
0.5
58

59
TABLE XII
TEACHER SCALE SCORES FOR INDEPENDENCE
Cumulative Score Frequency Percent Percent
35 9 4 100 34 11 5 96 33 8 4 91 32 7 3 87 31 5 2 84 30 16 7 82 29 14 6 75 28 13 6 68 27 20 9 62 26 17 8 53 25 18 8 45 24 15 7 37 23 11 5 30 22 9 4 25 21 12 5 21 20 14 6 16 19 6 3 10 18 7 3 7 17 3 1 4 16 1 0 2 15 1 0 2 14 3 1 1
Descriptive Statistics
Mean----------------26.005
Standard Deviation-- 4.974
Median--------------26.088

Score
35 34 33 32 31 30 29 28 27 26 25 24 23 22 21 20 19 18 17 16 15 14 13 12 11 10
9
TABLE XIII
TEACHER SCALE SCORES FOR MONEY
Frequency
29 11 12 13
4 5 6
15 5 5 9 5 7 6
21 9 3
10 5
10 10
7 3 3 4 1 2
Percent
13 5 5 6 2 2 3 7 2 2 4 2 3 3
10 4 1 5 2 5 5 3 1 1 2 0 1
Descriptive Statistics
Mean----------------24.864
Standard Deviation-- 7.525
Median--------------24.944
Cumulative Percent
100 87 82 76 70 69 66 64 57 55 52 48 46 43 40 30 26 25 20 18 14
9 6 5 3 1 1
60

TABLE XIV
TEACHER SCALE SCORES FOR TASK SATISFACTION
Score
35 34 33 32 31 30 29 28 27 26 25 24 23
Frequency Percent
95 43.2 35 15.9 21 9.5 19 8.6 14 6.4 12 5.5
6 2.7 8 3.6 3 1. 4 3 1. 4 2 0.9 1 0.5 1 0.5
Descriptive Statistics
Mean----------------33.018
Standard Deviation-- 2.580
Median--------------34.071
Cumulative Percent
100 56.8 40.9 31.4 22.7 16.4 10.9
8.2 4.5 3.2 1. 8 0.9 0.5
61

62
TABLE XV
TEACHER SCALE SCORES FOR SOLITUDE
Cumulative Score Frequency Percent Percent
31 2 1 100 30 2 1 99 29 0 0 98 28 3 1 98 27 4 2 97 26 3 1 95 25 4 2 94 24 7 3 92 23 7 3 89 22 8 4 85 21 14 6 82 20 10 5 75 19 14 6 71 18 21 10 65 17 15 7 55 16 10 5 48 15 16 7 44 14 13 6 36 13 14 6 30 12 17 8 24 11 11 5 16 10 9 4 11
9 10 5 7 8 3 1 3 7 3 1 1
Descriptive Statistics
Mean----------------16.836
Standard Deviation-- 5.248
Median--------------16.767
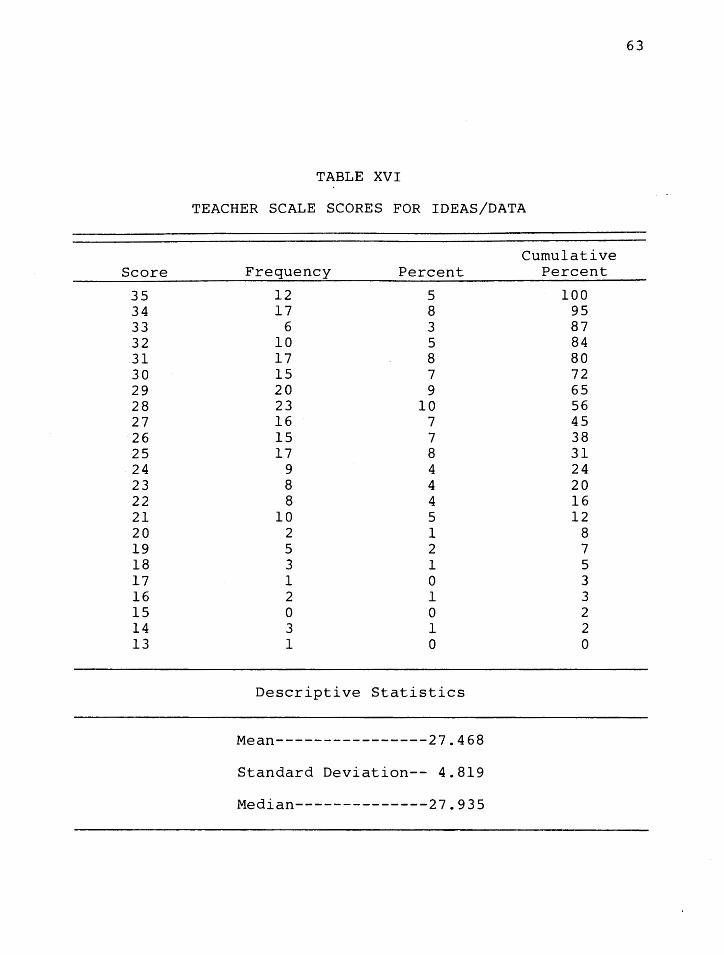
63
TABLE XVI
TEACHER SCALE SCORES FOR IDEAS/DATA
Cumulative Score Frequency Percent Percent
35 12 5 100 34 17 8 95 33 6 3 87 32 10 5 84 31 17 8 80 30 15 7 72 29 20 9 65 28 23 10 56 27 16 7 45 26 15 7 38 25 17 8 31 24 9 4 24 23 8 4 20 22 8 4 16 21 10 5 12 20 2 1 8 19 5 2 7 18 3 1 5 17 1 0 3 16 2 1 3 15 0 0 2 14 3 1 2 13 1 0 0
Descriptive Statistics
Mean----------------27.468
Standard Deviation-- 4.819
Median--------------27.935

64
TABLE XVII
TEACHER SCALE SCORES FOR PRESTIGE
Cumulative Score Frequency Percent Percent
35 4 2 100 34 2 l 98 33 2 l 97 32 l 0 96 31 2 l 96 30 l 0 95 29 3 l 95 28 7 3 93 27 8 4 90 26 9 4 86 25 4 2 82 24 8 4 80 23 7 3 77 22 10 5 74 21 15 7 69 20 14 6 62 19 14 6 56 18 14 6 50 17 10 5 43 16 15 7 39 15 14 6 32 14 10 5 25 13 4 2 21 12 10 5 19 11 11 5 15 10 8 4 10
9 5 2 6 8 6 3 4 7 2 l l
Descriptive Statistics
Mean----------------18.895
Standard Deviation-- 6.426
Median--------------18.571
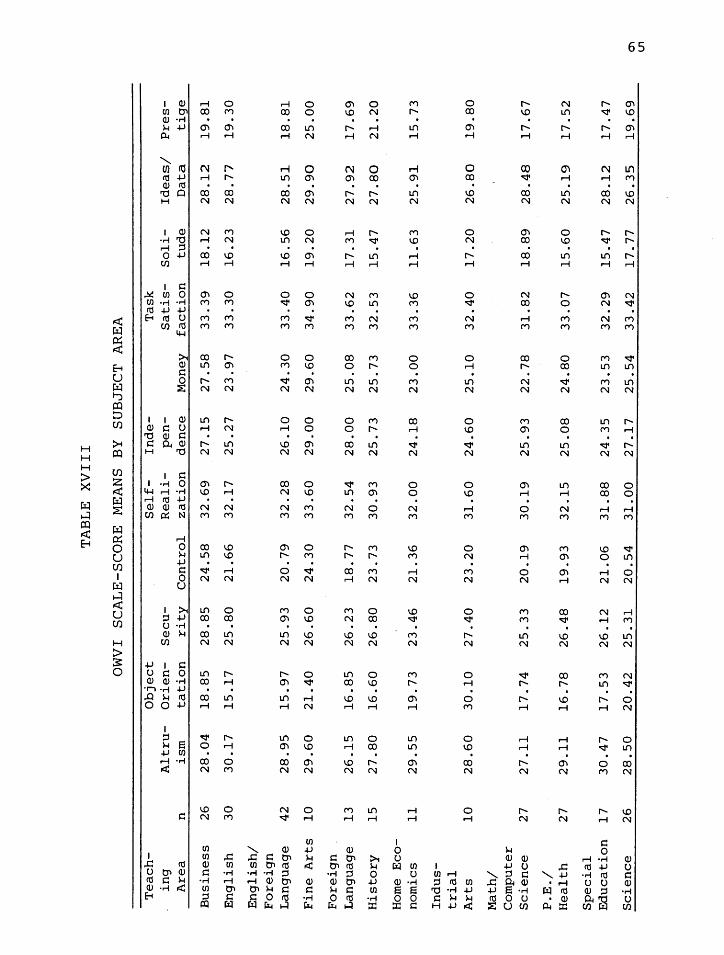
TA
BL
E
XV
III
OW
VI
SC
AL
E-S
CO
RE
M
EAN
S BY
S
UB
JEC
T
AR
EA
Tea
ch-
Ob
ject
Self
-In
de-
Tas
k
ing
A
ltru
-O
ri e
n-
Se c
u-
Reali
-p
en
-S
a tis
-S
oli
-Id
eas/
Pre
s-A
rea
n is
m
tati
on
ri
ty
Co
ntr
ol
zati
on
d
ence
M
oney
fa
cti
on
tu
de
Data
ti
ge
Bu
sin
ess
2
6
28
.04
1
8.8
5
28
.85
2
4.5
8
32
.69
2
7.1
5
27
.58
3
3.3
9
18
.12
2
8.1
2
19
.81
En
gli
sh
30
3
0.1
7
15
.17
2
5.8
0
21
.66
3
2.1
7
25
.27
2
3.9
7
33
.30
1
6.2
3
28
. 77
1
9.3
0
En
gli
sh/
Fo
reig
n
Lan
gu
age
42
2
8.9
5
15
.97
2
5.9
3
20
.79
3
2.2
8
26
.10
2
4.3
0
33
.40
1
6.5
6
28
.51
1
8.8
1
Fin
e A
rts
10
2
9.6
0
21
.40
2
6.6
0
24
.30
3
3.6
0
29
.00
2
9.6
0
34
.90
1
9.2
0
29
.90
2
5.0
0
Fo
reig
n
Lan
gu
age
13
2
6.1
5
16
.85
2
6.2
3
18
. 77
32
.54
2
8.0
0
25
.08
3
3.6
2
17
.31
2
7.9
2
17
.69
His
tory
1
5
27
.80
1
6.6
0
26
.80
2
3.7
3
30
.93
2
5.7
3
25
.73
3
2.5
3
15
.47
2
7.8
0
21
.20
Hor
ne
Eco
-n
orn
ics
11
2
9.5
5
19
.73
2
3.4
6
21
.36
3
2.0
0
24
.18
2
3.0
0
33
.36
1
1.6
3
25
.91
1
5.7
3
Ind
us-
tria
l A
rts
10
2
8.6
0
30
.10
2
7.4
0
23
.20
3
1.6
0
24
.60
2
5.1
0
32
.40
1
7.2
0
26
.80
1
9.8
0
Mat
h/
Co
mp
ute
r S
cie
nce
27
2
7 .1
1
17
.74
2
5.3
3
20
.19
3
0.1
9
25
.93
2
2.7
8
31
.82
1
8.8
9
28
.48
1
7.6
7
P.E
./
Healt
h
27
2
9.1
1
16
.78
2
6.4
8
19
.93
3
2.1
5
25
.08
2
4.8
0
33
.07
1
5.6
0
25
.19
1
7.5
2
Sp
ecia
l E
du
cati
on
1
7
30
.47
1
7.5
3
26
.12
2
1.0
6
31
.88
2
4.3
5
23
.53
3
2.2
9
15
.47
2
8.1
2
17
.47
Scie
nce
26
2
8.5
0
20
.42
2
5.3
1
20
.54
3
1.0
0
27
.17
2
5.5
4
33
.42
1
7. 7
7 2
6.3
5
19
.69
O
'I U
1

TA
BL
E
XIX
OW
VI
SC
AL
E-S
CO
RE
R
AN
KIN
GS
BY
SU
BJE
CT
A
REA
Mat
h/
En
gli
sh/
Fo
reig
n
Hom
e In
du
s-C
om-
Sp
ecia
l F
ore
ign
B
usi
-F
ine
Lan
-E
co-
tria
l p
ut e
r P
.E./
E
du
ca-
Lan
-R
ank
ness
E
ng
lish
A
rts
gu
age
His
tory
n
om
ics
Art
s S
cie
nce
Healt
h
ti o
n
Scie
nce
gu
age
1 T
ask
T
ask
T
ask
T
ask
T
ask
T
ask
T
ask
T
ask
T
ask
T
ask
T
ask
T
ask
S
a tis
-S
a tis
-S
a tis
S
a tis
-S
a tis
-S
a tis
-S
at i
s-
Sa t
is-
Sa t
is-
Sa t
is-
Sa t
is-
Sa t
is-
facti
on
fa
cti
on
fa
cti
on
fa
cti
on
fa
cti
on
fa
cti
on
fa
cti
on
fa
cti
on
fa
cti
on
fa
cti
on
fa
cti
on
fa
cti
on
2 S
elf
-S
elf
-S
elf
-S
elf
-S
elf
-S
elf
-S
elf
-S
elf
-S
elf
-S
elf
-S
elf
-S
elf
-R
eali
-R
eali
-R
eali
-R
eali
-R
eali
-R
eali
-R
eali
-R
eali
-R
eali
-R
eali
-R
eali
-R
eali
-zati
on
zati
on
zati
on
zati
on
zati
on
zati
on
zati
on
zati
on
zati
on
zati
on
zati
on
zati
on
3 S
e cu
-A
ltru
-Id
eas/
Ind
e-
Alt
ru-
Alt
ru-
Ob
ject
Ideas/
A
ltru
-A
ltru
-A
ltru
-A
ltru
-ri
ty
ism
D
ata
pen
-is
m
ism
O
ri e
n-
Dat
a is
m
ism
is
m
ism
d
ence
ta
t io
n
4 Id
eas/
Id
eas/
A
ltru
-Id
eas/
Ideas/
Ideas/
A
ltru
-A
ltru
-S
e cu
-Id
eas/
In
de-
Ideas/
Dat
a D
ata
ism
D
ata
Dat
a D
ata
ism
is
m
rity
D
ate
pen
-D
ata
den
ce
5 A
ltru
-S
ecu
-M
oney
S
ecu
-S
e cu
-In
de-
Se c
u-
Ind
e-
Ideas/
S
ecu
-Id
eas/
Ind
e-
ism
ri
ty
rity
ri
ty
pen
-ri
ty
pen
-D
ata
rity
D
ata
pen
-d
ence
d
ence
d
ence
6 M
oney
In
de-
Se c
u-
Alt
ru-
Ind
e-
Se c
u-
Ideas/
S
ecu
-In
de-
Ind
e-
Mon
ey
Se c
u-
pen
-ri
ty
ism
p
en
-ri
ty
Dat
a ri
ty
pen
-p
en
-ri
ty
den
ce
den
ce
den
ce
den
ce
7 In
de-
Mon
ey
Ind
e-
Mon
ey
Mon
ey
Mon
ey
Mon
ey
Mon
ey
Mon
ey
Mon
ey
Secu
-M
oney
p
en
-p
en
-ri
ty
den
ce
den
ce
°' °'

Ran
k
8 9
10
11
TA
BL
E
XIX
--C
on
tin
ued
Mat
h/
En
gli
sh/
_F
ore
ign
H
ome
Ind
us-
Com
-S
pecia
l F
ore
ign
B
usi
-F
ine
Lan
-E
co-
tria
l p
ut e
r P
.E./
E
du
ca-
Lan
-n
ess
E
ng
lish
A
rts
gu
age
His
tory
n
om
ics
Art
s S
cie
nce
Healt
h
ti o
n
Scie
nce
gu
age
Co
ntr
ol
Co
ntr
ol
Pre
s-C
on
tro
l C
on
tro
l C
on
tro
l In
de-
Co
ntr
ol
Co
ntr
ol
Co
ntr
ol
Co
ntr
ol
Co
ntr
ol
tig
e
pen
-d
ence
Pre
s-P
res-
Co
ntr
ol
Pre
s-P
res-
Ob
ject
Co
ntr
ol
So
li-
Pre
s-O
bje
ct
Ob
ject
Pre
s-ti
ge
tig
e
tig
e
tig
e
Ori
en
-tu
de
tig
e
Ori
en
-O
rien
-ti
ge
ta ti
on
ta
t io
n
tati
on
Ob
ject
So
li-
Ob
ject
So
li-
Ob
ject
Pre
s-P
res-
Ob
ject
Ob
ject
Pre
s-P
res-
So
li-
Ori
en
-tu
de
Ori
en
-tu
de
Ori
en
-ti
ge
tig
e
Ori
en
-O
ri e
n-
tig
e
tig
e
tud
e
tati
on
ta
tio
n
tati
on
ta
tio
n
ta ti o
n
So
li-
Ob
ject
So
li-
Ob
ject
So
li-
So
li-
So
li-
Pre
s-S
oli
-S
oli
-S
oli
-O
bje
ct
tud
e
Ori
en
-tu
de
Ori
en
-tu
de
tud
e
tud
e
tig
e
tud
e
tud
e
tud
e
Ori
en
-ta
tio
n
tati
on
ta
ti
on
"' .....J

68
Altruism, helping others, was listed by six of the
teaching fields as their third value priority. Business
teachers listed Security; Foreign Language teachers listed
Independence; Industrial Arts teachers listed Object Orien
tation; and Ideas/Data was valued third by both Fine Arts
and Math/Computer Science teachers.
Solitude was listed as the least important by eight
of the teaching fields. Math/Computer Science teachers
placed Prestige last, and Object Orientation placed last
with both English and Foreign Language teachers. Prestige
and Object Orientation placed near the bottom, by priority,
on most all teacher groupings.
A multivariate analysis of variance was performed with
teaching (subject) areas as the independent variable and
the scales of the OWVI as the dependent variable. Groupings
for this analysis were: Math/Computer Science, Science,
English/Foreign Language, P.E./Health, Business, History,
and Special Education.
The F value for the Hotellings' test was 1.374; this
was significant at the .05 level E = .029). Therefore, the
statistical hypothesis was rejected, and univariate
analyses of variance were performed on the 11 dependent
variables (see Table XX).
Two statistical hypotheses were rejected at the .05
level. Significant differences were found among the groups
for Control E = .0259) and Self-Realization E = .0310).

TA
BL
E
XX
OW
VI
SC
AL
E-S
CO
RE
A
NA
LY
SIS
OF
VA
RIA
NC
E!
BY
TE
AC
HIN
G-A
RE
A
Betw
een
W
ith
in
Bet
wee
n
Wit
hin
P
rob
ab
ilit
y
Vari
ab
le
S.S
. S
.S.
M.S
. M
.S.
F.
of
F
Alt
ruis
m
14
9.4
14
2
39
42
.33
72
2
4.9
02
4
22
.67
44
1
.09
8
0.3
65
3
Ob
ject
Ori
en
tati
on
4
13
.45
36
6
76
9.6
29
0
68
.90
89
3
8.9
05
9
1.
77
1
0.1
07
6
Secu
rity
5
8.8
27
6
61
76
.61
93
9
.80
46
3
5.4
97
8
0.2
76
0
.94
75
Co
ntr
ol
47
9.3
47
2
56
37
.72
44
7
9.8
91
2
32
.40
07
2
.46
6
0.0
25
92
Self
-Reali
zati
on
1
29
.39
86
1
57
6.3
69
1
21
.56
64
9
.05
96
2
.38
1
0.0
31
02
Ind
ep
en
den
ce
14
2.2
30
6
39
77
. 57
04
2
3.7
05
1
22
.85
96
1
.03
7
0.4
03
0
Mo
ney
3
82
.91
17
9
50
7.3
42
5
63
.81
86
5
4.6
39
9
1.1
68
0
.32
56
Task
S
ati
sfa
cti
on
6
4.3
63
6
11
65
.96
77
1
0. 7
27
3
6.7
01
0
1.6
01
0
.14
95
So
litu
de
28
0.7
73
6
45
51
. 02
77
4
6.7
95
6
26
.15
53
1
. 7
89
0
.10
38
Ideas/D
ata
2
66
.58
88
3
61
6.2
62
2
44
.43
15
2
0.7
83
1
2.1
38
0
.05
14
Pre
sti
ge
24
2.5
57
4
64
85
.46
46
4
0.4
26
2
37
.27
28
1
.08
5
0.3
73
5
1 T
he
F v
alu
e in
th
e H
ote
llin
gs'
test
was
1
.37
4,
wit
h
11
an
d
20
4 d
f;
this
w
as sig
nif
ican
t at
the
.05
alp
ha le
vel.
2sig
nif
ican
t at
the p
rescri
bed
.0
5
alp
ha le
vel.
O
'\ l.O
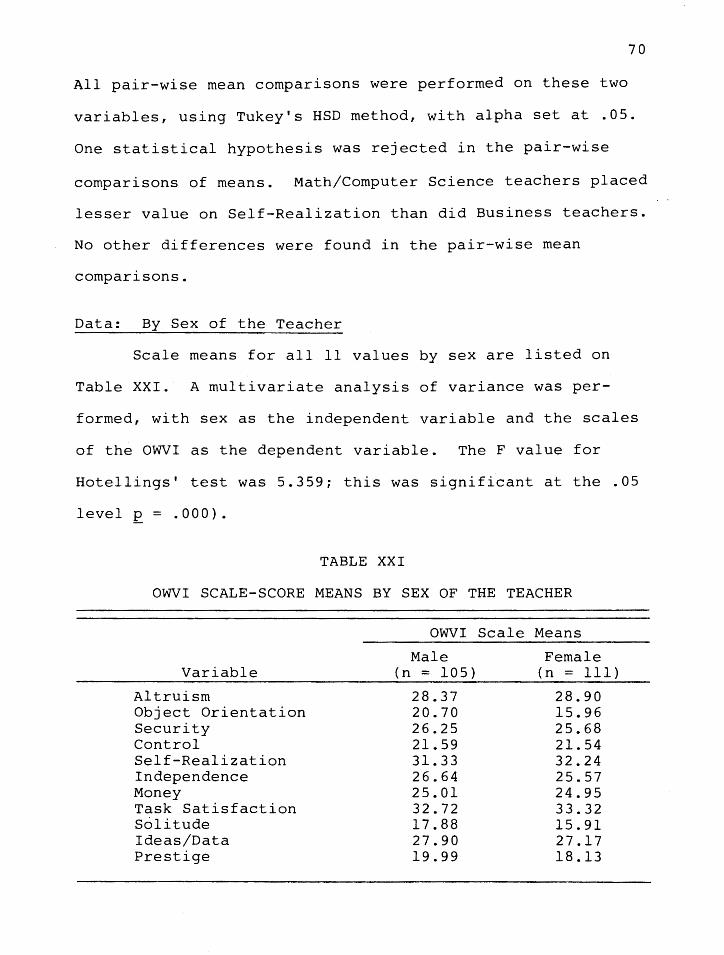
70
All pair-wise mean comparisons were performed on these two
variables, using Tukey's HSD method, with alpha set at .05.
One statistical hypothesis was rejected in the pair-wise
comparisons of means. Math/Computer Science teachers placed
lesser value on Self-Realization than did Business teachers.
No other differences were found in the pair-wise mean
comparisons.
Data: By Sex of the Teacher
Scale means for all 11 values by sex are listed on
Table XXI. A multivariate analysis of variance was per-
formed, with sex as the independent variable and the scales
of the OWVI as the dependent variable. The F value for
Hotellings' test was 5.359; this was significant at the .05
level E = .000).
TABLE XXI
OWVI SCALE-SCORE MEANS BY SEX OF THE TEACHER
Variable
Altruism Object Orientation Security Control Self-Realization Independence Money Task Satisfaction Solitude Ideas/Data Prestige
OWVI Scale Means
Male (n = 105)
28.37 20.70 26.25 21. 59 31.33 26.64 25.01 32.72 17.88 27.90 19.99
Female (n = 111)
28.90 15.96 25.68 21. 54 32.24 25.57 24.95 33.32 15.91 27.17 18.13

71
The statistical hypothesis was rejected, and univari
ate analyses of variance were performed on the 11 dependent
variables (see Table XXII). Four statistical hypotheses were
rejected at the .05 level. Significant differences were
found on Object Orientation, Solitude, Prestige, and Self
Realization, with female teachers placing lesser value on
the first three and greater value on the Self-Realization
value than did the male teachers.
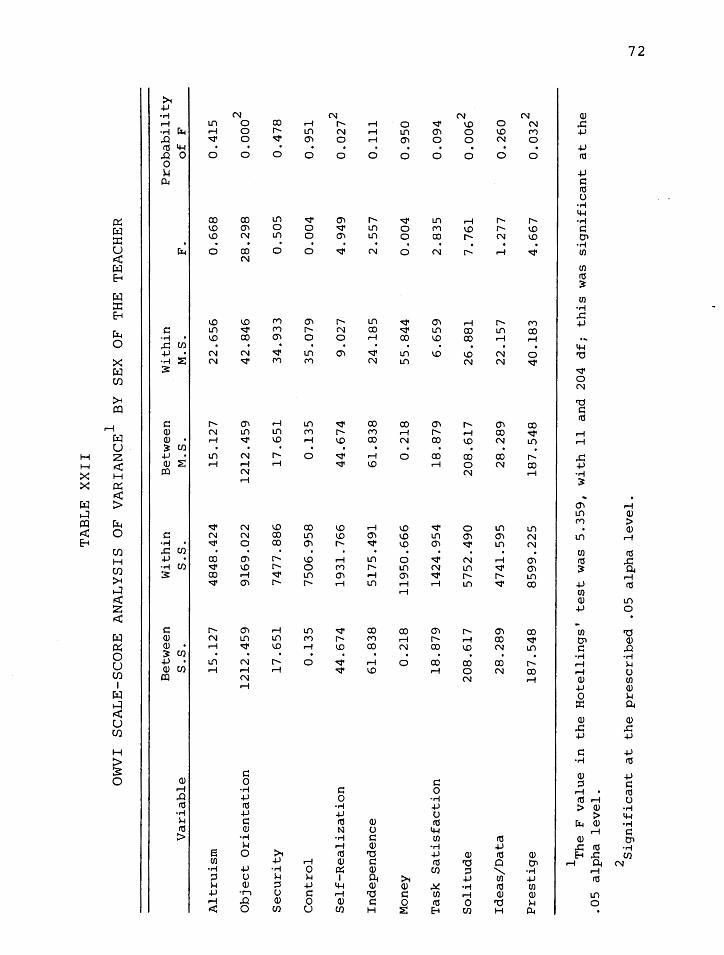
TA
BL
E
XX
II
OW
VI
SC
AL
E-S
CO
RE
A
NA
LY
SIS
OF
VA
RIA
NC
E1
BY
SEX
O
F TH
E TE
AC
HER
Bet
wee
n
Wit
hin
B
etw
een
W
ith
in
Pro
bab
ilit
y
Vari
ab
le
S.S
. S
.S.
M.S
. M
.S.
F.
of
F
Alt
ruis
m
15
.12
7
48
48
.42
4
15
.12
7
22
.65
6
0.6
68
0
.41
5
Ob
ject
Ori
en
tati
on
1
21
2.4
59
9
16
9.0
22
1
21
2.4
59
4
2.8
46
2
8.2
98
0
.00
02
Secu
rity
1
7.6
51
7
47
7.8
86
1
7.6
51
3
4.9
33
0
.50
5
0.4
78
Co
ntr
ol
0.1
35
7
50
6.9
58
0
.13
5
35
.07
9
0.0
04
0
.95
1
Self
-Reali
zati
on
4
4.6
74
1
93
1. 7
66
4
4.6
74
9
.02
7
4.9
49
0
.02
72
Ind
ep
en
den
ce
61
. 8
38
5
17
5.4
91
6
1.8
38
2
4.1
85
2
.55
7
0.1
11
Mo
ney
0
.21
8
11
95
0.6
66
0
.21
8
55
.84
4
0.0
04
0
.95
0
Task
S
ati
sfa
cti
on
1
8.8
79
1
42
4.9
54
1
8.8
79
6
.65
9
2.8
35
0
.09
4
So
litu
de
20
8.6
17
5
75
2.4
90
2
08
.61
7
26
.88
1
7.7
61
0
.00
62
Ideas/D
ata
2
8.2
89
4
74
1.5
95
2
8.2
89
2
2.1
57
1
.27
7
0.2
60
Pre
sti
ge
18
7.5
48
8
59
9.2
25
1
87
.54
8
40
.18
3
4.6
67
0
. 0
32
2
1 T
he
F v
alu
e in
th
e H
ote
llin
gs'
test
was
5
.35
9,
wit
h
11
an
d
20
4 d
f;
this
w
as sig
nif
ican
t at
the
.05
alp
ha le
vel.
2sig
nif
ican
t at
the p
rescri
bed
.0
5
alp
ha le
vel.
....
.J N

CHAPTER V
ANALYSIS OF DATA
Summary of the Study
The major focus of this study was to determine the
work values held by secondary teachers. The secondary anal
ysis involved a comparison of work values held by teachers
in varying subject areas, and comparison by sex of the
teacher. The sample consisted of 2~0 Oregon teachers,
seventh through twelfth grades, located in 12 Upper Willam
ette Valley rural and urban secondary schools. The teachers
had a median age of 42.17 and were split 48% male and 51%
female. The median years of teaching experience was 12.77
years.
The study participants were all administered the OWVI
and a biographical data sheet. The biographical data was
listed by frequency and percent. The OWVI scale means,
standard deviations, and medians were calculated for the
entire sample. Frequency and percentages were also listed
for each of the 11 OWVI scales.
The range of means for the teacher sample on the OWVI
scales was 16.182 points. Task Satisfaction (33.018), Self
Realization (31.736), and Altruism (28.632) were valued the

74
most by secondary teachers. Prestige (18.895), Object
Orientation (18.168), and Solitude (16.836) were valued the
least.
Scale-score percentages were calculated on selected
teaching fields. Task Satisfaction and Self-Realization
were valued the most by all teaching groups. The remaining
values varied by ranking, with Solitude, Prestige, and Ob
ject Orientation placing in the last three positions on most
priority listings of teachers by subject area.
A multivariate analysis of variance was performed with
subject areas as the independent variable and the scales
of the OWVI as the dependent variable. The statistical
hypothesis was rejected, and univariate analyses of variance
were performed on the 11 dependent variables.
Two statistical hypotheses were rejected at the .05
level. Significant differences were found among groups for
Control and Self-Realization. All pair-wise mean compari
sons were performed on these two variables, with one statis
tical hypothesis rejected in the pair-wise comparisons of
means. Math/Computer Science teachers placed lesser value
on Self-Realization than did Business teachers.
Scale means were listed by sex of the teacher. A mul
tivariate analysis of variance was performed with sex as
the independent variable and the OWVI scales as the depen
dent variable. The statistical hypothesis was rejected,
and univariate analyses of variance were performed on the

75
11 dependent variables, with four being rejected at the .05
level. Significant differences were found; female teachers
placed more value on Self-Realization. Males placed sig
nificantly higher value on Solitude, Prestige, and Object
Orientation than did the female teachers.
Conclusions
The Ohio Work Values Inventory can be used to measure
the work values of secondary teachers. The profile of the
secondary teacher is distinctive, with a range of 16.182
points. Task Satisfaction, Self-Realization, and Altruism
were valued the most, and Prestige, Object Orientation, and
Solitude the least.
This ordering closely parallels the results of A. K.
Hale's (1977) practicing nurses' sample, the majority of
which were employed in Ohio. When the OWVI scale means were
ranked for the nursing sample and for the high school
teacher sample, the Spearman rank order coefficient was
+.96; nevertheless, the absolute strength (magnitude of
means) differed between the two samples from scale to scale.
It would appear that nurses in the previous study, the
teachers from this sample, and perhaps other helping profes
sions have somewhat similar profiles in regard to the shape.
In the comparison of the work values of teachers in
seven teaching fields, the statistical hypothesis for the
multivariate and two univariate analyses of variance were

76
rejected, but only one of the statistical hypotheses for
pair-wise mean comparisons was rejected. The Oregon second
ary teachers in different subject fields, from this Oregon
sample, seem to hold somewhat different values, but the con
striction of sample size and number of groups compared on
the statistical test did not permit one identification of
these differences. A visual inspection of the profiles sug
gests that there may be clusters of fields in which the
teachers, within the fields of a cluster, hold similar
values to one another.
The results of this study with regards to differences
of work values between males and females follow and support
earlier research with this instrument. Secondary teachers
varied by sex on four of the values. Female teachers placed
higher value on Self-Realization and males showed a higher
value for Object Orientation, Solitude, and Prestige.
Hales and Hartman's (1978) study of undergraduate stu
dents found significant differences on seven of the uni
variate ratios. The means for females were above the means
for males on Altruism, Task Satisfaction, and Self-Realiza
tion, but were below the means for males on Control, Money,
Solitude, and Prestige.
Hales and Yackee (1974) and Hales and Fenner (1973)
all showed differences between the sexes. It should be
noted that these two studies were performed on elementary
school children, which supports the fact that differences
in value orientations are visible early in life.
Recommendations for Further Research
From the research and conceptualization of a number
of scholars, it may be concluded that the values which
people hold influence their behavior (Shaver & Larkins,
1969, 1973; Rokeach, 1973) and that teachers serve as role
models for their students (Pullias & Young, 1968; Freese
& West, 1972; Kirschenbaum & Simon, 1973), often contrib
uting to the development of the values and value systems
of their students (Harmin & Simon, 1971; Senesh, 1976).
77
Since the results of this study indicate that second
ary teachers in general present a work values profile which
is high on Task Satisfaction, Self-Realization, and Altruism
and relatively low on Object Orientation and Solitude, if
teachers are indeed serving as role models, then one might
expect that students will be influenced in the direction
of their teachers' values.
This may be somewhat modified, exerting a differential
modifying influence as a result of differences in profile
among teachers, particularly since there is reason to be
lieve these differences cluster somewhat around teaching
disciplines. Nevertheless, these results suggest that it
is important for teachers to be aware of their own work
values, so as not·to unknowingly convey approval/disapproval
78
of various work values, and that the curriculum should pro
vide an opportunity for students to develop skills in value
clarification.
The results of this study indicate that teachers in
differing teaching fields do exhibit differences in values,
although specific differences were not clearly identified
by the study. Because of the potential influence of work
values of teachers on the role models which they present
and behaviors they exhibit in their interactions with stu
dents, it is recommended that future studies be conducted
to provide work value profiles for various teaching fields.
Because this is the first study of this type using
secondary teachers as subjects, it would be beneficial to
replicate this study in a variety of geographic and socio
economic situations, in order to compare those results with
the data obtained in this study. It must also be noted that
participants in this study did so on a voluntary basis, and
that those teachers who chose not to participate may hold
somewhat different value profiles than the one described
in this study.

A SELECTED BIBLIOGRAPHY
Allport, G. w., Vernon, P. E. & Lindzey, G. Study of Values. Boston: Houghton Mifflin, 1960.
Beach, D. P. Necessary Work Values, Habits, and Attitudes: A Final Report. Jefferson City, Mo.: Missouri State Department of Education, Research Coordinating Unit, 1978a.
Beach, D. P. Affective Work Competencies, Phase II, Final Report. Jefferson City, Mo.: Missouri State Department of Education, Research Coordination Unit, 1978b.
Best, J. W. Research in Education. Englewood Cliffs, N.J.: Prentice Hall, 1981.
Bloom, B. S., Krathwohl, D. R., & Masia, B. B. Taxonomy of Educational Objectives. Handbook II: Affective Domain. New York: David McKay Company, 1974.
Combs, A. W. & Snygg, D. Individual Behavior. New York: Harper and Row, 195 .
Crites, J. o. Vocational Psychology. New York: McGrawHill, 196 .
Curry, C. W. "Vocational Education and the Changing American Work Ethic." In Values, Concepts and Techniques, pp. 224-34. Washington, D.C.: National Education Association, 1976.
Dewey, J. Theory of Valuation. Chicago: The University Press, 1939.
Drummond, R. J., Pinette, C. A. & Smith, R. K. "Examining the Effects of Self-Concept and Work Values on Reading Achievement." Reading World, 1977, 16 (March): 206-212.
Elkind, D. A Sympathetic Understanding of the Child Six to Sixteen. Boston: Allyn and Bacon, Inc., 1971.
80
Fenner, B. J. "The Development of the Ohio Work Values Inventory: An Investigation of Internal Characteristics." Ph.D. dissertation, Ohio University, 1972. Dissertation Abstracts International 1972 33/04A, p. 1433 (University Microfilms No. 72-26366).
Fenner, B. J. & Hales, L. W. "Measuring the Work Values of Elementary School Children." Paper presented at the annual meeting of the American Educational Research Association, New Orleans, La., 1973a.
Fenner, B. J. & Hales, L. W. "The Development of a Work Values Inventory." Paper presented at the annual meeting of the National Council on Measurement in Education, New Orleans, La., 1973b.
Freese, G. T. & West, c. K. "Congruence, Empathy and Regard: A Comparison of Adolescent Ratings with Teacher Self-Ratings." Adolescence, 1972, ~ (Winter):525-29.
Gade, E. M. & Peterson, G. "Intrinsic and Extrinsic Work Values and the Vocational Maturing of VocationalTechnical Students." Vocational Guidance Quarterly, 1977, 26 (December):l2S-29.
Garrett, P. G. The Teachers We Need. Consumer and Homemaking Education, Opportunity and Challenge. Washington, D.C.: American Home Economics Association, 1971.
Ginzberg, E., Ginzberg, S. W., Axlerod, S. & Heime, J. L. Occupational Choice: An Approach to a General Theory.
New York: Columbia University Press, 1951.
Grace, J. C. "Work Values of Community College Students: An Exploratory Investigation of Freshmen at Middlesex Community College." Ph.D. dissertation, Boston College, 1972. Dissertation Abstracts International, 1974, 38/05A, p. 2557 (University Microfilms No. 74-20703).
Gribben, W. D. & Lohnes, P. R. "Shifts in Adolescents' Vocational Values." Personnel and Guidance Journal, 1965, 44:248-52.
Hales, A. K. "A Comparative Study of the Work Values of Nurses versus the Work Values of Nurse Trainees." Master's thesis, Ohio University, 1977.
81
Hales, L. W. "The Ohio Work Values Inventory: Development, Research and Utilization." Invited address presented at the annual meeting of the Research and Development Association for Education, Williamsburg, Va., November 1977.
Hales, L. w. & Fenner, B. J. 11th Grade Students." 1972a, 20:60-66.
Hales, L. W. & Fenner, B. J. ences in Work Values." 1972b, 20:199-203.
Hales, L. W. & Fenner, B. J. Manual. 1973a.
"Work Values of 5th, 8th and Vocational Guidance Quarterly,
"Sex and Social Class DifferVocational Guidance Quarterly,
Ohio Work Values Inventory
Hales, L. W. & Fenner, B. J. "Sex and Social Class Differences in Work Values." Elementary School Guidance and Counseling, 1973b, 8:26-32.
Hales, L. w. & Hartman, T. P. "Personality, Sex and Work Values." Journal of Experimental Education, 1978, 47 (Fall):l6-2l.
Hales, L. W. & Yackee, K. "Self-concepts, Sex and Work Values." Paper presented at the annual meeting of the American Educational Research Association, Chicago, Ill., 15-19 April 1974.
Hammond, M. "Motives Related to Vocational Choices of College Freshmen." Journal of Counseling Psychology, 1956, 19:257-61.
Handley, H. M. & Shill, J. F. "Vocational Education Teachers' Evaluation of Preservice Professional Training as Related to Their Work Values and Attitudes toward Students and Teaching." Paper presented at the Mid-South Educational Research Association Conference, Memphis, Tenn., 14-17 November 1973.
Handley, H. M. & Shill, J. F. Vocational Education Teachers Evaluation of Preservice Professional Training as Related to Their Work Values and Attitudes toward Students and Teaching. Mississippi State Department of Education, Jackson. Division of Vocational and Technical Education, June 1974.
Harmin, M. & Simon, S. B. "Values." In s. B. Simon & H. Kirschenbaum (Eds.). Readings in Value Clarification. Minneapolis, MN: Winston Press, 1973.
82
Hartman, T. P. "Differentiating among Vocational College Students with the VIP and OWVI." Ph.D. dissertation, Ohio University, 1977. Dissertation Abstracts International, 1977, 38/05A, p. 2557 (University Microfilms No. DBJ77-23465).
Holland, J. L. Making Vocational Choices: A Theory of Careers. Englewood Cliffs, N.J.: Prentice-Hall, Inc., 1973.
Hopkins, K. D. & Glass, G. V. Basic Statistics for the Behavioral Sciences. Englewood Cliffs, N.J.: PrenticeHall, Inc., 1978.
Horney, K. Our Inner Conflicts. New York: Norton, 1945.
Katz, M. Decisions and Values: A Rationale for Secondary School Guidance. New York: College Entrance Examination Board, 1963.
Kirschenbaum, H. & Simon, S. B. "Values and the Futures Movement in Education." In Learning for Tomorrow. New York: Random House, 197 .
Krause, D. A. "A Study of Work Values as They Relate to Holland's Six Personal Orientations." College of Education, Missouri University, 1970. (Unpublished.)
Maslow. A. H. Motivation and Personality. New York: Harper, 1954.
Mitchell, M. M. "Teacher Attitudes." High School Journal, 1976, 59 (April):302-312.
Nie, N. H., Null, C. H., Jenkins, J. G., Steinbrenner, K. & Bent, D. H. Statistical Package for the Social Sciences. New York: McGraw Hill Book Company, 1975.
Oliver, D. W. & Shaver, J. P. Teaching Public Issues in the ijigh School. Boston: Houghton Mifflin, 1966; reprint ed., Logan, Utah: Utah State University Press, 1974.
Perrone, P. A. "Values and Occupational Preferences of Junior High School Girls." Personnel and Guidance Journal, 1965, 44:253-57.
Pullias, E. v. & Young, J. D. Bloomington and London: 1968.
A Teacher Is Many Things. Indiana University Press,

83
Purpel, D. & Ryan, K. Moral Education •.• It Cornes with the Territory. Berkeley, Cal.: McGutchan Publishing Corp., 1976.
Queensland Board of Teacher Education. Secondary Schools and the World of Work: The Experience of Queensland Teachers. Toowong, Australia: Queensland Board of Teacher Education, July 1981.
Raths, L., Harrnin, M. & Simon, S. Values and Teaching. Columbus, Ohio: Charles E. Merrill Publishing Co., 1978.
Roe, A. "Early Determinants of Vocational Choice." Journal of Counseling Psychology, 1957, 4:212-217.
Rogers, c. R. "Toward a Modern Approach to Values: The Valuing Process in the Mature Person." In S. B. Simon & H. Kirschenbaum (Eds.). Readings in Value Clarification. Minneapolis, MN: Winston Press, 1973.
Rokeach, M. Press,
The Nature of Human Values. 1973.
New York: Free
Rosenberg, M. Occupations and Values. Glencoe, Ill.: Free Press, 1957.
Sarason, I. G. & Sarason, B. R. Modeling and Role-Playing in the Schools: A Manual with Special Reference to the Disadvantaged Student. Washington, D.C.: Office of Education, 1973.
Scott, W. E., Jr. & Day, G. L. "Personality Dimensions and Vocational Interests among Graduate Business Students." Journal of Counseling Psychology, 1972, 19: 30-36.
Senesh, L. "The Challenge of Value Commitment." In Values, Concepts and Techniques, pp. 277-87. Washington, D.C.: National Education Association, 1976.
Shaver, J. P. & Berlack, K., eds. Democracy, Pluralism, and the Social Studies: Readings and Commentary. Boston: Houghton Mifflin, 1968.
Shaver, J. P. & Larkins, A. G. "The Analysis of Public Issues: Concepts, Materials, Research." Report to the U.S. Office of Education, Project No. 6-2288. Logan, Utah: Bureau of Educational Research, 1969.

84
Shaver, J. P. & Strong, w. Facing Value Decisions: Rationale-Building for Teachers. Belmont, Cal.: Wadsworth Publishing Co., Inc., 1976.
Simon, s. B. & de Sherbinin, P. "Values Clarification: It Can Start Gently and Grow Deep." Phi Delta Kappan, 1975, ~ (June):679-683.
Slocum, w. w., Jr. & Hand, H. H. "Prediction of Job Success and Employee Satisfaction for Executives and Foremen." Training & Development Journal, 1971, 25 (October): 28-37.
Stefflre, B. tory.
Tentative Manual for Vocational Values InvenEast Lansing: Michigan State University, 1962.
Smith, G. D. Attitudes of Teachers toward Career Education. Greeneville, Tenn.: Greeneville City Schools, Bureau of Elementary and Secondary Education, October 1974.
Super, D. E. Work Values Inventory. Boston: Houghton Mifflin, 1968.
Super, D. E. Manual for the Work Values Inventory. Boston: Houghton Mifflin, 1970.
Thomas, H. B. "The Effects of Social Position, Race, and Sex on Work Values of Ninth Grade Students." Paper presented at the annual meeting of the American Research Association, New Orleans, La., 25 February--! March 1973.
Tyson, J. C. & Carroll, M. A. Conceptual Tools for Teaching in Secondary Schools. Boston: Houghton Mifflin Co., 1970.
Vanderink, P. "Identification and Comparison of Work Values and Job Perceptions of Urban Business Education Students and Clerical Office Workers." Delta Pi Epsilon Journal, 1980, 22 (October):21-34.
APPENDIX A
OHIO WORK VALUES INVENTORY
Information regarding the Ohio Work Values Inventory
is available through:
Publication Test Service
McGraw Hill Publishing Company
DelMonte Research Park
Monterey, California 93940

APPENDIX B
BIOGRAPHICAL DATA SHEET
1. Sex: Male Female
2. Age:
3. Years of Teaching Experience:
4. School Location: Urban Rural
5. School Name:
6. Please check the ONE area that most closely identifies your teaching assignment.
Agriculture
Art
Business/Careers/Personal Finance
English/Language Arts
Foreign Language
History/Social Studies
Home Economics
Industrial Arts/Shop
Mathematics/Computer Science
Music
Physical Education/Health
Science--Biological
Science--Physical
Science--General
Special Education
Speech/Drama
Other: Please specify
APPENDIX C
COVER LETTER TO PARTICIPANTS
THE WORK VALUES OF SECONDARY TEACHERS:
A COMPARATIVE STUDY BY TEACHING ASSIGNMENT
Introduction
There is a growing emphasis on the need for introducing the world of work and for laying a foundation in career decision making at all levels of the school system. School professionals are increasingly being asked to take part in helping young people become more aware of their value orientations, the process by which values are shaped, and the integration of these into their consideration of work plans.
The influence teachers have on their students has been documented in several areas. The values regarding work that classroom teachers hold will affect their approach to teaching; and in turn will provide role modeling to the students.
Purpose of the Study
The purpose of this study is to determine the general work values held by classroom teachers. The results will be divided by subject area to determine differences which may exist among teachers in a variety of teaching assignments.
The information gained in this type of study can be used in many ways, some of which are listed below:
1. Planning and evaluating curriculum.
2. Helping teachers understand areas of common agreement or the differences among peers in the same or other disciplines.
3. Helping administrators understand and work more effectively with their staff.

88
4. When teachers are aware of their own personal work values, they are less likely to impose them on their students.
Study Participants
All teachers providing data for this study participate on a voluntary basis. All results will be strictly anonymous and will be safeguarded on a professional level.
* * * * * * * * * * *
I wish to thank all participants for their time and input on this project, your cooperation is greatly appreciated.
Charlotte M. Klampe Graduate Studies--Education Portland State University

APP
EN
DIX
D
(l)
OW
VI
SCA
LE
-SC
OR
E
PER
CE
NT
AG
ES:
B
US
INE
SS
1 TE
AC
HER
S (n
=
2
6)
Ob
ject
Self
-A
ltru
-O
ri e
n-
Reali
-In
dep
en
-T
ask
S
at-
Ideas/
Sco
re
ism
ta
tio
n
Secu
rity
C
on
tro
l zati
on
d
en
ce
Mon
ey
isfa
cti
on
S
oli
tud
e
Data
P
resti
ge
35
7
.7
4.0
7
.7
30
.8
3.8
1
9.0
4
6.2
7
.7
34
3
.8
3.8
3
.8
11
.5
3.8
1
2.0
1
1.5
1
1.5
3
3
11
.5
15
.4
15
.4
4.0
7
.7
32
7
.7
4.0
3
.8
19
.2
8.0
2
3.l
7
.7
31
4
.0
11
.5
3.8
7
.7
7.7
4
.0
3.8
7
.7
3.8
3
0
7.7
4
.0
3.8
7
.7
15
.4
4.0
3
.8
7.7
2
9
11
.5
3.8
1
1.5
3
.8
3.8
2
8
4.0
3
.8
15
.4
15
.4
4.0
1
1.5
3
.8
27
7
.7
7.7
7
.7
3.8
7
.7
4.0
3
.8
3.8
3
.8
7.7
2
6
15
.4
7.7
7
.7
4.0
7
.7
3.8
2
5
15
.4
3.8
7
.7
4.0
7
.7
24
1
1.5
1
.5
11
.5
3.8
2
3
3.8
3
.8
3.8
4
.0
3.8
7
.7
3.8
2
2
4.0
1
1.5
3
.8
3.8
4
.0
3.8
7
.7
3.8
2
1
4.0
1
5.4
1
1.5
3
.8
8.0
1
1.5
3
.8
11
. 5
20
8
.0
3.8
3
.8
4.0
3
.8
7.7
1
9
4.0
3
.8
4.0
1
1.5
1
1.5
1
8
4.0
3
.8
4.0
1
1.5
7
.7
17
7
.7
8.0
3
.8
4.0
7
.7
16
8
.0
7.7
3
.8
3.8
3
.8
15
8
.0
3.8
4
.0
11
.5
11
.5
14
1
9.0
7
.7
13
7
.7
12
3
.8
11
4
.0
7.7
1
0
4.0
7
.7
(X)
\.0

APP
EN
DIX
D
(l)-
-Co
nti
nu
ed
Ob
ject
Self
-A
ltru
-O
rien
-R
eali
-In
dep
en
-S
co
re
ism
ta
tio
n
Secu
rity
C
on
tro
l zati
on
d
en
ce
Mon
ey
9 8 4
.0
7 4
.0
Mea
ns
28
.04
1
8.3
9
28
.85
2
4.5
8
32
.69
2
7.1
5
27
.58
--- 1
Inclu
des
Bu
sin
ess,
Care
ers
, an
d
Pers
on
al
Fin
an
ce.
Task
S
at-
isfa
cti
on
S
oli
tud
e
33
.39
1
8.1
2
Ideas/
Data
28
.12
Pre
sti
ge
19
.81
\.0
0

APP
EN
DIX
D
(2)
OW
VI
SCA
LE
-SC
OR
E
PER
CE
NT
AG
ES:
E
NG
LIS
H
TE
AC
HE
RS
(n
= 3
0)
Ob
ject
Self
-A
ltru
-O
rien
-R
eali
-In
dep
en
-T
ask
S
at-
Ideas/
Sco
re
ism
ta
t io
n
Secu
rity
C
on
tro
l zati
on
d
en
ce
Mon
ey
isfa
cti
on
S
oli
tud
e
Data
P
resti
ge
35
1
6.7
3
.3
3.3
3
3.3
1
3.3
4
0.0
2
0.0
3
.0
34
6
.7
6.7
3
.3
3.3
6
.7
6.7
1
3.3
1
3.3
3
3
3.3
3
.3
16
.7
3.3
2
0.0
3
2
16
.7
3.3
6
.7
3.3
6
.7
10
.0
6.7
3
.0
31
1
3.3
6
.7
10
.0
6.7
3
.3
6.7
3
0
6.7
1
0.0
1
0.
7 3
.3
10
.0
29
3
.3
10
.0
6.7
3
.3
3.3
1
0.0
2
8
3.3
1
3.3
3
.3
3.3
6
.7
3.3
3
.3
3.3
3
.0
27
1
0.0
1
3. 3
1
0.0
6
.7
3.3
6
.7
3.3
2
6
10
.0
10
.0
6.7
3
.3
3.3
1
3.3
3
.0
25
3
.3
6.7
1
0.0
6
.7
3.3
6
.7
24
3
.3
10
.0
6.7
7
.0
23
3
.3
6.7
1
0.0
6
.7
3.3
3
.0
22
3
.3
6.7
1
3.3
1
0.0
3
.3
3.0
2
1
10
.0
10
.0
6.7
2
0.0
1
3.3
3
.3
13
.0
20
1
0.0
6
.7
10
.0
6.7
6
.7
7.0
1
9
6.7
3
.3
3.3
6
.7
3.3
3
.0
18
3
.3
10
.0
7.0
1
7
6.7
3
.3
3.3
1
0.0
1
6
3.3
3
.3
6.7
3
.3
3.0
1
5
23
.3
6.7
1
0.0
1
3. 3
1
3.0
1
4
10
.0
3.3
3
.3
10
.0
3.0
1
3
13
.3
12
6
.7
6.7
1
3.3
7
.0
11
3
.3
3.3
3
.0
10
1
3.
3 6
.7
3.0
\.
0
1--'

Ob
ject
Alt
ru-
Ori
en
-S
co
re
ism
ta
tio
n
Secu
rity
C
on
tro
l
9 8 6
.7
7
Mea
ns
30
.17
1
5.1
7
25
.80
2
1.6
6
APP
EN
DIX
D
(2)-
-Co
nti
nu
ed
Self
-R
eali
-In
dep
en
-zati
on
d
en
ce
Mon
ey
32
.17
2
5.2
7
23
.97
Task
S
at-
isfa
cti
on
S
oli
tud
e
10
.0
33
.30
1
6.2
3
Ideas/
Data
28
.77
Pre
sti
ge
19
.30
\.0
l\
J
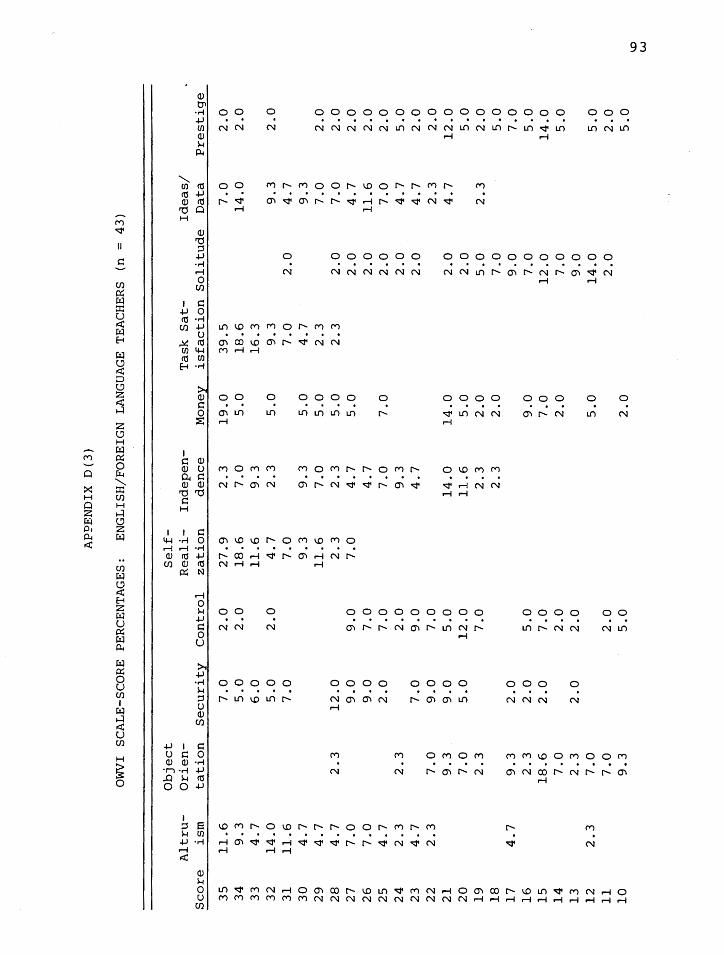
AP!
'EN
DIX
0
(3)
OW
VI
SCA
LE
-SC
OR
E
PER
CE
NT
AG
ES:
E
NG
LIS
H/F
OR
EIG
N
LAN
GU
AG
E TE
AC
HER
S (n
=
43
)
Ob
ject
Self
-A
ltru
-O
rien
-R
eali
-In
dep
en
-T
ask
S
at-
Ideas/
Sco
re
ism
ta
tio
n
Secu
rity
C
on
tro
l zati
on
d
en
ce
Mon
ey
isfa
cti
on
S
oli
tud
e
Data
P
resti
ge
35
1
1.6
7
.0
2.0
2
7.9
2
.3
19
.0
39
.5
7.0
2
.0
34
9
.3
5.0
2
.0
18
.6
7.0
5
.0
18
.6
14
.0
2.0
3
3
4.7
6
.0
11
.6
9.3
1
6.3
3
2
14
.0
5.0
2
.0
4.7
2
.3
5.0
9
.3
9.3
2
.0
31
1
1.6
7
.0
7.0
7
.0
2.0
4
.7
30
4
.7
9.3
9
.3
5.0
4
.7
9.3
2
9
4.7
1
1.6
7
.0
5.0
2
.3
7.0
2
.0
28
4
.7
2.3
1
2.0
2
.3
2.3
5
.0
2.3
2
.0
7.0
2
.0
27
7
.0
9.0
9
.0
7.0
4
.7
5.0
2
.0
4.7
2
.0
26
7
.0
9.0
7
.0
4.7
2
.0
11
.6
2.0
2
5
4.7
2
.0
7.0
7
.0
7.0
2
.0
7.0
2
.0
24
2
.3
2.3
2
.0
9.3
2
.0
4.7
5
.0
23
4
.7
7.0
9
.0
4.7
2
.0
4.7
2
.0
22
2
.3
7.0
9
.0
7.0
2
.3
2.0
2
1
9.3
9
.0
5.0
1
4.0
1
4.0
2
.0
4.7
1
2.0
2
0
7.0
5
.0
12
.0
11
.6
5.0
2
.0
5.0
1
9
2.3
7
.0
2.3
2
.0
5.0
2
.3
2.0
1
8
2.3
2
.0
7.0
5
.0
17
4
.7
9.3
2
.0
9.0
7
.0
16
2
.3
2.0
5
.0
9.0
7
.0
5.0
1
5
18
.6
2.0
7
.0
7.0
1
2.0
1
4.0
1
4
7.0
2
.0
2.0
7
.0
5.0
1
3
2.3
2
.0
2.0
9
.0
12
2
.3
7.0
5
.0
14
.0
5.0
1
1
7.0
2
.0
2.0
2
.0
10
9
.3
5.0
2
.0
5.0
l..
O
w
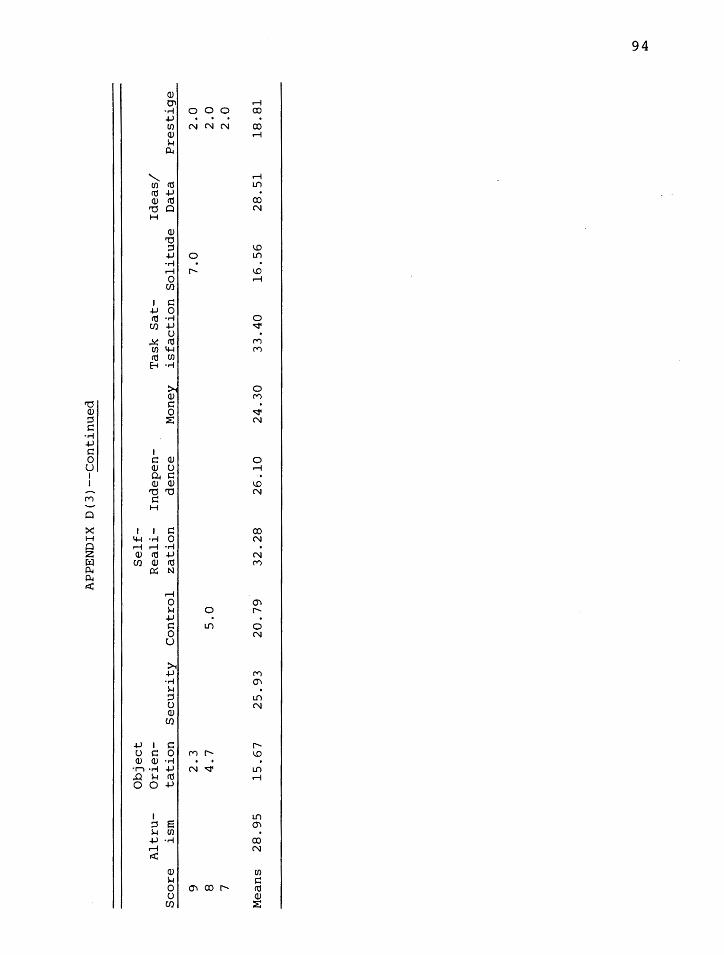
Ob
ject
Alt
ru-
Ori
en
-S
co
re
ism
ta
tio
n
Secu
rity
C
on
tro
l
9 2
.3
8 4
.7
5.0
7
Mea
ns
28
.95
1
5.6
7
25
.93
2
0.7
9
APP
EN
DIX
D
(3)-
-Co
nti
nu
ed
Self
-R
eali
-In
dep
en
-zati
on
d
en
ce
Mon
ey
32
.28
26~10
24
.30
Task
S
at-
Ideas/
isfa
cti
on
S
oli
tud
e
Data
7.0
33
.40
1
6.5
6
28
.51
Pre
sti
ge
2.0
2
.0
2.0
18
.81
l..O
~

APP
EN
DIX
D
(4)
OW
VI
SCA
LE
-SC
OR
E
PER
CE
NT
AG
ES:
F
INE
A
RT
Sl
TEA
CH
ERS
(n =
10
)
Ob
ject
Self
-A
ltru
-O
rien
-R
eali
-In
dep
en
-T
ask
S
at-
Ideas/
Sco
re
ism
ta
t io
n
Secu
rity
C
on
tro
l zati
on
d
en
ce
Mon
ey
isfa
cti
on
S
oli
tud
e
Data
P
resti
ge
35
1
0.0
1
0.0
2
0.0
5
0.0
2
0.0
1
0.0
9
0.0
1
0.0
3
4
10
.0
30
.0
10
.0
10
.0
10
.0
10
.0
33
1
0.0
3
0.0
1
0.0
1
0.0
3
2
10
.0
31
3
0.0
1
0.0
1
0.0
1
0.0
1
0.0
2
0.0
3
0
10
.0
10
.0
10
.0
29
1
0.0
1
0.0
2
0.0
1
0.0
2
8
10
.0
10
.0
20
.0
10
.0
10
.0
27
2
0.0
1
0.0
1
0.0
1
0.0
1
0.0
2
0.0
2
6
10
.0
10
.0
10
.0
25
2
0.0
1
0.0
1
0.0
1
0.0
2
4
20
.0
10
.0
20
.0
23
1
0.0
1
0.0
2
2
10
.0
10
.0
10
.0
10
.0
21
1
0.0
1
0.0
2
0.0
1
0.0
2
0
20
.0
10
.0
30
.0
19
1
0.0
2
0.0
1
8
10
.0
17
1
0.0
1
6
10
.0
10
.0
15
1
4
10
.0
13
1
2
20
.0
11
1
0
\0
U1

APP
EN
DIX
D
(4}
--C
on
tin
ued
Ob
ject
Self
-A
ltru
-O
rien
-R
eali
-In
dep
en
-S
co
re
ism
ta
tio
n
Secu
rity
C
on
tro
l zati
on
d
en
ce
Mon
ey
9 1
0.0
8
10
.0
7
Mea
ns
29
.60
2
1.4
0
26
.60
2
4.3
0
33
.60
2
9.0
0
29
.60
1F
ine A
rts
inclu
des A
rt,
Mu
sic,
Sp
eech
, an
d
Dra
ma.
Task
S
at-
isfa
cti
on
S
oli
tud
e
34
.90
1
9.2
0
Ideas/
Data
29
.90
Pre
sti
ge
25
.00
'° O'I

APP
EN
DIX
D
(5)
OW
VI
SCA
LE
-SC
OR
ES
PER
CE
NT
AG
ES:
FO
RE
IGN
LA
NG
UA
GE
TEA
CH
ERS
(n =
13
)
Ob
ject
Self
-A
ltru
-O
rien
-R
eali
-In
dep
en
-T
ask
S
at-
Ideas/
Sco
re
ism
ta
tio
n
Secu
rity
C
on
tro
l zati
on
d
en
ce
Mon
ey
isfa
cti
on
S
oli
tud
e
Data
P
resti
ge
35
1
5.4
1
5.4
7
.7
30
.8
38
.5
34
1
5.4
5
3.8
7
.7
30
.8
15
.4
7.7
3
3
7.7
1
5.4
2
3.1
7
.7
32
7
.7
7.7
7
.7
15
.4
31
7
.7
7.7
7
.7
30
7
.7
7.7
7
.7
7.7
7
.7
29
7
.7
15
.4
7.7
7
.7
7.7
2
8
7.7
7
.7
7.7
1
5.4
2
7
7.7
7
.7
7.7
7
.7
7.7
7
.7
26
7
.7
7.7
7
.7
7.7
2
5
15
.4
7.7
7
.7
7.7
7
.7
24
7
.7
7.7
7
.7
7.7
23
7
.7
7.7
7
.7
15
.4
22
7
.7
21
7
.7
7.7
1
5.4
7
.7
7.7
7
.7
20
1
5.4
2
3.1
7
.7
19
7
.7
7.7
1
8
7.7
1
7
15
.4
15
.4
23
.1
16
7
.7
7.7
1
5.4
1
5.4
7
.7
15
7
.7
7.7
7
.7
7.7
1
5.4
1
4
7.7
1
3
7.7
7
.7
7.7
1
2
7.7
7
.7
15
.4
11
1
5.4
7
.7
10
7
.7
7.7
~
......J
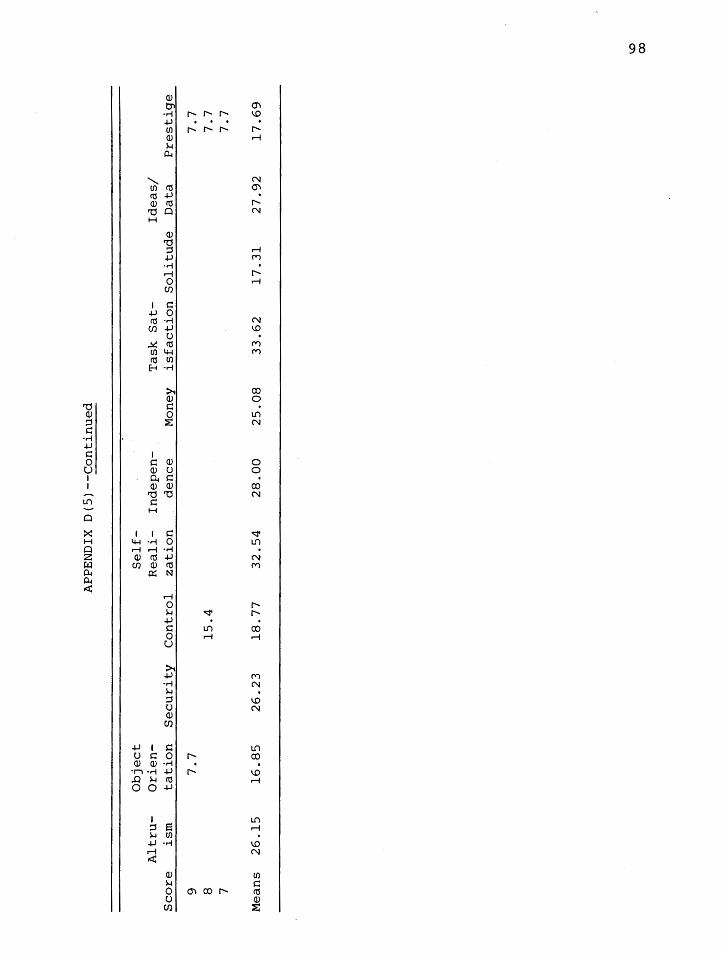
Ob
ject
Alt
ru-
Ori
en
-S
co
re
ism
ta
tio
n
Secu
rity
C
on
tro
l
9 7
.7
8 1
5.4
7
Mea
ns
26
.15
1
6.8
5
26
.23
1
8.
77
APP
EN
DIX
D
(5)-
-Co
nti
nu
ed
Self
-R
eali
-In
dep
en
-T
ask
S
at-
zati
on
d
en
ce
Mon
ey
isfa
cti
on
S
oli
tud
e
32
.54
2
8.0
0
25
.08
3
3.6
2
17
.31
Ideas/
Data
27
.92
Pre
sti
ge
7.7
7
.7
7.7
17
.69
\.0
C
X)

APP
EN
DIX
D
(6)
OW
VI
SCA
LE
-SC
OR
E
PER
CE
NT
AG
ES:
H
IST
OR
Y
TEA
CH
ERS
(n =
15
)
Ob
ject
Self
-A
ltru
-O
rien
-R
eali
-In
dep
en
-T
ask
S
at-
Ideas/
Sco
re
ism
ta
tio
n
Secu
rity
C
on
tro
l zati
on
d
en
ce
Mon
ey
isfa
cti
on
S
oli
tud
e
Data
P
resti
ge
35
6
.7
13
.3
40
.0
34
6
.7
6.7
1
3.3
3
3
13
.3
6.7
1
3. 3
3
2
6.7
6
.7
26
.7
6.7
3
1
13
. 3
6.7
1
3.
3 6
.7
6.7
6
.7
30
1
3.3
6
.7
6.7
6
.7
13
.3
13
.3
31
2
6.7
6
.7
26
.7
6.7
2
8
6.7
6
.7
20
.0
6.7
1
3.
3 2
0.0
1
3.3
2
0.0
6
.7
27
6
.7
13
.3
20
.0
6.7
1
3.3
6
.7
13
.3
20
.0
26
1
3.3
2
6.7
1
3. 3
6
.7
6.7
6
.7
6.7
6
.7
6.7
2
5
6.7
6
.7
6.7
1
3.3
6
.7
6.7
2
4
6.7
6
.7
23
6
.7
13
.3
6.7
6
.7
22
6
.7
6.7
2
1
6.7
1
3.3
6
.7
6.7
1
3.3
6
.7
6.7
1
3.3
2
0
13
.3
6.7
2
0.0
1
9
6.7
1
3. 3
1
3.3
1
8
6.7
1
3.3
6
.7
17
1
3.3
6
.7
16
1
3.
3 6
.7
15
6
.7
6.7
1
3.3
1
4
6.7
6
.7
6.7
1
3
6.7
1
3.3
1
2
11
6
.7
6.7
1
0
6.7
\.
0
\.0
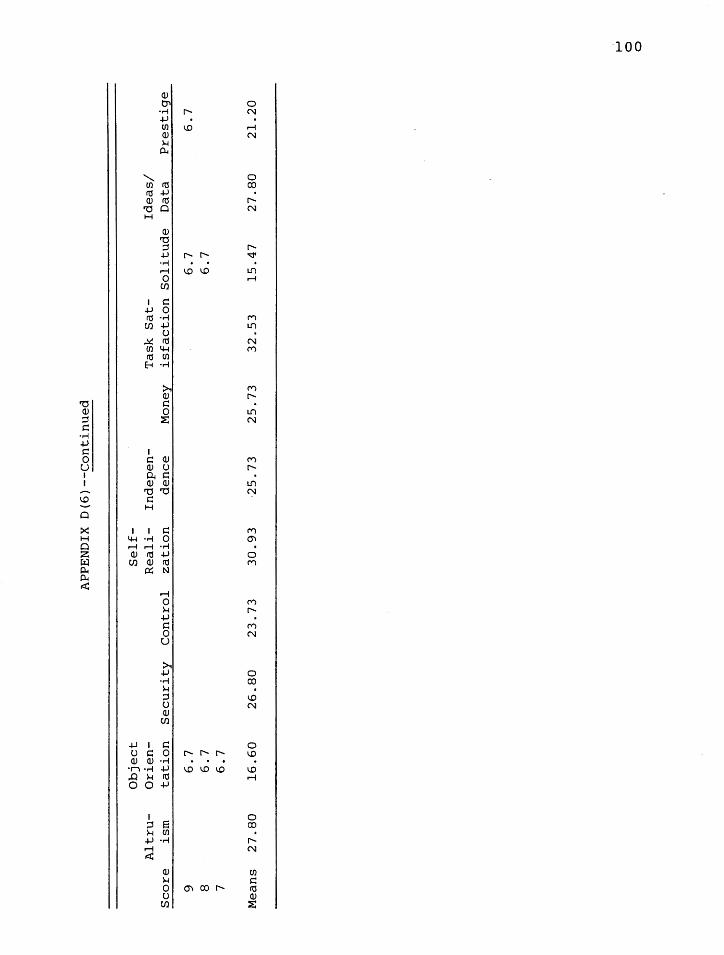
Ob
ject
Alt
ru-
Ori
en
-S
co
re
ism
ta
tio
n
Secu
rity
C
on
tro
l
9 6
.7
8 6
.7
7 6
.7
Mea
ns
27
.80
1
6.6
0
26
.80
2
3.7
3
APP
EN
DIX
D
(6)-
-Co
nti
nu
ed
Self
-R
eali
-In
dep
en
-zati
on
d
en
ce
Mon
ey
30
.93
·2
5.
73
2
5.7
3
Task
S
at-
isfa
cti
on
S
oli
tud
e
6.7
6
.7
32
.53
1
5.4
7
Ideas/
Data
27
.80
Pre
sti
ge
6.7
21
.20
t-J
0 0
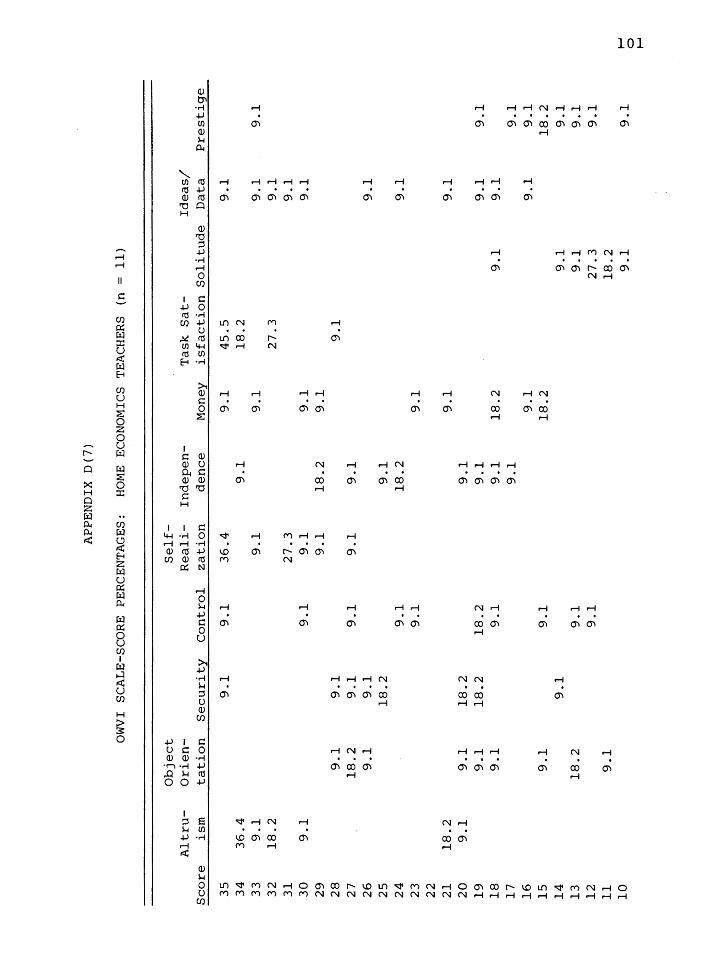
APP
EN
DIX
D
(7)
OW
VI
SCA
LE
-SC
OR
E
PER
CE
NT
AG
ES:
H
OM
E EC
ON
OM
ICS
TEA
CH
ERS
(n
=
11
)
Ob
ject
Self
-A
ltru
-O
rien
-R
eali
-In
dep
en
-T
ask
S
at-
Ideas/
Sco
re
ism
ta
t io
n
Secu
rity
C
on
tro
l zati
on
d
en
ce
Mon
ey
isfa
cti
on
S
oli
tud
e
Data
P
resti
ge
35
9
.1
9.1
3
6.4
9
.1
45
.5
9.1
3
4
36
.4
9.1
1
8.2
33
9
.1
9.1
9
.1
9.1
9
.1
32
1
8.2
2
7.3
9
.1
31
2
7.3
9
.1
30
9
.1
9.1
9
.1
9.1
9
.1
29
9
.1
18
.2
9.1
2
8
9.1
9
.1
9.1
2
7
18
.2
9.1
9
.1
9.1
9
.1
26
9
.1
9.1
9
.1
25
1
8.2
9
.1
24
9
.1
18
.2
9.1
23
9
.1
9.1
2
2
21
1
8.2
9
.1
9.1
2
0
9.1
9
.1
18
.2
9.1
1
9
9.1
1
8.2
1
8.2
9
.1
9.1
9
.1
18
9
.1
9.1
9
.1
18
.2
9.1
9
.1
17
9
.1
9.1
1
6
9.1
9
.1
9.1
1
5
9.1
9
.1
18
.2
18
.2
14
9
.1
9.1
9
.1
13
1
8.2
9
.1
9.1
9
.1
12
9
.1
27
.3
9.1
1
1
9.1
1
8.2
1
0
9.1
9
.1
""'""'
0 ""'""'

Ob
ject
Alt
ru-
Ori
en
-S
co
re
ism
ta
tio
n
Secu
rity
C
on
tro
l
9 8 7
Mea
ns
29
.55
1
9.7
3
23
.46
2
1.
36
APP
EN
DIX
D
(7)-
-Co
nti
nu
ed
Self
-R
eali
-In
dep
en
-zati
on
denc~
Mon
ey
32
.00
2
4.1
8
23
.00
Task
S
at-
isfa
cti
on
S
oli
tud
e
9.1
9
.1
33
.36
1
1.6
3
Ideas/
Data
25
.91
Pre
sti
ge
9.9
15
.73
1--'
0 N

APP
EN
DIX
D
(8)
OW
VI
SCA
LE
-SC
OR
E
PER
CE
NT
AG
ES:
IN
DU
STR
IAL
A
RTS
TE
AC
HER
S (n
=
1
0)
Ob
ject
Self
-A
ltru
-O
ri e
n-
Reali
-In
dep
en
-T
ask
S
at-
Ideas/
Sco
re
ism
ta
tio
n
Secu
rity
C
on
tro
l zati
on
d
en
ce
Mon
ey
isfa
cti
on
S
oli
tud
e
Data
P
resti
ge
35
2
0.0
2
0.0
1
0.0
3
0.0
1
0.0
3
4
10
.0
10
.0
20
.0
10
.0
20
.0
10
.0
20
.0
10
.0
33
1
0.0
1
0.0
1
0.0
1
0.0
3
2
10
.0
10
.0
10
.0
10
.0
10
.0
10
.0
31
1
0.0
1
0.0
1
0.0
3
0.0
1
0.0
1
0.0
1
0.0
3
0
10
.0
10
.0
10
.0
29
1
0.0
1
0.0
1
0.0
2
0.0
2
8
20
.0
10
.0
10
.0
10
.0
10
.0
10
.0
27
2
0.0
1
0.0
1
0.0
1
0.0
2
6
20
.0
10
.0
25
1
0.0
1
0.0
1
0.0
2
4
10
.0
10
.0
10
.0
20
.0
10
.0
23
1
0.0
2
0.0
1
0.0
1
0.0
2
2
10
.0
20
.0
10
.0
10
.0
10
.0
10
.0
10
.0
21
1
0.0
1
0.0
1
0.0
1
0.0
1
0.0
2
0
20
.0
19
1
0.0
1
8
20
.0
20
.0
20
.0
17
1
0.0
1
0.0
1
6
10
.0
10
.0
15
1
4
10
.0
13
1
0.0
1
2
11
1
0.0
1
0.0
1
0
10
.0
I-'
0 w
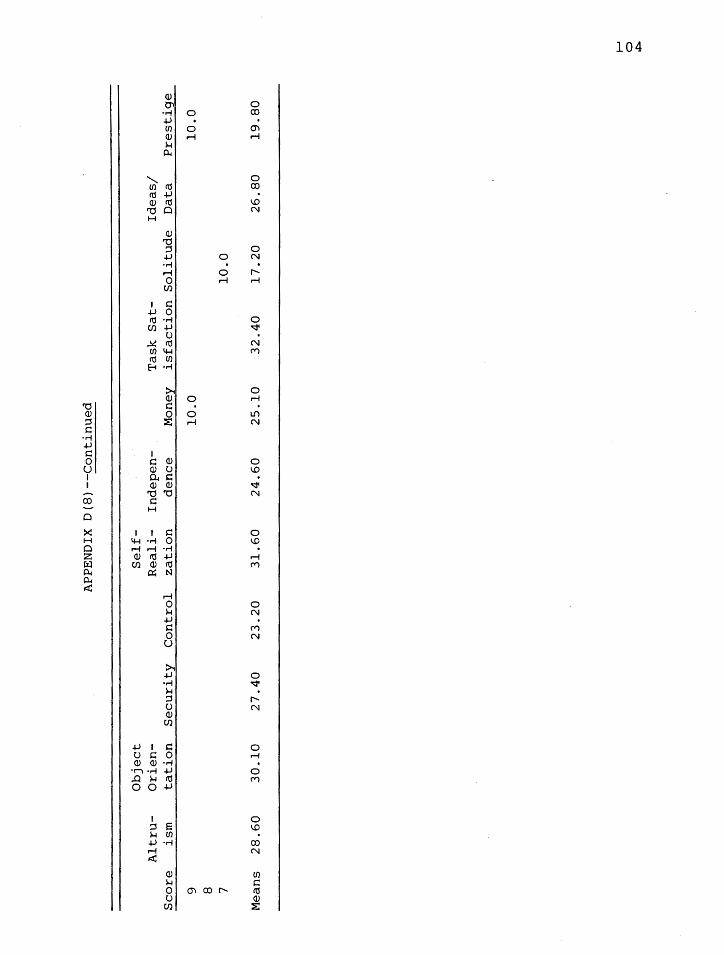
Ob
ject
Alt
ru-
Ori
en
-S
co
re
ism
ta
tio
n
Secu
rity
C
on
tro
l
9 8 7
Mea
ns
28
.60
3
0.1
0
27
.40
2
3.2
0
APP
EN
DIX
D
(8)-
-Co
nti
nu
ed
Self
-R
eali
-In
dep
en
-zati
on
d
en
ce
Mon
ey
10
.0
31
.60
2
4.6
0
25
.10
Task
S
at-
isfa
cti
on
S
oli
tud
e
10
.0
32
.40
1
7.2
0
Ideas/
Data
26
.80
Pre
sti
ge
10
.0
19
.80
........
..
0 ~

APP
EN
DIX
D
(9}
OW
VI
SCA
LE
-SC
OR
E
PER
CE
NT
AG
ES:
M
ATH
/CO
MPU
TER
SC
IEN
CE
TE
AC
HER
S (n
=
27
)
Ob
ject
Self
-A
ltru
-O
ri e
n-
Reali
-In
dep
en
-T
ask
S
at-
Ideas/
Sco
re
ism
ta
t io
n
Secu
rity
C
on
tro
l zati
on
d
en
ce
Mon
ey
isfa
cti
on
S
oli
tud
e
Data
P
resti
ge
35
1
1.1
3
.7
3.7
1
8.5
3
.7
11
.0
4.0
7
11
.1
3.7
3
4
3.7
7
.4
7.4
3
.7
33
1
4.8
7
.4
4.0
3
.7
3.7
3
2
7.4
7
.4
7.4
1
1.1
4
.0
31
1
1.1
1
1.1
1
4.8
7
.4
30
3
.7
3.7
7
.4
4.0
7
.4
3.7
3
.7
29
1
1.1
4
.0
7.4
7
.4
7.4
1
4.8
3
.7
28
1
1.1
4
.0
22
.2
7.4
3
.7
11
.0
11
.1
7.4
2
2.2
3
.7
27
7
.4
4.0
1
4.8
7
.4
11
.1
7.4
1
4.8
2
6
11
.1
7.4
1
1.1
3
.7
25
7
.0
3.7
7
.4
4.0
7
.4
24
7
.4
7.0
3
.7
7.4
3
.7
4.0
3
.7
3.7
3
.7
3.7
2
3
7.4
4
.0
3.7
7
.4
7.0
3
.7
3.7
2
2
3.7
1
4.8
7
.4
14
.8
4.0
7
.4
7.4
2
1
3.7
7
.0
3.7
1
1.1
3
.7
3.7
1
1.0
7
.4
3.7
2
0
4.0
3
.7
11
.1
4.0
7
.4
3.7
1
9
3.7
4
.0
3.7
7
.4
7.4
1
4.8
1
8
4.0
3
.7
4.0
1
1.1
3
.7
17
3
.7
3.7
3
.4
4.0
7
.4
3.7
1
6
7.0
1
1.1
7
.0
7.4
1
4.8
1
5
7.0
3
.7
4.0
1
4
7.0
4
.0
14
.8
11
.1
13
7
.0
7.4
4
.0
7.4
3
.7
3.7
1
2
4.0
3
.7
7.4
1
1
4.0
7
.0
3.7
1
0
7.0
1
1.l
I-
' 0 U
1

Ob
ject
Alt
ru-
Ori
en
-S
co
re
ism
ta
tio
n
Secu
rity
C
on
tro
l
9 7
.4
8 3
.7
7.0
7
Mea
ns
27
.11
1
7.7
4
25
.33
2
0.1
9
APP
EN
DIX
D
(9)-
-Co
nti
nu
ed
Self
-R
eali
-In
dep
en
-zati
on
d
en
ce
Mon
ey
30
.19
2
5.9
3
22
.78
Task
S
at-
Ideas/
isfa
cti
on
S
oli
tud
e
Data
31
.82
1
8.8
9
28
.48
Pre
sti
ge
7.4
17
.67
.......
0 °'
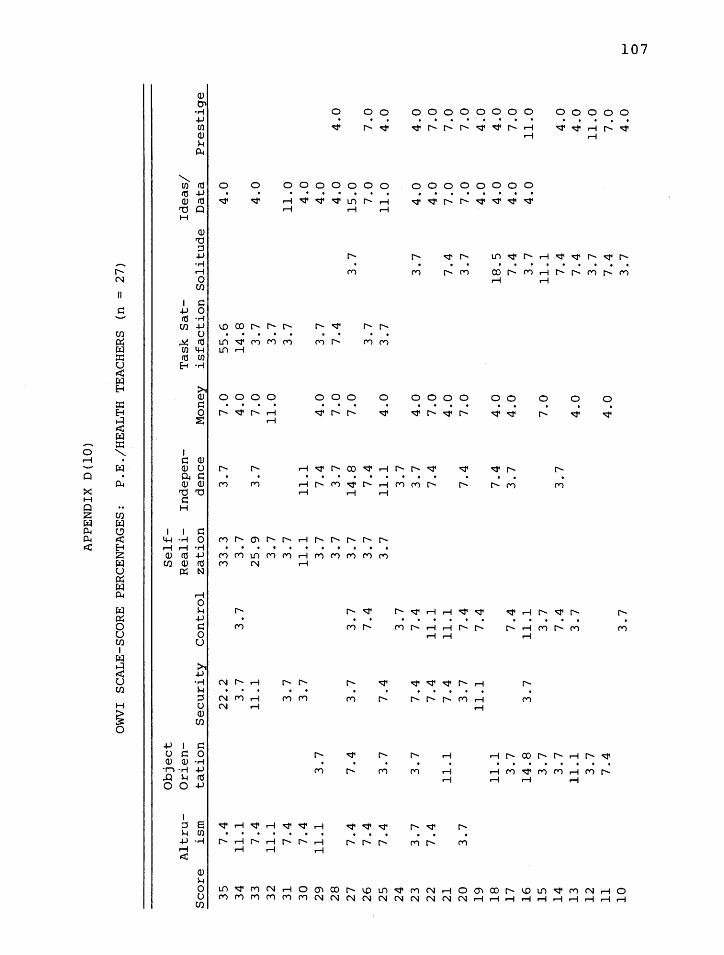
APP
EN
DIX
D
(lO
)
OW
VI
SCA
LE
-SC
OR
E
PER
CE
NT
AG
ES:
P
.E./
HE
AL
TH
TE
AC
HER
S (n
=
2
7)
Ob
ject
Self
-A
ltru
-O
rien
-R
eali
-In
dep
en
-T
ask
S
at-
Ideas/
Sco
re
ism
ta
tio
n
Secu
rity
C
on
tro
l zati
on
d
en
ce
Mon
ey
isfa
cti
on
S
oli
tud
e
Data
P
resti
ge
35
7
.4
22
.2
33
.3
3.7
7
.0
55
.6
4.0
3
4
11
.1
3.7
3
.7
3.7
4
.0
14
.8
33
7.4
1
1.1
2
5.9
3
.7
7.0
3
.7
4.0
3
2
11
.1
3.7
1
1.0
3
.7
31
7
.4
3.7
3
.7
3.7
1
1.0
3
0
7.4
3
.7
11
.1
11
.1
4.0
2
9
11
.1
3.7
3
.7
7.4
4
.0
3.7
4
.0
28
3
.7
3.7
7
.0
7.4
4
.0
4.0
2
7
7.4
7
.4
3.7
3
.7
3.7
1
4.8
7
.0
3.7
1
5.0
2
6
7.4
7
.4
3.7
7
.4
3.7
7
.0
7.0
2
5
7.4
3
.7
7.4
3
.7
11
.1
4.0
3
.7
11
.0
4.0
2
4
3.7
3
.7
23
3
.7
3.7
7
.4
7.4
3
.7
4.0
3
.7
4.0
4
.0
22
7
.4
7.4
1
1.1
7
.4
7.0
4
.0
7.0
2
1
11
.1
7.4
1
1.1
4
.0
7.4
7
.0
7.0
2
0
3.7
3
.7
7.4
7
.4
7.0
3
.7
7.0
7
.0
19
1
1.1
7
.4
4.0
4
.0
18
1
1.1
7
.4
4.0
1
8.5
4
.0
4.0
1
7
3.7
7
.4
3.7
4
.0
7.4
4
.0
7.0
1
6
14
.8
3.7
1
1.1
3
.7
4.0
1
1.0
1
5
3.7
3
.7
7.0
1
1.1
1
4
3.7
7
.4
3.7
7
.4
4.0
1
3
11
.1
3.7
4
.0
7.4
4
.0
12
3
.7
3.7
1
1.0
1
1
7.4
4
.0
7.4
7
.0
10
3
.7
3.7
4
.0
I-'
0 -.....]

Ob
ject
Alt
ru-
Ori
en
-S
co
re
ism
ta
tio
n
SE
cu
rity
9 3
.7
8 3
.7
7 7
.4
Mea
ns
29
.11
1
6.7
8
26
.48
APP
EN
DIX
D
(lO
)--C
on
tin
ued
Self
-R
eali
-In
dep
en
-C
on
tro
l zati
on
d
en
ce
Mon
ey
4.0
19
.93
3
2.1
5
25
.08
2
4.3
0
Task
S
at-
isfa
cti
on
S
oli
tud
e
7.4
3
.7
33
.07
1
5.6
0
Ideas/
Data
25
.19
Pre
sti
ge
4.0
17
.52
I-'
0 00

APP
EN
DIX
D
(ll)
OW
VI
SCA
LE
-SC
OR
E
PER
CE
NT
AG
ES:
S
PE
CIA
L
ED
UC
AT
ION
T
EA
CH
ER
S (n
=
1
7)
Ob
ject
Self
-A
ltru
-O
ri e
n-
Reali
-In
dep
en
-T
ask
S
at-
Ideas/
Sco
re
ism
ta
t io
n
Secu
rity
C
on
tro
l zati
on
d
en
ce
Mon
ey
isfa
cti
on
S
oli
tud
e
Data
P
resti
ge
35
1
7.6
1
7.6
5
.9
23
.5
34
1
1.8
5
.9
11
.8
11
.8
33
5
.9
5.9
1
7.6
1
7.6
1
1.8
3
2
11
.8
11
.8
17
.6
5.9
1
1.8
1
1.8
3
1
11
.8
5.9
5
.9
11
.8
5.9
3
0
5.9
5
.9
5.9
5
.9
11
.8
5.9
1
1.8
5
.9
29
5
.9
5.9
5
.9
11
.8
5.9
5
.9
28
5
.9
17
.6
11
.8
11
.8
5.9
5
.9
11
.8
27
1
7.6
1
1.8
5
.9
11
.8
5.9
2
6
18
.8
5.9
5
.9
5.9
5
.9
11
.8
25
5
.9
11
.8
5.9
5
.9
17
.6
24
5
.9
17
.6
11
.8
23
5
.9
11
.8
5.9
5
.9
5.9
5
.9
5.9
2
2
11
.8
11
.8
5.9
5
.9
21
1
1.8
5
.9
5.9
1
1.8
5
.9
5.9
2
0
5.9
5
.9
11
.8
19
5
.9
5.9
1
1.8
5
.9
18
5
.9
11
.8
5.9
1
1.8
5
.9
11
.8
17
1
1.8
5
.9
5.9
5
.9
16
5
.9
5.9
1
1.8
1
5
17
.9
5.9
1
1.8
5
.9
14
1
1.8
5
.9
11
.8
13
5
.9
5.9
5
.9
12
5
.9
11
.8
5.9
1
1
11
.8
5.9
1
0
5.9
5
.9
5.9
....
... 0 \.
0

Ob
ject
Alt
ru-
Ori
en
-S
co
re
ism
ta
tio
n
Secu
rity
9 8 5
.9
7
Mea
ns
30
.47
1
7,5
3
26
.12
APP
EN
DIX
D
(ll)
--C
on
tin
ued
Self
-R
eali
-In
dep
en
-C
on
tro
l zati
on
d
en
ce
Mon
ey
21
.06
3
1.8
8
24
.35
2
3.5
3
Task
S
at-
isfa
cti
on
S
oli
tud
e
11
.8
5.9
32
.29
1
5.4
7
Ideas/
Data
28
.12
Pre
sti
ge
5.9
17
.47
I-'
I-'
0
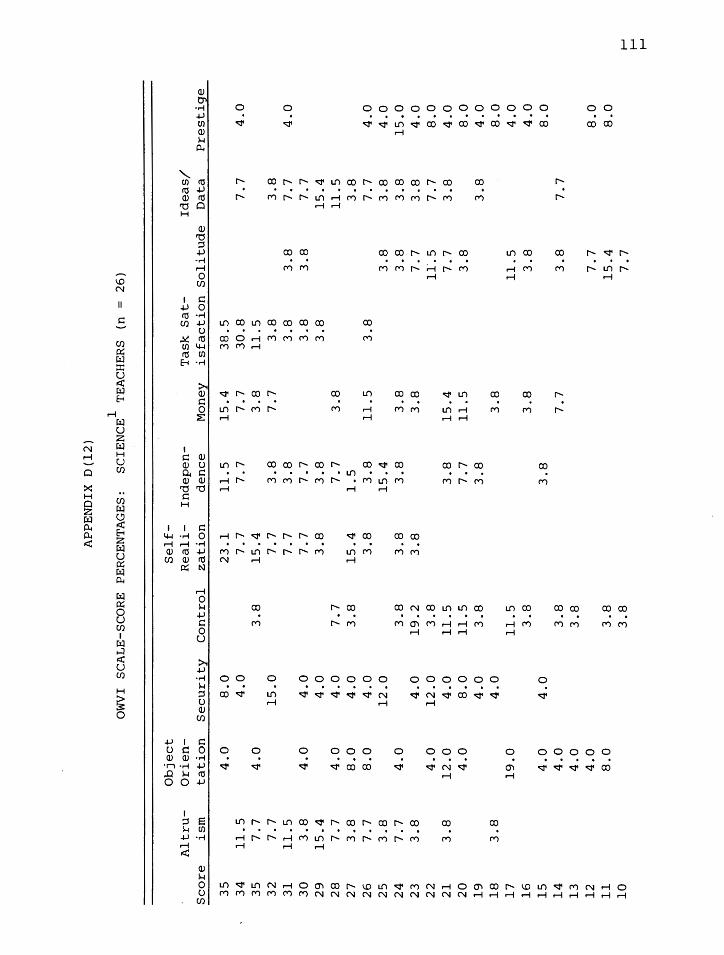
APP
EN
DIX
D
{l2
)
OW
VI
SCA
LE
-SC
OR
E
PER
CE
NT
AG
ES:
S
CIE
NC
E!
TEA
CH
ERS
{n
=
26
)
Ob
ject
Self
-A
ltru
-O
rien
-R
eali
-In
dep
en
-T
ask
S
at-
Ideas/
Sco
re
ism
ta
tio
n
Secu
rity
C
on
tro
l zati
on
d
en
ce
Mon
ey
isfa
cti
on
S
oli
tud
e
Data
P
resti
ge
35
4
.0
8.0
2
3.1
1
1.5
1
5.4
3
8.5
3
4
11
.5
4.0
7
.7
7.7
7
.7
30
.8
7.7
4
.0
35
7
.7
4.0
3
.8
15
.4
3.8
1
1.5
3
2
7.7
1
5.0
7
.7
3.8
7
.7
3.8
3
.8
31
1
1.5
7
.7
3.8
3
.8
3.8
7
.7
4.0
3
0
3.8
4
.0
4.0
7
.7
7.7
3
.8
3.8
7
.7
29
1
5.4
4
.0
3.8
3
.8
3.8
1
5.4
2
8
7.7
4
.0
4.0
7
.7
7.7
3
.8
11
.5
27
3
.8
8.0
4
.0
3.8
1
5.4
1
.5
3.8
2
6
7.7
8
.0
4.0
3
.8
3.8
1
1.5
3
.8
7.7
4
.0
25
3
.8
12
.0
15
.4
3.8
3
.8
4.0
2
4
7.7
4
.0
3.8
3
.8
3.8
3
.8
3.8
3
.8
15
.0
23
3
.8
4.0
1
9.2
3
.8
3.8
7
.7
3.8
4
.0
22
4
.0
12
.0
3.8
1
L5
7
.7
8.0
2
1
3.8
1
2.0
4
.0
11
.5
3.8
1
5.4
7
.7
3.8
4
.0
20
4
.0
8.0
1
1.5
7
.7
11
.5
3.8
8
.0
19
4
.0
3.8
3
.8
3.8
4
.0
18
3
.8
4.0
3
.8
8.0
1
7
19
.0
11
.5
11
.5
4.0
1
6
3.8
3
.8
3.8
4
.0
15
4
.0
4.0
3
.8
8.0
1
4
4.0
3
.8
7.7
3
.8
7.7
1
3
4.0
3
.8
12
4
.0
7.7
8
.0
11
8
.0
3.8
1
5.4
8
.0
10
3
.8
7.7
1-
-' 1-
-' 1-
-'

APP
EN
DIX
D
(l2
)--C
on
tin
ued
Ob
ject
Self
-A
ltru
-O
rien
-R
eali
-In
dep
en
-S
co
re
ism
ta
tio
n
Secu
rity
C
on
tro
l zati
on
d
en
ce
Mon
ey
9 4
.0
4.0
8 7
Mea
ns
28
.50
2
0.4
2
25
.31
2
0.5
4
31
.00
2
7.1
9
25
.54
1rn
clu
des B
iolo
gic
al,
P
hy
sic
al,
an
d G
en
era
l S
cie
nce.
Task
S
at-
isfa
cti
on
S
oli
tud
e
3.8
33
.52
1
7.7
7
Ideas/
Data
26
.35
Pre
sti
ge
4.0
19
.69
I-'
I-'
rv
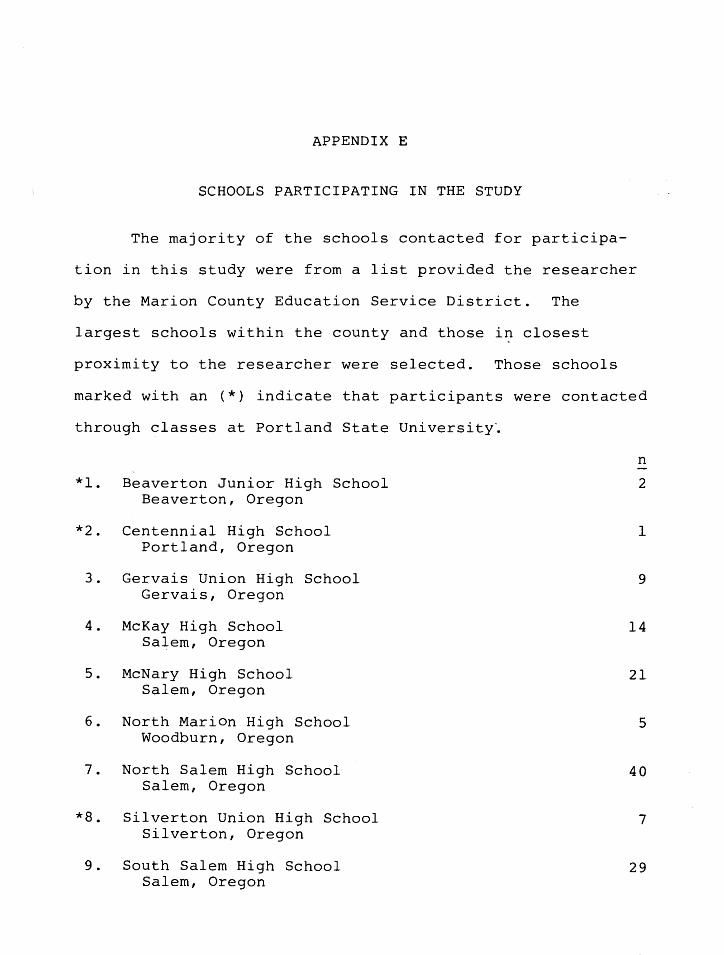
APPENDIX E
SCHOOLS PARTICIPATING IN THE STUDY
The majority of the schools contacted for participa-
tion in this study were from a list provided the researcher
by the Marion County Education Service District. The
largest schools within the county and those in closest
proximity to the researcher were selected. Those schools
marked with an (*) indicate that participants were contacted
through classes at Portland State University~
*l. Beaverton Junior High School Beaverton, Oregon
*2. Centennial High School Portland, Oregon
3. Gervais Union High School Gervais, Oregon
4. McKay High School Salem, Oregon
5. McNary High School Salem, Oregon
6. North Marion High School Woodburn, Oregon
7. North Salem High School Salem, Oregon
*8. Silverton Union High School Silverton, Oregon
9. South Salem High School Salem, Oregon
n
2
1
9
14
21
5
40
7
29

10. Sprague High School Salem, Oregon
11. Tigard Junior High Schools Tigard, Oregon
12. Woodburn High School Woodburn, Oregon
*School Not Listed
Total
114
n
20
38
17
203
17
220