The Winter 2016 Integrated Acoustic and Trawl Survey of … · The Winter 2016 Integrated Acoustic...
20
National Marine Fisheries Service U.S. DEPARTMENT OF COMMERCE NWFSC CRUISE REPORT, CRUISE NO. SH2016-01 The Winter 2016 Integrated Acoustic and Trawl Survey of Pacific Hake (Merluccius productus) June 2016 This report does not constitute a publication and is for information only. Northwest Fisheries Science Center
Transcript of The Winter 2016 Integrated Acoustic and Trawl Survey of … · The Winter 2016 Integrated Acoustic...
National Marine Fisheries Service U.S. DEPARTMENT OF COMMERCE NWFSC CRUISE REPORT, CRUISE NO. SH2016-01 The Winter 2016 Integrated Acoustic and Trawl Survey of Pacific Hake (Merluccius productus)
June 2016
This report does not constitute a publication and is for information only.
Northwest Fisheries Science Center

2
Introduction Pacific hake (Merluccius productus), hereafter hake, is an important commercial marine
fish off the west coast of North America. Hake is also the most abundant groundfish in the California Current Large Marine Ecosystem. Because of the economic and ecological value of coastal hake, integrated acoustic and trawl (IAT) surveys have been conducted since 1977 to assess the species’ abundance, distribution, and biology. The time frame for these hake IAT surveys has always been June through September, when hake are presumed to be migrating northward and shoreward from their winter spawning grounds. Surveying migrating hake can be potentially challenging, however, because fish can be double-counted as they move, or they can be missed if their migration does not coincide with the timing of the survey. Additionally, the coast-wide summer distribution of hake necessitates a survey that is extensive and expensive. In contrast, many migratory fish stocks around the world are surveyed during their spawning period. Operating under an assumption that the entire spawning population can be found at that time within a much smaller area, most surveys targeting these populations can be shorter in duration, less expensive, and can potentially produce a more accurate estimate of the stock biomass.
The primary purposes of the winter 2016 hake IAT survey were to evaluate the feasibility
of conducting a winter spawning hake biomass survey and to collect biological data on hake during winter. Goals included determining the distribution of spawning hake, characterizing aggregations of spawning hake, and describing the biology of hake within those aggregations.
This report provides a brief description of the methods used in the survey and
summarizes the distribution and biological composition of hake in U.S. waters off the Pacific coast. It also summarizes results of an acoustic system calibration and secondary survey objectives.
Materials and Methods Scientists from the Fishery Resource Analysis and Monitoring (FRAM) division at the
Northwest Fisheries Science Center (NWFSC) led the winter 2016 hake IAT survey aboard the NOAA Ship Bell M. Shimada, a 63.7-m (209-foot), acoustically quieted Fisheries Survey Vessel equipped for fisheries and oceanographic research. The survey was conducted between January 9 and February 9 (Table 1). The Shimada surveyed from 45.5°N to 31.3°N, beginning at Newport, Oregon, proceeding south to the U.S./Mexico border, and then heading north back to Newport (Figures 1 and 2). Pre-planned (“coarse”) zigzag transects were oriented east-west, with larger offshore diagonals connected via smaller nearshore diagonals. Offshore diagonals, spaced roughly 100 nmi apart at the inshore side, ranged from the 30-m isobath (or as close to shore as was safely navigable) to bottoms depths of roughly 3,500–4,500 m. Nearshore diagonals extended from the ≥30-m contour to roughly 2,000 m. If hake were detected at the offshore end of a transect, the vessel proceeded west to the end of the hake sign and then beyond for an additional 0.5 nmi to ensure that the end of the aggregation was located. When

3
aggregations of spawning hake were detected along a pre-planned transect and confirmed by midwater trawling, adaptive transects, either parallel at a fine resolution (spaced either 0.5 or 1.0 nmi apart) or in a star pattern, were used to determine the spatial extent and size of the spawning aggregation(s). Additional acoustic data were collected to evaluate crepuscular migration (vertical and/or horizontal) of spawning hake aggregations by having the Shimada remain stationary one hour before sunrise to one hour after.
Acoustic Sampling
Equipment Five Simrad split-beam transducers, operating at 18, 38, 70, 120, and 200 kHz, were
mounted on the bottom of the Shimada’s retractable centerboard. During the survey, to reduce interference from bubbles, the centerboard was extended to its maximum depth, positioning the transducers to a nominal depth of 9.15 m below the water surface. Acoustic data from the 18-, 38-, and 120-kHz transducers were collected with a Simrad EK60 scientific echo sounder system coupled with an ER60 software system (version 2.4.3). Acoustic data from the 70- and 200-kHz transducers were collected with a Simrad EK80 broadband scientific echo sounder (version 1.1.83).
The Shimada was equipped also with a Teledyne RD Instruments Ocean Surveyor 75-
kHz Acoustic Doppler Current Profiler (ADCP) system and a Simrad ME70 scientific multibeam echo sounder system, but the ME70 system was used only briefly because of interference with the other acoustic systems. A Simrad K-Sync unit was used for synchronizing pulse sequences from the EK60, EK80, and ADCP acoustic instruments.
Calibration The location for calibration was chosen where the water beneath the ship was at least 40
m deep—to avoid echo contamination from multipath effects—and where the water column was, as much as possible, devoid of fish and other marine life. The calibration procedure involved anchoring the vessel from the bow, suspending a metal sphere with a known backscattering cross-section below the transducers, and then measuring the acoustic return following standard procedures. A 38.1-mm tungsten carbide sphere with 6% cobalt binder was used for all transducers. Target strength and echo integration data were collected to calculate echo sounder gain parameters to ensure the quality of system performance. On-axis and beam pattern data were recorded during the calibration.
Operations Acoustic data were collected day and night from the transducer faces to a maximum
depth of approximately 1,500 m for the EK60 system and 500 m for the EK80. Raw acoustic backscatter (ER60 .raw) data files were logged from all available frequencies. Acousticians used the raw files for live viewing and for scrutinizing on laptop PCs with Myriax Echoview software (version 6.1.60). Event log markers and other marks, including at-sea judgments of hake backscattering layers, were made on the live-viewed files. While all three EK60 frequencies
4
were used for at-sea judgements, data from the 38-kHz echo sounder (the primary frequency used for generating biomass estimates) were post-processed using Echoview, and results presented in this document are based on these data.
The Shimada maintained a vessel speed of approximately 10–11 knots, sea state and
weather permitting. The running of acoustic transects occurred around the clock.
Biological Sampling
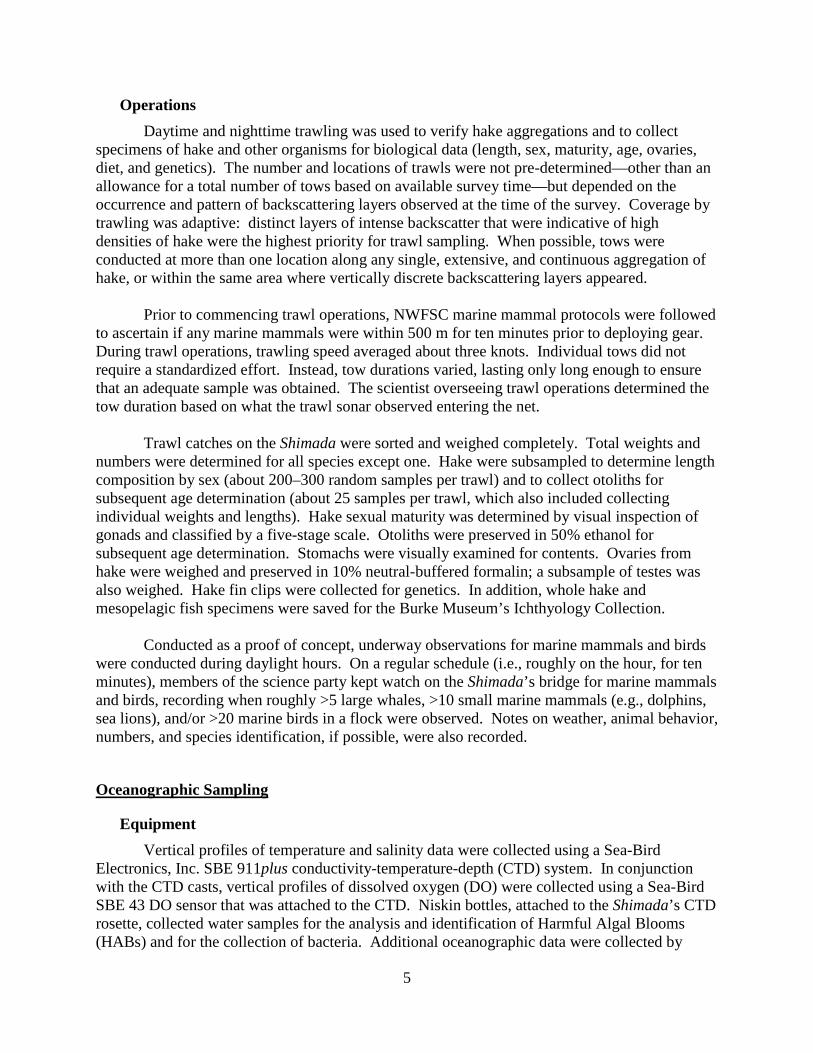
Equipment Daytime and nighttime trawling on fish sign observed by the Shimada was performed
with an Aleutian wing trawl 24/20 (AWT). This net had a vertical opening that averaged 25 m (range: 17–34 m) and a headrope and footrope of 101.7 m each. A 1¼-inch codend liner was used. The AWT was deployed with a pair of 4-m2, 884.5-kg “Fishbuster” trawl doors, 82.3-m legs, and 750-lb chain (“Tom”) weights on each side. A Simrad FS70 third-wire trawl sonar was attached to the AWT headrope to monitor depth, net opening, and water temperature, and to gauge approximately the catch quantity.
To provide additional biological ground truthing (i.e., provide information on the
biological composition of multiple scattering layers in the water column), the AWT was deployed on roughly half the tows (target gear depth ≤350 m) with a GoPro camera and light system mounted inside the net. A GoPro Hero 3+ Silver was put inside a custom underwater housing (made by Sexton Corporation) that was mounted to a rigid ultra-high-molecular-weight polyethylene (UHMWPE) board. Two lights (Nana SeaLites from DeepSea Power and Light), triggered by a pressure sensor in the housing at a depth of around 50 meters, were mounted on either side of the camera. A separate titanium pressure housing that held the batteries for powering the lights was clipped on the outside of the net and was connected to the lights with an underwater cable. The GoPro camera used an additional GoPro Battery BacPac attachment to prolong battery life. Video data were stored on a 32GB micro SD card. Video files were overlaid with time, temperature, and depth information from a Sea-Bird SBE 39 temperature and depth sensor clipped near the camera using a program written in house with Python. Files were spliced together and trimmed to remove video prior to the lights switching on underwater and directly after the lights switched off. Review of the video was completed as soon as possible following a trawl and notes were recorded on a spreadsheet.
An electronic, 60-kg capacity Marel M1100 PL4200 motion-compensating scale was
used to weigh sorted portions of the catch to the nearest 0.01 kg. Two 15-kg capacity Marel M1100 PL2060 motion-compensating scales were used, one to determine weights of individual fish specimens to the nearest 0.005 kg, the other to determine weights of whole hake ovaries to the nearest 0.001 kg. A Scantrol FM100 FishMeter board was used for measuring fish lengths (fork length) to the nearest centimeter.
5
Operations Daytime and nighttime trawling was used to verify hake aggregations and to collect
specimens of hake and other organisms for biological data (length, sex, maturity, age, ovaries, diet, and genetics). The number and locations of trawls were not pre-determined—other than an allowance for a total number of tows based on available survey time—but depended on the occurrence and pattern of backscattering layers observed at the time of the survey. Coverage by trawling was adaptive: distinct layers of intense backscatter that were indicative of high densities of hake were the highest priority for trawl sampling. When possible, tows were conducted at more than one location along any single, extensive, and continuous aggregation of hake, or within the same area where vertically discrete backscattering layers appeared.
Prior to commencing trawl operations, NWFSC marine mammal protocols were followed to ascertain if any marine mammals were within 500 m for ten minutes prior to deploying gear. During trawl operations, trawling speed averaged about three knots. Individual tows did not require a standardized effort. Instead, tow durations varied, lasting only long enough to ensure that an adequate sample was obtained. The scientist overseeing trawl operations determined the tow duration based on what the trawl sonar observed entering the net.
Trawl catches on the Shimada were sorted and weighed completely. Total weights and
numbers were determined for all species except one. Hake were subsampled to determine length composition by sex (about 200–300 random samples per trawl) and to collect otoliths for subsequent age determination (about 25 samples per trawl, which also included collecting individual weights and lengths). Hake sexual maturity was determined by visual inspection of gonads and classified by a five-stage scale. Otoliths were preserved in 50% ethanol for subsequent age determination. Stomachs were visually examined for contents. Ovaries from hake were weighed and preserved in 10% neutral-buffered formalin; a subsample of testes was also weighed. Hake fin clips were collected for genetics. In addition, whole hake and mesopelagic fish specimens were saved for the Burke Museum’s Ichthyology Collection.
Conducted as a proof of concept, underway observations for marine mammals and birds
were conducted during daylight hours. On a regular schedule (i.e., roughly on the hour, for ten minutes), members of the science party kept watch on the Shimada’s bridge for marine mammals and birds, recording when roughly >5 large whales, >10 small marine mammals (e.g., dolphins, sea lions), and/or >20 marine birds in a flock were observed. Notes on weather, animal behavior, numbers, and species identification, if possible, were also recorded.
Oceanographic Sampling
Equipment Vertical profiles of temperature and salinity data were collected using a Sea-Bird
Electronics, Inc. SBE 911plus conductivity-temperature-depth (CTD) system. In conjunction with the CTD casts, vertical profiles of dissolved oxygen (DO) were collected using a Sea-Bird SBE 43 DO sensor that was attached to the CTD. Niskin bottles, attached to the Shimada’s CTD rosette, collected water samples for the analysis and identification of Harmful Algal Blooms (HABs) and for the collection of bacteria. Additional oceanographic data were collected by
6
attaching a Sea-Bird SBE 39 temperature and pressure recorder to the AWT during tows. Sea surface temperature and salinity data were collected using a Sea-Bird SBE probe located below the vessel’s waterline in the Shimada’s flow-through system; this system was also used to collect additional water for analysis of the presence and identity of HABs. A 0.5-m vertical ring net with flowmeter was used to conduct vertical zooplankton tows.
Operations Physical oceanographic sampling was conducted day and night. These data will be used
to describe oceanographic conditions relative to the vertical and horizontal distribution of spawning hake. CTD casts were made at selected locations along designated acoustic transects, on adaptive transects, on hake aggregations that had been trawled upon, and when the ship’s acoustic system was calibrated. Sea surface data (e.g., temperature and salinity) were collected continuously day and night throughout the entire survey. Zooplankton tows were conducted at pre-planned stations (depth contours of 60, 150, 300, 500, 1,000, and 1,500 m) along “coarse” transects near Newport, and Trinidad Head, Bodega Bay, and Point Conception, California to describe the winter distribution of zooplankton species in an El Niño year. CTD casts were also made at each zooplankton station.
Results
Acoustic System Calibration
One calibration of the Shimada’s EK60 and EK80 acoustic systems was conducted January 21 in Monterey Bay, California. Results of the calibration were within expected levels based on factory settings and results from previous calibrations.
Acoustic Sampling and Pacific Hake Distribution
The Shimada collected acoustic data from 33 transects for a linear distance of roughly 3,990 nmi (Figures 1 and 2); six fine-scale adaptive transects (for a total linear distance of roughly 725 nmi) were run over hake aggregations. One “coarse” transect off Cape Mendocino, California was modified with additional zigzags to survey the Mendocino Escarpment more thoroughly. Two smaller zigzags off San Francisco and Morro Bay, California were extended further offshore, and the area between Point Conception and San Diego was surveyed with two large zigzags instead of one as was originally planned. In addition, a smaller zigzag was run between Catalina Island and the California coast. While heading north near the end of the survey, the Shimada targeted areas where hake previously had been observed and fished upon. Lastly, time allowed for the addition of one large and one small zigzag in the area west and just north of Newport.
Adult hake (age 3+) were observed on 18 transects (Figure 3) from southwest of Newport
(transect 3) to south of Point Conception and west of the Channel Islands (transects 21 and 22).

7
No acoustic estimates for juvenile hake were made. Adult hake sign, largely absent in shallower, near-shore waters, was observed far more often in offshore, deeper waters. Relatively extensive aggregations of adult hake were observed toward the end of Leg 2 as the Shimada headed north along transect 29. No hake were observed in the Southern California Bight area east of approximately 120°W.
Biological Sampling
A total of thirty-two (32) midwater trawls were successfully conducted during the survey (Figures 1 and 2, Table 2). One trawl was aborted because gear tangled during deployment. Average trawl duration was 21 minutes (range: 6–41 min) and average trawl depth was 349 m (range: 132–543 m).
Of the 32 trawls conducted, almost all (31/32) caught hake (Table 2), although one
nominal hake tow (#12) caught only two hake and its catch composition essentially was non-hake (roughly 81% plainfin midshipman, 11% spiny dogfish, and 8% California market squid, by weight). Total catch weights ranged from 3.5 kg to 646.8 kg (mean = 213.7 kg). Overall catch composition was dominated by hake, which accounted for close to 96% of the total catch weight and nearly 67% of total catch numbers (Table 3). King-of-the-salmon (Trachipterus altivelis) were caught fairly often (18 tows), in comparatively low numbers but with a higher average individual weight (>2 kg). Lanternfish (Myctophidae) were caught in all tows, accounting for only 0.4% of the catch by weight but over 18% of the catch by number. Sea tongues (Pyrosoma atlanticum) were also caught frequently (28 tows), accounting for almost 5% of catch by number.
During the survey, 6,436 hake were measured for length, 768 pairs of hake otoliths were
collected, and 760 hake stomachs were visually examined in situ (Table 4). Raw length-frequency distributions (Figure 4) were characterized by hake having a very strong mode at 43 cm—indicative of the relative abundance of adult (age 3+) hake—and smaller modes at 27/28 cm (hake spawned in 2014) and 18/19 cm (hake spawned in 2015). Average hake lengths by haul (Figure 5) showed that almost all tows that caught hake less than 30 cm were in waters shallower than 500 m, whereas hake larger than 35 cm were almost always in waters deeper than 2,000 m.
Underway observations for marine mammals and birds were conducted on fourteen (14)
days each leg, for a survey total of twenty-eight (28). Ninety (90) ten-minute observation blocks were completed during leg one and one hundred twelve (112) were completed during leg two.
Oceanographic Sampling
Seventy-four (74) CTD temperature and salinity profiles were collected successfully (one CTD cast failed) by the Shimada at selected locations along the line transects and at the acoustic system calibration site in Monterey Bay (Figures 1 and 2). Additional temperature profiles were collected from twenty-eight (28) SBE casts that were collected at most Shimada trawl stations. All planned twenty-four (24) vertical zooplankton tows, and one impromptu tow along transect

8
16, were conducted successfully. Four hundred eighty-four (484) HABS samples were collected along the acoustic transects.
Acknowledgements Thanks go to the officers and crew of the Shimada for their contribution to the successful
completion of the winter 2016 integrated acoustic and trawl survey of Pacific hake. Thanks go also to all others who supported and helped make this survey a success, notably the personnel from the NWFSC FRAM and Conservation Biology Divisions, the NOAA Office of Science and Technology, Centro Interdisciplinario de Ciencias Marinas-Instituto Politécnico Nacional, Alaskan Observers, Inc., the University of Washington, and Highline College.
This survey was conducted under the authority of the following permits: California
Department of Fish and Wildlife Scientific Collecting Permit SC-11678, Oregon Department of Fish and Wildlife 2016 – Scientific Taking Permit – Fish #20082, NOAA Office of National Marine Sanctuaries MULTI-2015-002, NMFS Section 10(a)(1)(A) Research Permit 16337-2M (extended until an EA/BiOP is completed in the spring of 2016), and NMFS West Coast Region Scientific Research Permit SRP-27-2016.

9
Table 1. Itinerary for the winter 2016 integrated acoustic and trawl survey of Pacific hake.
Leg 1 January 9 Personnel embark onto the Shimada in Newport, Oregon; the survey starts. January 9–18 Zigzag-oriented transects are run south. January 18 The Shimada breaks from transect 13 to assess conditions in Drakes Bay, California
for an acoustic system calibration. Transect 13 is resumed. January 19-21 Survey operations continue south, finishing with transect 14. January 21 Personnel conduct an acoustic system calibration of the Shimada with standard
targets in Monterey Bay, California. January 22 Survey operations resume. January 23–25 Inport San Francisco; exchange personnel. Leg 2 January 26 The survey resumes with transect 15; survey operations continue south. February 2 The Shimada reaches the southernmost-extent of the survey with the completion of
transect 24. February 4 The Shimada starts heading north along transect 29 to re-sample areas of hake
observed previously. February 7–9 Additional zigzag transects 30–33 are run. February 9 The Shimada pulls into Newport; the cruise ends.

Table 2. Station and catch data summary of midwater trawls conducted by the NOAA Ship Bell M. Shimadaduring the winter 2016 integrated acoustic and trawl survey of Pacific hake.
CatchHaul INPFC Time Duration Start position Depth (m) Temp. (°C) Pacific hake Otherno. areaa Date (PST) (min.)b Latitude Longitude Gearc Bottom Geard Surface (kg) Number (kg) 1 SCol 10 Jan 18:59 17 43 23.82 126 8.15 196 3,035 6.03 11.43 641.9 1,174 5.02 Eur 12 Jan 6:40 15 42 10.49 124 39.78 282 460 6.46 11.19 31.9 235 3.03 Eur 12 Jan 10:06 18 42 10.89 124 40.14 132 468 10.96 11.19 -- -- 3.54 Eur 13 Jan 9:22 13 41 20.90 124 29.87 360 448 7.45 11.98 408.0 3,522 31.65 Eur 13 Jan 12:15 13 41 20.17 124 28.98 280 361 7.96 12.12 41.3 379 3.66 Eur 13 Jan 19:25 16 41 9.53 124 21.51 182 216 9.76 12.22 21.4 558 30.37 Mont 15 Jan 5:02 9 40 28.34 125 5.88 255 2,531 7.96 12.75 225.3 462 9.08 Mont 15 Jan 14:40 6 40 25.31 125 5.97 492 2,409 6.14 12.93 458.4 943 1.39 Mont 16 Jan 10:19 30 39 50.57 125 5.76 476 1,952 3.95 13.32 59.6 123 1.610 Mont 17 Jan 2:08 11 39 7.15 125 14.37 239 3,252 8.03 13.33 120.0 256 20.710 11 Mont 17 Jan 11:01 17 39 7.21 125 13.72 453 3,251 5.89 14.48 117.8 256 0.712 Mont 18 Jan 9:42 17 38 14.85 123 25.06 211 228 9.26 13.39 0.1 2 41.213 Mont 18 Jan 23:13 30 37 57.47 123 31.67 449 1,398 6.47 13.39 119.9 959 4.614 Mont 20 Jan 0:39 18 37 31.85 124 39.75 284 4,083 7.89 14.17 203.9 449 14.415 Mont 20 Jan 13:06 haul aborted because of a gear issue16 Mont 20 Jan 15:22 20 37 16.78 124 5.34 457 3,175 6.25 13.49 384.0 894 5.917 Mont 22 Jan 13:41 14 37 17.13 124 12.50 470 3,942 6.10 13.52 546.7 1,416 0.718 Mont 22 Jan 21:00 12 37 12.91 124 5.58 250 3,841 8.43 13.54 235.9 558 1.019 Mont 27 Jan 6:02 18 36 29.56 123 17.24 236 3,462 8.14 13.62 240.3 506 0.820 Mont 27 Jan 12:28 30 36 19.27 123 29.73 490 3,574 5.75 13.70 225.4 471 2.321 Con 27 Jan 20:15 15 35 59.22 123 53.11 213 3,914 8.26 13.65 127.6 282 11.222 Con 28 Jan 21:28 20 35 30.46 121 12.94 289 306 8.58 13.85 2.6 69 1.523 Con 29 Jan 11:02 20 34 45.18 121 6.23 368 546 7.83 14.10 26.8 37 6.424 Con 30 Jan 11:50 30 33 49.92 120 55.73 543 2,252 6.54 14.55 219.0 548 4.8

Table 2 continued. Station and catch data summary of midwater trawls conducted by the NOAA Ship Bell M. Shimadaduring the winter 2016 integrated acoustic and trawl survey of Pacific hake.
CatchHaul INPFC Time Duration Start position Depth (m) Temp. (°C) Pacific hake Otherno. areaa Date (PST) (min.)b Latitude Longitude Gearc Bottom Geard Surface (kg) Number (kg) 25 Con 30 Jan 20:03 30 33 10.69 121 23.85 260 3,816 8.17 14.57 210.2 460 15.426 Con 31 Jan 8:49 20 33 12.90 120 50.95 513 2,970 4.80 15.44 377.8 827 2.427 Con 3 Feb 23:24 36 34 24.19 121 38.72 367 3,635 7.11 13.67 220.8 573 16.828 Con 4 Feb 16:38 30 34 54.15 122 16.69 479 4,010 6.25 13.66 162.6 390 4.729 Mont 5 Feb 16:05 30 37 10.34 124 3.78 407 3,833 7.01 13.16 325.9 739 6.130 Mont 6 Feb 6:09 10 39 3.08 125 11.94 257 3,280 7.92 12.59 223.6 454 1.831 Mont 6 Feb 18:22 21 40 17.43 125 4.59 387 1,205 6.57 12.65 344.0 808 9.932 Eur 7 Feb 9:43 27 42 33.41 125 49.76 433 2,550 5.54 11.43 139.4 287 3.733 SCol 8 Feb 10:59 41 44 57.24 126 31.36 462 2,810 5.38 10.75 72.4 150 39.3
11
a Con = Conception, Mont = Monterey, Eur = Eureka, SCol = South Columbiab Duration is the time during trawling between "Target Depth" and "Haul Back."c Gear depths were measured at the foot rope.d Gear temperatures were measured at the head rope.
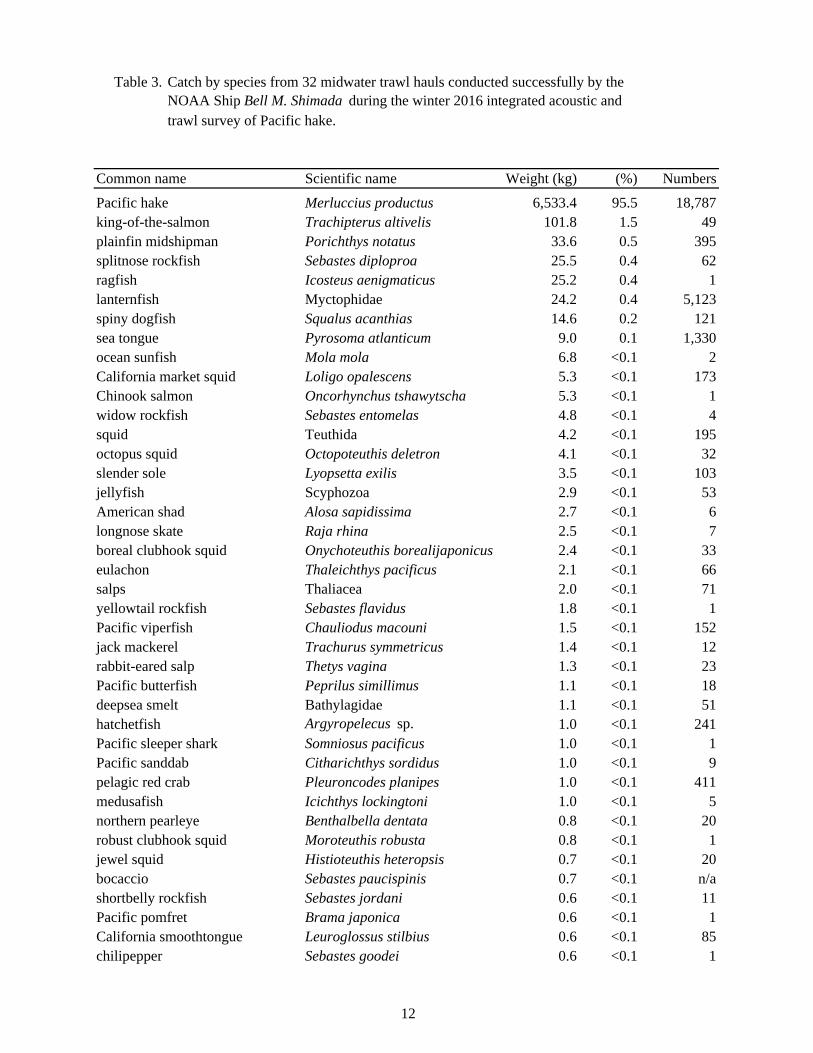
Table 3. Catch by species from 32 midwater trawl hauls conducted successfully by theNOAA Ship Bell M. Shimada during the winter 2016 integrated acoustic andtrawl survey of Pacific hake.
Common name Scientific name Weight (kg) (%) Numbers
Pacific hake Merluccius productus 6,533.4 95.5 18,787king-of-the-salmon Trachipterus altivelis 101.8 1.5 49plainfin midshipman Porichthys notatus 33.6 0.5 395splitnose rockfish Sebastes diploproa 25.5 0.4 62ragfish Icosteus aenigmaticus 25.2 0.4 1lanternfish Myctophidae 24.2 0.4 5,123spiny dogfish Squalus acanthias 14.6 0.2 121sea tongue Pyrosoma atlanticum 9.0 0.1 1,330ocean sunfish Mola mola 6.8 <0.1 2California market squid Loligo opalescens 5.3 <0.1 173Chinook salmon Oncorhynchus tshawytscha 5.3 <0.1 1widow rockfish Sebastes entomelas 4.8 <0.1 4squid Teuthida 4.2 <0.1 195octopus squid Octopoteuthis deletron 4.1 <0.1 32slender sole Lyopsetta exilis 3.5 <0.1 103jellyfish Scyphozoa 2.9 <0.1 53American shad Alosa sapidissima 2.7 <0.1 6longnose skate Raja rhina 2.5 <0.1 7boreal clubhook squid Onychoteuthis borealijaponicus 2.4 <0.1 33eulachon Thaleichthys pacificus 2.1 <0.1 66salps Thaliacea 2.0 <0.1 71yellowtail rockfish Sebastes flavidus 1.8 <0.1 1Pacific viperfish Chauliodus macouni 1.5 <0.1 152jack mackerel Trachurus symmetricus 1.4 <0.1 12rabbit-eared salp Thetys vagina 1.3 <0.1 23Pacific butterfish Peprilus simillimus 1.1 <0.1 18deepsea smelt Bathylagidae 1.1 <0.1 51hatchetfish Argyropelecus sp. 1.0 <0.1 241Pacific sleeper shark Somniosus pacificus 1.0 <0.1 1Pacific sanddab Citharichthys sordidus 1.0 <0.1 9pelagic red crab Pleuroncodes planipes 1.0 <0.1 411medusafish Icichthys lockingtoni 1.0 <0.1 5northern pearleye Benthalbella dentata 0.8 <0.1 20robust clubhook squid Moroteuthis robusta 0.8 <0.1 1jewel squid Histioteuthis heteropsis 0.7 <0.1 20bocaccio Sebastes paucispinis 0.7 <0.1 n/ashortbelly rockfish Sebastes jordani 0.6 <0.1 11Pacific pomfret Brama japonica 0.6 <0.1 1California smoothtongue Leuroglossus stilbius 0.6 <0.1 85chilipepper Sebastes goodei 0.6 <0.1 1
12

Table 3 continued. Catch by species from 32 midwater trawl hauls conducted successfullyby the NOAA Ship Bell M. Shimada during the winter 2016 integrated acousticand trawl survey of Pacific hake.
Common name Scientific name Weight (kg) (%) Numbers
longfin dragonfish Tactostoma macropus 0.5 <0.1 14shining tubeshoulder Sagamichthys abei 0.4 <0.1 19robust blacksmelt Bathylagus milleri 0.3 <0.1 14ribbon barracudina Arctozenus risso 0.2 <0.1 7Pacific blackdragon Idiacanthus antrostomus 0.2 <0.1 28scaleless dragonfish Melanostomiidae 0.2 <0.1 6chiroteuthid squid Chiroteuthis calyx 0.2 <0.1 6shrimp Decapoda 0.2 <0.1 37blackbelly dragonfish Stomias atriventer 0.2 <0.1 2glass shrimp Pasiphaea pacifica 0.1 <0.1 36sawtooth eel Serrivomer sector 0.1 <0.1 3North Pacific armhook squid Gonatopsis borealis 0.1 <0.1 2ocean shrimp Pandalus jordani 0.1 <0.1 13slender barracudina Lestidiops ringens 0.1 <0.1 5Pacific sardine Sardinops sagax 0.1 <0.1 1pearleye Scopelarchidae <0.1 <0.1 4red mysid Neognathophausia sp. <0.1 <0.1 14chub mackerel Scomber japonicus <0.1 <0.1 1fish Osteichthyes <0.1 <0.1 2sandpaper squid Cranchia scabra <0.1 <0.1 8bigscale Melamphaidae <0.1 <0.1 16northern anchovy Engraulis mordax <0.1 <0.1 5organic matter -- <0.1 <0.1 1northern smoothtongue Leuroglossus schmidti <0.1 <0.1 6squat lobster Galatheidae <0.1 <0.1 9slender hatchetfish Argyropelecus affinis <0.1 <0.1 9wheel jellyfish Atolla sp. <0.1 <0.1 7bobtail squid Rossia pacifica <0.1 <0.1 1surf smelt Hypomesus pretiosus <0.1 <0.1 5snipe eel Nemichthyidae <0.1 <0.1 2loosejaw Malacosteidae <0.1 <0.1 1barbled dragonfish Stomiidae <0.1 <0.1 7fangtooth Anoplogastridae <0.1 <0.1 1shining loosejaw Aristostomias scintillans <0.1 <0.1 4deepsea sole Embassichthys bathybius <0.1 <0.1 4Pacific sergestid shrimp Sergestes similis <0.1 <0.1 63highsnout bigscale Melamphaes lugubris <0.1 <0.1 2pelagic sea snail Carinaria <0.1 <0.1 8scabbardfish Lepidopus xantusi <0.1 <0.1 1barracudina Paralepididae <0.1 <0.1 1
13
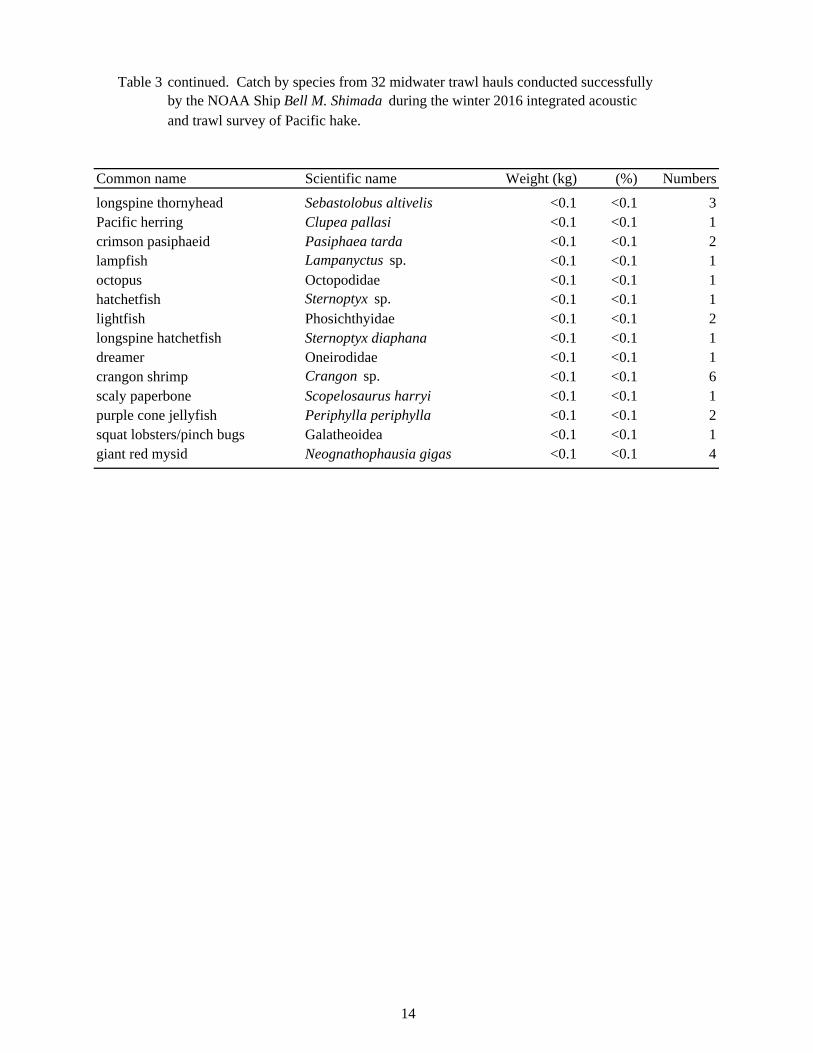
Table 3 continued. Catch by species from 32 midwater trawl hauls conducted successfullyby the NOAA Ship Bell M. Shimada during the winter 2016 integrated acousticand trawl survey of Pacific hake.
Common name Scientific name Weight (kg) (%) Numbers
longspine thornyhead Sebastolobus altivelis <0.1 <0.1 3Pacific herring Clupea pallasi <0.1 <0.1 1crimson pasiphaeid Pasiphaea tarda <0.1 <0.1 2lampfish Lampanyctus sp. <0.1 <0.1 1octopus Octopodidae <0.1 <0.1 1hatchetfish Sternoptyx sp. <0.1 <0.1 1lightfish Phosichthyidae <0.1 <0.1 2longspine hatchetfish Sternoptyx diaphana <0.1 <0.1 1dreamer Oneirodidae <0.1 <0.1 1crangon shrimp Crangon sp. <0.1 <0.1 6scaly paperbone Scopelosaurus harryi <0.1 <0.1 1purple cone jellyfish Periphylla periphylla <0.1 <0.1 2squat lobsters/pinch bugs Galatheoidea <0.1 <0.1 1giant red mysid Neognathophausia gigas <0.1 <0.1 4
14
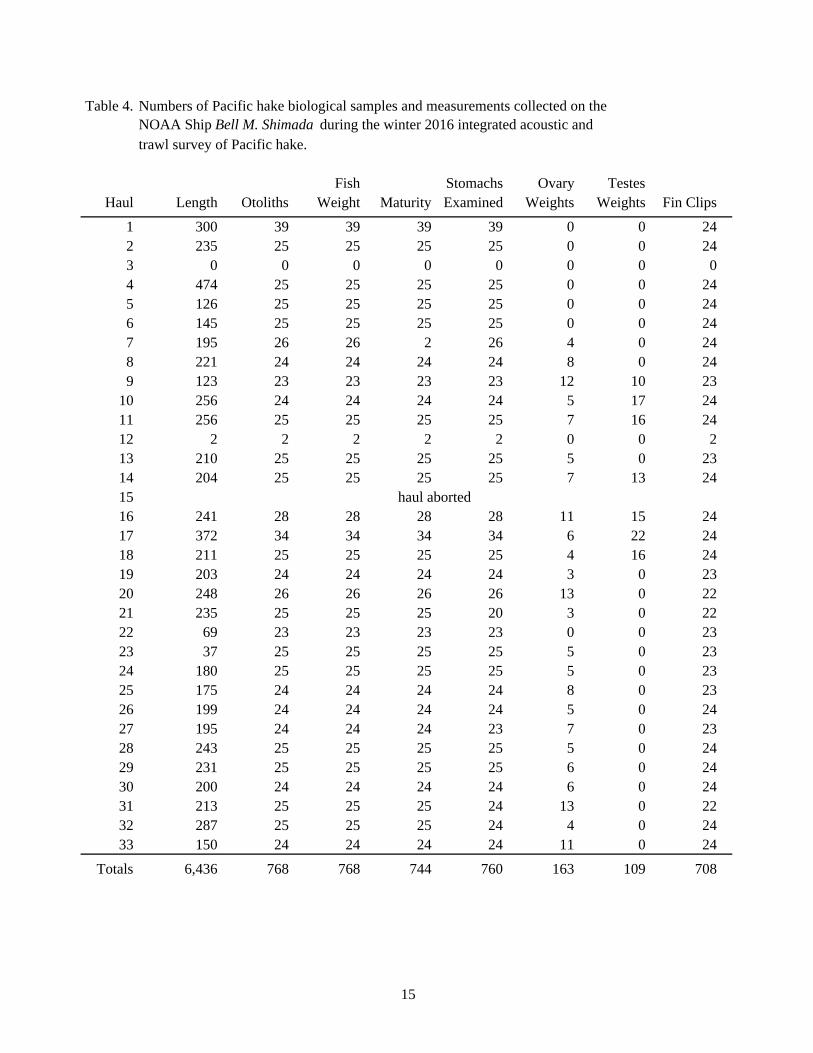
Table 4. Numbers of Pacific hake biological samples and measurements collected on theNOAA Ship Bell M. Shimada during the winter 2016 integrated acoustic andtrawl survey of Pacific hake.
Fish Stomachs Ovary TestesHaul Length Otoliths Weight Maturity Examined Weights Weights Fin Clips
1 300 39 39 39 39 0 0 242 235 25 25 25 25 0 0 243 0 0 0 0 0 0 0 04 474 25 25 25 25 0 0 245 126 25 25 25 25 0 0 246 145 25 25 25 25 0 0 247 195 26 26 2 26 4 0 248 221 24 24 24 24 8 0 249 123 23 23 23 23 12 10 23
10 256 24 24 24 24 5 17 2411 256 25 25 25 25 7 16 2412 2 2 2 2 2 0 0 213 210 25 25 25 25 5 0 2314 204 25 25 25 25 7 13 2415 haul aborted16 241 28 28 28 28 11 15 2417 372 34 34 34 34 6 22 2418 211 25 25 25 25 4 16 2419 203 24 24 24 24 3 0 2320 248 26 26 26 26 13 0 2221 235 25 25 25 20 3 0 2222 69 23 23 23 23 0 0 2323 37 25 25 25 25 5 0 2324 180 25 25 25 25 5 0 2325 175 24 24 24 24 8 0 2326 199 24 24 24 24 5 0 2427 195 24 24 24 23 7 0 2328 243 25 25 25 25 5 0 2429 231 25 25 25 25 6 0 2430 200 24 24 24 24 6 0 2431 213 25 25 25 24 13 0 2232 287 25 25 25 24 4 0 2433 150 24 24 24 24 11 0 24
Totals 6,436 768 768 744 760 163 109 708
15

Figure 1.
L Survey track
Leg 1 of the wk design (with
winter 2016 inth locations of tegrated acou
16
hauls, zooplaustic and traw
ankton stationwl survey of Pa
ns, and CTD cacific hake.
casts) used duuring

Figure 2.
L Survey track
Leg 2 of the wk design (with
winter 2016 inth locations of tegrated acou
17
hauls, zooplaustic and traw
ankton stationwl survey of Pa
ns, and CTD cacific hake.
casts) used duuring

Figure 3.
w Acoustic pre
winter 2016 inesence/absencntegrated acou
ce of adult (agustic and traw
18
ge 3+) Pacificwl survey of P
c hake along tacific hake.
transects com
mpleted duringg the

19
0.00
0.05
0.10
0.15
0 5 10 15 20 25 30 35 40 45 50 55 60 65 70 75 80
Prop
ortio
n
Fork Length (cm)
N = 6,436
Figure 4. Survey-wide length-frequency distribution of Pacific hake from specimens measured during the winter 2016 integrated acoustic and trawl survey of Pacific hake.

Figure 5. Average Pacific hake fork length and average bottom depth by haul during the winter2016 integrated acoustic and trawl survey of Pacific hake.
0
5
10
15
20
25
30
35
40
45
50
0 500 1,000 1,500 2,000 2,500 3,000 3,500 4,000 4,500
Ave
rage
Hak
e Fo
rk L
engt
h (c
m) B
y H
aul
Average Bottom Depth By Haul (m)
20