The Winning EQUATION - California State University, Northridgevcmth00m/lineareq1.pdf · CISC -...
27
CISC - Curriculum & Instruction Steering Committee California County Superintendents Educational Services Association Primary Content Module Algebra I - Linear Equations and Inequalities The Winning EQUATION A HIGH QUALITY MATHEMATICS PROFESSIONAL DEVELOPMENT PROGRAM FOR TEACHERS IN GRADES 4 THROUGH ALGEBRA II STRAND: Algebra I – Linear Equations and Inequalities MODULE TITLE: PRIMARY CONTENT MODULE MODULE INTENTION: The intention of this module is to inform and instruct participants in the underlying mathematical content in the areas of algebra and functions. THIS ENTIRE MODULE MUST BE COVERED IN-DEPTH. The presentation of these Primary Content Modules is a departure from past professional development models. The content here, is presented for individual teacher’s depth of content in mathematics. Presentation to students would, in most cases, not address the general case or proof, but focus on presentation with numerical examples. In addition to the underlying mathematical content provided by this module, the facilitator should use the classroom connections provided within this binder and referenced in the facilitator’s notes. TIME: One full day PARTICIPANT OUTCOMES: •Demonstrate understanding of the mathematics behind linear functions. •Demonstrate understanding of the mathematics of why a graph is considered linear. •Demonstrate how to graph linear equations and inequalities. •Demonstrate how to deduce standard formulas. •Demonstrate the definition of concepts through geometric arguments.
Transcript of The Winning EQUATION - California State University, Northridgevcmth00m/lineareq1.pdf · CISC -...

CISC - Curriculum & Instruction Steering CommitteeCalifornia County Superintendents Educational Services AssociationPrimary Content Module Algebra I - Linear Equations and Inequalities
The Winning EQUATIONA HIGH QUALITY MATHEMATICS PROFESSIONAL DEVELOPMENTPROGRAM FOR TEACHERS IN GRADES 4 THROUGH ALGEBRA II
STRAND: Algebra I – Linear Equations and Inequalities
MODULE TITLE: PRIMARY CONTENT MODULE
MODULE INTENTION: The intention of this module is to inform and instruct participants inthe underlying mathematical content in the areas of algebra and functions.
THIS ENTIRE MODULE MUST BE COVERED IN-DEPTH.The presentation of these Primary Content Modules is a departure from past professionaldevelopment models. The content here, is presented for individual teacher’s depth ofcontent in mathematics. Presentation to students would, in most cases, not address thegeneral case or proof, but focus on presentation with numerical examples.In addition to the underlying mathematical content provided by this module, the facilitatorshould use the classroom connections provided within this binder and referenced in thefacilitator’s notes.TIME: One full day
PARTICIPANT OUTCOMES:•Demonstrate understanding of the mathematics behind linear functions.•Demonstrate understanding of the mathematics of why a graph is considered linear.•Demonstrate how to graph linear equations and inequalities.•Demonstrate how to deduce standard formulas.•Demonstrate the definition of concepts through geometric arguments.

CISC - Curriculum & Instruction Steering Committee 2
California County Superintendents Educational Services Association
Primary Content Module Algebra I - Linear Equations & Inequalities
© 1999, CISC: Curriculum and Instruction Steering Committee The WINNING EQUATION
T-1T-2
T-3to
T-22
T-23to
T-34
PRIMARY CONTENT MODULE VII
Facilitator’s Notes
NO CALCULATORS SHOULD BE USED. GRAPH PAPER ISESSENTIAL.
Ask participants to take the pre-test. Explain the rationale behind thepre-post tests. Go over the outcomes listed on transparency (T-1) ofthis module.
Overview for the facilitator for this module.
This overview is intended to help the facilitator get a sense of how the“story” of this module unfolds. Slides labeled H-xx are handouts.
Functions and Relations
The module begins with a discussion of relations and functions,including simple quadratics and cubics as examples. Practiceidentifying functions using the vertical line test given. Since linearfunctions are particular examples of functions, this serves asbackground information for understanding linear functions. The focushere should be on plotting points to determine the graphs of functions,and how adding a constant b to a function f(x) changes the graph. Thegraph of y = f(x) + b is the graph of y = f(x) translated vertically up ordown, depending on b. Overhead slides T-18 through T-22 aredevoted to clarifying this. This will be used to understand the role of bin the equation y = mx + b in slides that follow.
Why is the Graph of y = mx a straight line?
Background on “similarity” is given in slides T-25 and T-26. Themain focus of this section begins with slide T-23. The goal is tounderstand why the graph of y = mx + b is necessarily a straight line.How do we know this? The approach taken here is to start with thesimple case y = mx.. The argument uses similar triangles and beginswith slide T-28, and ends on T-30. The converse argument, that anynonvertical line through (0,0) is the graph of y = mx for some value ofm, is given on T-31 and T-32. Mention to participants that we areassuming the line is not the x-axis or the y-axis. The x-axis hasequation y = 0 • x, so m = 0. Slide T-34 concludes this argument andexploits the result by pointing out that it is only necessary to plot twopoints to find the graph of y = mx, no matter what m is.

CISC - Curriculum & Instruction Steering Committee 3
California County Superintendents Educational Services Association
Primary Content Module Algebra I - Linear Equations & Inequalities
© 1999, CISC: Curriculum and Instruction Steering Committee The WINNING EQUATION
T-35T-36
T-37to
T-44
T-45T-46
T-47to
T-51
T-52to
T-54
T-55to
T-62
T-63T-64
Why is the Graph of y = mx + b a straight line?
Slides T-35 and T-36 are intended to convince the participants that thegraph of y = mx + b must also be a straight line. This is because thegraph of y = mx is always a straight line and adding the constant b tothe function f(x) = mx just translates the graph vertically. A verticaltranslation of a line is still a line.
The Meaning of the Slope, m
Starting with slide T-37, the goal is to understand the meaning of m inthe equation y = mx + b. The approach taken here is to calculate therise over the run determined by any two points on the graph of y = mx+ b and use simple algebra to deduce that it is m. The meaning ofnegative slopes is also explained. The top of slide T-44 summarizesthis discussion with a definition of slope.
Further elaboration on the y-intercept and determining if a pointlies on a line.
The bottom of slide T-44 defines the y-intercept, and slides T-45 andT-46 elaborate on the meaning of the y-intercept.
An important goal now is to help participants learn how to find thevalue of the y-intercept b if they are given a point lying on the graph ofy = mx + b, and if they know already the value of m. This is part ofthe process of determining the equation of a line from two points thatlie on its graph. T-47 through T-51 guide participants through this partof the process.
Slides T-52 through T-54 help participants to review the main ideascovered above. They are asked to graph a line using any two points onthe line. They are also asked to use the slope and y-intercept to find agraph.
Slide T-55 summarizes once again the Algebra I standard whichrequires students to determine if a point lies on the graph determinedby a linear function. The same standard requires students to derive theequation of a line from two points. Guided practice follows throughslide T-62.
Horizontal and Vertical Lines
Slide T-63 explains that horizontal lines correspond to zero slope.Slide T-64 discusses vertical lines. Vertical lines are not a special caseof the slope intercept equation, y = mx + b.

CISC - Curriculum & Instruction Steering Committee 4
California County Superintendents Educational Services Association
Primary Content Module Algebra I - Linear Equations & Inequalities
© 1999, CISC: Curriculum and Instruction Steering Committee The WINNING EQUATION
T-65to
T-70
T-71to
T-74
T-75
T-76to
T-79
T-80to
T-84
T-85to
T-95
T-90
T-96
T-97to
T-102
The General Linear Equation
The next step is to show that vertical and nonvertical lines are bothspecial cases of the general linear equation, Ax + By = C. Thisdevelopment procedes through slide T-70.
Parallel and Perpendicular lines
Slides T-71 through T-74 are devoted to an important application oflinear functions. Participants are guided through the derivation of theformulas for converting from the Fahrenheit to Celsius temperaturescales and vice versa.
Slide T-75 introduces Standard 8 of the Algebra I standard which asksstudents to understand the concept of parallel and vertical lines andhow their slopes are related.
Slides T-76 through T-79 explain that parallel lines have the sameslope. Slide T-79 summarizes the result as a theorem and gives thecorresponding theorem for perpendicular lines.
Slides T-80 through T-84 give practice using the theorems whichcharacterize parallel and perpendicular lines.
Slides T-85 through T-95 give a proof using the Pythagorean Theoremand its converse that two nonvertical lines are perpendicular if andonly if the product of their slopes is –1. The Pythagorean Theorem isexplained on slide T-86 and it is then used to derive the distanceformula in the plane. This formula is needed to carry out the proof ofthe theorem for vertical lines.
The converse of the Pythagorean Theorem is given on slide T-90 andthe proof of the theorem relating the slopes of perpendicular lines iscompleted on slide T-95.
SAT Problem
Slide T-96 has a sample problem on linear functions from the SAT forstudents to try. Answer: C
Linear Inequalities
The remaining slides are devoted to linear inequalities and can be usedor omitted at the facilitators discretion.
Talk about linear inequalities. For example y > x + 2 and explain howto graph it.

CISC - Curriculum & Instruction Steering Committee 5
California County Superintendents Educational Services Association
Primary Content Module Algebra I - Linear Equations & Inequalities
© 1999, CISC: Curriculum and Instruction Steering Committee The WINNING EQUATION
•The first step is to graph the line. Determine two points to graph theline y = x + 2. Here it might be easy to determine where the line cutsthe x and y-axis. Here the intercepts are (0,2) and (–2,0).
•Draw a dashed line as the inequality is >. If the inequality was < this isalso a dashed line. The line is solid only if the inequality is ≤ or ≥.
• In this case y > mx + b. Since the y-values satisfying the inequality aregreater than the corresponding y-values on the line y = mx + b, itfollows that half-plane above the line must be shaded. T-102 givesanother example.
Final Tasks
Provide time for participants to ask clarifying questions.
Give pre-post test.
Standards Covered in this Module
Grade 3 Algebra and Functions
2.0 Students represent simple functional relationships.2.1 Solve simple problems involving a functional relationship
between two quantities (e.g., find the total cost of multipleitems given by the cost per unit.)
2.2 Extend and recognize a linear pattern by its rules (e.g., the numberof legs on a given number of horses may be calculated by countingthe 4s or by multiplying the number of horses by 4).
Grade 4 Algebra and Functions
1.5 Understand that an equation such as y = 3x + 5 is a prescription fordetermining a second number when a first number is given.
2.0 Students know how to manipulate equations.2.1 Know and understand that equals added to equals are equal.2.2 Know and understand that equals multiplied by equals are equal.
Grade 4 Measurement and Geometry
2.0 Students use two-dimensional coordinate grids to represent pointsand graph lines and simple figures.
2.1 Draw the points corresponding to linear relationships on graphpaper (e.g., draw 10 points on the graph of the equation y = 3x andconnect them by using a straight line).

CISC - Curriculum & Instruction Steering Committee 6
California County Superintendents Educational Services Association
Primary Content Module Algebra I - Linear Equations & Inequalities
© 1999, CISC: Curriculum and Instruction Steering Committee The WINNING EQUATION
2.2 Understand that the length of a horizontal line segment equals thedifference of the x-coordinates.
2.4 Understand that the length of a vertical line segment equals thedifference of the y-coordinates.
3.0 Students demonstrate an understanding of plane and solid geometricobjects and use this knowledge to show relationships and solveproblems.
3.1 Identify lines that are parallel and perpendicular.
Standards Covered in this Module – 2
Grade 5 Algebra and Functions
1.0 Students use variables in simple expressions, compute the value ofthe expression for specific values of the variable, and plot andinterpret the results.
1.3 Know and use the distributive property in equations and expressionswith variables.
1.4 Identify and graph ordered pairs in the four quadrants of thecoordinate plane.
1.5 Solve problems involving linear functions with integer values; writethe equation; and graph the resulting ordered pairs of integers on agrid.
Grade 5 Measurement and Geometry
2.0 Students identify, describe, and classify the properties of, and therelationships between, plane and solid geometric figures.
2.1 Measure, identify, and draw angles, perpendicular and parallel lines,rectangles and triangles by using appropriate tools (e.g.,straightedge, ruler, compass, protractor, drawing software).
Grade 6 Algebra and Functions
1.0 Students write verbal expressions and sentences as algebraicexpressions and equations; they evaluat algebraic expressions, solvesimple linear equations, and graph and interpret their results.
1.1 Write and solve one-step linear equations in one variable.1.2 Write and evaluate an algebraic expression for a given situation,
using up to three variables.
Grade 7 Algebra and Functions
3.0 Students graph and interpret linear and some nonlinear functions.3.1 Graph functions of the form y = nx2 and y = nx3 and use in solving
problems.

CISC - Curriculum & Instruction Steering Committee 7
California County Superintendents Educational Services Association
Primary Content Module Algebra I - Linear Equations & Inequalities
© 1999, CISC: Curriculum and Instruction Steering Committee The WINNING EQUATION
3.3 Graph linear functions, noting that the vertical change (change in y-value) per unit of horizontal change (change in x-value) is alwaysthe same and know that the ratio (“rise over run”) is called the slopeof the graph.
Standards Covered in this Module – 3
Grade 7 Algebra and Functions
4.0 Students solve simple linear equations and inequalities over therational numbers.
4.1 Solve two-step linear equations and inequalities in one-variableover the rational numbers, interpret the solution or solutions in thecontext form which they arose, and verify the reasonableness of theresults.
Grade 7 Measurement and Geometry
3.0 Students know the Pythagorean theorem and deepen theirunderstanding of plane and solid geometric shapes by constructingfigures that meet given conditions and by identifying attributes offigures.
3.3 Know and understand the Pythagorean Theorem and its converseand use it to find the length of the missing side of a right triangleand the length of other line segments and, in some situations,empirically verify the Pythagorean Theorem by directmeasurement.
Algebra Standards listed here by number only since all will be part ofthe teaching of the module.

PRIMARY CONTENT MODULE Algebra I - Linear Equations & Inequalities Pre-Post Test
© 1999, CISC: Curriculum and Instruction Steering Committee The WINNING EQUATION
Pre/Post Test
1. The equation of a line that has a slope of –2 and ay-intercept of 1 is
a) 2x + 3y = 1 b) y = –2x + 1c) y = 2x + 1 d) y + x = –1
2. The equation of the line that goes through (1,2) and isparallel to y = 3x + 1 is
a) y = 3x + 2 b) 3x – y = 1c) x = 3y + 1 d) 3xty = 1
3. The slope of a line perpendicular to y = 2x – 3 is
a) –1
2b)
1
2c) –2 d) 2
4. The length of the segment that goes from (3,4) to (5,9)is
a) 24 b) 6 c) 29 d) 7
5. The slope of the segment that goes from (–1,2) and(2,8) is
a) 6 b) 1
2c) 3 d) 2
6. The y-intercept of the graph of 3x + 2y = 1 is
a) 1
2b) 1 c) 2 d) 3

PRIMARY CONTENT MODULE Algebra I - Linear Equations & Inequalities Pre-Post Test
© 1999, CISC: Curriculum and Instruction Steering Committee The WINNING EQUATION
7. The linear function for the table below is
x y –1 1
0 31 52 7
a) y = x + 2 b) y = 2xc) y = x + 3 d) y = 2x + 3
8. In the table given below, the 2nd column represents thefunction y = x2. The 3rd column then would represent
x y = x2 y = ?–2 4 7–1 1 40 0 31 1 42 4 7
a) y = x2 + 3 b) y = (x + 3)2
c) y = x2 – 3 d) y = 3x2 + 1
9. The equation of the y-axis isa) xy = 0 b) y = 0c) x + y = 0 d) x = 0
10. The slope of 2x + 3y = 6 is
a) 2b) 3
2c) –
2
3d) 3

PRIMARY CONTENT MODULE Algebra I - Linear Equations & Inequalities Pre-Post Answer Key
© 1999, CISC: Curriculum and Instruction Steering Committee The WINNING EQUATION
Pre/Post Test Answer Key
1. B
2. B
3. A
4. C
5. D
6. A
7. D
8. A
9. D
10. C

PRIMARY CONTENT MODULE Algebra I - Linear Equations & Inequalities T-1
© 1999, CISC: Curriculum and Instruction Steering Committee The WINNING EQUATION
Participant Outcomes
• Demonstrate understanding of themathematics behind linear functions.
• Demonstrate understanding of themathematics of why a graph isconsidered linear.
• Demonstrate how to graph linearequations and inequalities.
• Demonstrate how to deduce standardformulas.
• Demonstrate the definition of conceptsthrough geometric arguments.

PRIMARY CONTENT MODULE Algebra I - Linear Equations & Inequalities T-2
© 1999, CISC: Curriculum and Instruction Steering Committee The WINNING EQUATION
Standard 6From Algebra I Grade 8
Students graph a linear equation, and
compute the x and y-intercepts (e.g.,
2x + 6y = 4). They are also able to sketch
the region defined by the linear inequality
(e.g., sketch the region defined by
2x + 6y < 4).

PRIMARY CONTENT MODULE Algebra I - Linear Equations & Inequalities T-3
© 1999, CISC: Curriculum and Instruction Steering Committee The WINNING EQUATION
Definition of Terms
•A point in the plane is an ordered pair of realnumbers. The first number is sometimes calledthe x-coordinate. The second number issometimes called the y-coordinate.
•A relation is any set of ordered pairs of realnumbers. The domain of a relation is the set ofall first coordinates of the relation. The rangeof a relation is the set of all second coordinatesof the relation.
•An example of a relation is{(x, y) : x2 + y2 = 1 and -1 ≤ x ≤1}. This is theset of all ordered pairs of real numbers x and ywhich satisfy the equation x2 + y2= 1, theequation of the circle of radius 1 centered at theorigin. The graph of this relation is this circle.The domain of this relation is the interval[-1, 1]. [-1, 1] is also the range of thisparticular relation. This relation is not afunction.

PRIMARY CONTENT MODULE Algebra I - Linear Equations & Inequalities T-4
© 1999, CISC: Curriculum and Instruction Steering Committee The WINNING EQUATION
Definition of Terms Continued
• A function is a relation such that for any firstcoordinate in the domain, there is one and only onesecond coordinate. A function given by a formulaof the form y = f(x) is a relation because it may beregarded as the collection of all ordered pairs ofnumbers of the form (x, f(x)) where x is in thedomain of the function. The x-coordinate is theindependent variable. The y-coordinate is thedependent variable.
•Not every relation is a function, butevery function is a relation.

PRIMARY CONTENT MODULE Algebra - Linear Equations & Inequalities T-5/H-5
© 1999, CISC: Curriculum and Instruction Steering Committee The WINNING EQUATION
Determine the domain and range of the relations
listed below and determine if the relation is a
function?
1. x = {(–2,3), (2,1) (3,4), (4,5)}
2. y = {(3,5), (4,6), (2,7), (3,–6)}
3. z = {(–2, 4), (1,4), (2,4), (3,4)}
PRIMARY CONTENT MODULE Algebra - Linear Equations & Inequalities T-6
© 1999, CISC: Curriculum and Instruction Steering Committee The WINNING EQUATION
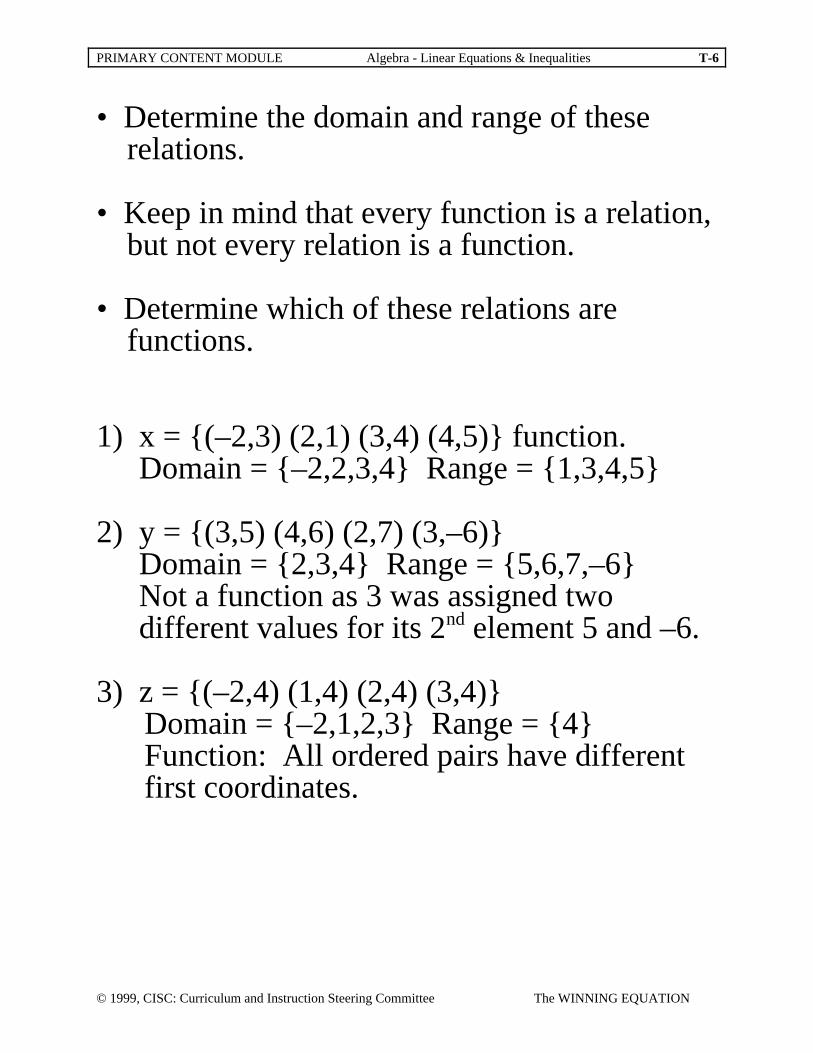
• Determine the domain and range of theserelations.
• Keep in mind that every function is a relation,but not every relation is a function.
• Determine which of these relations arefunctions.
1) x = {(–2,3) (2,1) (3,4) (4,5)} function.Domain = {–2,2,3,4} Range = {1,3,4,5}
2) y = {(3,5) (4,6) (2,7) (3,–6)}Domain = {2,3,4} Range = {5,6,7,–6}Not a function as 3 was assigned twodifferent values for its 2nd element 5 and –6.
3) z = {(–2,4) (1,4) (2,4) (3,4)}Domain = {–2,1,2,3} Range = {4}Function: All ordered pairs have differentfirst coordinates.
PRIMARY CONTENT MODULE Algebra - Linear Equations & Inequalities T-7
© 1999, CISC: Curriculum and Instruction Steering Committee The WINNING EQUATION
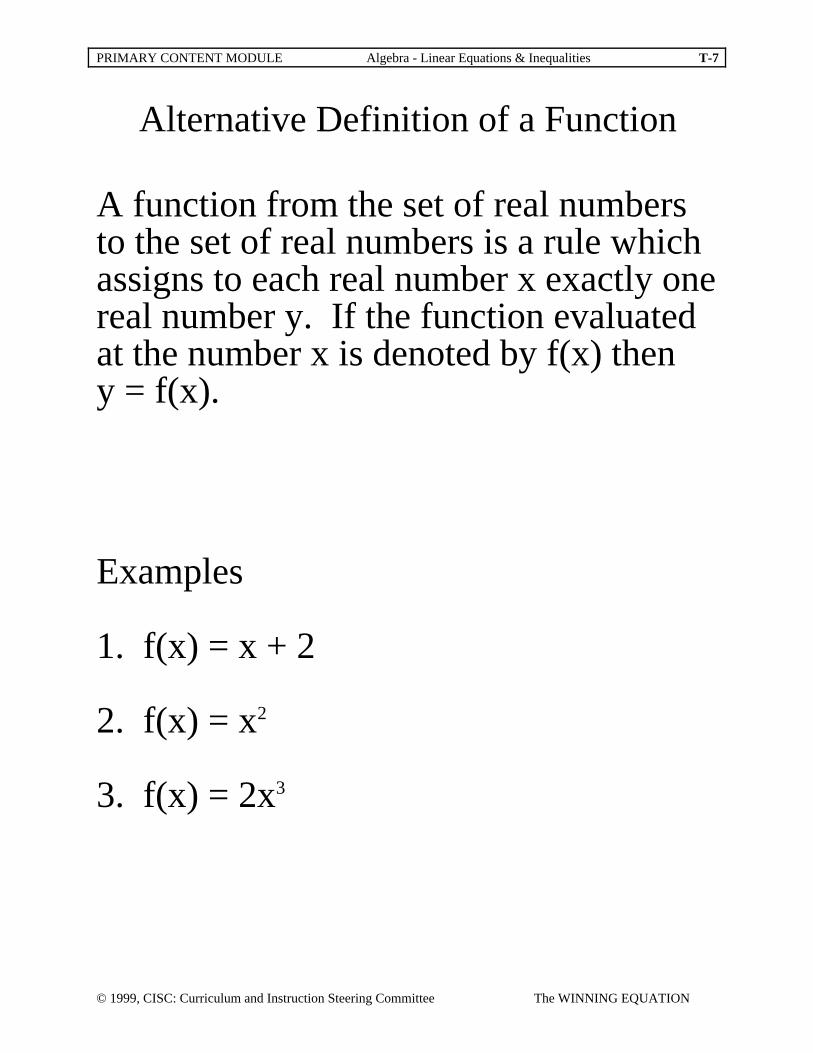
Alternative Definition of a Function
A function from the set of real numbersto the set of real numbers is a rule whichassigns to each real number x exactly onereal number y. If the function evaluatedat the number x is denoted by f(x) theny = f(x).
Examples
1. f(x) = x + 2
2. f(x) = x2
3. f(x) = 2x3
PRIMARY CONTENT MODULE Algebra - Linear Equations & Inequalities T-8
© 1999, CISC: Curriculum and Instruction Steering Committee The WINNING EQUATION
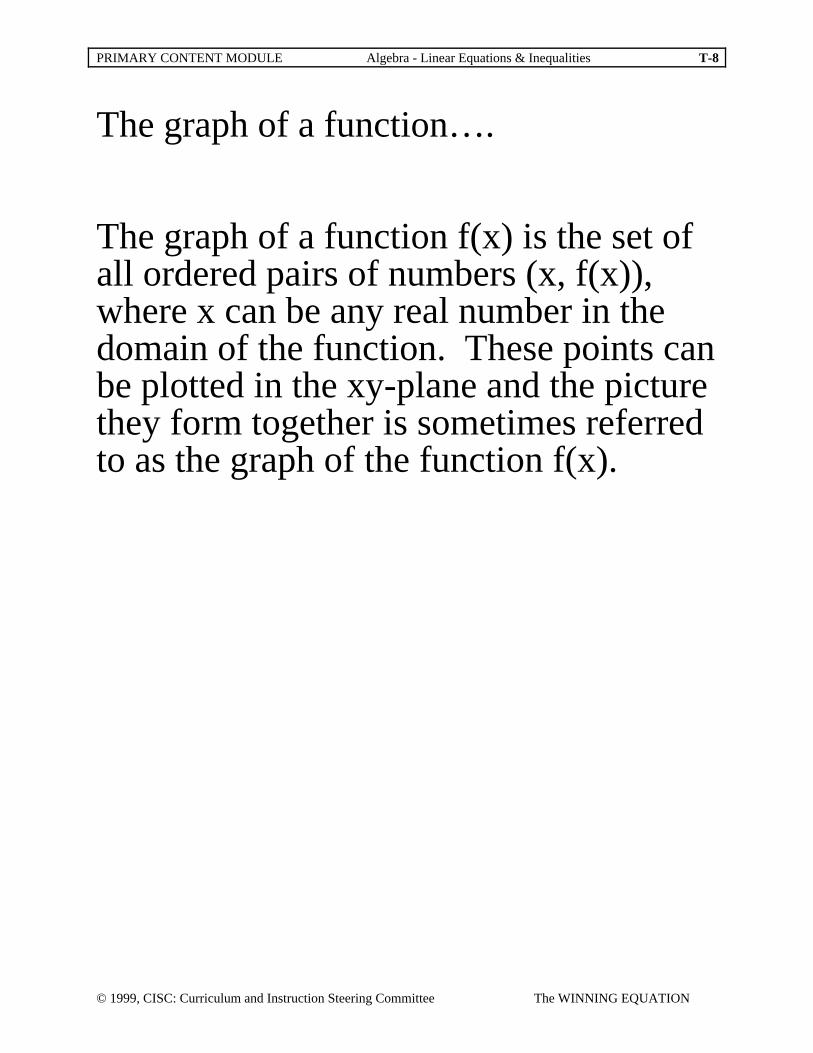
The graph of a function….
The graph of a function f(x) is the set ofall ordered pairs of numbers (x, f(x)),where x can be any real number in thedomain of the function. These points canbe plotted in the xy-plane and the picturethey form together is sometimes referredto as the graph of the function f(x).

PRIMARY CONTENT MODULE Algebra - Linear Equations & Inequalities T-9
© 1999, CISC: Curriculum and Instruction Steering Committee The WINNING EQUATION
The Domain of a function is the set of allx-values of the function.
The Range of a function is the set of ally-values of the function.

PRIMARY CONTENT MODULE Algebra - Linear Equations & Inequalities T-10/H-10
© 1999, CISC: Curriculum and Instruction Steering Committee The WINNING EQUATION
Complete the table and graph y = x2
x y = x2
–2 –1
012

PRIMARY CONTENT MODULE Algebra - Linear Equations & Inequalities T-11
© 1999, CISC: Curriculum and Instruction Steering Committee The WINNING EQUATION
Complete the table and graph y = x2
x y = x2
–2 (–2)2 = 4 –1 (–1)2 = 1
0 (0)2 = 01 (1)2 = 12 (2)2 = 4

PRIMARY CONTENT MODULE Algebra - Linear Equations & Inequalities T-12
© 1999, CISC: Curriculum and Instruction Steering Committee The WINNING EQUATION
Practice
For the points identified in the table:
What are the values in the domain?
What are the values in the range?
Extra Credit: What is the domain of thefunction y = x2?
What is the range?

PRIMARY CONTENT MODULE Algebra - Linear Equations & Inequalities T-13
© 1999, CISC: Curriculum and Instruction Steering Committee The WINNING EQUATION
Vertical Line Test
If each vertical line in the x-y plane intersects aparticular graph in at most one point, then thatgraph is the graph of a function.
Determine whether the graphs below are thegraphs of functions.

PRIMARY CONTENT MODULE Algebra - Linear Equations & Inequalities T-14
© 1999, CISC: Curriculum and Instruction Steering Committee The WINNING EQUATION
Solution:
Use the vertical line test
Any verticalline intersectsthe graph inat most onepoint.
This is thegraph of afunction
A verticalline intersectsthe graph intwo points.
This is NOTthe graph of afunction
Any verticalline intersectsthe graph inat most onepoint.
This is thegraph of afunction

PRIMARY CONTENT MODULE Algebra - Linear Equations & Inequalities T-15/H-15
© 1999, CISC: Curriculum and Instruction Steering Committee The WINNING EQUATION
Now Try These
Determine the domain and range of theserelations and determine if the relation is afunction.
1) A = {(–2,3), (–1,0), (0,1), (1,3)}
2) B = {(5,–2), (4,–3), (5,1), (3,5)}
3) C = {(5,2), (4,2), (3,2) (2,2)}
4) 5) 6)
2
-2 3
-2
5

PRIMARY CONTENT MODULE Algebra - Linear Equations & Inequalities T-16
© 1999, CISC: Curriculum and Instruction Steering Committee The WINNING EQUATION
Solution:
1) Domain {–2,–1,0, 1} Range {3,0,1} Function
2) Domain {5,4,3} Range {–2,–3,1,5} Not a function
3) Domain {5,4,3,2} Range {2} Function
4) 5) 6)
2
-2 3
-2
5
Domain: all realnos.
Range: {y: y ≥ 0}
PassesVertical linetest
Function
Domain:{x: -2≤ x ≤ 3}Range:{y:-2 ≤ y ≤ 2}
Fails VerticalLine TestNOT Function
Domain: all realnos.
Range: {y: y ≤ 5}
PassesVerticalline test
Function

PRIMARY CONTENT MODULE Algebra - Linear Equations & Inequalities T-17
© 1999, CISC: Curriculum and Instruction Steering Committee The WINNING EQUATION
Let’s take a look at some moreexamples of functions