The - WICSEC WICSEC... · Veronica Ragland Jean Fogarty November 1, 2011 2. 5 Federal Performance...
21
1
Transcript of The - WICSEC WICSEC... · Veronica Ragland Jean Fogarty November 1, 2011 2. 5 Federal Performance...

1

The Federal Performance Measures – Keep, Change or
Replace?
Alicia KeyVeronica Ragland
Jean Fogarty
November 1, 20112

5 Federal Performance Measures Measure Formula Weight Standard Penalty
StandardPaternity Establishment
IV‐D PEPCaseload children born
OOW with Pat. Est. or Ackn.Caseload children born OOW by end of preceding calendar year
Statewide PEPStatewide children born OOW with Pat, Est. or Ackn. in fiscal yearStatewide children born OOW in
preceding fiscal year
1 50% or improve 10%
80% or improve 2 – 6 %
Support Orders Cases with support ordersTotal cases
1 50% or improve 5%
40% or improve 5%
Current Collections $ Current Support Collected$ Current Support Owed
1 40% or improve 5%
35% or improve 5%
Arrears Collections Cases Paying ArrearsCases with Arrears Due
.75 40% or improve 5%
N/A
Cost Effectiveness Total $ CollectedTotal $ Spent
.75 $2.00 N/A
The maximum a state can earn in incentives for measures 1-4 is reached at 80% and for measure 5 (cost effectiveness) at $5.00. 3

Child Support Performance on 5 measures
2
2.5
3
3.5
4
4.5
5
5.5
6
40.00%
50.00%
60.00%
70.00%
80.00%
90.00%
100.00%
110.00%
120.00%
FFY 2000 FFY 2001 FFY 2002 FFY 2003 FFY 2004 FFY 2005 FFY 2006 FFY 2007 FFY 2008 FFY 2009 FFY 2010
Percentage
Performance from 2000 ‐ 2010
IV‐D PEP Statewide PEP Order % CSUP % Arrears % Cost Effectiveness
PEP, Orders, Current and Arrears Collection use the left axis.
Cost effectiveness uses the right axis 4

Collections and Cost
3,000,000,000
3,500,000,000
4,000,000,000
4,500,000,000
5,000,000,000
5,500,000,000
6,000,000,000
15,000,000,000
17,000,000,000
19,000,000,000
21,000,000,000
23,000,000,000
25,000,000,000
27,000,000,000
29,000,000,000
FFY 2000 FFY 2001 FFY 2002 FFY 2003 FFY 2004 FFY 2005 FFY 2006 FFY 2007 FFY 2008 FFY 2009 FFY 2010
To
tal C
oll
ecti
on
s
Total Collections and Cost
Total Collection Total Cost
Collections use the left axis
IV-D caseload uses the right axis 5

Collections and TANF Caseload
3,000,000
3,500,000
4,000,000
4,500,000
5,000,000
5,500,000
6,000,000
15,000,000,000
17,000,000,000
19,000,000,000
21,000,000,000
23,000,000,000
25,000,000,000
27,000,000,000
29,000,000,000
FFY 2000 FFY 2001 FFY 2002 FFY 2003 FFY 2004 FFY 2005 FFY 2006 FFY 2007 FFY 2008 FFY 2009 FFY 2010
To
tal C
oll
ecti
on
s
Total Collections and TANF Caseload
Total Collection TANF Caseload
TA
NF C
aselo
ad
Collections use the left axis
TANF caseload uses the right axis6

Total Cases and Number of Employees
55,000
57,000
59,000
61,000
63,000
65,000
15,000,000
15,500,000
16,000,000
16,500,000
17,000,000
17,500,000
18,000,000
FFY 2000 FFY 2001 FFY 2002 FFY 2003 FFY 2004 FFY 2005 FFY 2006 FFY 2007 FFY 2008 FFY 2009 FFY 2010
To
tal C
aselo
ad
Total Cases and Employees
Caseload Employees
Collections use the left axis
Number of Full Time Employees uses the right axis7

Paternity EstablishmentWhat Works• 38% of the IV‐D Directors say it works
• 80% paternity establishment is attainable
What Doesn’t Work • 62% of the IV‐D Directors say it doesn't work
• Full incentives are awarded at 80% but penalties are assessed for failing to reach 90%
• Reducing out of wedlock births works against states because the smaller current pool of births makes it harder to reach 8

Paternity Establishment (Cont.)
Change?• Reduce penalty to match performance measure
• Require all states to use a IV‐D PEP by eliminating the state wide option
9

Current Support Collections
What Works• 86% of directors say this measure works
• It incentivizes the core function of the Program
• Promotes orders that match the NCPs ability to pay
What Doesn’t Work • Only one state has been able to obtain the full incentive
• Is 80% too high when many states have 50% of the caseload receiving TANF? 10

Current Support Collections (Cont.)
Change?• Measure the number of cases that receive support so long as a case receives at least 60% of current support due
• Measure the reliability of support by counting the number of months support is received in a year
• Measure the average collections per case or the percent of cases with payments
11
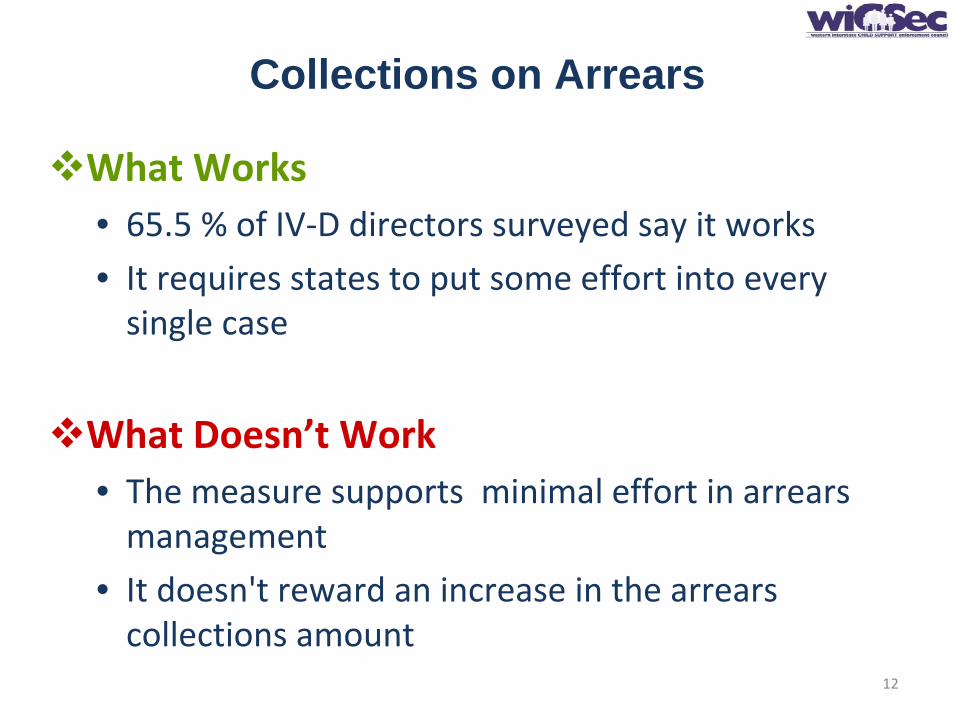
Collections on Arrears
What Works• 65.5 % of IV‐D directors surveyed say it works
• It requires states to put some effort into every single case
What Doesn’t Work • The measure supports minimal effort in arrears management
• It doesn't reward an increase in the arrears collections amount
12

Collections on Arrears (Cont.)
Change?• Measure % collected on arrears owed per case, rather than $1 per case
• Debt forgiveness or total arrears reduction should be rewarded in some way
• Weight of the measure (now 75%) should be changed
13
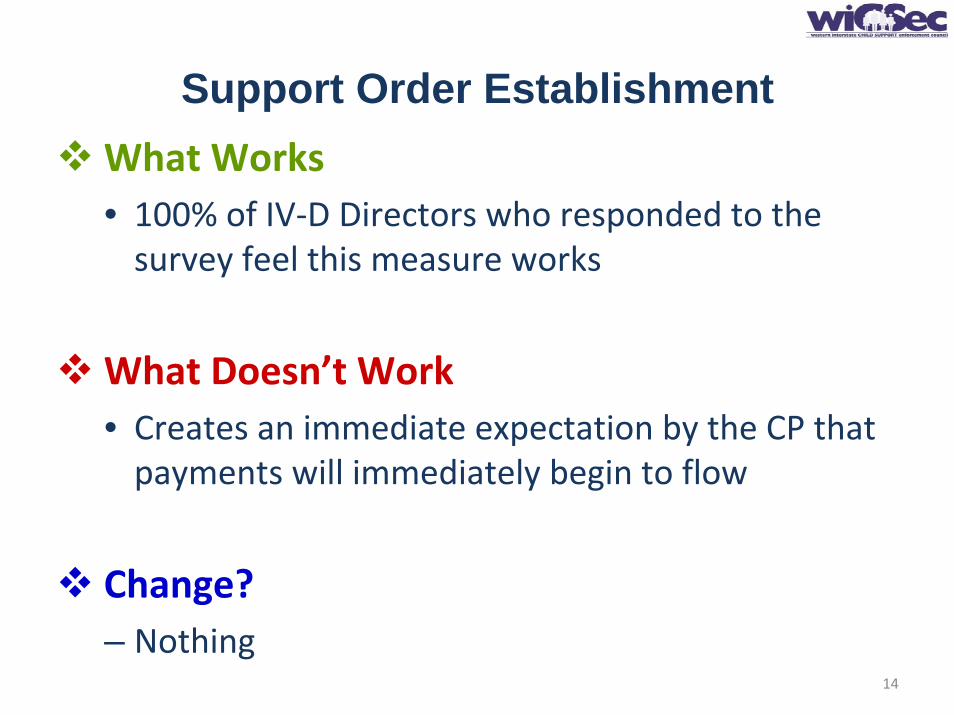
Support Order EstablishmentWhat Works• 100% of IV‐D Directors who responded to the survey feel this measure works
What Doesn’t Work • Creates an immediate expectation by the CP that payments will immediately begin to flow
Change?– Nothing
14

Cost Effectiveness
What Works• 69% of IV‐D Directors surveyed say it works
• Current economic realities justify greater rewards for operating a lean and efficient program
What Doesn’t Work • Discourages large dollar investments in program infrastructure/technology
• Discourages investment in activities that do not clearly lead to collections (pregnancy prevention education, access & Visitation, etc.)
15

Cost Effectiveness
Change?• Increase maximum performance of $5 ‐many states already exceed it
16
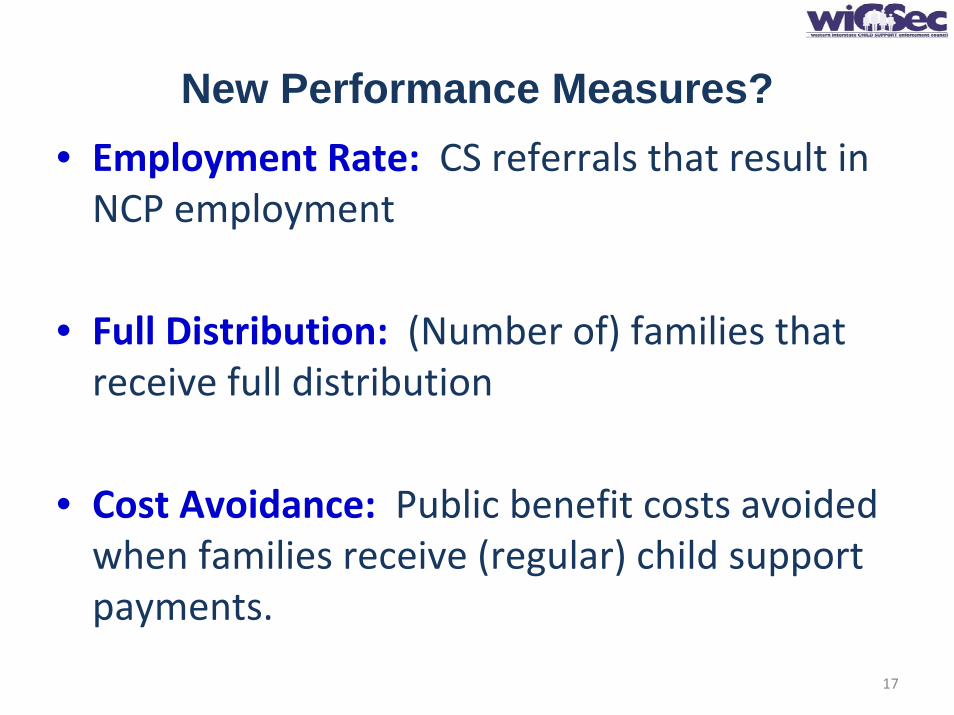
New Performance Measures?• Employment Rate: CS referrals that result in NCP employment
• Full Distribution: (Number of) families that receive full distribution
• Cost Avoidance: Public benefit costs avoided when families receive (regular) child support payments.
17

New Performance Measures (Cont.)?
• Subgroup Compares: PMRs for Current Assistance, Former Assistance, and Never Assistance caseloads
• Fatherhood/Family Stability: No recommendations on how to measure
• Ability to Pay/Review and Modification: Looks at Current Collections from agency action rather than outcome.
18

Contact Information
19
APPENDIX
20

OCSE 157 Performance Measure Lines
Line Item Performance Measure
Line 5: IV‐D cases born out of wedlock
Line 6: IV‐D cases with paternity
Paternity Establishment—IV‐Dline 6 ÷ Line 5
Line 8: Children born out of wedlock statewide
Line 9: Paternity established statewide
Paternity Establishment—Statewideor Line 9 ÷ Line 8
Line 1: Open cases
Line 2: Cases open at end of FY with order
Cases with OrdersLine 2 ÷ Line 1
Line 24: Total child support due
Line 25: Total child support distributed
Collection Rate for Current SupportLine 25 ÷ Line 24
Line 28: Cases with arrears
Line 29: Cases paying towards arrears
Cases Paying Toward ArrearsLine 29 ÷ Line 28
21