The Washington State Freight Mobility Plan: Identifying ...
16
The Washington State Freight Mobility Plan: Identifying and Managing Performance on the State’s Truck Freight Corridors Innovation in Urban Freight Workshop Seattle, Washington February 6, 2012 Barbara Ivanov Freight Systems Division Director Washington State Department of Transportation Presenter Name 16 pt. Title of presenter 14 pt.
Transcript of The Washington State Freight Mobility Plan: Identifying ...

The Washington State Freight Mobility Plan:
Identifying and Managing Performance on
the State’s Truck Freight Corridors
Innovation in Urban Freight Workshop
Seattle, Washington
February 6, 2012
Barbara Ivanov Freight Systems Division Director
Washington State Department of Transportation
Presenter Name 16 pt. Title of presenter 14 pt.

Washington’s Economy Depends on a
Stronger Freight Transportation System
Washington’s investment in freight systems supports our
growing economy, maintains freight access to our major
markets and ports, lowers business costs, and sustains
jobs.
• $37 million of freight moves on Washington roadways
every hour of every day in 2010.
• Our system of roads, rails, ports, marine waterways and
intermodal facilities supported total exports from
Washington valued at $53 billion in 2010.
• In 2010, freight-dependent industries accounted for over
41% of Washington’s jobs.
- 625,101 jobs in retail and wholesale trade.
- 528,043 jobs supported by “Made in Washington”
agribusiness, manufacturing, construction and
timber/wood products sectors. Source: WSDOT Freight Systems Division
2

What is the Purpose of the Washington
State Freight Mobility Plan?
Objectives:
• Urban goods movement systems that
support jobs, the economy, and clean air
for all, and provide goods delivery to
residents and businesses.
• Washington’s competitive position as a
Global Gateway to the nation, and the
state and national Export Initiatives.
• Rural economies’ farm-to-market,
manufacturing and resource industry
sectors.
Goal: The Washington State Freight Mobility Plan will develop and
prioritize freight transportation system improvement strategies that
support and enhance trade and sustainable economic growth, safety, the
environment, and goods delivery needs in the state.
3
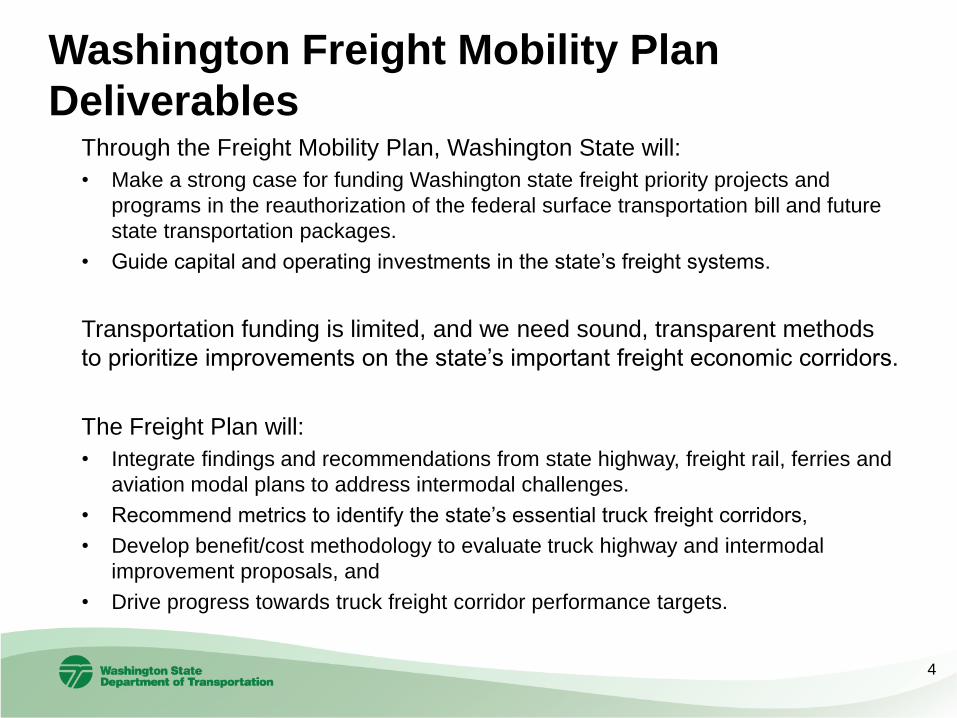
Washington Freight Mobility Plan
Deliverables Through the Freight Mobility Plan, Washington State will:
• Make a strong case for funding Washington state freight priority projects and
programs in the reauthorization of the federal surface transportation bill and future
state transportation packages.
• Guide capital and operating investments in the state’s freight systems.
Transportation funding is limited, and we need sound, transparent methods
to prioritize improvements on the state’s important freight economic corridors.
The Freight Plan will:
• Integrate findings and recommendations from state highway, freight rail, ferries and
aviation modal plans to address intermodal challenges.
• Recommend metrics to identify the state’s essential truck freight corridors,
• Develop benefit/cost methodology to evaluate truck highway and intermodal
improvement proposals, and
• Drive progress towards truck freight corridor performance targets.
4

How Can We Identify the State’s Truck
Freight Economic Corridors?
The state’s freight corridors are multi-jurisdictional and may be intermodal.
The Washington State Department of Transportation (WSDOT) has
identified the state’s backbone freight system based on volume, including
interstate and state highways, local roads, freight rail lines and waterways.
But by definition, essential state freight corridors connect economically
significant:
• Goods production centers such as agribusiness, timber/wood product
and manufacturing centers, with
• Distribution, processing, and intermodal hubs, and
• Consumption centers in metropolitan areas.
So in addition to the freight volume threshold, we need to develop
connectivity criteria to identify the state’s freight corridors.
5

How is WSDOT Developing Freight
System Connectivity Criteria?
• WSDOT worked with shippers, freight carriers, labor, local, regional and
federal government, and environmental association representatives in three
Washington State Freight Mobility Plan Technical Teams to develop a
prioritized list of measurable truck freight system benefits.
• To reduce freight transportation costs and grow jobs and the economy, the
Technical Teams recommended that the state freight corridors include truck
freight connections, to-and-from:
– Essential state intermodal facilities, goods processing and distribution centers to
the interstate system and/or four-lane divided highways.
– Essential state intermodal facilities to other essential state intermodal facilities.
– Urban freight hubs such as the central business district, port or warehouse
district, to regional destinations.
– All urban industrial/commercial zoned lands and the interstate system.
– Industrial/commercial lands within five miles of the interstate in rural areas, and
the interstate system.
6

WSDOT Is Continuing to Develop Truck
Freight Corridor Connectivity Criteria
They’ve suggested adding:
• Primary urban arterials in the Puget Sound Regional
Council region that don’t meet the state’s truck
volume threshold between designated:
– Manufacturing Industrial Centers (MIC) and the
interstate system,
– Regional centers.
• Over-dimensional routes in urban areas.
• Agricultural, timber and natural resource routes that
carry one million tons of truck traffic a minimum of
three month per year, during harvest or other peak
periods.
• Short links between lower-volume maritime ports and
barge loaders and the interstate or four-lane highway
system.
WSDOT continues to work with Metropolitan Planning and Regional Transportation
Planning Organizations, cities, counties, ports, Tribes, carriers and shippers to
develop quantitative criteria to identify essential state truck freight connector routes.
7

Once Identified, How Do We Measure Performance
on the State’s Truck Freight Corridors? • By accurately tracking truck speed and reliability on the state’s truck freight
corridors, WSDOT’s Truck Freight Performance Measure program will enable
Washington State to meet the performance demands imbedded in the proposed
“Moving Ahead for Progress in the 21st Century” (MAP-21) reauthorization of the
federal surface transportation bill.
• MAP-21 consolidates the core highway programs from seven in SAFETEA-LU to
five, including a new funded freight program.
• The new freight program directs states to:
– Develop and periodically update performance targets for freight movement.
– For every two-year period, submit to the U.S. Department of Transportation
Secretary a report on the progress of the State towards meeting the targets and the
ways in which the State is addressing congestion at freight bottlenecks within the
State.
– If States don’t meet their performance targets, they must submit freight performance
improvement plans to USDOT.
• The Washington, Oregon and California Departments of Transportation have jointly
applied for a $1 million federal ITS grant to expand WSDOT’s Truck Performance
Measure program to the entire Interstate 5 corridor, from Canada to Mexico.
8

How Does Washington State’s Truck
Performance Measurement Program
Work? The Washington State Department of Transportation (WSDOT) and the University of
Washington have developed new GPS data collection and analytic methodology to
objectively identify and assess truck bottlenecks by:
1. Truck volume,
2. Reliability, and
3. Truck speed below a poor performance threshold, which WSDOT has defined as 60
percent of posted speed (35 miles per hour on urban freeways).
The method:
Supports a transparent and defensible process to identify and rank truck bottlenecks
on the state’s major freight corridors.
Is automated, in order to analyze millions of GPS data points drawn from over 6,000
trucks traveling on the state’s major truck corridors each week.
Accounts for the importance of high-volume truck corridors, while being flexible
enough to identify both urban and rural truck highway bottlenecks.
9
WSDOT is Learning that Truck Bottlenecks
and Solutions Fall into Three Categories
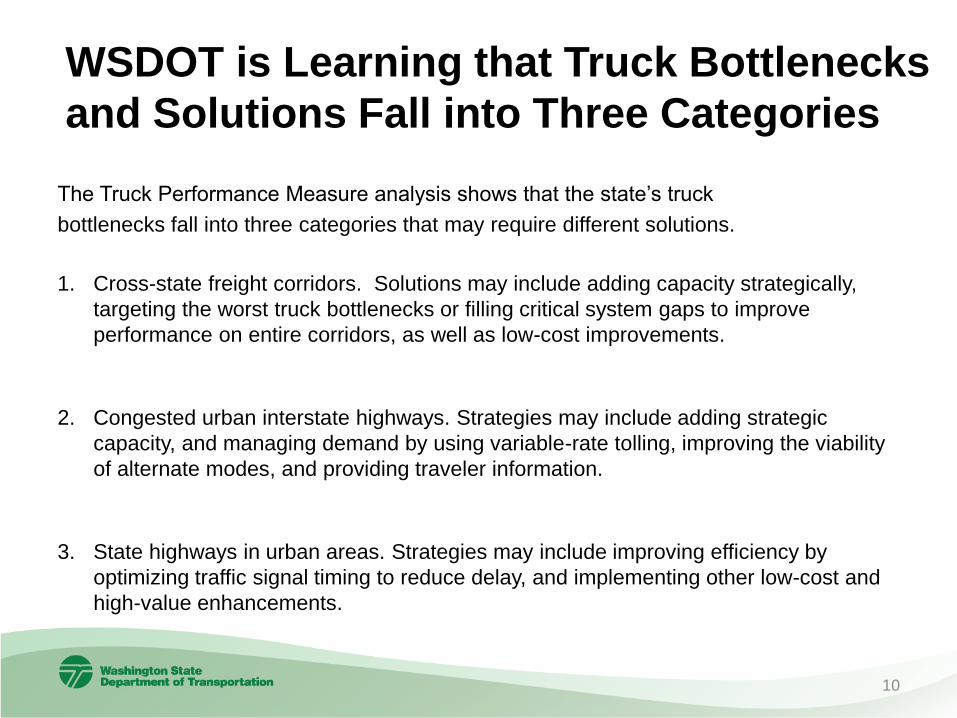
The Truck Performance Measure analysis shows that the state’s truck
bottlenecks fall into three categories that may require different solutions.
1. Cross-state freight corridors. Solutions may include adding capacity strategically,
targeting the worst truck bottlenecks or filling critical system gaps to improve
performance on entire corridors, as well as low-cost improvements.
2. Congested urban interstate highways. Strategies may include adding strategic
capacity, and managing demand by using variable-rate tolling, improving the viability
of alternate modes, and providing traveler information.
3. State highways in urban areas. Strategies may include improving efficiency by
optimizing traffic signal timing to reduce delay, and implementing other low-cost and
high-value enhancements.
10
Example of a Cross-State Truck Freight
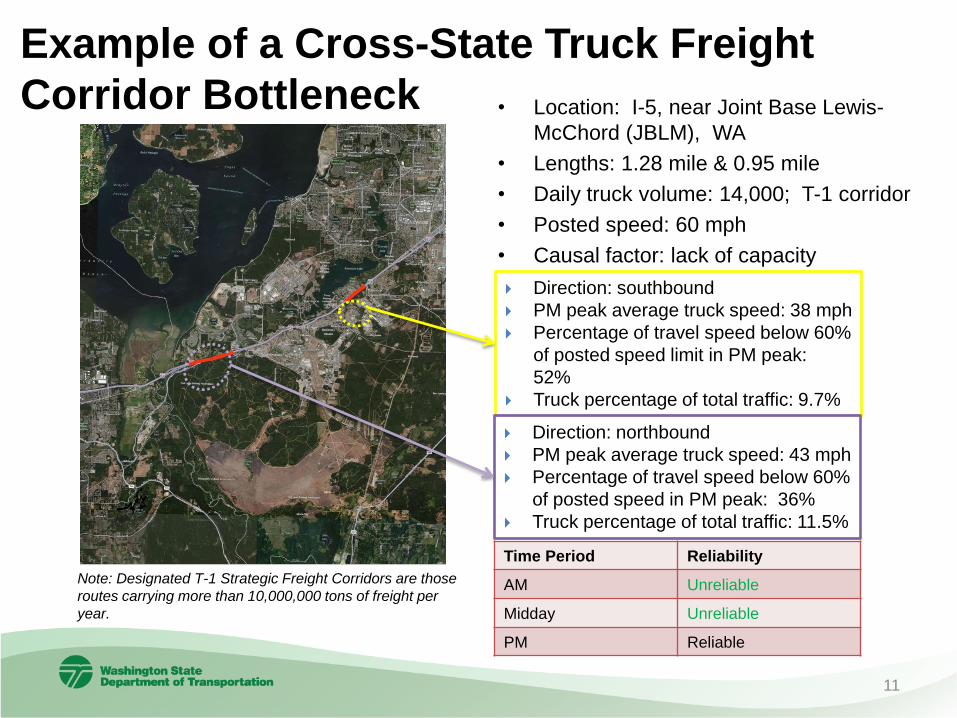
Corridor Bottleneck • Location: I-5, near Joint Base Lewis-
McChord (JBLM), WA
• Lengths: 1.28 mile & 0.95 mile
• Daily truck volume: 14,000; T-1 corridor
• Posted speed: 60 mph
• Causal factor: lack of capacity
Direction: southbound
PM peak average truck speed: 38 mph
Percentage of travel speed below 60%
of posted speed limit in PM peak:
52%
Truck percentage of total traffic: 9.7%
Direction: northbound
PM peak average truck speed: 43 mph
Percentage of travel speed below 60%
of posted speed in PM peak: 36%
Truck percentage of total traffic: 11.5%
Time Period Reliability
AM Unreliable
Midday Unreliable
PM Reliable
Note: Designated T-1 Strategic Freight Corridors are those
routes carrying more than 10,000,000 tons of freight per
year.
11

Example of a Truck Bottleneck on a Congested
Urban Interstate Highway Location: I-5 southbound, NE 50th St to
the Ship Canal, Seattle, WA
Length: 0.89 mile
Daily truck volume: 11,000; T-1corridor
Truck percentage of total traffic: 5.5%
Causal factor: capacity issues
Posted speed: 60 mph
12
Time Period Reliability
AM Unreliable
Midday Unreliable
PM Unreliable
Average truck travel speed: 36 mph
Percentage of travel speed below 60%
of posted speed limit: 51%
Average truck travel speed: 35 mph
Percentage of travel speed below 60%
of posted speed limit: 54%
Average truck travel speed: 39 mph
Percentage of travel speed below 60%
of posted speed limit: 50%
12

Location: SR 99 southbound at E. Marginal
Way, Seattle, WA
Length: 0.33 mile
Daily truck volume: 5,100; T-1 corridor
Truck percentage of total traffic: 7.9%
Average truck travel speed: 25 mph
Posted Speed: 45 mph
Percentage of travel speed below 60% of
posted speed limit: 53%
Causal factors: business access, signalized
and un-signalized intersections within the
segment slow truck flow.
Time Period Reliability
AM Unreliable
Midday Unreliable
PM Unreliable
Example of a Truck Bottleneck on a State
Highway in an Urban Area
13

WSDOT used volume data to identify
the state’s backbone truck freight
corridors, and used the Truck
Performance Measure program to
identify the worst truck bottlenecks on
those corridors.
When essential state connector
routes are incorporated into the
backbone system, WSDOT will be
able to measure full truck corridor
performance.
Central Puget Sound
Area Truck Bottlenecks
in 2010 - 2011
14

15

For more information on the
Washington State Freight Mobility Plan,
please see http://www.wsdot.wa.gov/Freight/freightmobilityplan
or contact:
Barbara Ivanov
Washington State Department of Transportation
Freight Systems Division Director
Questions?
16