The Wage Effects of Offshoring: Evidence from … Wage Effects of Offshoring: Evidence from Danish...
59
NBER WORKING PAPER SERIES THE WAGE EFFECTS OF OFFSHORING: EVIDENCE FROM DANISH MATCHED WORKER-FIRM DATA David Hummels Rasmus Jørgensen Jakob R. Munch Chong Xiang Working Paper 17496 http://www.nber.org/papers/w17496 NATIONAL BUREAU OF ECONOMIC RESEARCH 1050 Massachusetts Avenue Cambridge, MA 02138 October 2011 We thank the Economic Policy Research Network for funding. For helpful comments we thank seminar participants at NBER, Harvard, Princeton, Michigan, UC Davis, UC Santa Cruz, Johns Hopkins, Boston College, Purdue, Clemson, Tennessee, EIIT, Copenhagen, NOITS, Nottingham, IFN Stockholm, Tubingen and EALE. We especially thank Pol Antras, Gene Grossman, Gordon Hanson, Marc Muendler, Nathan Nunn, and Steve Matusz. The views expressed herein are those of the authors and do not necessarily reflect the views of the National Bureau of Economic Research. NBER working papers are circulated for discussion and comment purposes. They have not been peer- reviewed or been subject to the review by the NBER Board of Directors that accompanies official NBER publications. © 2011 by David Hummels, Rasmus Jørgensen, Jakob R. Munch, and Chong Xiang. All rights reserved. Short sections of text, not to exceed two paragraphs, may be quoted without explicit permission provided that full credit, including © notice, is given to the source.
Transcript of The Wage Effects of Offshoring: Evidence from … Wage Effects of Offshoring: Evidence from Danish...
NBER WORKING PAPER SERIES
THE WAGE EFFECTS OF OFFSHORING:EVIDENCE FROM DANISH MATCHED WORKER-FIRM DATA
David HummelsRasmus JørgensenJakob R. Munch
Chong Xiang
Working Paper 17496http://www.nber.org/papers/w17496
NATIONAL BUREAU OF ECONOMIC RESEARCH1050 Massachusetts Avenue
Cambridge, MA 02138October 2011
We thank the Economic Policy Research Network for funding. For helpful comments we thank seminarparticipants at NBER, Harvard, Princeton, Michigan, UC Davis, UC Santa Cruz, Johns Hopkins, BostonCollege, Purdue, Clemson, Tennessee, EIIT, Copenhagen, NOITS, Nottingham, IFN Stockholm, Tubingenand EALE. We especially thank Pol Antras, Gene Grossman, Gordon Hanson, Marc Muendler, NathanNunn, and Steve Matusz. The views expressed herein are those of the authors and do not necessarilyreflect the views of the National Bureau of Economic Research.
NBER working papers are circulated for discussion and comment purposes. They have not been peer-reviewed or been subject to the review by the NBER Board of Directors that accompanies officialNBER publications.
© 2011 by David Hummels, Rasmus Jørgensen, Jakob R. Munch, and Chong Xiang. All rights reserved.Short sections of text, not to exceed two paragraphs, may be quoted without explicit permission providedthat full credit, including © notice, is given to the source.
The Wage Effects of Offshoring: Evidence from Danish Matched Worker-Firm DataDavid Hummels, Rasmus Jørgensen, Jakob R. Munch, and Chong XiangNBER Working Paper No. 17496October 2011JEL No. F16
ABSTRACT
We estimate how offshoring and exporting affect wages by skill type. Our data match the populationof Danish workers to the universe of private-sector Danish firms, whose trade flows are broken downby product and origin and destination countries. Our data reveal new stylized facts about offshoringactivities at the firm level, and allow us to both condition our identification on within-job-spell changesand construct instruments for offshoring and exporting that are time varying and uncorrelated withthe wage setting of the firm. We find that within job spells, (1) offshoring tends to increase the high-skilledwage and decrease the low-skilled wage; (2) exporting tends to increase the wages of all skill types;(3) the net wage effect of trade varies substantially across workers of the same skill type; and (4) conditionalon skill, the wage effect of offshoring exhibits additional variation depending on task characteristics.We then track the outcomes for workers after a job spell and find that those displaced from offshoringfirms suffer greater earnings losses than other displaced workers, and that low-skilled workers suffergreater and more persistent earnings losses than high-skilled workers.
David HummelsKrannert School of Management403 West State StreetPurdue UniversityWest Lafayette, IN 47907-1310and [email protected]
Rasmus JørgensenDepartment of EconomicsUniversity of CopenhagenØster Farimagsgade 5Building 26DK-1353 Copenhagen [email protected]
Jakob R. MunchDepartment of EconomicsUniversity of CopenhagenØster Farimagsgade 5Building 26DK-1353 Copenhagen [email protected]
Chong XiangDepartment of EconomicsPurdue University403 West State StreetWest Lafayette, IN 47907-2506and [email protected]
1
I.Introduction
Akeyfeatureofglobaltradeinthenewcenturyistherapidgrowthofoffshoring(Feenstra
andHanson2003,Feenstra2010)andtradeinintermediategoods(Hummels,etal.2001).Howhas
offshoringaffectedworkers’wagesandemploymentopportunities?Theanswertothisquestionis
nottheoreticallyobvious.Atsomelevelpurchasinganinputfromaforeignsourcemustreplacea
taskpreviouslydonebyadomesticworker,whichwouldsuggestdisplacementand lowerwages
(FeenstraandHanson1996,1997).However theability touse foreign inputsmay lowera firm’s
costs and raise its productivity, allowing it to expand output and employment and raise wages
(GrossmanandRossi‐Hansberg2007,2008).1Noristhecausalityeasytosortoutempirically.The
literatureonheterogeneousfirms(e.g.BernardandJensen1999,Melitz2003)suggeststhathigh
productivityfirmsaremorelikelytopayhigherwages,exportmoreandbuymoreimportedinputs.
In thispaperweemploymatchedworker‐firmdata fromDenmark that is linked to firm‐
leveldataonimportsandexports.Ourworker‐firmdatacovertheuniverseofprivate‐sectorDanish
firmsandthepopulationoftheDanishlaborforceduring1995‐2006,2allowingustoconsistently
trackvirtuallyeveryperson in theDanisheconomyover time, regardlessofhis/heremployment
statusoremployeridentity.Muchoftheliteraturehasfocusedonhowoffshoringaffectswagesat
the industry level, orhow it affects the averagewagebill of a firm. Our data allowus to assess
whetherachangeintheextentofoffshoringaffectswagesofaspecificworkerwithinagivenjob‐
spell(i.e.duringthatworker’stenurewithaspecificfirm),andhowthesewagechangesdependon
theworker’scharacteristics,includingeducationandoccupation.Wealsoassessthewageeffectsof
exporting;evenifwagesaredampenedbyoffshoringtheymaystillrisewithtradeifexportsboost
labordemand.Further,sinceweseespecificworkersbefore,during,andaftertheiremploymentin
specificfirmswecanalsoassesstheeffectsofoffshoringonthewagesofdisplacedworkers.
1 See also Amiti and Konings (2007), Kasahara and Rodrigue (2008), Goldberg et al. (2010) and Bustos (2011). 2Thisworker‐firmdatasethasbeenusedpreviouslyinthelaborliterature(e.g.Christensenetal2005.),buthasnotusedthelinktodetailedtradedatafromDanishcustomsthatweemploy.
2
Ourtradedataincludedetailedinformationontheinputseachfirmimports(byHS‐6digit
product and source country) and on firm sales (by HS‐6 digit product and destination). In this
period, the aggregate value of imports and exports by Danishmanufacturing firms doubled, but
thereissubstantialvariationacrossfirmsinboththeleveloftradeandchangesintradeovertime.
Firmsconcentratetheirimportpurchasesandexportsalesinanarrowbutstablesetofgoodsthat
arelargelyuniquetoeachfirm.Forexample,92percentofimportpurchasesbythetypicalfirmare
concentratedinjust5inputs,andthetypicalinputispurchasedbyasingleDanishfirm.Exporting
behaviorshowssimilarpatterns.
Thesefindingssuggestaninput‐outputstructurethatishighlyspecifictoindividualfirms,
anditallowsustosolveasignificantidentificationprobleminrelatingwagechangetooffshoringat
the firm level. The literature on heterogeneous firms shows that high productivity firms are
systematically different from other firms: larger, more capital‐intensive, and critically for this
paper,morelikelytopayhigherwagesandbothexportmoreandbuymoreimportedinputs. To
correctforsimultaneitybiasinestimatingtheimpactoftradeonwages,weneedinstrumentsthat
arecorrelatedwithafirm’sdecisiontoincreaseoffshoringand/orexporting,butarenotcorrelated
withthefirm’sabilityorwagesetting.
WeuseshockstoDenmark’stradingenvironmentthataretimevaryingandspecifictoeach
partner countryxproductbeing traded. These includeexchange rates, transportationcosts, and
world‐wideshockstoexportsupplyandimportdemandfortherelevantpartnercountryxproduct.
While these shocks are exogenous to Danish firms, their impact varies markedly across firms
preciselybecausethefirmshavefewornoinputsincommon.Thatis,ifonlyoneDanishfirmbuys
titaniumhingesfromJapan,shockstothesupplyortransportcostsofthosehingesaffectsjustthat
one firm. Finally, the stability of sourcing patterns over time allows us to use pre‐sample
informationabouttheinputspurchasedandproductsexportedwhenconstructingourinstruments.
3
As a consequence, our estimates are unaffected by contemporaneous shocks to technology that
affectboththetypesofinputsusedandwagesetting.
We begin by examining how exogenous shocks to trade are correlated with firm‐level
variables. Offshoring and exporting are positively correlated with firm sales, profits and the
averagewagebill.Exportingispositivelycorrelatedwithemployment,butoffshoringisassociated
with contractions in employment, primarily through a reduction in low skill workers. These
correlationpatternsareconsistentwiththepatternofwagechangeswithinjobspells.Wefindthat
for low‐skilledworkers, thewageelasticityofoffshoring is–1.6%to–1.9%. Importantly,we find
theseresultsonlyifweinstrumentforoffshoring.Forhigh‐skilledworkers,offshoringhasawage
elasticity of +3.1% to +3.6% within job spells. These results suggest that offshoring tends to
increase the skill premium within firms, which complements findings on offshoring and skill
premiumat the industry level (e.g.FeenstraandHanson1997,1999).3Ontheexportingside,we
find a low‐skilledwage elasticity of +3.7% to+4.4%, and similar estimates forhigh‐skilledwage
elasticity.Theseresultssuggestthatrisingexportsarearisingtidethatliftsallboats.
Sinceweestimatewageelasticitiesforbothoffshoringandexporting,wecancharacterize
thenetwageeffectsoftrade(withinjobspells).Theseeffectsvaryacrossworkersofthesameskill
type,dependingonhowtheiremployerschangetheirexposuretotrade.Forexample,wefindthat
roughly half of low‐skilled workers have positive net wage changes, despite the negative wage
elasticityestimateforoffshoring.Theseresultscomplementrecenttheoreticalandempiricalwork
thatemphasizesincreasedwithin‐groupinequalityfollowingtradeliberalization(e.g.Goldbergand
Pavcnik2007,Helpmanetal.2010).
Wethenconsidertwoextensionsofourestimationframework.First,weassesshowwage
effects differ by task characteristics, conditional on skill type. We find that workers whose
occupations involve routine tasks (as in Autor, et al. 2003) and those that expose workers to
3 This literature typically examines the effects on the relative high-skilled wage (or relative high-skilled demand). We show the effects on the levels of both low-skilled and high-skilled wages.
4
potentially unsafeworking conditions experience largerwagedropswithoffshoring. In contrast,
the occupations that intensively employ knowledge sets from mathematics, social science and
languagessystematicallygainfromoffshoringshocks,whilethosethatemployknowledgesetsfrom
naturalsciencesandengineeringdonot.Ourresultscomplementrecentstudiesonwagesandtask
characteristics.Forexample,Ebensteinetal.(2009)findthatwagelossesfromoffshoringaremore
pronouncedfortheworkerswhoperformroutinetasks.Ottavianoetal.(2010)findthatoffshoring
pushesnativeU.S.workerstowardsmorecommunication‐intensivetasksandimmigrantworkers
awayfromthem.Relativetothesestudies,wefocusonfirmratherthanindustry‐levelchanges,look
atwagechangeswithinjob‐spellsandaddressendogeneityofbothoffshoringandexportingatthe
firmlevel.
Ina final exerciseweexamine theeffectof offshoringondisplacedworkers, employinga
frameworksimilartoJacobsonetal.(1993). Wefindthat(mass‐layoff)displacementfromafirm
with risingoffshoringgenerates larger andmorepersistentwageandearnings losses than those
sufferedbyotherdisplacedworkers.Oneyearfromdisplacement,skilledworkersdisplacedfrom
offshoringfirmslose15%oftheirpre‐displacementearnings(versus7%forotherdisplacedskilled
workers)whileunskilledworkers lose21%(versus15% forotherdisplacedunskilledworkers).
Workersdisplacedfromoffshoringfirmshavehigherratesofunemploymentandarelesslikelyto
re‐attachtofirmswithinthesameindustry.
Ourpaperisrelatedtotheliteratureonoffshoringandwages(FeenstraandHanson1997,
1999) .FeenstraandHanson(2003)surveyearlierempiricalwork,mostofwhichuses industry‐
level data; e.g. Hsieh and Woo (2005) examine how offshoring affects the relative high‐skilled
demand forHong Kong. Harrison,McLaren andMcMillan (2010) survey recent empiricalwork,
mostofwhichusesfirm‐levelormatchedworker‐firmdata.Forexample,AmitiandDavis(2011)
studyhowimportsofintermediatesaffectaveragewagesatthefirmlevel.MartinsandOpromolla
(2009)usePortuguesedata toestimate thewageeffectsofboth importsandexports,controlling
5
for job‐spell fixed effects. Krishna et al (2011) use Brazilian data to compare effects of trade
reformsonwithin job‐spellwages for tradingandnon‐trading firms. In recent theoreticalwork,
BursteinandVogel(2011)arguethatoffshoringbetweenidenticalcountriescouldincreasetheskill
premium.
Our paper is also related to the literature on exporting and skill premium. For example,
Bernard and Jensen (1997), Schank et al. (2007), and Munch and Skaksen (2008) compare the
wagesorskillcompositionofexportingandnon‐exportingfirms.Verhoogen(2008)andFrias,etal.
(2009)showthatMexicanfirmsimproveproductqualityinordertoexport,raisingthedemandfor
skilledlaborandtheskillpremium. Wecomplementbothbodiesofworkbyemployingmatched
worker‐firmdatawithworkerandfirmcharacteristicsincludingdetailedtradedata.Thisallowsus
to instrument for tradeshocks, toseparatewagechanges for individualworkers fromchanges in
thecompositionoftheworkforcewithinafirmorindustry,toanalyzethedistributionofchanges
within a skill type, and to analyze wage changes within‐job spell versus wage changes due to
displacement. More broadly, our paper fits into the literature on globalization and income
inequality(assurveyedbyGoldbergandPavcnik2007).Ourfindingsarebutonechannelthrough
whichglobalizationaffectsincomeinequality.4
Inwhat follows,sectionIIdescribesourdataandpresentsstylizedfactsaboutoffshoring.
SectionIIIprovidesasimplemodeltoguideourempiricalwork,discussesourspecificationandour
instruments for offshoring and exporting at the firm level. Section IV looks at changes in firm
outcomevariables.SectionVestimateswithinjob‐spellwageeffectsbyskilltypeandpresentsthe
netwageeffectsoftrade.SectionVIanalyzeshowoffshoringeffectsvaryacrosstaskcharacteristics
and section VI analyzes the wage effects for the workers displaced by mass lay‐offs. Section VI
concludes.
4 For example, we do not focus on how globalization affects employment or resource reallocation, the subject of a number of recent studies using matched worker-firm data (e.g. Menezes‐FilhoandMuendler2011).
6
II.DataDescription
In this section we explain the main features of the Danish labor market and the main
sourcesofourdata.Wealsodiscussthenewstylizedfactsaboutoffshoringthatourdatareveal.
II.1.TheDanishLaborMarket
Denmark is a good candidate country for studying the effect of labor demand shocks on
wages. Botero et al. (2004) systematically examine labormarket regulations inmany countries.
TheyclassifyDenmarkashavingoneofthemostflexiblelabormarketsintheworld,comparableto
theUS.UnlikemanycontinentalEuropeancountries,employmentprotectionisweakinDenmark,
andDanish firmsmayadjustemploymentwith relativeease.This labormarketmodelhas led to
turnoverratesandanaveragetenurewhichareinlinewiththoseoftheAnglo‐Saxoncountries.In
1995theaveragetenureinDenmarkwasthelowestincontinentalEuropeat7.9years,similarto
the level in UK (7.8 years) and lower than Germany (9.7 years). As compensation for high job
turnoverworkersreceiverelativelygenerousunemploymentbenefits,butincentivestosearchfor
jobs during unemployment are reinforced through monitoring and sanction. Together these
ingredientsformwhathasbeencalledthe'flexicurity'model.
TheflexibilityoftheDanishlabormarketmayseemsurprisingasoverthreequartersofall
workers are union members. Decades ago the private labor market was dominated by the
Standard‐Rate system of bargainingwhich setwages at the industry level. However, the Danish
labormarkethasundergoneaprocessofdecentralizationsothatbythestartofoursamplein1995,
only16%oftheprivatelabormarketwasstillcoveredbytheStandard‐RateSystem.Themajority
of wage contracts are now negotiated at the worker‐firm level.5 Decentralization has increased
wagedispersion in theDanish labormarket(Dahletal.2009), implying thatwagesbetterreflect
workerandfirmcharacteristics,suchasindividualworkers’marginalproductivity.Between1980
5 Some wage contracts are negotiated exclusively between workers and firms. This type of contractrepresents30%ofthelabormarketin2005,upfrom5%inthelate1980s.Inothercasesaminimumwageisset at the industry level and supplemented by personal payments negotiated betweenworkers and firms.Thistypeofcontractrepresents54%ofthelabormarketin2010,downfrom74%in1995.
7
and2000, the90/10wageratio inDenmark increased from2.1 to2.35,suggestingamildrise in
wage inequality.While thewage structure is stillmore compressed inDenmark than in theU.S.,
wageformationinDenmarkhasbecomesignificantlymoreflexible.
II.2.DataSources
Ourdata on firms,workers and trade aredrawn from several administrative registers in
Statistics Denmark. Our firm data comes from the Firm Statistics Register, or FirmStat, which
covers the universe of private sector Danish firms for the years 1995‐2006. FirmStat associates
eachfirmwithauniqueidentifier,6andprovidesannualdataonmanyofthefirm’sactivities,such
as number of full‐time employees and industry affiliation (six digit NACE code).We supplement
FirmStatwithadditionaldatafromotherfirmregisters(seetheDataAppendixformoredetails).
Ourworkerdata isextractedfromtheIntegratedDatabaseforLaborMarketResearch,or
IDA,which covers the entireDanishpopulation aged15‐74 including theunemployed and those
who do not participate in the labor force. The IDA associates each person with his/her unique
identifier, and provides annual data on many of the individual’s socio‐economic characteristics,
suchashourlywage,education,andoccupation. IDAalsorecords labormarketstatus(employed,
unemployedor out of the labor force) inweek48 each year.We focuson full‐timeworkers.We
measure the hourly wage rate as annual labor income plus mandatory pension fund payments
dividedbyannual hours.7We classify aworker ashigh‐skilled if he/shehas a tertiaryeducation
correspondingtothetwohighestcategories(5and6)intheInternationalStandardClassificationof
Education(ISCED).Weclassifyalltheotherworkersaslow‐skilled.8
6Thefirmidentifier is inFirmStatderivedfromtheregister“OldFirmStatistics”fortheperiod1995‐1999andfrom“GeneralFirmStatistics”fortheperiod1999‐2006.Thesetworegistersincombinationallowustotrackthesamefirmduringtheentireperiod1995‐2006despitethestructuralbreakin1999. 7Theuseofannualhoursiscommonintheliterature(e.g.Christensenetal.2005).Aconcernisthatannualhoursdonotcaptureovertimework.Foraportionofoursamplein2006wehavedataforovertimework.Awagerate includingovertime is correlated0.86withourmainwage‐ratevariable, andovertimehoursareuncorrelatedwithoffshoring(0.015forthefullsampleand‐0.017forthesubsampleofhigh‐skilledworkers).Thissuggeststhatourresultsareunlikelytobedrivenbytheissueofovertimework.8We experimented with breaking low‐skilled workers into two subgroups, medium‐skilled (those with avocationaleducation,definedasthefinalstageofsecondaryeducationthatpreparesstudentsforentryinto
8
TomatchourfirmdatawithourworkerdatawedrawontheFirm‐IntegratedDatabasefor
LaborMarketResearch,orFIDA,whichlinkseveryfirminFirmStatwitheveryworkerinIDAwho
isemployedbythatfirminweek48ofeachyear,includingtemporaryworkers.Usingourmatched
worker‐firmdata,wecanconsistentlytrackvirtuallyeverypersonintheDanisheconomyovertime
regardless of his/her employment status or employer identity. This allows us to condition our
identificationonthechangeswithinagivenworker‐firmmatch(i.e.wecontrol for job‐spell fixed
effects),andtotracktheeffectsofoffshoringontheearningsofdisplacedworkersovertime.The
high quality of the match results from two features of the data. One, the IDA and FIDA are
administrative data and the worker identifier used there remains unchanged throughout 1995‐
2006. Two, the informal sector is almost non‐existent in Denmark, unlike in some developing
countries such as Brazil and Mexico that have been previously used in matched worker‐firm
studies.
Our tradedata comes from theDanishForeignTradeStatisticsRegister. For each firm in
each year 1990‐2006 we have imports disaggregated by origin and product and exports
disaggregated by destination and product. The Trade Statistics Register uses the same firm
identifierasFirmStatandFIDA,allowingustomatchproduct‐leveltradedatawithourworker‐firm
data on an annual basis. Trade flows are recorded according to the eight‐digit Combined
Nomenclature, but we aggregate these flows to the roughly 5000 products in the six‐digit
Harmonized System (HS) to be compatible with the COMTRADE data used to construct our
instruments.ForeachtradeflowweobserveitsvalueinDanishKroner(DKK)andweightinkilos.
The Foreign Trade Statistics Register consists of two sub‐systems, Extrastat (tradewith non‐EU
countries)andIntrastat(tradewithEUcountries).Extrastathasclose‐to‐completecoverageasall
extra‐EU trade flows are recorded by customs authorities. Intrastat does not have complete
coveragebecausefirmsareonlyobligedtoreportintra‐EUtradeiftheannualtradevalueexceedsa
the labor market) and very‐low‐skilled (those with the equivalent of high school education or less). Weobtainedverysimilarresults.
9
threshold.9Comparedwiththeofficialimportstatistics,ourdataaccountfor90‐95%ofallimports
ineveryyear.
Aftermergingdataonmanufacturingworkers, firms,andtradeflows,wehave2.8million
worker‐firm‐yearobservations.Wethentrimoursampleasfollows.Sincewehaveannualdatawe
cannot investigate the changes in wage or employment status at weekly, monthly or quarterly
frequencies. Thus we drop all the worker‐firm‐year observations of which the employment
relationship,orjobspell,lastsforasingleyear(about200,000observations).Wealsodropallthe
workerswhoseskilllevelchangesinoursampleperiod(about35,000observations),inordertoget
a clean identification of how the effects of offshoring vary across skill groups.Wenext drop the
firmswithfewerthan50employeesandlessthan0.6millionDKKinimports,whichcorrespondsto
average annual wages for two manufacturing workers. This eliminates another 600,000
observations.Thisdeminimisrestrictioneliminatesfromoursampleverysmallfirmswhoinsome
caseshaveimputedbalancesheetvariablesandaremorelikelytobemissingintra‐EUtradedata.
Allotherfirmsareinthesampleintheyearsinwhichtheybothimportandexport.Ifafirm
beginstradingsometimewithinoursampleyearswetreatitsfirstyearoftradingasthepre‐sample
andfocusourestimationonsubsequentchangesinimportingandexportingbehavior.Inthisway
wefocusonwithin‐firmchangesintheintensityoftraderatherthanondiscretechangesfromzero
topositiveforeignpurchases.10
Ourfinalsamplehasabout1.95millionworker‐firm‐yearand9,800firm‐yearobservations.
Thisrepresentsbetween50%‐70%ofallmanufacturingemploymentinDenmark,dependingon
theyear,androughly20%ofallprivatesectoremployment.Table1containssummarystatistics
ofthedata.
II.3.StylizedFactsaboutImports,Exports,andOffshoring
9In2002thethresholdswereDKK2.5millionforexportsandDKK1.5millionforimports. 10Firmsthatdiscretelychangetheirtradestatustendtobesmallwithsmallinitialyeartradevolumes.
10
Webeginbyclarifyinghowwedefineoffshoringandthenprovideaseriesofstylizedfacts
abouttheforeigntradeactivitiesofDanishfirms.Innationaltradestatistics,importsincludeboth
intermediateinputsforproductionandfinalgoodsforconsumption.Weareprimarilyinterestedin
theextenttowhichfirmsareengagedinoffshoringandtheimpactthishasonworkersemployed
bythefirm.Thisraisesthequestionofwhetherthefirm‐levelimportsweobservearefinalgoodsor
inputs intoproduction,andalsowhether these inputsarepotentiallysubstitutes for laborwithin
thefirms.Weaddressthesequestionsbydistinguishingmanufacturingfromservicesfirmsandby
distinguishingnarrowversusbroadmeasuresofoffshoringinlinewiththeliterature.
Ourdatasample focusesonmanufacturing firms,11butallDanishfirms includingthose in
service industries are required to report trade activity. The manufacturing firms in our sample
account for 21% of total Danish imports and they supply 50% of Danish exports, with non‐
manufacturingfirmscomprisingtheremainder.Toillustratethedifferencebetweentheimportsof
manufacturingandnon‐manufacturingfirms,wedrawonavariablemeasuringthevalueofinputs
thatarepurchasedandthensoldbythefirmwithnovalueadded.Wecalculatetheshareofthese
purchases in total inputs and call it the “retail share”. For themanufacturing firms themedian
retailshareis2.9%,whereasfortheservicefirmsthemedianretailshareis35.5%(or86.4%ifwe
exclude thoseservice firmswhodonotreport inputs in thiscategory).12Wehavealsodonespot
checksofparticularmanufacturingfirms,andconfirmedthattheimportproductcategoriesmake
senseaslikelyinputpurchasesgiventhegoodstheyaremaking.13Thisgivesusconfidencethatthe
manufacturingv. service industrydistinction isuseful for identifying importsusedasproduction
inputs by Danish firms, rather than imports purchased for direct consumption by Danish
11We base this distinction on the industry classification of the firms, and drop firmswhose classificationswitchesbetweenmanufacturingandserviceindustries.12Theservicefirmswhoreportnoinputsinthiscategorylikelycorrespondtofirmsthatsellnogoodsatall.Theretailsharevariableisavailableonlyfrom2003onwardssowecannotuseitasanadditionalcontrolinourmanufacturingfirmpanel.13 For example, we examined import purchases by the largest five firms selling in HS 9021 “Orthopedicappliances, artificial body parts, and hearing aids.” The largest single input, representing one third ofimports,wasHS8518“Microphones,loudspeakerandsoundamplifiers”.
11
consumers.Wedefine“broadoffshoring”tobethetotalvalueofimportsbyagivenmanufacturing
firminagivenyear.
Asecondconcernisthatmanufacturingfirmsarepurchasingforeigngoodsbuttheseinputs
donotsubstituteforlaborwithinthefirm.Thiscouldincluderawmaterials,whichrepresent7.8%
of manufacturing firms’ imports14, or manufactured inputs that the firm would be unlikely to
produce itself because the input is too far from the firm’s area of specialization. Feenstra and
Hanson(1999)define“narrowoffshoring”aspurchasesofinputsbelongingtothesameindustryas
thatofproducingfirms.Thatis,importsofcomputermicrochipsbytheelectronicsindustrywould
beclassifiedasnarrowoffshoring,butthosesameimportsbytheautomobileindustrywouldnot.
Theideaisthattheclosertheinputsaretothefinaloutputs,themorelikelyitisthatlaborwithin
thefirmcouldhaveproducedthoseinputs.Wefollowthisdefinition,butappliedmorespecifically
totheinputsandoutputs(bothdomesticsalesandexports)of individualfirms.Wepresentmore
evidencethatimports,measuredasnarrowoffshoring,arelikelytosubstituteforfirms’ownlabor
inTable3andsectionIV.
Table2showsthatroughly71%ofimportsarewithinthesameHS4categoryasthatfirm’s
outputs,and87%ofall importsareinthesameHS2category.Wedefinenarrowoffshoringtobe
thesumof imports in thesameHS4categoryasgoodssoldby the firmeitherdomesticallyor in
exports.(Anarrow‐offshoringmeasurebasedonmatchingattheHS2levelyieldssimilarresultsin
ourregressions). Importsof rawmaterialsare thencounted inbroadoffshoring,butareomitted
fromnarrowoffshoring.
Importsofmachineryarealsopotentiallyproblematicintermsofinterpretation.Accessto
foreign technology embodied in machinery imports may affect labor demand and wages (e.g.
HansonandHarrison1999)butthroughadifferentchannelthanoffshoringofmaterialinputsthat
couldhavebeenproducedbythefirm.Whilewedonottakeastrongstandthatwecancompletely
14WedefinerawmaterialsasimportsinHScategories01‐15,25‐27,31and41.
12
separate the effects of offshoring material inputs versus technological change embodied in
machinery imports, we do want to distinguish where such effects are likely to appear in our
analysis.
The HS system classifies most types of machinery in HS84, “Nuclear reactors, boilers,
machinery etc…”, and HS85, “Electric machinery etc; sound equipment; TV equipment …”. Our
broadoffshoringmeasures include importsofHS84andHS85 forall firms, and this represents
16.9%ofimports.Ournarrowoffshoringmeasureexcludesmachineryimportsforallfirmsexcept
forthosewhoalsoproducemachineryforsale.Forfirmsthatproducemachineryforsale,narrow
offshoring could potentially includemachinery imports. The question for these firms iswhether
importswithinHS84,85representmachineryitselforpartsformachinery.15
Atmoredisaggregated levelsofdata it ispossible todistinguishmachinery frompartsof
machinery.Lookingoverallfirmsandimportswerankedthevalueshareforeachsixdigitproduct
withinHS84.TableA1liststhetop20products,comprising59%oftheimportsofHS84.Allare
parts,andnotmachineryitself.ThelargestHS6importthatisclearlyamachineandnotpartsofa
machineisHS842240,“Packingorwrappingmachinery…”Itranks34thonthelistanditssharein
importsis0.007%.TheresultsaresimilarforHS85.Therefore,eveninthoseHScategorieswhere
machineryimportsareconcentrated,actualmachineryaccountsforasmallshareoftotalimports.
Wecannowcharacterizethetradingactivitiesoffirmsinoursample.Figures1aand1bplot
thetotalvalueandregionalcompositionofimports(broadoffshoring)andexportsfrom1996‐2006
by firms in our sample. In this period, both imports and exports more than doubled. European
partnersdominateDanishtrade,providing85%ofimports(andbuying75%ofexports)incontrast
to6%ofimports(and9%ofexports)fromNorthAmerica.Theregionalpatternoftradehasbeen
largelystableoverthisperiod.Asiaasasourceofimportshasgrowninsignificance(itssharegoing
15 As an example, consider the five largest firms selling inHS 8413, “Pumps for liquids…”. The top threeimportcategoriesareHS8413itself,whichcouldbemachinery,andHS8483,“Transmissionshafts,bearings,gears…”,andHS8481,“Taps,cocks,valves…”whichareclearlyparts. Wefoundsimilarresults forthetopfivefirmsinHS8481andHS8482,“Ballorrollerbearings…”.
13
from5%to8.5%)butremainsasmallportionofthetotal.Narrowoffshoring(notpictured)grew
slightlyfasterthanbroadoffshoring,andhadasimilarregionalcomposition.
Table1reportstheimportanceoftradeatthefirmlevel.Narrowoffshoringrepresents12%
ofgrossoutputand27%oftotal(importedplusdomestic)materialpurchasesfortheaveragefirm.
Broad offshoring represents 19% of gross output, and 43% of total material purchases for the
averagefirm.Exportsare45percentofgrossoutputfortheaveragefirm.Thestandarddeviations
indicatethatthesevaluesallvarysignificantlyacrossfirm‐yearsinoursample.
Ourdataexhibitsubstantialtimeseriesvariationintradeforagivenfirm.Toshowthiswe
calculatethedeviationoflog(exports)byfirmjinyeartfromitssampleperiodmeanforfirmj,and
similarly for broad and narrow offshoring. Table 1 shows that offshoring and exports vary
substantially within firms over time, with log deviations from the firm mean of .49 (broad
offshoring),.82(narrowoffshoring)and.46(exports).Theextentofchangesovertimealsovaries
widelyacrossfirms.InFigures2aand2bwedisplaythedistributionofwithin‐firmchangesinlog
(narrowoffshoring)andlog(exports).Themeansofthedistributionsarezerobyconstruction,but
showwidevariation.Fornarrowoffshoring,55percentofthefirm‐yearobservationsareeither30
percent above or 30percent below the firmmean. The rich variation inwithin‐firm changes for
bothoffshoringandexportswillbekeytoidentifyingtheireffectsonwages.
In the literature it is common to use industry level input‐output tables to provide
informationon the typesof inputsa firm is likely to import.Thisapproach implies thatall firms
withinanindustryemploythesamemixofinputs(andattypicallevelsofaggregation,firmsfrom
everyindustrybuynearlyeveryinput,albeit indifferentquantities). Incontrast,ourdatareveals
verydifferentinformationabouttheinput‐outputstructureatthefirmlevel.Wedistinguishinput
bothbyexportingsourceandHS‐6digitproductcode.Thefirmsinoursamplebuymanyforeign
inputs,withthemedianfirmreportingpurchasesin20distinctexporter‐HS6categories.However,
thesepurchasesareconcentratedinjustafewkeyinputs.Table2revealsthatthetop2exporter‐
14
HS6 categories comprise 67% of imports for the median firm, and the top 5 exporter‐HS6
categories account for 92% ofmedian firm imports. The pattern is similar for exports,with the
median firm reporting 19 distinct importer‐HS6 export categories, with 59% of exports coming
fromthetop2categoriesand77%fromthetop5categories.
Further,Danishfirmshaverelativelyfewinputsandrelativelyfewoutputsincommon.Ina
typicalyearwehaveroughly2000firms importing13,500distinctorigin‐HS6inputs.Foreachof
theseinputswecalculatethenumberofDanishmanufacturersthatimportthatinputanddisplay
thedistributioninFigure3a.Forthemedianproduct,just1firmoutof2000buystheinput,whilea
productinthe90thpercentilehas3purchasers.Figure3bprovidesthedistributionofthenumber
offirmswhoexportthesameproducttothesamedestinationcountry.Again,themedianis1firm,
andthe90thpercentileis3sellers.Thishighlyspecificinput‐outputstructureimpliesthatagiven
shocktoforeignbuyersandsellerswillhavemarkedlydifferentimpactsacrossDanishfirms.This
featureofourdataallowsustoconstructinstrumentvariablesforoffshoringandexports,andwe
revisitthispointinsectionIV.
III.Framework,Specification,andInstruments
Theliteraturehasidentifiedmanychannelsthroughwhichimportingandexportingcould
potentiallyaffecttheactivitiesofthefirm.Ratherthanfocusingononespecificchannel,weoutline
a production function framework to help us to interpret how changes in import use and export
sales affect labor demand and wages. We then describe the resulting specification, and our
instrumentalvariablesapproachtoestimation.
III.1.Framework
Letjindexfirmsandtindexyears.Theproductionfunctionforfirmjinyeartis
(1) 1/1 1, where , and jt jt jt jt jt jt jt jtY A K H C C L M
.
15
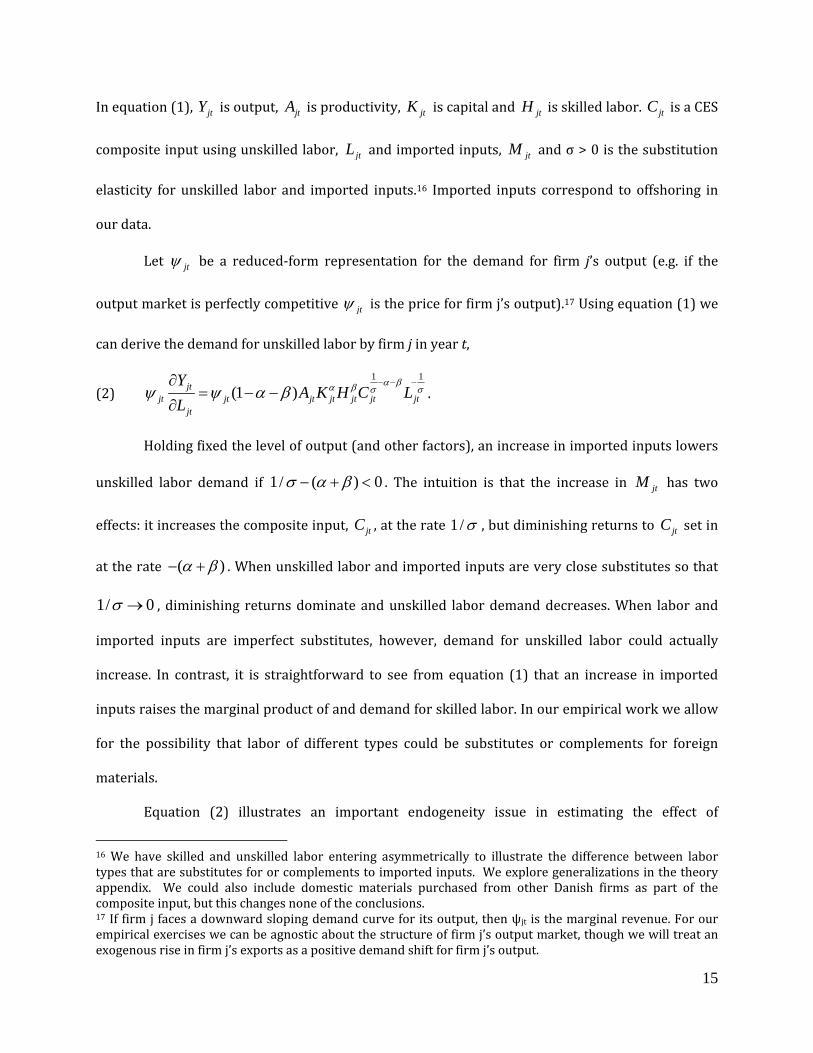
Inequation(1), jtY isoutput, jtA isproductivity, jtK iscapitaland jtH isskilledlabor. jtC isaCES
compositeinputusingunskilledlabor, jtL andimportedinputs, jtM andσ>0isthesubstitution
elasticity for unskilled labor and imported inputs.16 Imported inputs correspond to offshoring in
ourdata.
Let jt be a reduced‐form representation for the demand for firm j’s output (e.g. if the
outputmarketisperfectlycompetitive jt isthepriceforfirmj’soutput).17Usingequation(1)we
canderivethedemandforunskilledlaborbyfirmjinyeart,
(2)1 1
(1 )jtjt jt jt jt jt jt jt
jt
YA K H C L
L
.
Holdingfixedthelevelofoutput(andotherfactors),anincreaseinimportedinputslowers
unskilled labor demand if 1/ ( ) 0 . The intuition is that the increase in jtM has two
effects:itincreasesthecompositeinput, jtC ,attherate1/ ,butdiminishingreturnsto jtC setin
attherate ( ) .Whenunskilledlaborandimportedinputsareveryclosesubstitutessothat
1/ 0 , diminishing returnsdominateandunskilled labordemanddecreases.When laborand
imported inputs are imperfect substitutes, however, demand for unskilled labor could actually
increase. In contrast, it is straightforward to see from equation (1) that an increase in imported
inputsraisesthemarginalproductofanddemandforskilledlabor.Inourempiricalworkweallow
for the possibility that labor of different types could be substitutes or complements for foreign
materials.
Equation (2) illustrates an important endogeneity issue in estimating the effect of
16We have skilled and unskilled labor entering asymmetrically to illustrate the difference between labortypesthataresubstitutesfororcomplementstoimportedinputs.Weexploregeneralizationsinthetheoryappendix. We could also include domestic materials purchased from other Danish firms as part of thecompositeinput,butthischangesnoneoftheconclusions.17Iffirmjfacesadownwardslopingdemandcurveforitsoutput,thenψjt isthemarginalrevenue.Forourempiricalexerciseswecanbeagnosticaboutthestructureoffirmj’soutputmarket,thoughwewilltreatanexogenousriseinfirmj’sexportsasapositivedemandshiftforfirmj’soutput.
16
offshoring on labor demand. Suppose 1/ ( ) so that for a given level of output a rise in
offshoringreducesdemandforunskilledlabor.Anincreaseineitherfirmproductivity jtA oroutput
demand jt will raise the demand for unskilled labor, but it will also raise the demand for
imported inputs. Variation in productivity and output demand across firms orwithin firms over
timewillinduceapositivecorrelationinthedatabetweenimportedmaterialsandunskilledlabor
demand.Weaddressthisproblembyusinginstrumentstoidentifyexogenousshiftsinoffshoring,
andbyusinginstrumentedshockstoexportstocapturemovementsin jt .
A related problem emphasized in the trade literature is that offshoring may have a
secondary effect on labor demand. Suppose that offshoring raises productivity or lowers
production costs. The firm will respond by increasing output and inputs of all types, including
unskilled labor. Depending on themagnitudes of response, the productivity effect may partially
offset or even reverse the negative effect of offshoring on unskilled labor demand.We can then
thinkofthedirecteffectofoffshoringonlabordemandasamovealongagivenisoquant,andthe
indirector “productivity”effectofoffshoringasamove toahigher isoquant.Wewilldistinguish
theseeffects inourempiricsbyholdingoutputandcapital fixedto isolate thedirecteffect,while
allowing output and capital to change in response to offshoring to capture the additional
productivityeffect.18
Our empiricalwork focuses onwages.We assume that the firm faces an unskilled labor
supply curve with elasticity Ls and similarly for skilled labor, Hs . If labor supply is perfectly
elastic, Ls , then shocks to labor demandwill result in employment changes but notwage
responses. If labor supply curves slope upward,19 then the wage response to an offshoring or
18WearegratefultoGeneGrossmanforpointingoutthisdistinction.19 The Journal of Labor Economics devoted the April 2010 issue to upward-sloping firm-level labor supply curves.
17
exportingshockwillhavethesamesignasthelabordemandresponse.Forexample,theresponse
ofunskilledwagestooffshoring(holdingoutputconstant)is
, 0 ,, constant
, ,
ln (1/ )| ,
lnL jt L S
L M Kjt L S L D
w cb
M
where 0 (0,1)c is a constant and , 0L D is the elasticity of labor demand. , 0L Mb if
1/ ( ) whichisthesameconditionunderwhichoffshoringlowerslabordemand.Asimilar
demonstrationshowsthatoffshoringraisesskilledlaborwagesandexportingraiseswagesforboth
skilledandunskilledworkers.
III.2.Specification
Ourwagedataarespecifictoeachworker‐firm‐year.Totranslatethehomogeneousinput
frameworkusedabovetoourdata,weassumethateachunskilledworkerihasproductivity ijth in
year t and 1exp( )ijt it ijh x , where itx represents observable worker characteristics (e.g.
experience), 1 isavectorofcoefficients,and ij representsunobservableabilitythatisspecificto
theworker‐firmmatch.Unskilledworkersarethesameuptotheproductivityterm,sothatworker
i receiveswage , ,L ijt L it ijtw w h . Similar expressionsgovernhigh skill laborwages.Usingequation
(2)andassumingfinitelaborsupplyelasticitieswehave
(3), 1 , 1ln ln ln ln ln
+ ln .
ijt L M jt M i jt L X jt X it jt
it K jt h jt jt ij ijt
w b M b S M b b S
x b K b H A
In equation (3), iS is a dummy variable that equals 1 if worker i is high‐skilled. ,L Mb is the
elasticity of unskilled wage with respect to offshoring, and , , 1H M L M Mb b b is the elasticity of
high‐skilledwagewithrespecttooffshoring.Wealsoallowshockstooutputdemand ln jt tohave
differenteffectsacrossskilledandunskilledworkertypesin(3).
18
To implement (3) in the data, we add the following.We incorporate year, industry, and
region fixed effects ( , , and t IND R ) and a price index that is specific to j’s industry, ,IND tP , to
controlforthoserespectivecomponentsof jtA and jt .Weusejob‐spellfixedeffectstoabsorb ij ,
theunobservedabilityspecific to theworker‐firmmatch(Abowdetal.1999).The jobspell fixed
effects also absorb the components of jtA and jt that are worker‐firm specific. Time varying
shockstoworkerproductivityarecapturedbyincludingavector itx ofworker‐levelcharacteristics,
suchasexperience,unionstatusandmaritalstatus,thatchangeovertime.Tocapturetimevarying
shocksto jt weuse jtX ,thevalueoffirmj’sexportsinyeart.Firmsmayhavetimevaryingshocks
toproductivity thatarecorrelatedwithbothoffshoringandexportingactivitiesandwithworker
wages.Accordingly,wewillinstrumentforbothoffshoringandexportingasdiscussedinthenext
sub‐section.Finally,weincludeavector itz offirm‐controlvariables(output,employment,capital,
the skilled worker share of employment) to control for effects on labor demand net of the
productivityeffect.Thesemodificationsyieldthefollowingestimatingequation
(4), 1 , 1
1 2 3 ,
ln ln ln ln ln
.
ijt L M jt M it jt L X jt X it jt
it jt IND t ij t IND R ijt
w b M b S M b X b S X
x z P
Becauseitincorporatesavectoroffirmcontrols,theestimationofequation(4)correspondstothe
directeffectofoffshoringonwages.However,ifoffshoringraisesproductivityorlowersproduction
costs,includingfirmcontrolswilleliminateanimportantchannelthroughwhichoffshoringmight
boostlabordemandandwages.Weshowinthetheoryappendixthatthewageresponseinclusive
oftheproductivityeffectcanbeestimatedbysimplyeliminatingthefirmcontrols
(5)* * * *
, 1 , 1
1 3 ,
ln ln ln ln ln
.
ijt L M jt M it jt L X jt X it jt
it IND t ij t IND R ijt
w b M b S M b X b S X
x P
19
Bycomparing the coefficientestimatesof regressions (4)and (5)wecandeterminewhether the
productivityeffectboostslabordemandandwages.20Notethatthissamereasoningexplainswhy
weuselevelsofoffshoringandexportsasopposedtomeasuresthatarescaledbyfirmsize.Time
invariantdifferencesinfirmsizeareabsorbedinthefixedeffects,butchangesinfirmsizeovertime
may be the result of changing imports and exports. If we scale trade variables by firm size we
eliminateachannelthroughwhichtradecanaffectwagesandemploymentovertime.Insteadwe
estimateregressionswithandwithoutfirmsizeasacontrolvariable.
III.3.Instruments
Inourempiricalspecificationswewill relate timevarying labormarketoutcomesto time
varyingfirm‐levelmeasuresoftrade.Theidentificationchallengewefaceisthatfirm‐levelshocks
todemandorproductivitywillaffectbothtradeandwagesetting.
To address this problem,we construct instruments that are correlatedwith the value of
imports andexports for a firm‐yearbut areuncorrelatedwith changes in the firm’sproductivity
and wage structure. The offshoring instruments are world export supply, exchange rates, and
transportcosts.Theexportsinstrumentsareworldimportdemand,exchangeratesandtransport
costs.21
Worldexport supply cktWES is countryc’s total supplyofproductk to theworldmarket,
minus its supply toDenmark, in period t. These data are constructed fromCOMTRADEbilateral
trade data at the HS6 level.WES captures changes in comparative advantage for the exporting
country,whetherarisingfromchangesinproductionprice,productquality,orvariety.22Similarly,
20 The estimates of equation (5) are consistent under the assumption that our instruments reflect tradeshocksexogenoustoindividualfirmsandarethusuncorrelatedwiththefirmcontrolvariables
jtz .
21Otherstudiesofoffshoringexploitvariationintarifforchangesintariffduetoaliberalizationepisode.Weexperimentedwithusingtariffswithlittlechangeintheresults.TariffshavelittleexplanatorypowerinthefirststagebecausethebulkofDanishimportsarrivedutyfreefromEuropeandtherearefewchangestothetariffstructureinthisperiod.22 Using a similar strategy, Autor, Dorn and Hanson (2011) instrument U.S. imports from China by Chinese exports to other high-income, non-U.S. countries.
20
world import demand cktWID is country c’s total purchases of productk from theworldmarket
(lesspurchasesfromDenmark)attimet.AriseinWIDcouldresultfromshockstodemand(either
consumer tastes or industrial uses of particular products) or reflect a loss of comparative
advantagebycinproductk.
Theexchange rateand transport costs capture shocks to thedeliveredpriceofparticular
inputspurchasedbyDenmark.Theexchangerate ctE istheannualaveragerate,denotedinforeign
currency c per DKK so that an increase in ctE is an appreciation of the DKK. Since we are
aggregatingoversourcecountries,wenormalize ctE by itsover‐timemeanvaluetoremoveunit
differences.
TogettransportationcostswefirstestimatecostfunctionsusingUSimportsdatafollowing
Hummels (2007). We then use the estimated coefficients plus pre‐sample information on the
destination,bulk,andmodaluseforDanishimportstoconstructc‐k‐tvaryingcostmeasures, ckttc .
Full details on this estimation are captured in an appendix, but thekey sourceof variation is an
interaction between distance,modal use, and oil prices. In our sample period real oil prices fell
from$20 to $11per barrel between 1995 and1998, and then rose sharply to $45per barrel in
2005.Thesefuelpriceshaveanespeciallystrongeffectongoodsairshippedlongdistancesanda
veryweakeffectongoodsmovedshortdistancesviatrain.Thisimpliesthatchangesovertimein
fuelpricesaffectthelevelofcosts,therelativecostofemployingairv.oceanv.landtransportand
therelativecostofdistantversusproximatepartners.
Theexchangerate instrumentshavecountry‐timevariationandall theother instruments
have country‐product‐time variation. To get a single value for each firm‐year we aggregate as
follows.Let cktI representinstrument ( , , )I tc E WES forexportingcountryc,sellingHS6product
21
k,attimet,andlet jcks representtheshareofc‐k intotalmaterialsimportsforfirmj inthepre‐
sampleyear(1994).23Thentoconstructatimevaryinginstrumentforfirmjwehave
,jt jck ckt
c k
I s I
Theideabehindthisstrategyisthefollowing.Forsomereasonfirmjsourcesaparticular
inputk fromcountryc. Firmjmayhavealongstandingbusinessrelationshipwithafirminc,or
theinputsthatcmakesmightbeaparticularlygoodfitforfirmj.Forexample,manufacturersofair
pumpsrequireGermanpressuregauges,whichareofnousetoproducersofartificialkneeswho
instead require Japanese titaniumhinges. That relationship is set in the pre‐sample and is fairly
consistentovertime.Table2reportsthat64.4percentofc‐k importflowspurchasedbyfirmsin‐
sample also appeared in the pre‐sample (conversely, roughly one‐third of in‐sample import
purchaseswerenotrepresentedinthepre‐sample).
Over time there are shocks to the desirability of purchasing input k from country c.
Transportation costs and exchange rates may become more favourable, or country c may
experiencechangesinitsproductioncosts,productionvarietyorqualitythatareexogenoustofirm
j, and these are reflected in changing export supply to the world as a whole. Because firm j
intensivelyusesinputk fromcountrycmorethanotherfirmsitdisproportionatelybenefits from
thesechanges. Recall fromFigure3thatfirmshaveveryfewinputs incommonandthat inmost
cases,firmjistheonlyfirmthatbuysinputkfromcountryc.
The use of pre‐sample shares, jcks , implies that our sample consists of firm‐year
observationswithpositiveimportandexportvalues.Wehandleentryintooffshoringbyusingthe
entry year as the pre‐sample and exploiting subsequent variation in offshoring. That is, our
estimatesdonotreflectwagechangesresulting fromadiscretechange fromnooffshoringto the
23Someofourfirmseitherenterorbeginoffshoringwithinsample.Forthesefirmsweusesourcingpatternsin their firstyearofoffshoringandemploydata fromyear2andonwards for thewageand firmoutcomeregressions.
22
startofoffshoring.Thisisnotproblematicinoursamplebecausethesediscretechangesgenerally
affectsmallfirmswithsmalltradevolumes.
To summarize, we instrument for offshoring (exporting) using the weighted averages of
worldexportsupply(worldimportdemand),transportcosts,andexchangerates.Theweightsare
pre‐sample import (export) shares, and these differ significantly across firms. Following
Wooldridge(2002),weinstrumentfortheinteractionbetweenhigh‐skillandoffshoring(exports)
usingtheinteractionsbetweenhigh‐skillandtheinstrumentsforoffshoring(exports).
Wecannowdiscussthreatstoidentification.Weneedinstrumentsthatarecorrelatedwith
offshoring (orexporting)andorthogonal to changes inwithin‐job‐spellwage settingby the firm.
We first consider possible problems with the instruments cktI themselves, and then consider
possibleproblemswiththefirmshareweighting jcks .
Shockstoexchangeratesortransportcostsmayaffectboththecostofinputsandtheability
toexportfromDenmark.Ifweonlyincludedinstrumentedoffshoringinequations(4)and(5),this
would be problematic, but since we also include instrumented exporting by the firm, we are
capturingthischannel.Oilpriceshocksfigureprominentlyinourtransportcostmeasureandthis
canhaveanoveralleffectonthemacroeconomyandlabordemand.Recallhoweverthatourwage
regressionsalsocontrolforindustry,region,andtimefixedeffects,andwillincludeatimevarying
industry price index. These controls should absorb shocks to demand via oil prices. Similarly,
supposeariseinworldexportsupplyforaparticularc‐kinputisduenotonlytosupplyshocksbut
also reflects shocks todemandaround theworldand inDenmark.Forexample, risingexportsof
computermemory chips likely reflects growth in both supply and demand for electronics. If the
firmusing thatmemorychip inputproducesagood thatexperiences that samedemandshock it
maybecorrelatedwithwagesetting.Thiswouldbeespecially thecase inournarrowoffshoring
measures(whereinputsandfinalsalesareinthesameindustry),butlesssowithbroadoffshoring.
However,byincorporatingtheindustrypriceindex,wecontrolfortimevaryingshockstodemand

23
forparticular industrieswithinDenmark,andby incorporatingfirmexports,wecontrol fortime‐
varying demand shocks outside of Denmark.24 In addition, we experiment with dropping the
industries that one may consider especially susceptible to demand shocks in this period (e.g.
computers,constructionsupplies),inamannersimilartoAutoretal.(2011).
A second set of concerns relate to the share‐weightingof the instruments for each input.
Onemightworrythattherearedifferencesinthetypesoftechnologyusedbyfirms,anddifferences
in technology affect wage setting and the types of inputs purchased. Recall that all our wage
regressionsarewithinjobspellssothattimeinvariantdifferencesacrossfirmsintechnologyand
inputuseareabsorbed into the fixedeffects. Itmightbe that thereare changesover time in the
levelorthetypeoftechnology(andthereforebothimportsandwages),butthisispreciselywhywe
usepre‐sampledataon inputuse, inorder toprevent technologicalchange fromimpacting input
useandwages.
IV.PreliminaryAnalyses:Theeffectoftradeonfirmoutcomes
Inthissectionwedescribefirmoutcomevariablesandtheircorrelationwithimportingand
exportingbehaviorinTable3.Thefirstcolumnreportstheresultofsimpleregressionsatthefirm
level using all manufacturing firms in Denmark. The dependent variable is a firm j, year t
characteristic (employment, output, average wage bill, etc.) and the explanatory variable is an
indicator for whether the firm is engaged in offshoring (according to our narrow definition).
Offshoringfirmsaredifferentinalmosteveryrespect–theyhavehighersales,moreemployment,a
largercapital/workerratio,aremoreprofitableandpayahigheraveragewage. (Allvariablesin
Table3aresignificantatthe1%levelsoweomitstandarderrors.)
24Totheextentthatdemandshocksarenotcompletelypurgedfromourestimationtheyarelikelytobiasourresultsagainstfindingnegativewageeffectsofoffshoring.Thisisbecauserisingdemandforafirm’sproductimpliesrisingoffshoringandrisingwages.
24
Someofthismayreflecttimeinvariantdifferencesacrossfirms,andouridentificationwill
workoffwithinfirmchanges.Thesecondcolumnrestrictsthesampletoonlythosefirmsengaged
in offshoring and repeats these regressionswith firm fixed effects in order to relatewithin‐firm
changesinoutcomestochangesinoffshoringovertime.Risingoffshoringispositivelycorrelated
withemployment,sales,capitalperworker,averagewagebillsandaccountingprofits.This isthe
heart of the identificationproblem. Itmaybe that growth in offshoring causes these firms to be
larger,more profitable, and able to pay higher wages. Or itmay be that all these outcomes are
jointlydeterminedasaresultoftime‐varyingshockstothefirm’sproductivityordemandfortheir
products.Ifso,thepositivecorrelationsbetweenoffshoringandfirmoutcomes(e.g.employment)
couldbedrivenbysimultaneitybias.
Werepeat thisexercise, this time instrumenting forour tradevariablesandsocorrecting
forsimultaneity.(Wediscussthefirststageingreaterdepthbelow).Incolumnthreewereportthe
coefficientsfromfirmoutcomeregressionsinwhichweincludeonlyimports(instrumented).Asin
theprecedingcolumns,anexogenousincreaseinimportsleadstoasharpriseinsales,accounting
profits, capital per worker and average wage bill. However, we now see a steep decline in
employment,withanelasticityof ‐0.10,whichoccursprimarily throughreducingthenumbersof
low‐skillworkers.Therisingshareofhighskillworkerssuggeststhatthelargeincreaseinaverage
wagebillperworker isdrivenbycompositionalchangeswithin the firm.Wewillusewithin job‐
spellwageregressionstoaccountforcompositionalchangesinourmainestimation.
In columns fourand fivewe report coefficients from including instrumented importsand
exportstogetherasexplanatoryvariables.Thecoefficientsonimportsaresimilartowhatwehadin
columnthree,thoughtheemploymenteffectsarenowlarger.Risingexportsleadtoincreasesinall
firmoutcomevariables.
InthistablewecanseemanyofthekeyfeaturesofoursimplemodelinsectionIII.When
wecorrelatefirmoutcomeswithindicatorsforimportingstatus,orwithwithin‐firmchangesinthe
25
extent of importing, we find that “better” firms import and that importing is correlated with
increases inemployment.However,whenwe isolateexogenousshocks to the importingdecision
thatareuncorrelatedwithfirm’sproductivity in levelsor inchangesthenweseeaverydifferent
picture. Exogenous increases in importing improve sales andprofitability outcomes for the firm,
butleadtosharpcontractionsinemploymentandashiftawayfromlow‐skilllabor.
Does the rise in imported materials represent increased offshoring by the firm, or
somethingelse?Considerthreereasonsthatafirmmightincreaseforeignpurchases.One,thefirm
may be expanding sales due to rising productivity and/or increased demand for its goods and
requiremore inputs of all types, including imported inputs. Two, the firmmight be substituting
foreigninputsforinputspreviouslypurchasedfromanotherDanishfirm.Three,thefirmmightbe
substitutingforeigninputsforinputspreviouslyproducedwithinthefirm,thatistosay,offshoring.
Our IV strategy rules out the first possibility and the estimated employment effects rule out the
secondpossibility.Putanotherway,switchingfromadomestictoaforeignsuppliermaywellhave
importantbenefitsforthefirmintermsofsalesandprofitability,butitshouldnothaveanegative
effectonemploymentwithin the firm. Weshouldonlyobserveareduction inemployment if the
firmissubstitutingforeigninputsforitsownlabor.
V.Theeffectoftradeonworkerwageswithinjob‐spells.
Having established that imported materials are likely to substitute for labor within the
firms, we now present the results of our main estimation. Our empirical strategy is to relate
changesinindividualworker’swagestoexogenouschangesinimportingandexportingactivityby
the firms that employ them, after controlling for worker‐firm “job‐spell” fixed effects and time
varyingcharacteristicsof theworker.Weestimateequations (4)and (5)basing identificationon
within‐firm,over‐timevariationinimportsandexportsandincludeonlythoseworkersstayingin
thefirm.Includingfirmvariablescontrolsforchangesinlabordemandarisingfromaproductivity
26
effect, that is, the measured wage elasticity is net of the productivity effect. Excluding these
variablesallowsfortime‐varyingchangesto firmoutcomevariablesasaresultof theimportand
exportshocksandsoproducesthewageelasticityestimateinclusiveoftheproductivityeffect.
Inequations(4)and(5),wehave4endogenousvariables,(narrow)offshoringandexports,
andtheinteractionofeachwiththehighskilldummy.FollowingWooldridge(2002),weincludethe
full set of instruments in the first‐stage regressions for each endogenous variable. For each
endogenousvariableweestimatebothwithandwithout firmcontrols, fora totalof8 first stage
regressions.Ineachcase,theregressionisfittingpredictedoffshoringattheworker‐firm‐yearlevel
(following,e.g.,AngristandPischke2009),andincludesjob‐spellfixedeffects.Wereporttheresults
in Table 4, clustering the standard errors at the firm‐year level. In the offshoring regressions,
changes in world export supply and transportation costs have the predicted sign and are
significantly correlated with growth in imports for the firm. We see similar patterns on the
exportingside.The “strongest” instruments, in termsof thevariation theyexplain,are theworld
exportsupply(for imports),world importdemand(forexports)and transportationcosts.This is
likely because these variables exhibitmuchmore time‐series variation across inputs and source
countries,while exchange rates exhibit no variation across products and no variation across the
countrieswithintheEurozone.
InTable5weestimatewithin‐jobspellwageregressionsinwhichwepooloverallworkers.
Thedependentvariableistheloghourlywagerateofworkeriemployedbyfirmjinyeart,andwe
again cluster standard errors at the firm‐year level. We provide fixed effect, and fixed effect‐IV
estimates both with and without additional firm controls. In the fixed effect specifications we
exploit only within worker‐firm variation but ignore the potential simultaneity problem where
unobserved firm productivities drive both wages and offshoring. In contrast, the fixed effect‐IV
specificationincludesjob‐spellfixedeffectsandcorrectsforthissimultaneitybias.
27
In the fixed effect specificationwe find very smallwage effects fromboth importing and
exporting.Incontrast,whenweinstrumentwefindeffectsthatare6‐10timeslargerinmagnitude.
Offshoringlowersanunskilledworker’swage(elasticity1.6to1.9%),sothatbeinginafirmthat
doublesitsoffshoringhasaneffectsimilarinmagnitudetolosingoneyear’sexperienceonthejob.
In contrast, offshoring raises a skilledworkers wage by 3.1 to 3.6%. These results suggest that
offshoringtendstoraisetheskillpremium.Inthetheorysectionwenotedthedifferencebetween
runningtheseregressionwithfirmcontrolsandwithout.Theformerisequivalenttoamovealong
an isoquantwhile the latter allows for the possibility of a productivity effect ‐‐ that output and
capitalwillriseinresponsetoanoffshoringshockandboostthedemandforlabor.Weseeevidence
weakly consistentwith this conjecture.Wage losses forunskilledworkersaregreater (andwage
gains for skilled workers smaller) when we control for the productivity effect. Though these
differences are small they are consistent with the idea that offshoring produces both labor
substitutionandproductivityresponses,withtheformerclearlydominating.
Turningtotheexport interactions,weseethatrisingexportsarearisingtidethat liftsall
boats,with a low skillwage elasticity of .037 to .044, and no significant difference for high skill
labor.Thisisconsistentwithaviewthatoffshoringandexportingshocksrepresentverydifferent
changeswithinthefirm.Offshoringinducesinputsubstitutionwhileexportingincreasesinputuse
acrosstheboard.
The coefficient estimates in Table 5 alone are not sufficient for calculating the netwage
effectsoftrade,becausefirmsareengagedinbothimportingandexportingandaswesawinFigure
1,botharerisingfast.Giventheconflictingsignsonoffshoringandexports,thenetwageeffectfor
anunskilledworkerdependsonwhetherexportsoroffshoringarerisingfasterwithintheirfirm.
InPanelAofTable6wedividefirm‐yearsintobinsonthebasisofyearonyearpercentage
changes inoffshoring (down)andexports (across) for that firm.We thenreport, ineachbin, the
share of the low skill workforce (in normal font), and the median wage changes (in boldface)
28
experiencedbytheworkersaspredictedusingthecoefficientestimatesofTable5.Considerthebin
inthetoprightcornerinwhichweplacefirm‐yearswhereimportsareat least30percentbelow
the previous year, andwhere exports are at least 30 percent above the previous year. That bin
represents2.2percentofthelowskillworkforceandgiventheestimatesinTable5,wepredictthat
theseworkerswillexperienceamedianwageincreaseof5.28percentrelativetothepreviousyear.
In contrast, the bottom left corner represents firm‐yearswith rapidly rising imports and rapidly
fallingexports.Thatis1.5percentofthelowskillworkforceandthemedianpredictedwagelossis
4.9percentrelativetothepreviousyear.Overall,themedianofthedistributioniscloseto0,with
halfoflowskillworkersexperiencingwagegainsandhalfexperiencingwagelosses.Thestandard
deviation is 2.84%;12%of lowskilledworkershavepredictedwage changes above1.5%,while
10%havewagechangesbelow–1.5%.
PanelBofTable6reportspredictedwagechangesforhigh‐skilledworkers. Themajority
(65%) of high skilled workers have positive predicted wage changes, as both offshoring and
exportingtendtoincreasehighskilledwage.Thedistributionhasamedianof0.29%andishighly
variable, with a standard deviation of wage changes of 4.58%. 26% of skilled workers have
predictedwagechangesabove1.5%and13%havewagechangesbelow–1.5%.
Summarizing, Table 6 shows that even within the same skill type, there is substantial
variationinthenetwageeffectsoftrade,asemployerschangeboththeiroffshoringandexporting
over time.Theseresultscomplementrecent theoreticalandempirical findings thatemphasizean
increaseinwithin‐groupinequalityfollowingtradeliberalization(e.g.GoldbergandPavcnik2007,
Helpmanetal.2010).
Table7reportsasetofrobustnesschecks.Foreachcheckweestimatetworegressions,one
withfirmcontrolsandonewithout(correspondingtoequations(4)and(5),respectively).First,we
employonlythosejobspells lastingat least7years,whichisclosetotheaveragejobdurationin
Denmark(7.9years).Thiscutsoursampleinhalf,butgivesusmoreobservationsperjobspellto
29
identifytradeshocks.WefindresultsthatareveryclosetothoseinTable5.Theseresultsconfirm
thatthesourceofour identification iswithin‐job‐spellchanges,andthathaving long jobspells in
thedataisimportantfortheidentificationstrategytowork.
OursecondrobustnesscheckismotivatedbythefindinginTable2thatfirmsconcentrate
their import purchases and export sales in just a few categories. We are concerned that our
measures foroffshoringandexportingaggregateoverboth themaincategoriesof trade flowsas
well as very small and inconsequential trade flows.We thusemployonly the top5 categoriesof
pre‐sampleimportandexportflows(intermsofvalues).Again,wefindsimilarpatternsasinTable
5.
Thus far we have emphasized narrow offshoring (imports purchased in same industry
categories as the firm’s sales) because these are more likely to be inputs the firm could have
produceditself.Inournextrobustnesscheckweusebroadoffshoring(allimportpurchasesbythe
firm)instead.Wefindmuchlarger,butlesspreciselyestimated,effectsofoffshoringonwages.The
low skill wage elasticity is 2 to 3 times larger in magnitude than Table 5, and there is a more
pronounced difference between low and high skill wages. A possible explanation is that broad
offshoring includes inputs of all types and is therefore more likely to capture the effect of
technological changeoperating through importsofmachinery. Further, theestimationwith firm
controls yields a much larger wage drop than the estimation without firm controls. This is
consistentwiththeviewthattheproductivityeffect,asdistinctfromthelaborsubstitutioneffect,
canbeseenmoreclearlywhenimportedinputsaredifferentfromthosemadebythefirm.
It may seem puzzling that although most of Danish trade is with other high income
countries,offshoringtendstoreducethewageoflowskilledworkers.25Toinvestigatewhetherour
25 In recent work Burstein and Vogel (2011) show that North-North trade can increase skill premium if productivity is complementary with skill, and their results also hold for North-North offshoring. To see this, consider the following simple extension of their framework. There are two countries with the same factor composition but differing in productivity for specific tasks. A firm offshores a task if the foreign country is more productive in the
30
results are driven by Danish trade with low income countries, we restrict our sample to only
includeDanishtradewithhighincomepartners.Wefindasimilarsignpatternforoffshoring,albeit
with slightly smallerelasticities.Theestimatedwageelasticitieswith respect toexportsarenow
quitedifferent,withhighskillworkersenjoyingalargerwagegainthanlowskillworkers.Ideally,
wewould run a similar specification for Danish tradewith low income partners. Unfortunately,
these trade flows tend tobe small andexhibitmuch fluctuation, and so theyare less compatible
withtheuseofpre‐samplesharesinourIVestimation.
Finally, onemightworry that ourworld export supply instrument is capturing shocks to
world demand for products as well as supply. During our sample period, many high income
countries,includingDenmark,experiencedboomsinthetechnologyandhousingsectors.Following
Autoretal.(2011)wedroptheindustriesthatincludecomputers,steel,flatglassandcement.We
seeinthefinalcolumnsofTable7thatthisproducessimilarwageelasticityestimates.
Table7suggeststhatourbasicfindingsinTable5arerobusttoalternativespecifications.26
Below, we apply our estimation framework to explore particular occupations or task
characteristics,andtheninvestigatetheeffectofoffshoringontheearningsofdisplacedworkers.
VI.WageEffectsbyOccupationandTaskCharacteristics
Our data identify the occupation of each worker, which allows us to examine whether
occupations having particular task characteristics are especially affected by trade. Conceptually,
ourapproachisthesameasthatlaidoutinSectionIII,inwhichworkersofdifferenttypesmaybe
substitutesorcomplementsforforeignmaterials.Insteadofonlygroupingworkersbyeducational
attainment,wealsogroup themby thecharacteristicsof theparticular tasks theydo.That is,we
task, which reduces the range of less productive tasks performed in the economy. If productivity and skilled labor are complementary, this will raise the relative demand for high-skilled labor and the skill premium. 26 We have also experimented with the following alternatives, and obtained similar results. (1) break low-skilled workers into medium-skilled and very low-skilled. They have similar wage elasticity estimates (see also note 8); (2) use the top 2 categories of pre-sample trade flows; (3) employ only the job spells longer than 5 years; and (4) define narrow offshoring as imports within the same HS2 categories as sales.
31
augment equation (4) with the interaction between an occupational characteristic (OCC) and
offshoring to see whether offshoring effects on wages are different across task characteristics
within a skill type. For estimation we use fixed effects‐IV similar to Table 5, where we also
instrumentfortheadditionalOCCxoffshoringinteraction.Togetacleanidentification,wedropthe
workerswhoswitchoccupationsduringjobspells.
We obtain occupational characteristics data from O*NET version 13, 2008 (see the Data
Appendixformoredetails).ForcategoriesoftaskcharacteristicswefirstfollowAutoretal.(2003)
andconsiderroutineandnon‐routinetasks.Foreachcategorywepick theO*NETcharacteristics
that most closely match the ones used in Autor et al. (2003) and compute the principal
component.27Wethennormalizetheprincipalcomponentstohavemean0andstandarddeviation
1.
Wereport theresults inTable8.Theworkerswithaverageroutinenessscores (OCC=0)
arenotmuchaffectedbyoffshoring (the coefficientsof offshoringandoffshoring xhigh‐skill are
both insignificant).28Workers with above‐the‐average routineness (OCC > 0) suffer larger wage
losses(thecoefficientofoffshoringxOCCisnegativeandsignificant).Incontrast,non‐routinetasks
interactpositivelywithoffshoring.
Wenextexamine the individual taskcharacteristics in thenon‐routine category.Westart
withmath.29AsshowninTable8,theresultsformatharedifferentfromnon‐routineness.Among
theworkerswithaveragemath requirements (OCC=0), thehigh‐skilled seeawage elasticityof
about2.5percentwhilethelow‐skilledseeawageelasticitycloseto0withrespecttooffshoring.
Thehigh‐skilledworkerswithmathrequirements1standarddeviationabovethemean(OCC=1)
see an additionalwage elasticity of 2.7 percent, for a total of 5.2 percent. This “math premium”
27 Autor et al. (2003) use historical task data. Examples of routine tasks aremanual dexterity and fingerdexterity,andofnon‐routinetasks,mathematicsandthinkingcreatively.DetailsintheDataAppendix.28 These results do not contradict Table 5 because educational attainment is negatively correlated (‐0.54)withroutine‐ness. 29Itistheprincipalcomponentofmathematicalreasoningandmathematics.
32
implies that in response to increases in offshoring, college‐educated workers with strong math
skills have larger wage increases than other college‐educated workers. In contrast, non‐routine
skillsotherthanmathnegativelyinteractwithoffshoring.
Ourresultsformathmotivateustoexaminetheothermaincategoriesofcollegeeducation:
communicationand language, social sciencesandnatural sciences.30Wereport the results in the
lower panel of Table 8. The “social science premium” is 3.7 percent and the “communication
premium” is 4.4 percent. For interpretation, these results imply that, for example, for a college
educated(highskill=1)directororchiefexecutive(communication=2,or2standarddeviations
aboveaverage),thewageelasticityis2x4.4%=8.8%withrespecttooffshoring.Naturalsciences,
however,haveaweakandnegativeinteractionwithoffshoring.Finally,tobetterunderstandwhy
low skill workers suffer from offshoring we examined the interaction between offshoring and
hazardous working conditions. Hazardous working conditions have an effect similar to doing
routinetasks.31
VII.Earningslossesafterlayoffs
So farwehaveexamined thewageeffectsofoffshoringandexports for theworkerswho
remainemployed.Wenowexaminehowtradeaffectstheearningsofdisplacedworkers,drawing
on the framework of Jacobson et al. (1993). The specifics of the estimation strategy and sample
selectionaredescribedintheDataAppendix.Briefly,wefollowasampleofworkerswhoareinthe
datacontinuouslyfrom1995‐2006.Wecontrolforobservablecharacteristicsofworkers(including
worker fixedeffects)andcomparetheearnings‐profileofnon‐displacedworkerstoworkerswho
separate from the firm as part of a mass layoff event. We take this further by distinguishing
whetherworkersweredisplacedimmediatelyaftertheirformeremployerssubstantiallyincreased
30Examplesofsocialsciencesareeconomicsandaccounting,ofnaturalsciences,engineeringandtechnology,andofcommunication,persuasionandnegotiation.ThefulllistsareintheDataAppendix. 31Examplesofhazardousconditionsareexposuretocontaminants,andexposuretominorburnsandcuts.
33
offshoring(labeled:offshorers)andallotherdisplacedworkers(labeled:non‐offshorers).Wealso
examinewhetherthiscomparisondependsonworkerskilllevels.
WestartwithadatasampleofallDanishmanufacturingworkers,andthencutdownthis
sampletomatchtherequirementsimposedinsectionII.2.Further,followingJacobsonetal.(1993)
wefocusonhigh‐tenureworkersbecausetheyaretheonesmostlikelytohaveaccumulatedfirm‐
specifichumancapitalinthepredisplacementfirm(seetheDataAppendixformoredetailsofthe
sampleconstruction).Wedefinedisplacedworkersasthoseseparatingfromfirmswhereat least
30%oftheparticularworkersintheinitialyeararenolongeremployedbythefirmthefollowing
year.32Weclassifyworkeriasanoffshorerifhe/sheisdisplacedinamasslayoffeventfromfirms
thatwereincreasingtheirpredictedoffshoringatleast10%(takenfromthefirststageregression
inTable3)betweenthepredisplacementyearandthedisplacementyear.33,34Approximately9%of
theresultingsample(6,208workersintotal)aredisplacedatleastonceovertheyears1998‐2006.
The lowproportionofdisplaced‐workers is typicalof thedisplacement literature, becausemass‐
layoffeventsareuncommon.Almosthalfofthedisplacedworkersdonothaveanobservedchange
inpredictedoffshoringinthepre‐displacementfirm,duetomissinginstrumentsforsomefirmsand
tothefactthatsomeofthepre‐displacementfirmscloseddown.Oftheremaining3,301displaced
workers,roughly20percentareclassifiedasoffshorers.
WesummarizeourresultsinFigure4.Thetopthreepanelsshowtheprofileofloghourly
wage rate, annual labor earnings and annual gross earnings for high skillworkers. The bottom
32Ourdefinitionusesgrossflows,sinceourdatahasthefullpopulationofworkersandfirms.Theliterature(e.g. Jacobson et al. 1993) typically defines mass‐layoff events using net flows. Net flows could missdisplacementevents ifa firmsubstantiallychanges thecompositionof itsemployment,which,asshowninTable3,happenswithoffshoring.Wealsoexperimentedwithusingnetflowsandobtainedsimilarresults.33 Predicted offshoring is measured at the worker level, but predicted offshoring is only observed fordisplaced workers in the predisplacement year. Therefore we measure predicted offshoring in thedisplacementyear for thepredisplacement firmasanaverageoverall remainingworkers in the firm.Thechange in predictedoffshoringmeasured thisway is valid, if thewithin‐firmdispersion acrossworkers inpredicted offshoring is low. This is indeed the case – the median firm‐level coefficient of variation ofpredictedoffshoringis0.004withamaximumof0.056.34Weusethe10%cutoffbecausewewanttofocusondisplacedworkersthathavebeenhitbyapronouncedoffshoring shock. Larger cutoffs become problematic because they cut down on the number of displacedworkersfromwhichtoestimatethewageprofile.
34
panelsshowthesameprofiles for lowskillworkers. Changes inearningsandgrossearningsare
measured in levels of DKK rather than in percentage terms so as to include thoseworkerswho
exhibitzerolaborincome.Eachpaneldisplaysresultsforoffshorers(lightgrey)andnon‐offshorers
(black)separately.Thecomparisongroupineachcasearenon‐displacedworkers.
The top left panel shows that high‐skill non‐offshorers do not experience a reduction in
hourlywage rate (relative tonon‐displacedworkers),whilehigh‐skill offshorers suffer smallbut
persistent wage losses of 4 percent. The top middle panel shows that for high‐skilled non‐
offshorers there are pronounced drops in annual labor earnings, peaking in the year after
displacement at 30,000 DKK. For high‐skilled offshorers the drop in earnings is even steeper,
peakingat64,000DKK.
Toput the numbers in perspective, the average high skillwage in the sample is 419,000
DKKsothepeaklossof30,000DKKfornon‐offshorersrepresents7%ofpre‐displacementearnings
and the peak loss of 64,000 DKK for offshorers represents 15% of pre‐displacement earnings.
Combinedwiththesmallchangesinhourlywagesafterdisplacement,wecanconcludethatlosses
inannuallaborearningsaredrivenprimarilybyreductionsinhoursworked.Finally,thetopright
panel shows that even after accounting for income transfers during unemployment the earnings
losses from displacement are still substantial. Offshorers in particular loseDKK 52,000 the year
afterdisplacement,or12%ofpredisplacementearnings.
Looking at the bottom left panel,we see that for low‐skilledworkers, offshorers suffer a
largerwageloss(8%)thannon‐offshorers(5%),andalargerlossinlaborearnings(60,000DKK)
than non‐offshorers (44,000 DKK). The gap between these groups persists five years after
displacement.
These losses in earnings are similar to those of displaced high‐skill workers in absolute
terms, but since displaced low‐skilled workers have lower earnings (285,000 DKK on average),
theirlossesarehigherinpercentageterms.Non‐offshorerslose15%ofpre‐displacementearnings
35
andoffshorerslose21%.Finally,incometransfersarenotclosetofullycompensatingforearnings
losses.Thebottomrightpanelshowsthatoneyearafterdisplacement,annualgrossearningsdrop
by30,000DKK(or12%)fornon‐offshorersand50,000DKK(or17%)foroffshorers.
Tosummarize,Figure4showsthatalldisplacedworkerssuffersubstantialearningslosses.
Offshorers, inparticular,suffergreaterearnings lossesthannon‐offshorersofthesameskill type.
Oneexplanationforthisfindingisthatoffshorershaveobsoleteskillsorhavespecializedindoing
tasks that are now imported from abroad, and so they tend to have worse reemployment
opportunitiesintheDanishlabormarket.Toexplorethisfurtherwetrackthelabormarketstatus
intheyearafterdisplacementforoffshorersandnon‐offshorers.Wefindthatahigherproportion
ofoffshorersremainunemployed(19%)oroutofthelaborforce(10%)thannon‐offshorers(11%
and5%respectively).Amongtheworkerswhoarereemployed,ahigherproportionofoffshorers
switch four‐digit industries (92%) than non‐offshorers (56%), although the proportion of
reemployedworkerswho switch four‐digit occupations is similar for offshorers (44%) and non‐
offshorers(43%).
UsingFigure4andTable5,wecomparethewageandearningslossfortheworkerswhoare
displaced from offshoring firmswith those for their colleagueswho remain employed. For low‐
skilledworkers,thedisplacedsufferawagelossof8%andanearningslossof21%,whilethenon‐
displacedhaveawagelossof1.6%(inclusiveoftheproductivityeffect)iftheiremployersdouble
offshoringwithinayearanddonotenjoyanincreaseinexports.Thecomparisonisstarkerforhigh
skilledworkers.Thedisplacedsufferawagelossof4%andanearningslossof15%,whilethenon‐
displacedenjoyawagegainof3.6%(inclusiveoftheproductivityeffect)iftheiremployerdoubles
offshoringinasingleyear.
Themagnitudeof these losses, and thedifferences acrossdisplacement types, provides a
useful comparison with existing studies. Jacobson et al. (1993) used data on mass layoffs for
workers in theUS, and found losses of around25 percent of pre‐displacement earnings. Studies
36
based on European data have also found long‐term negative effects of displacement but most
studies findmoremodesteffects.Forexample,Albæk,vanAudenrodeandBrowning (2002) find
that Danish workers earn around 6 percent less than nondisplaced workers three years after
displacement. We find similarly modest displacement numbers in the non‐offshorer group, and
effectscomparabletoJacobsonetal.(1993)fortheoffshorergroup.
VI.Conclusions
We employ a unique matched worker‐firm dataset from Denmark to measure how
offshoring shocks affect wages at the worker level. Our data reveal new stylized facts about
offshoring activities at the firm level. Because we observe the specific products and source
countries for imported inputs purchased by Danish firms we can construct instruments for
offshoringdecisionsthataretimevaryinganduncorrelatedwiththewagesettingandproductivity
of the firm. In addition, because we can consistently track virtually every person in the Danish
economyover time,we can condition our identification on variationwithin specificworker‐firm
matches(i.e.jobspells).
Ourkey findingsare these.One,controlling for theendogeneityof tradeevents iscritical.
Instrumentalvariablesestimatesof theeffectof importsandexportsonwagesyieldmuch larger
effects than those that ignore endogeneity. Two, exogenous offshoring shocks have considerably
different wage effects across educational groups, raising skilled labor wages 3.6 percent and
loweringwagesby1.6percentforunskilledworkers.Incontrast,exportingisarisingtidethatlifts
allboats.Three,theneteffectoftradeonwagesdependsonthewageelasticityestimatesandhow
firmschangeexposuretotrade,andthisexhibitssubstantialvariationacrossworkersofthesame
skill type. For example, 26% (12%)of high skilled (low skilled)workershavenetwage changes
above+1.5%peryearwhile13%(10%)ofhighskilled(low‐skilled)workershaveannualchanges
below–1.5%.
37
We then extend our estimation framework in two ways. First, exploring occupational
characteristicsallowsustoidentifyseveraladditionalanduniquerelationships.Conditionalonskill
type,routinetasksandthoseoccupationsthatexposeworkerstounsafeworkingconditionssuffer
wagelossesfromoffshoring.Occupationsthatintensivelyemployknowledgesetsfrommath,social
scienceand languagesgainfromoffshoringshocks,whilethosethatemployknowledgesets from
natural sciences and engineering are nomore or less insulated from offshoring shocks than the
averagemanufacturingworker.Theseresultssuggestthatnotalldegreesarecreatedequal.
Finally, we track workers before, during and after job‐spells and find that displacement
froma firmwith rising offshoring generates large andpersistentwage and earnings losses. Low
skillworkersdisplacedfromoffshoringfirmslose21percentoftheirpre‐displacementearnings,an
effectroughly13timesgreater thanwage lossessufferedbycolleagueswhoremainemployed in
offshoring firms. The losses sufferedbyworkers displaced fromoffshoring firms are larger than
thosesufferedbyotherdisplacedworkers. Thedifference isexplainedbyahigherpropensity to
remainunemployed,andamuchlowerlikelihoodofreattachingtotheworkforcewithinthesame
industry. This is consistent with a view that offshoring is not only replacing employment
opportunitieswithinthefirmbutalsoobsolescingsimilarjobsthroughouttheeconomy.
ReferencesAbowd, J., Kramarz, F., Margolis, D. N. (1999), “High Wage Workers and High Wage Firms”,
Econometrica,67,251‐333.Albæk, K., M. van Audenrode and M. Browning; 2002, “Employment Protection and the
Consequences for Displaced Workers”, In “Losing Work, Moving On. InternationalPerspectives on Worker Displacement”, edited by P. J. Kuhn. W. E. Upjohn Institute forEmploymentResearch.
Amiti,Mary;Davis,DonaldR.;2011.“Trade,Firms,andWages:TheoryandEvidence”,forthcoming,ReviewofEconomicStudies.
Amiti, Mary; Konings, Jozef; 2007. “Trade Liberalization, Intermediate Inputs, and Productivity:EvidencefromIndonesia”,AmericanEconomicReview97,No.5,pp.1611‐1638.
Autor, David H., Frank Levy and Richard J. Murname, 2003. “The Skill Content of RecentTechnologicalChange:AnEmpiricalExploration”,QuarterlyJournalofEconomics118(4).
Autor,DavidH.,DavidDornandGordonHanson,2011.“TheChinaSyndrome:LocalLaborMarketEffectsofImportCompetitionintheUnitedStates”,mimeo.
Angrist, Joshua D. and Jorn-Steffen Pischke. 2009. Mostly Harmless Econometrics, Princeton
38
University Press, Princeton and Oxford. Bernard,AndrewB.andJ.BradfordJensen.1997.“Exporters,SkillUpgradingandtheWage
Gap.”JournalofInternationalEconomics42,3‐31.Bernard, Andrew B. and J. Bradford Jensen. 1999. “Exceptional Exporter Performance: Cause,
Effect,orBoth.”JournalofInternationalEconomics47:1‐25.Botero,JuanC.,SimeonDjankov,RafaelLaPorta,FlorencioLopez‐De‐SilanesandAndrei
Shleifer.2004.“TheRegulationofLabor.”QuarterlyJournalofEconomics119(4),1339‐1382.
Burstein,Ariel,andJonathanVogel.2011.“Globalization,Technology,andtheSkillPremium:AQuantitativeAnalysis”,NBERworkingpaper16459.
Bustos, Paula. 2011. “Trade Liberalization, Exports, and Technology Upgrading: Evidence on theImpactofMERCOSURonArgentinianFirms”,AmericanEconomicReview101(1),304‐340
Christensen, B. J., R. Lentz, D. T. Mortensen, G. R. Neumann and A.Werwatz; 2005, “On‐the‐JobSearchandtheWageDistribution”,JournalofLaborEconomics23,pp.31‐58.
Couch,K.A.andD.W.Placzek;2010,“EarningsLossesofDisplacedWorkersRevisited”,AmericanEconomicReview100,pp.572‐589.
Dahl, C. M.; D. le Maire; J. R. Munch; 2009. “Wage dispersion and decentralization of wagebargaining”,Discussionpaper09‐15,DeptofEconomics,UniversityofCopenhagen.
Ebenstein,Avraham,AnnHarrison,MargaretMcMillanandShannonPhillips.2009.“EstimatingtheImpactofTradeandOffshoringonAmericanWorkersUsingtheCurrentPopulationSurveys”.NBERworkingpaper15107.
Feenstra, R.C., 2010. “Offshoring in the Global Economy: Microeconomic Structure andMacroeconomicImplications”,MITPress,Cambridge,Massachusetts.
Feenstra,RobertC.andGordonH.Hanson.1996.“ForeignInvestment,OutsourcingandRelativeWages”,inR.C.Feenstra,G.M.GrossmanandD.A.Irwin,eds.,ThePoliticalEconomyofTradePolicy:PapersinHonorofJagdishBhagwati,Cambridge,MA:MITPress,pp.89‐227.
Feenstra, R.C. and Gordon H. Hanson. 1997. "Foreign Direct Investment and Wage Inequality:EvidencefromMexico'sMaquiladoras."JournalofInternationalEconomics,42,pp.371‐93.
Feenstra, R.C. and Gordon H. Hanson. 1999. "The Impact of Outsourcing and High‐TechnologyCapitalonWages:EstimatesfortheUnitedStates."QuarterlyJournalofEconomics,114,pp.907‐40.
Feenstra, R.C. and GordonH. Hanson. 2003. “Global Production Sharing and Rising Inequality: ASurveyofTradeandWages”,inHandbookofInternationalTrade,editedbyKwanChoiandJamesHarrigan,BlackwellPublishing.
Frias,JudithA.,DavidS.Kaplan,andEricA.Verhoogen,2009.“ExportsandWagePremia:EvidencefromMexicanEmployer‐EmployeeData”,mimeo,ColumbiaUniversity.
Goldberg,PinelopiK.,AmitKhandelwal,NinaPavcnikandPetiaTopalova.2010.“ImportedIntermediateInputsandDomesticProductGrowth:EvidencefromIndia”.QuarterlyJournalofEconomics,125,17727‐1767.
Goldberg,PinelopiK.,andNinaPavcnik.2007.“DistributionalEffectsofGlobalizationinDevelopingCountries.”JournalofEconomicLiterature45(1),39‐82.
Grossman,GeneandEstebanRossi‐Hansberg,2007.“TheRiseofOffshoring:It’sNotWineforClothAnymore”,TheNewEconomicGeography:EffectsandPolicy Implications,Federal ReserveBankofKansasCity,JacksonHoleSymposium.
Grossman, Gene and Esteban Rossi‐Hansberg, 2008. “Trading Tasks: A Simple Theory ofOffshoring”,AmericanEconomicReview,98,pp.1978‐1997.
Hanson,GordonH.andAnnHarrison.1999.“TradeandWageInequalityinMexico.”IndustrialandLaborRelationsReview52(2),271‐288.
Harrison,Ann,JohnMcLarenandMargaretS.McMillan.2010.“RecentFindingsonTrade
39
andInequality”.NBERworkingpaper16425.Helpman,Elhanan,OlegItskhokiandStephenRedding.2010.“Inequalityand
UnemploymentinaGlobalEconomy”.Econometrica78(4),1239‐1283.Hsieh,C.T.andWoo,K.T.2005“TheImpactofOutsourcingtoChinaonHongKong’sLaborMarket”,
AmericanEconomicReview,95(5),1673‐1687.Hummels,D.(2007),TransportationCostsandInternationalTradeintheSecondEraof Globalization,JournalofEconomicPerspectives21,131‐154.Hummels,David;Ishii,Jun;Yi,Kei‐Mu;2001.“TheNatureandGrowthofVerticalSpecializationin
WorldTrade”,JournalofInternationalEconomics,June2001,v.54,iss.1,pp.75‐96.Jacobson, L. S., R. J. LaLonde, and D. G. Sullivan; 1993, “Earnings losses of displaced workers”,
AmericanEconomicReview83,pp.685–709.Kasahara, Hiroyuki and Rodrigue, Joel 2008, "Does the Use of Imported Intermediates Increase
Productivity?Plant‐LevelEvidence"JournalofDevelopmentEconomics87,pp.106‐118.Krishna, P., J. P. Poole, and M. Z. Senses; 2011, “Wage Effects of Trade Reform with
Endogenous Worker Mobility”, NBER Working Paper 17256. Martins,PedroS.andLucaD.Opromolla.2009.“Exports,ImportsandWages:Evidence
fromMatchedFirm‐Worker‐ProductPanels”.IZAdiscussionpaper4646.Melitz,M.J.;2003,“TheImpactofTradeonIntra‐IndustryReallocationsandAggregateIndustry Productivity”,Econometrica,71,1695‐1725.Menezes‐Filho,NaercioA.andMarc‐AndreasMuendler,2011. “LaborReallocation inResponseto
TradeReform”,NBERWorkingPaperNo.17372.Munch,J.R.andJ.R.Skaksen.2008.“HumanCapitalandWagesinExportingFirms.”Journal
ofInternationalEconomics75,363‐372.Ottaviano,GianmarcoI.P.,GiovanniPeriandGregC.Wright.2010.“Immigration,Offshoring
andAmericanJobs”,mimeo,UCDavis.Schank,Thorsten,ClausSchnabelandJoachimWagner.2007.“DoExportersReallyPay
HigherWages?FirstEvidencefromGermanLinkedEmployer‐EmployeeData.”JournalofInternationalEconomics72,52‐74.
Verhoogen,Eric.2008.“Trade,QualityUpgrading,andWageInequalityintheMexicanManufacturingSector.”QuarterlyJournalofEconomics,123(2),489‐530.
Wooldridge,JeffreyM.2002.EconometricAnalysisofCrossSectionandPanelData.TheMITPress,CambridgeandLondon.
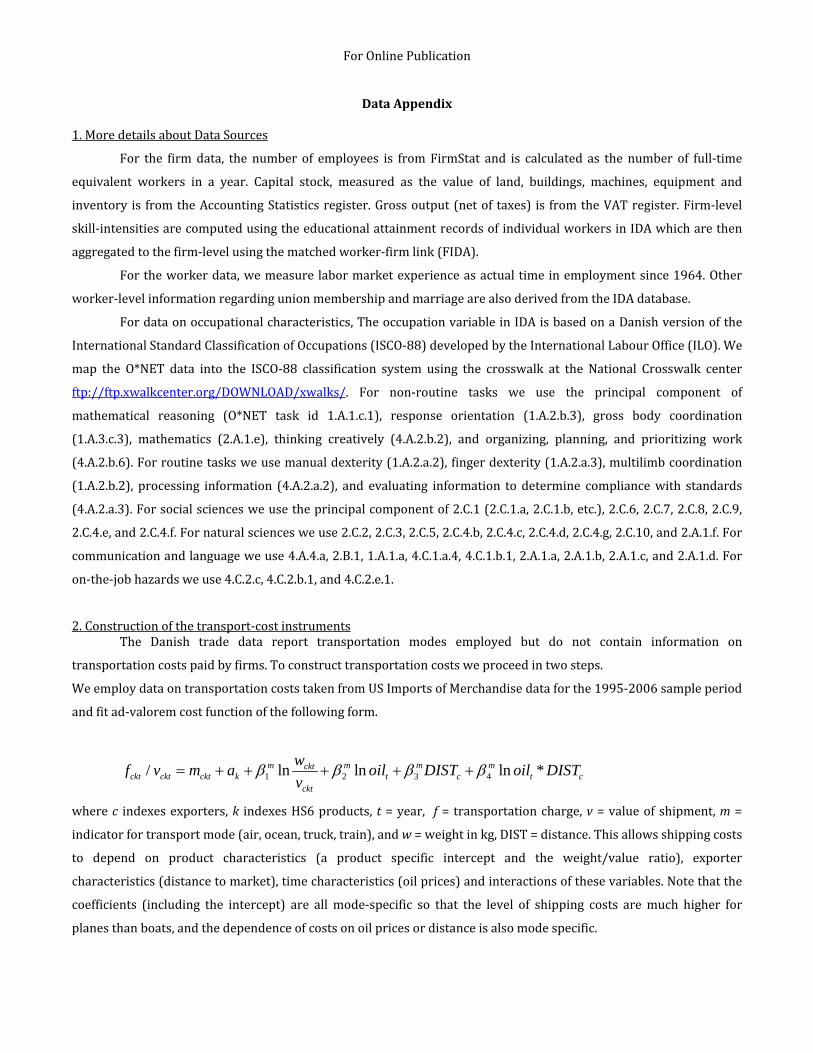
ForOnlinePublication
DataAppendix1.MoredetailsaboutDataSources
For the firmdata, the number of employees is fromFirmStat and is calculated as the number of full‐time
equivalent workers in a year. Capital stock, measured as the value of land, buildings, machines, equipment and
inventory is fromtheAccountingStatisticsregister.Grossoutput(netoftaxes) is fromtheVATregister.Firm‐level
skill‐intensitiesarecomputedusingtheeducationalattainmentrecordsofindividualworkersinIDAwhicharethen
aggregatedtothefirm‐levelusingthematchedworker‐firmlink(FIDA).
Fortheworkerdata,wemeasurelabormarketexperienceasactualtimeinemploymentsince1964.Other
worker‐levelinformationregardingunionmembershipandmarriagearealsoderivedfromtheIDAdatabase.
Fordataonoccupationalcharacteristics,TheoccupationvariableinIDAisbasedonaDanishversionofthe
InternationalStandardClassificationofOccupations(ISCO‐88)developedbytheInternationalLabourOffice(ILO).We
map the O*NET data into the ISCO‐88 classification system using the crosswalk at the National Crosswalk center
ftp://ftp.xwalkcenter.org/DOWNLOAD/xwalks/. For non‐routine tasks we use the principal component of
mathematical reasoning (O*NET task id 1.A.1.c.1), response orientation (1.A.2.b.3), gross body coordination
(1.A.3.c.3), mathematics (2.A.1.e), thinking creatively (4.A.2.b.2), and organizing, planning, and prioritizing work
(4.A.2.b.6).Forroutinetasksweusemanualdexterity(1.A.2.a.2),fingerdexterity(1.A.2.a.3),multilimbcoordination
(1.A.2.b.2), processing information (4.A.2.a.2), and evaluating information to determine compliancewith standards
(4.A.2.a.3).Forsocialsciencesweusetheprincipalcomponentof2.C.1(2.C.1.a,2.C.1.b,etc.),2.C.6,2.C.7,2.C.8,2.C.9,
2.C.4.e,and2.C.4.f.Fornaturalsciencesweuse2.C.2,2.C.3,2.C.5,2.C.4.b,2.C.4.c,2.C.4.d,2.C.4.g,2.C.10,and2.A.1.f.For
communicationandlanguageweuse4.A.4.a,2.B.1,1.A.1.a,4.C.1.a.4,4.C.1.b.1,2.A.1.a,2.A.1.b,2.A.1.c,and2.A.1.d.For
on‐the‐jobhazardsweuse4.C.2.c,4.C.2.b.1,and4.C.2.e.1.
2.Constructionofthetransport‐costinstrumentsThe Danish trade data report transportation modes employed but do not contain information on
transportationcostspaidbyfirms.Toconstructtransportationcostsweproceedintwosteps.
WeemploydataontransportationcoststakenfromUSImportsofMerchandisedataforthe1995‐2006sampleperiod
andfitad‐valoremcostfunctionofthefollowingform.
1 2 3 4/ ln ln ln *m m m mcktckt ckt ckt k t c t c
ckt
wf v m a oil DIST oil DIST
v
wherec indexesexporters,k indexesHS6products, t=year, f= transportationcharge,v=valueofshipment,m=
indicatorfortransportmode(air,ocean,truck,train),andw=weightinkg,DIST=distance.Thisallowsshippingcosts
to depend on product characteristics (a product specific intercept and the weight/value ratio), exporter
characteristics(distancetomarket),timecharacteristics(oilprices)andinteractionsofthesevariables.Notethatthe
coefficients (including the intercept) are allmode‐specific so that the level of shipping costs aremuch higher for
planesthanboats,andthedependenceofcostsonoilpricesordistanceisalsomodespecific.
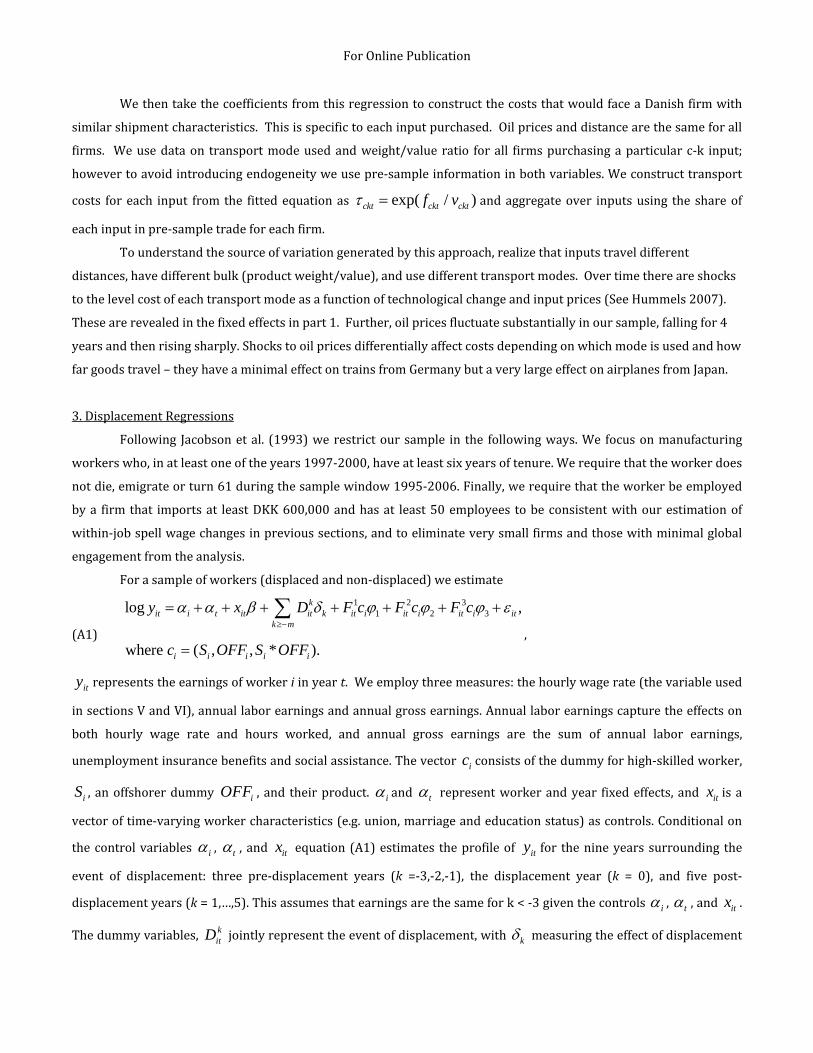
ForOnlinePublication
WethentakethecoefficientsfromthisregressiontoconstructthecoststhatwouldfaceaDanishfirmwith
similarshipmentcharacteristics.Thisisspecifictoeachinputpurchased.Oilpricesanddistancearethesameforall
firms. Weusedataon transportmodeusedandweight/value ratio forall firmspurchasingaparticular c‐k input;
howevertoavoidintroducingendogeneityweusepre‐sampleinformationinbothvariables.Weconstructtransport
costs for each input from the fittedequationas exp( / )ckt ckt cktf v andaggregateover inputsusing the shareof
eachinputinpre‐sampletradeforeachfirm.
Tounderstandthesourceofvariationgeneratedbythisapproach,realizethatinputstraveldifferent
distances,havedifferentbulk(productweight/value),andusedifferenttransportmodes.Overtimethereareshocks
tothelevelcostofeachtransportmodeasafunctionoftechnologicalchangeandinputprices(SeeHummels2007).
Thesearerevealedinthefixedeffectsinpart1.Further,oilpricesfluctuatesubstantiallyinoursample,fallingfor4
yearsandthenrisingsharply.Shockstooilpricesdifferentiallyaffectcostsdependingonwhichmodeisusedandhow
fargoodstravel–theyhaveaminimaleffectontrainsfromGermanybutaverylargeeffectonairplanesfromJapan.
3.DisplacementRegressions
Following Jacobsonetal. (1993)werestrictoursample in the followingways.We focusonmanufacturing
workerswho,inatleastoneoftheyears1997‐2000,haveatleastsixyearsoftenure.Werequirethattheworkerdoes
notdie,emigrateorturn61duringthesamplewindow1995‐2006.Finally,werequirethattheworkerbeemployed
bya firmthat importsat leastDKK600,000andhasat least50employees tobeconsistentwithourestimationof
within‐jobspellwagechangesinprevioussections,andtoeliminateverysmallfirmsandthosewithminimalglobal
engagementfromtheanalysis.
Forasampleofworkers(displacedandnon‐displaced)weestimate
(A1)
1 2 31 2 3log ,
where ( , , * ).
kit i t it it k it i it i it i it
k m
i i i i i
y x D F c F c F c
c S OFF S OFF
,
ity representstheearningsofworkeriinyeart.Weemploythreemeasures:thehourlywagerate(thevariableused
insectionsVandVI),annuallaborearningsandannualgrossearnings.Annuallaborearningscapturetheeffectson
both hourly wage rate and hours worked, and annual gross earnings are the sum of annual labor earnings,
unemploymentinsurancebenefitsandsocialassistance.Thevector ic consistsofthedummyforhigh‐skilledworker,
iS , anoffshorerdummy iOFF , and theirproduct. i and t representworkerandyear fixedeffects,and itx isa
vectoroftime‐varyingworkercharacteristics(e.g.union,marriageandeducationstatus)ascontrols.Conditionalon
thecontrolvariables i , t , and itx equation(A1)estimates theprofileof ity for thenineyearssurrounding the
event of displacement: three pre‐displacement years (k =‐3,‐2,‐1), the displacement year (k = 0), and five post‐
displacementyears(k=1,…,5).Thisassumesthatearningsarethesamefork<‐3giventhecontrols i , t ,and itx .
Thedummyvariables, kitD jointlyrepresenttheeventofdisplacement,with k
measuringtheeffectofdisplacement
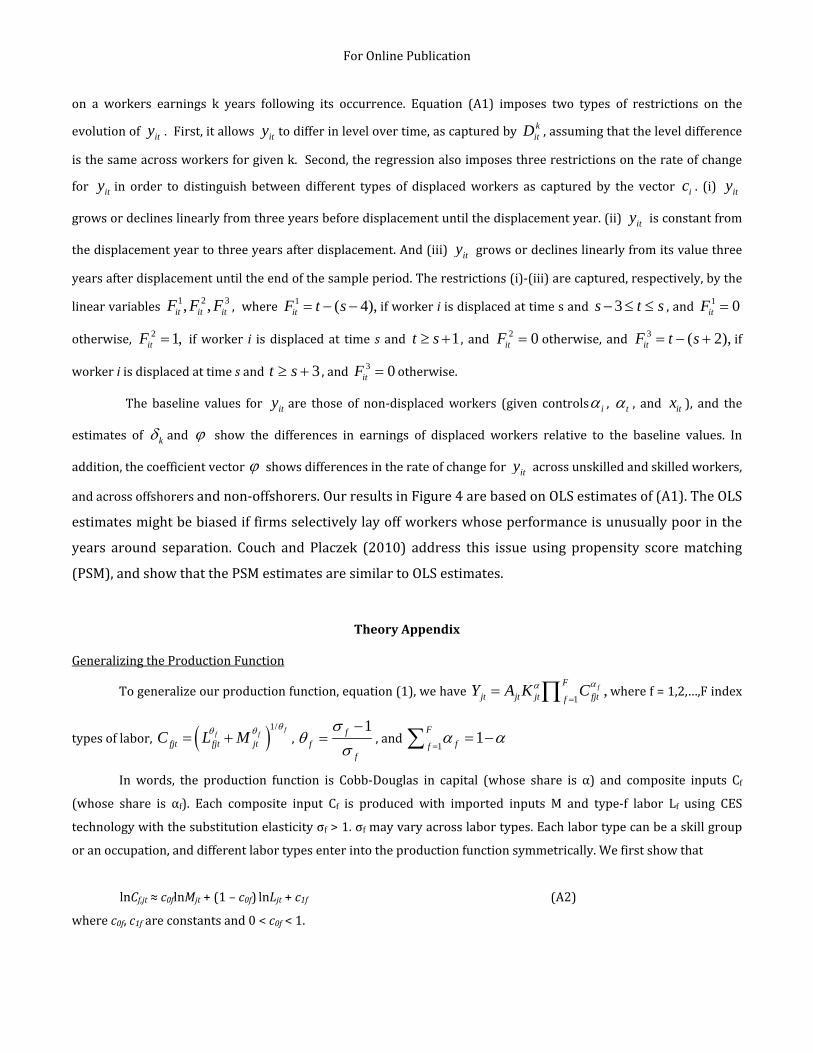
ForOnlinePublication
on a workers earnings k years following its occurrence. Equation (A1) imposes two types of restrictions on the
evolutionof ity .First,itallows ity todifferinlevelovertime,ascapturedby kitD ,assumingthattheleveldifference
isthesameacrossworkersforgivenk.Second,theregressionalsoimposesthreerestrictionsontherateofchange
for ity in order to distinguish between different types of displacedworkers as captured by the vector ic . (i) ity
growsordeclineslinearlyfromthreeyearsbeforedisplacementuntilthedisplacementyear.(ii) ity isconstantfrom
thedisplacementyeartothreeyearsafterdisplacement.And(iii) ity growsordeclineslinearlyfromitsvaluethree
yearsafterdisplacementuntiltheendofthesampleperiod.Therestrictions(i)‐(iii)arecaptured,respectively,bythe
linearvariables 1 2 3, ,it it itF F F ,where 1 ( 4),itF t s ifworkeriisdisplacedattimesand 3s t s ,and 1 0itF
otherwise, 2 1,itF ifworker i is displacedat time s and 1t s , and 2 0itF otherwise, and 3 ( 2),itF t s if
workeriisdisplacedattimesand 3t s ,and 3 0itF otherwise.
The baseline values for ity are those of non‐displacedworkers (given controls i , t , and itx ), and the
estimates of k and show the differences in earnings of displaced workers relative to the baseline values. In
addition,thecoefficientvector showsdifferencesintherateofchangefor ity acrossunskilledandskilledworkers,
andacrossoffshorersandnon‐offshorers.OurresultsinFigure4arebasedonOLSestimatesof(A1).TheOLS
estimatesmightbebiasediffirmsselectivelylayoffworkerswhoseperformanceisunusuallypoorinthe
years around separation. Couch and Placzek (2010) address this issue using propensity scorematching
(PSM),andshowthatthePSMestimatesaresimilartoOLSestimates.
TheoryAppendix
GeneralizingtheProductionFunction
Togeneralizeourproductionfunction,equation(1),wehave1
,fF
jt jt jt fjtfY A K C
wheref=1,2,…,Findex
typesoflabor, 1/ ff f
fjt fjt jtC L M ,
1ff
f
,and1
1F
ff
In words, the production function is Cobb‐Douglas in capital (whose share is α) and composite inputs Cf
(whose share is αf). Each composite input Cf is produced with imported inputs M and type‐f labor Lf using CES
technologywiththesubstitutionelasticityσf>1.σfmayvaryacrosslabortypes.Eachlabortypecanbeaskillgroup
oranoccupation,anddifferentlabortypesenterintotheproductionfunctionsymmetrically.Wefirstshowthat
lnCf,jt≈c0flnMjt+(1–c0f)lnLjt+c1f (A2)
wherec0f,c1fareconstantsand0<c0f<1.
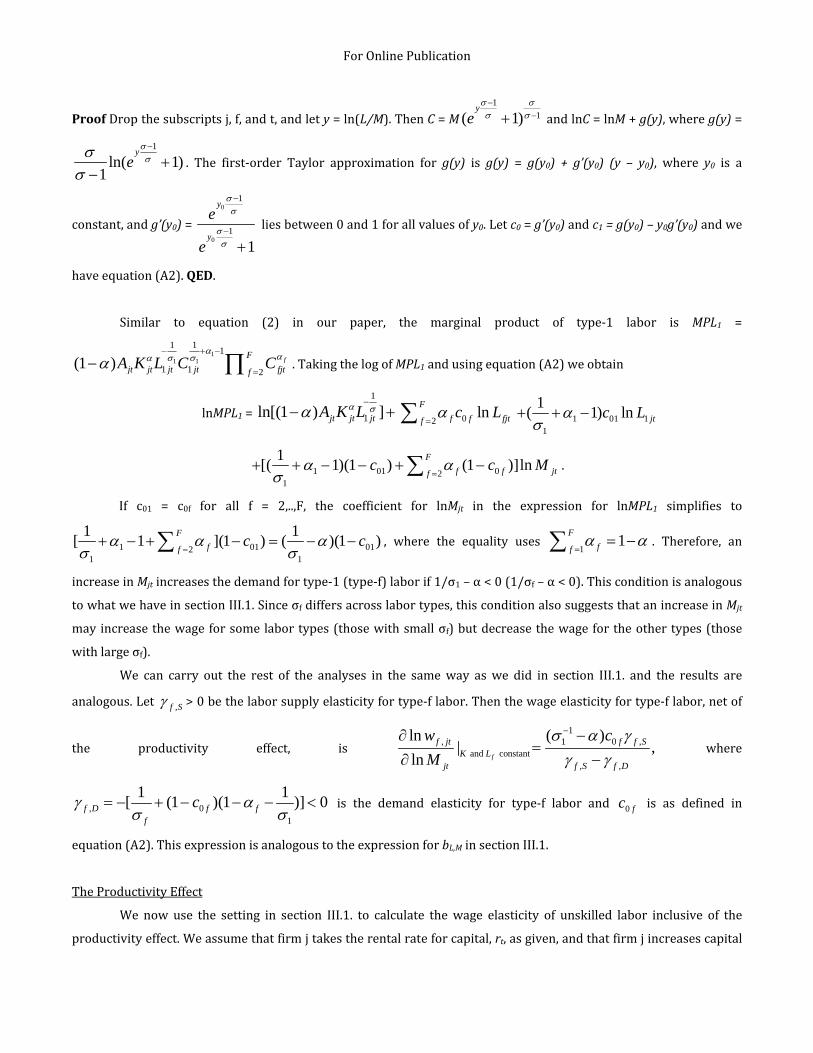
ForOnlinePublication
ProofDropthesubscriptsj,f,andt,andlety=ln(L/M).ThenC=M1
1( 1)y
e
andlnC=lnM+g(y),whereg(y)=
1
ln( 1)1
ye
. The first‐order Taylor approximation for g(y) is g(y) = g(y0) + g’(y0) (y – y0), where y0 is a
constant,andg’(y0)=0
0
1
1
1
y
y
e
e
liesbetween0and1forallvaluesofy0.Letc0=g’(y0)andc1=g(y0)–y0g’(y0)andwe
haveequation(A2).QED.
Similar to equation (2) in our paper, the marginal product of type‐1 labor is MPL1 =
11 1
1 11
1 1 2(1 ) f
F
jt jt jt jt fjtfA K L C C
.TakingthelogofMPL1andusingequation(A2)weobtain
lnMPL1=1
1ln[(1 ) ]jt jt jtA K L
02ln
F
f f fjtfc L
1 01 11
1( 1) ln jtc L
1 01 021
1[( 1)(1 ) (1 )]ln
F
f f jtfc c M
.
If c01 = c0f for all f = 2,..,F, the coefficient for lnMjt in the expression for lnMPL1 simplifies to
1 01 0121 1
1 1[ 1 ](1 ) ( )(1 )
F
ffc c
, where the equality uses
11
F
ff
. Therefore, an
increaseinMjtincreasesthedemandfortype‐1(type‐f)laborif1/σ1–α<0(1/σf–α<0).Thisconditionisanalogous
towhatwehaveinsectionIII.1.Sinceσfdiffersacrosslabortypes,thisconditionalsosuggeststhatanincreaseinMjt
may increasethewageforsomelabortypes(thosewithsmallσf)butdecreasethewagefortheothertypes(those
withlargeσf).
We can carry out the rest of the analyses in the sameway aswe did in section III.1. and the results are
analogous.Let ,f S >0bethelaborsupplyelasticityfortype‐flabor.Thenthewageelasticityfortype‐flabor,netof
the productivity effect, is1
, 1 0 , and constant
, ,
ln ( )| ,
ln f
f jt f f SK L
jt f S f D
w c
M
where
, 01
1 1[ (1 )(1 )] 0f D f f
f
c
is the demand elasticity for type‐f labor and 0 fc is as defined in
equation(A2).ThisexpressionisanalogoustotheexpressionforbL,MinsectionIII.1.
TheProductivityEffect
We now use the setting in section III.1. to calculate thewage elasticity of unskilled labor inclusive of the
productivityeffect.Weassumethatfirmjtakestherentalrateforcapital,rt,asgiven,andthatfirmjincreasescapital
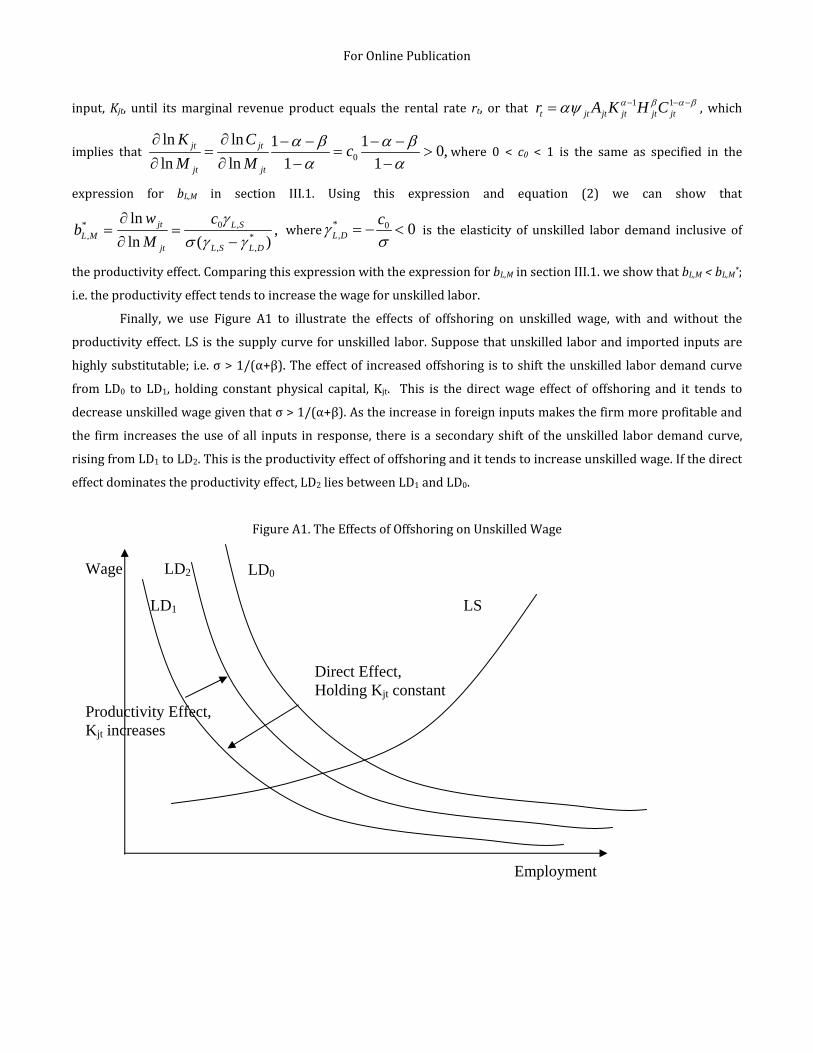
ForOnlinePublication
input,Kjt, until itsmarginal revenue product equals the rental rate rt, or that1 1
t jt jt jt jt jtr A K H C , which
implies that 0
ln ln 1 10,
ln ln 1 1jt jt
jt jt
K Cc
M M
where 0 < c0 < 1 is the same as specified in the
expression for bL,M in section III.1. Using this expression and equation (2) we can show that
* 0 ,, *
, ,
ln,
ln ( )jt L S
L Mjt L S L D
w cb
M
where * 0, 0L D
c
is the elasticity of unskilled labor demand inclusive of
theproductivityeffect.ComparingthisexpressionwiththeexpressionforbL,MinsectionIII.1.weshowthatbL,M<bL,M*;
i.e.theproductivityeffecttendstoincreasethewageforunskilledlabor.
Finally, we use Figure A1 to illustrate the effects of offshoring on unskilled wage, with and without the
productivityeffect.LSisthesupplycurveforunskilledlabor.Supposethatunskilledlaborandimportedinputsare
highlysubstitutable; i.e.σ>1/(α+β).Theeffectof increasedoffshoringistoshifttheunskilledlabordemandcurve
fromLD0 to LD1, holding constant physical capital, Kjt. This is the directwage effect of offshoring and it tends to
decreaseunskilledwagegiventhatσ>1/(α+β).Astheincreaseinforeigninputsmakesthefirmmoreprofitableand
the firm increases theuseofall inputs inresponse, there is asecondaryshiftof theunskilled labordemandcurve,
risingfromLD1toLD2.Thisistheproductivityeffectofoffshoringandittendstoincreaseunskilledwage.Ifthedirect
effectdominatestheproductivityeffect,LD2liesbetweenLD1andLD0.
FigureA1.TheEffectsofOffshoringonUnskilledWage
LS
LD0 LD2
LD1
Wage
Employment
Direct Effect, Holding Kjt constant
Productivity Effect, Kjt increases
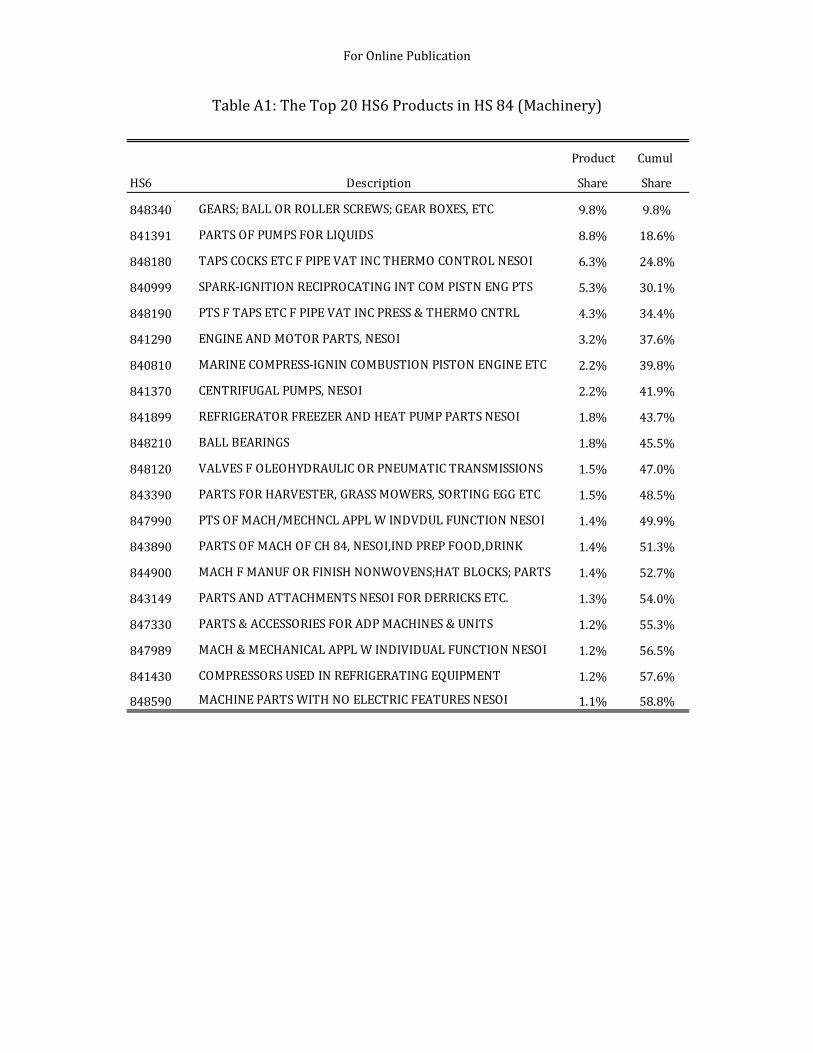
ForOnlinePublication
TableA1:TheTop20HS6ProductsinHS84(Machinery)
Product Cumul
HS6 Description Share Share
848340 GEARS;BALLORROLLERSCREWS;GEARBOXES,ETC 9.8% 9.8%
841391 PARTSOFPUMPSFORLIQUIDS 8.8% 18.6%
848180 TAPSCOCKSETCFPIPEVATINCTHERMOCONTROLNESOI 6.3% 24.8%
840999 SPARK‐IGNITIONRECIPROCATINGINTCOMPISTNENGPTS 5.3% 30.1%
848190 PTSFTAPSETCFPIPEVATINCPRESS&THERMOCNTRL 4.3% 34.4%
841290 ENGINEANDMOTORPARTS,NESOI 3.2% 37.6%
840810 MARINECOMPRESS‐IGNINCOMBUSTIONPISTONENGINEETC 2.2% 39.8%
841370 CENTRIFUGALPUMPS,NESOI 2.2% 41.9%
841899 REFRIGERATORFREEZERANDHEATPUMPPARTSNESOI 1.8% 43.7%
848210 BALLBEARINGS 1.8% 45.5%
848120 VALVESFOLEOHYDRAULICORPNEUMATICTRANSMISSIONS 1.5% 47.0%
843390 PARTSFORHARVESTER,GRASSMOWERS,SORTINGEGGETC 1.5% 48.5%
847990 PTSOFMACH/MECHNCLAPPLWINDVDULFUNCTIONNESOI 1.4% 49.9%
843890 PARTSOFMACHOFCH84,NESOI,INDPREPFOOD,DRINK 1.4% 51.3%
844900 MACHFMANUFORFINISHNONWOVENS;HATBLOCKS;PARTS 1.4% 52.7%
843149 PARTSANDATTACHMENTSNESOIFORDERRICKSETC. 1.3% 54.0%
847330 PARTS&ACCESSORIESFORADPMACHINES&UNITS 1.2% 55.3%
847989 MACH&MECHANICALAPPLWINDIVIDUALFUNCTIONNESOI 1.2% 56.5%
841430 COMPRESSORSUSEDINREFRIGERATINGEQUIPMENT 1.2% 57.6%
848590 MACHINEPARTSWITHNOELECTRICFEATURESNESOI 1.1% 58.8%
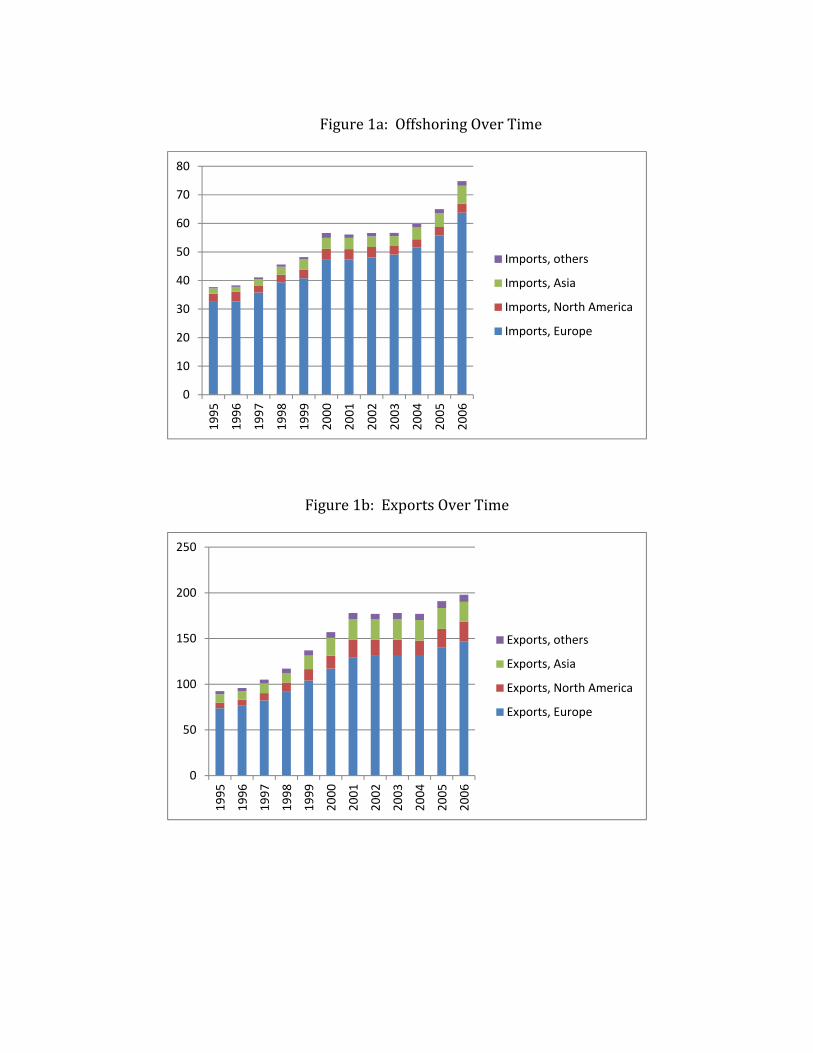
Figure1a:OffshoringOverTime
Figure1b:ExportsOverTime
0
10
20
30
40
50
60
70
80
1995
1996
1997
1998
1999
2000
2001
2002
2003
2004
2005
2006
Imports, others
Imports, Asia
Imports, North America
Imports, Europe
0
50
100
150
200
250
1995
1996
1997
1998
1999
2000
2001
2002
2003
2004
2005
2006
Exports, others
Exports, Asia
Exports, North America
Exports, Europe
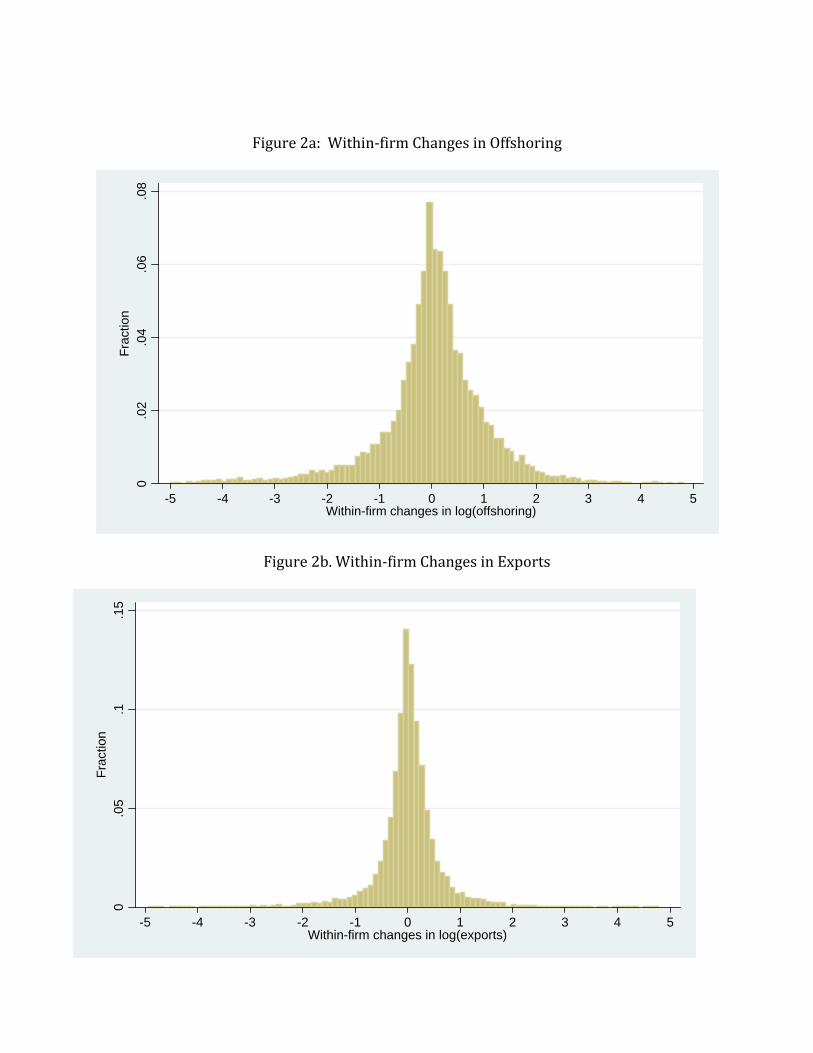
Figure2a:Within‐firmChangesinOffshoring
Figure2b.Within‐firmChangesinExports
0.0
2.0
4.0
6.0
8F
ract
ion
-5 -4 -3 -2 -1 0 1 2 3 4 5Within-firm changes in log(offshoring)
0.0
5.1
.15
Fra
ctio
n
-5 -4 -3 -2 -1 0 1 2 3 4 5Within-firm changes in log(exports)
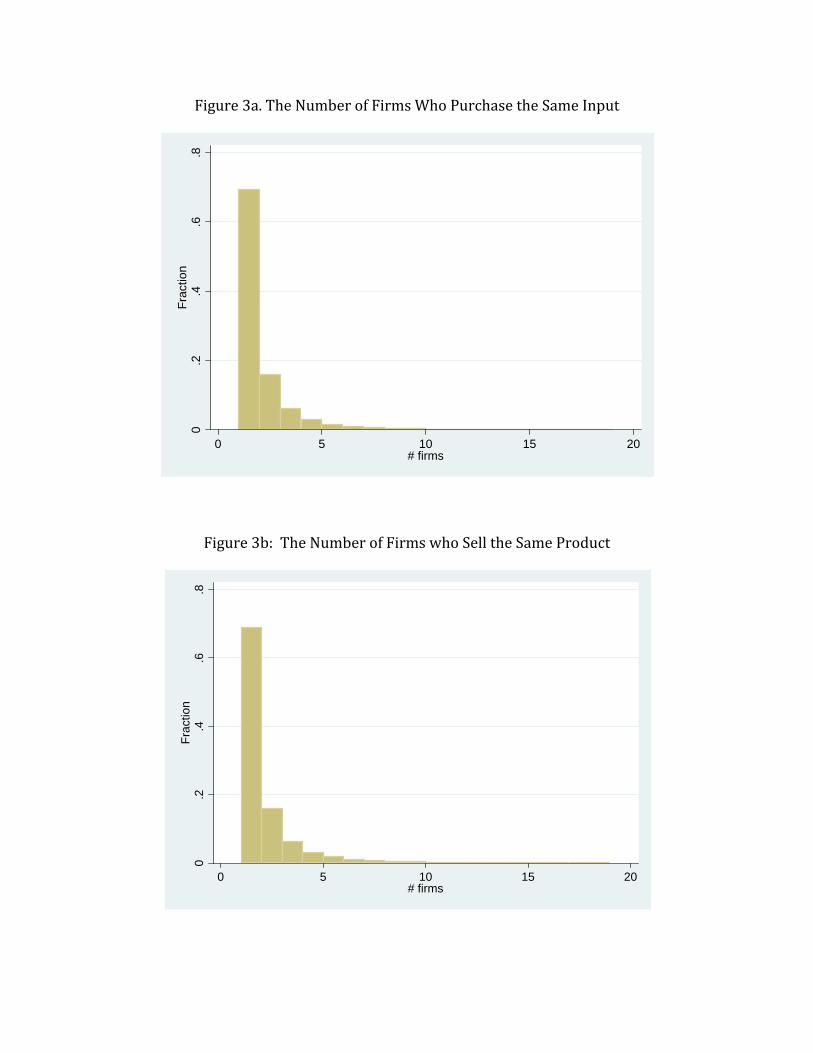
Figure3a.TheNumberofFirmsWhoPurchasetheSameInput
Figure3b:TheNumberofFirmswhoSelltheSameProduct
0.2
.4.6
.8F
ract
ion
0 5 10 15 20# firms
0.2
.4.6
.8F
ract
ion
0 5 10 15 20# firms
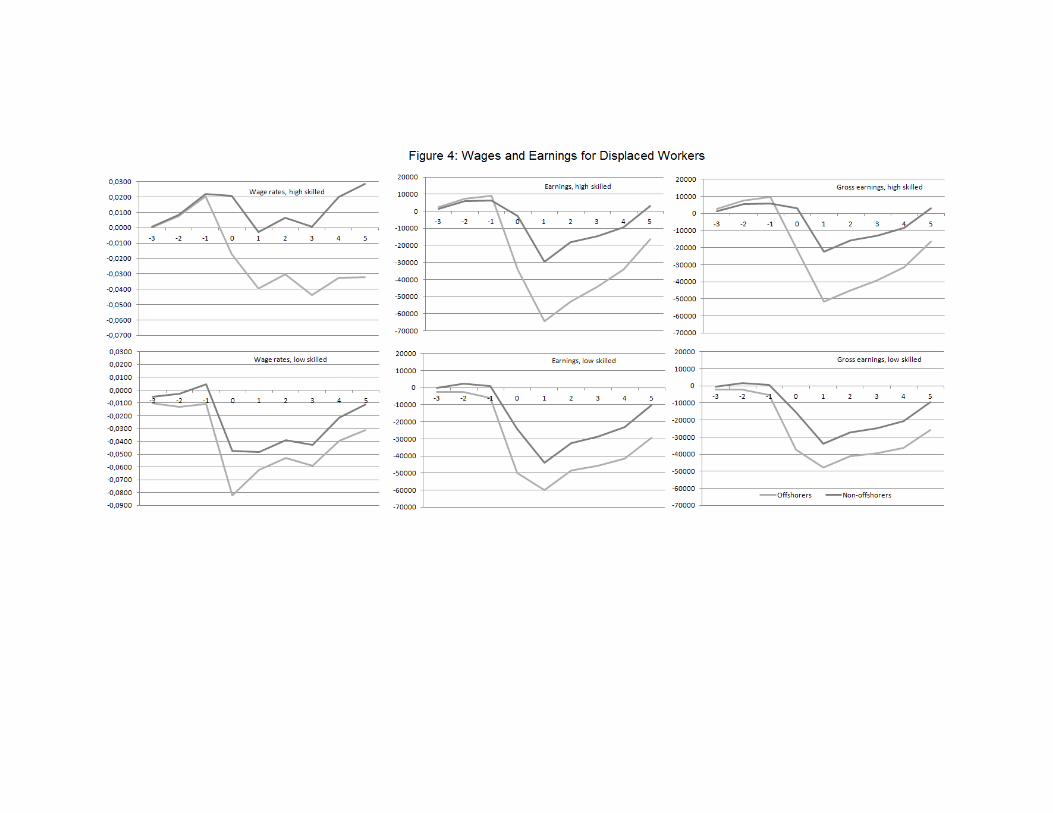
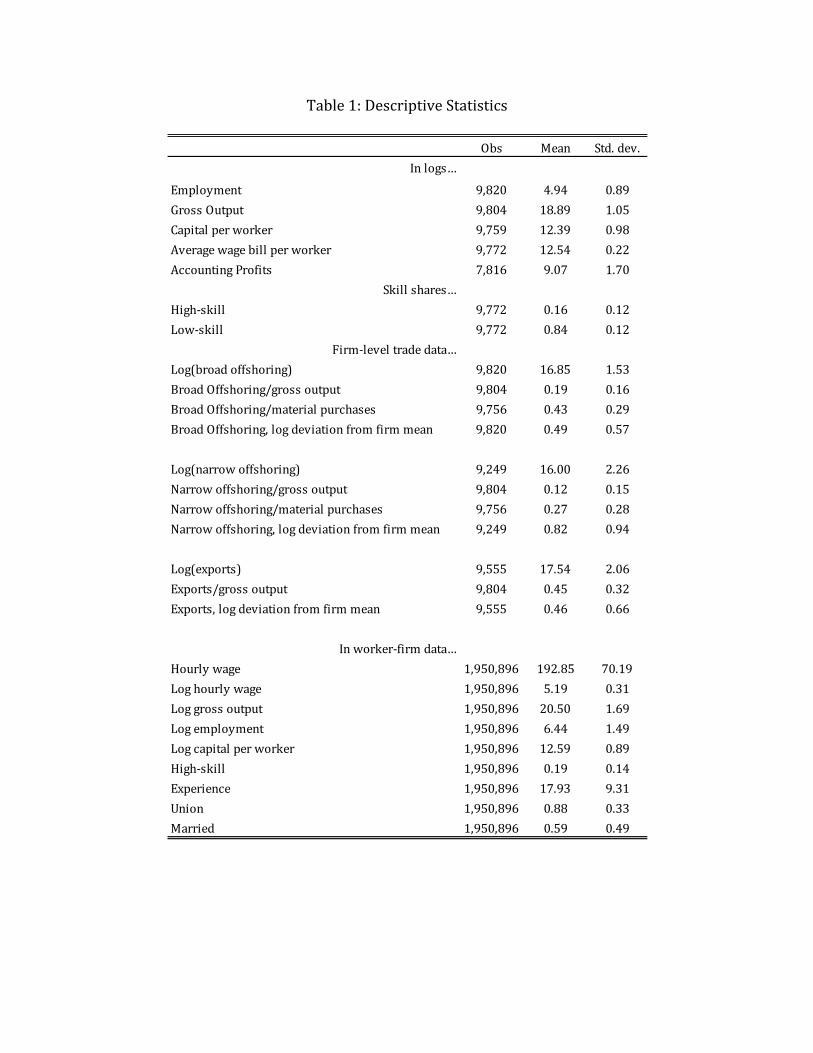
Table1:DescriptiveStatistics
Obs Mean Std.dev.
Inlogs…
Employment 9,820 4.94 0.89
GrossOutput 9,804 18.89 1.05
Capitalperworker 9,759 12.39 0.98
Averagewagebillperworker 9,772 12.54 0.22
AccountingProfits 7,816 9.07 1.70
Skillshares…
High‐skill 9,772 0.16 0.12
Low‐skill 9,772 0.84 0.12
Firm‐leveltradedata…
Log(broadoffshoring) 9,820 16.85 1.53
BroadOffshoring/grossoutput 9,804 0.19 0.16
BroadOffshoring/materialpurchases 9,756 0.43 0.29
BroadOffshoring,logdeviationfromfirmmean 9,820 0.49 0.57
Log(narrowoffshoring) 9,249 16.00 2.26
Narrowoffshoring/grossoutput 9,804 0.12 0.15
Narrowoffshoring/materialpurchases 9,756 0.27 0.28
Narrowoffshoring,logdeviationfromfirmmean 9,249 0.82 0.94
Log(exports) 9,555 17.54 2.06
Exports/grossoutput 9,804 0.45 0.32
Exports,logdeviationfromfirmmean 9,555 0.46 0.66
Inworker‐firmdata…
Hourlywage 1,950,896 192.85 70.19
Loghourlywage 1,950,896 5.19 0.31
Loggrossoutput 1,950,896 20.50 1.69
Logemployment 1,950,896 6.44 1.49
Logcapitalperworker 1,950,896 12.59 0.89
High‐skill 1,950,896 0.19 0.14
Experience 1,950,896 17.93 9.31
Union 1,950,896 0.88 0.33
Married 1,950,896 0.59 0.49
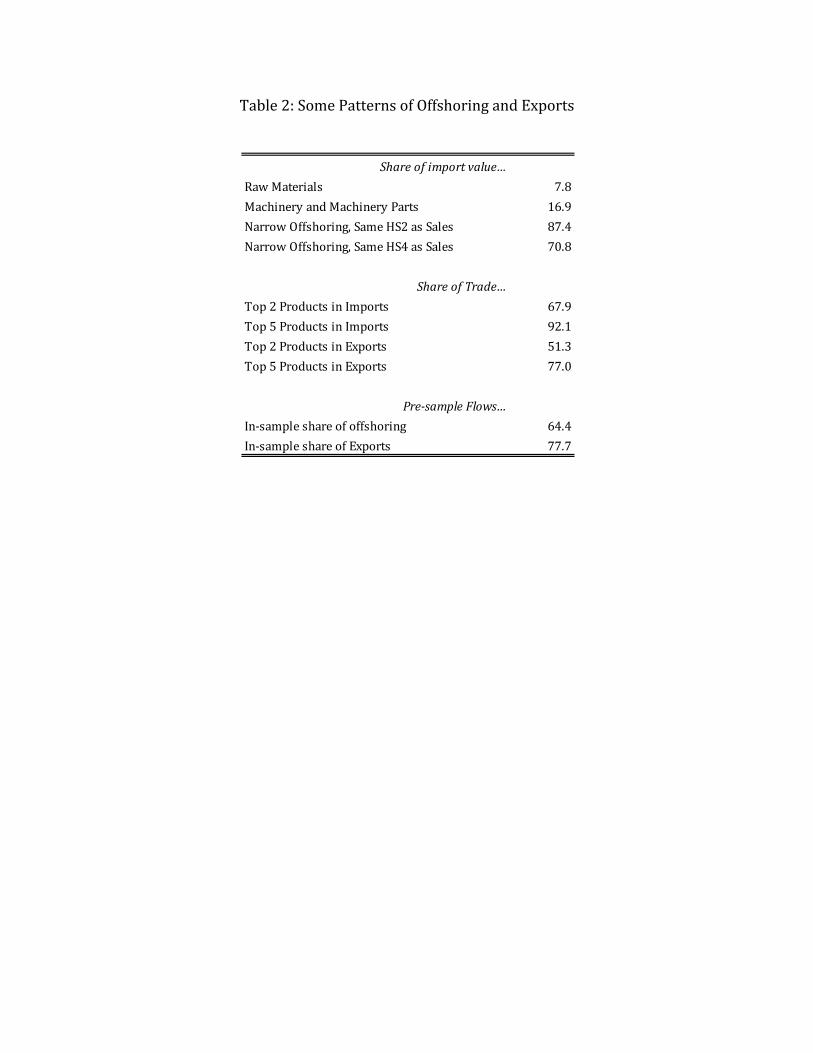
Table2:SomePatternsofOffshoringandExports
Shareofimportvalue…
RawMaterials 7.8
MachineryandMachineryParts 16.9
NarrowOffshoring,SameHS2asSales 87.4
NarrowOffshoring,SameHS4asSales 70.8
ShareofTrade…
Top2ProductsinImports 67.9
Top5ProductsinImports 92.1
Top2ProductsinExports 51.3
Top5ProductsinExports 77.0
Pre‐sampleFlows…
In‐sampleshareofoffshoring 64.4
In‐sampleshareofExports 77.7
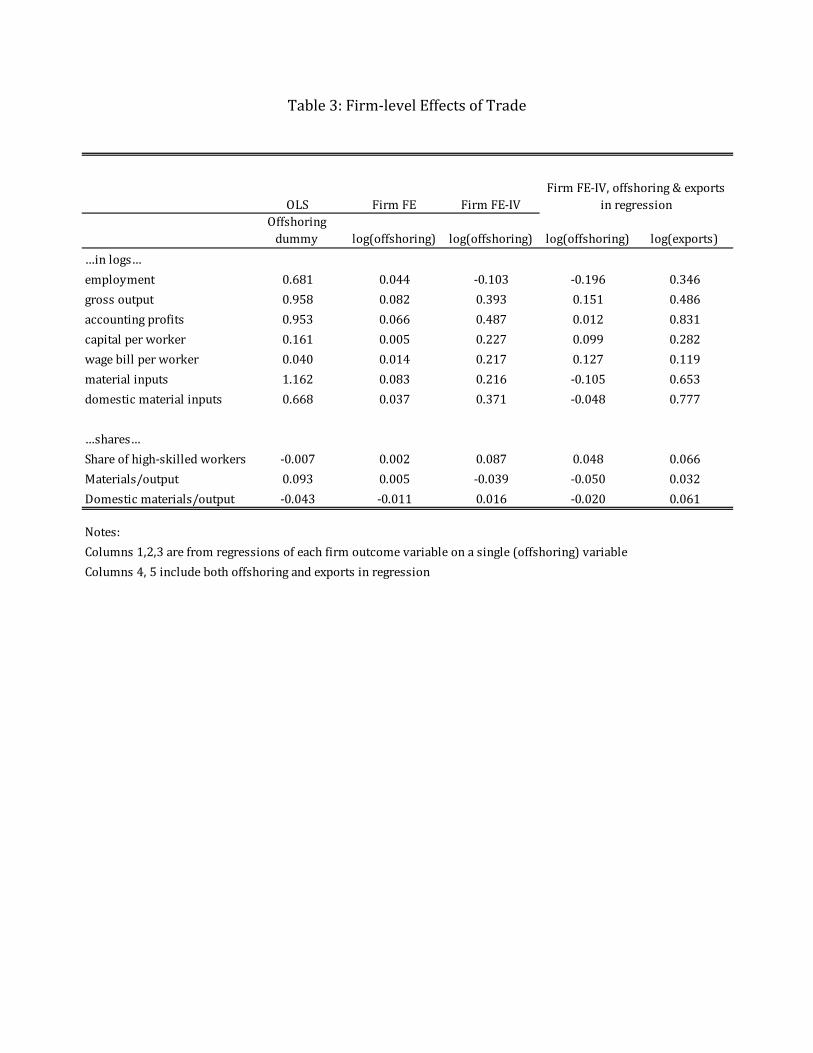
Table3:Firm‐levelEffectsofTrade
OLS FirmFE FirmFE‐IVOffshoringdummy log(offshoring) log(offshoring) log(offshoring) log(exports)
…inlogs…
employment 0.681 0.044 ‐0.103 ‐0.196 0.346
grossoutput 0.958 0.082 0.393 0.151 0.486
accountingprofits 0.953 0.066 0.487 0.012 0.831
capitalperworker 0.161 0.005 0.227 0.099 0.282
wagebillperworker 0.040 0.014 0.217 0.127 0.119
materialinputs 1.162 0.083 0.216 ‐0.105 0.653
domesticmaterialinputs 0.668 0.037 0.371 ‐0.048 0.777
…shares…
Shareofhigh‐skilledworkers ‐0.007 0.002 0.087 0.048 0.066
Materials/output 0.093 0.005 ‐0.039 ‐0.050 0.032
Domesticmaterials/output ‐0.043 ‐0.011 0.016 ‐0.020 0.061
Notes:
Columns1,2,3arefromregressionsofeachfirmoutcomevariableonasingle(offshoring)variable
Columns4,5includebothoffshoringandexportsinregression
FirmFE‐IV,offshoring&exportsinregression
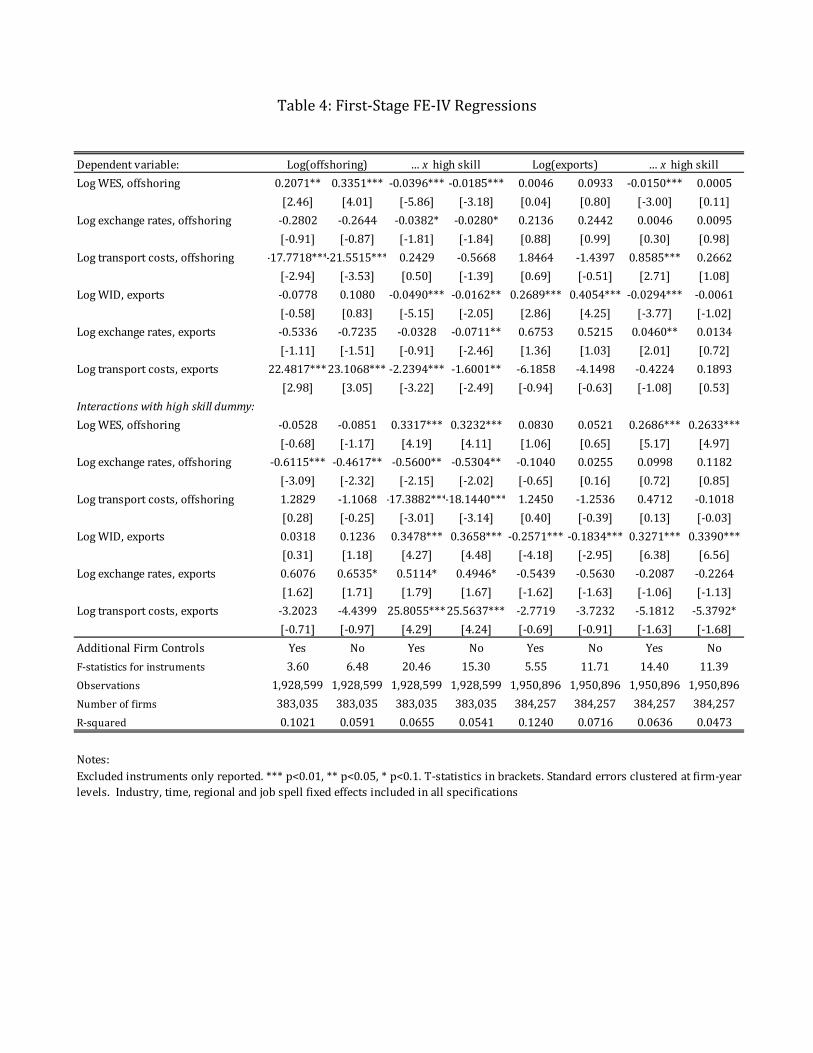
Table4:First‐StageFE‐IVRegressions
Dependentvariable:
LogWES,offshoring 0.2071** 0.3351*** ‐0.0396*** ‐0.0185*** 0.0046 0.0933 ‐0.0150*** 0.0005
[2.46] [4.01] [‐5.86] [‐3.18] [0.04] [0.80] [‐3.00] [0.11]
Logexchangerates,offshoring ‐0.2802 ‐0.2644 ‐0.0382* ‐0.0280* 0.2136 0.2442 0.0046 0.0095
[‐0.91] [‐0.87] [‐1.81] [‐1.84] [0.88] [0.99] [0.30] [0.98]
Logtransportcosts,offshoring ‐17.7718***‐21.5515*** 0.2429 ‐0.5668 1.8464 ‐1.4397 0.8585*** 0.2662
[‐2.94] [‐3.53] [0.50] [‐1.39] [0.69] [‐0.51] [2.71] [1.08]
LogWID,exports ‐0.0778 0.1080 ‐0.0490*** ‐0.0162** 0.2689*** 0.4054*** ‐0.0294*** ‐0.0061
[‐0.58] [0.83] [‐5.15] [‐2.05] [2.86] [4.25] [‐3.77] [‐1.02]
Logexchangerates,exports ‐0.5336 ‐0.7235 ‐0.0328 ‐0.0711** 0.6753 0.5215 0.0460** 0.0134
[‐1.11] [‐1.51] [‐0.91] [‐2.46] [1.36] [1.03] [2.01] [0.72]
Logtransportcosts,exports 22.4817***23.1068*** ‐2.2394*** ‐1.6001** ‐6.1858 ‐4.1498 ‐0.4224 0.1893
[2.98] [3.05] [‐3.22] [‐2.49] [‐0.94] [‐0.63] [‐1.08] [0.53]
Interactionswithhighskilldummy:
LogWES,offshoring ‐0.0528 ‐0.0851 0.3317*** 0.3232*** 0.0830 0.0521 0.2686*** 0.2633***
[‐0.68] [‐1.17] [4.19] [4.11] [1.06] [0.65] [5.17] [4.97]
Logexchangerates,offshoring ‐0.6115*** ‐0.4617** ‐0.5600** ‐0.5304** ‐0.1040 0.0255 0.0998 0.1182
[‐3.09] [‐2.32] [‐2.15] [‐2.02] [‐0.65] [0.16] [0.72] [0.85]
Logtransportcosts,offshoring 1.2829 ‐1.1068 ‐17.3882***‐18.1440*** 1.2450 ‐1.2536 0.4712 ‐0.1018
[0.28] [‐0.25] [‐3.01] [‐3.14] [0.40] [‐0.39] [0.13] [‐0.03]
LogWID,exports 0.0318 0.1236 0.3478*** 0.3658*** ‐0.2571*** ‐0.1834*** 0.3271*** 0.3390***
[0.31] [1.18] [4.27] [4.48] [‐4.18] [‐2.95] [6.38] [6.56]
Logexchangerates,exports 0.6076 0.6535* 0.5114* 0.4946* ‐0.5439 ‐0.5630 ‐0.2087 ‐0.2264
[1.62] [1.71] [1.79] [1.67] [‐1.62] [‐1.63] [‐1.06] [‐1.13]
Logtransportcosts,exports ‐3.2023 ‐4.4399 25.8055***25.5637*** ‐2.7719 ‐3.7232 ‐5.1812 ‐5.3792*
[‐0.71] [‐0.97] [4.29] [4.24] [‐0.69] [‐0.91] [‐1.63] [‐1.68]
AdditionalFirmControls Yes No Yes No Yes No Yes No
F‐statisticsforinstruments 3.60 6.48 20.46 15.30 5.55 11.71 14.40 11.39
Observations 1,928,599 1,928,599 1,928,599 1,928,599 1,950,896 1,950,896 1,950,896 1,950,896
Numberoffirms 383,035 383,035 383,035 383,035 384,257 384,257 384,257 384,257
R‐squared 0.1021 0.0591 0.0655 0.0541 0.1240 0.0716 0.0636 0.0473
Notes:Excluded instruments only reported. *** p<0.01, ** p<0.05, * p<0.1. T‐statistics in brackets. Standard errors clustered at firm‐yearlevels.Industry,time,regionalandjobspellfixedeffectsincludedinallspecifications
Log(offshoring) Log(exports)...x highskill ...xhighskill
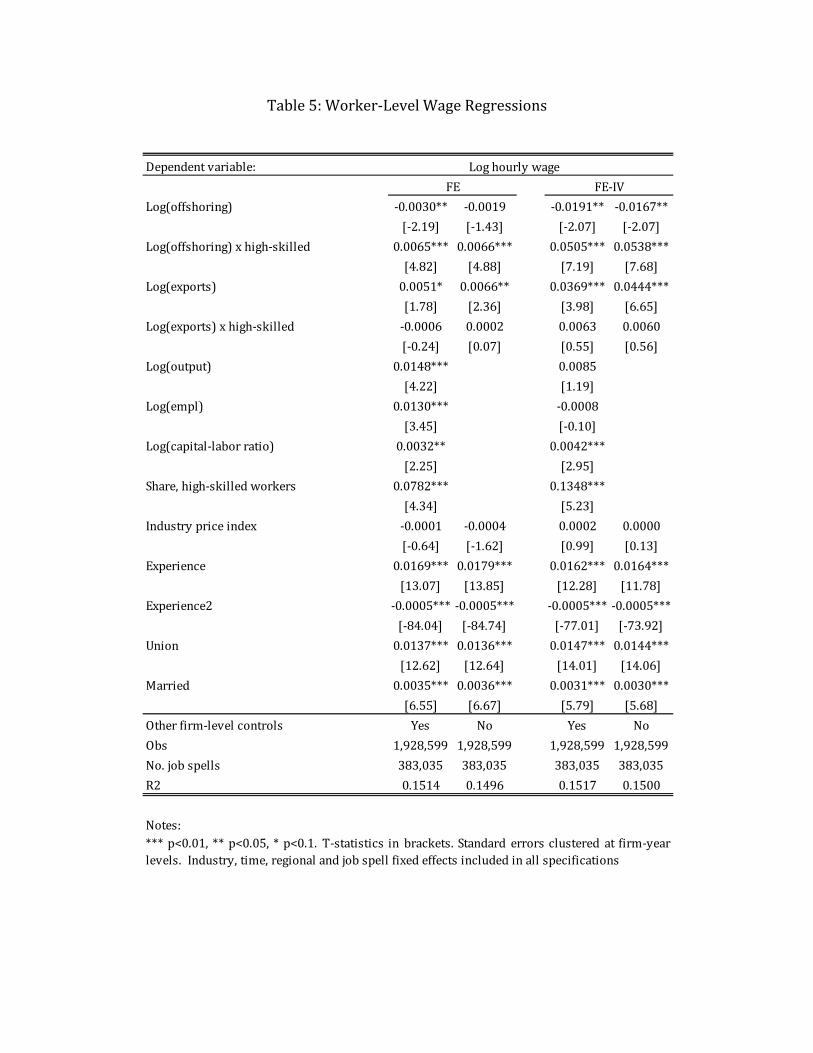
Table5:Worker‐LevelWageRegressions
Dependentvariable:
Log(offshoring) ‐0.0030** ‐0.0019 ‐0.0191** ‐0.0167**
[‐2.19] [‐1.43] [‐2.07] [‐2.07]
Log(offshoring)xhigh‐skilled 0.0065*** 0.0066*** 0.0505*** 0.0538***
[4.82] [4.88] [7.19] [7.68]
Log(exports) 0.0051* 0.0066** 0.0369*** 0.0444***
[1.78] [2.36] [3.98] [6.65]
Log(exports)xhigh‐skilled ‐0.0006 0.0002 0.0063 0.0060
[‐0.24] [0.07] [0.55] [0.56]
Log(output) 0.0148*** 0.0085
[4.22] [1.19]
Log(empl) 0.0130*** ‐0.0008
[3.45] [‐0.10]
Log(capital‐laborratio) 0.0032** 0.0042***
[2.25] [2.95]
Share,high‐skilledworkers 0.0782*** 0.1348***
[4.34] [5.23]
Industrypriceindex ‐0.0001 ‐0.0004 0.0002 0.0000
[‐0.64] [‐1.62] [0.99] [0.13]
Experience 0.0169*** 0.0179*** 0.0162*** 0.0164***
[13.07] [13.85] [12.28] [11.78]
Experience2 ‐0.0005*** ‐0.0005*** ‐0.0005*** ‐0.0005***
[‐84.04] [‐84.74] [‐77.01] [‐73.92]
Union 0.0137*** 0.0136*** 0.0147*** 0.0144***
[12.62] [12.64] [14.01] [14.06]
Married 0.0035*** 0.0036*** 0.0031*** 0.0030***
[6.55] [6.67] [5.79] [5.68]
Otherfirm‐levelcontrols Yes No Yes No
Obs 1,928,599 1,928,599 1,928,599 1,928,599
No.jobspells 383,035 383,035 383,035 383,035
R2 0.1514 0.1496 0.1517 0.1500
Notes:*** p<0.01, ** p<0.05, * p<0.1. T‐statistics in brackets. Standard errors clustered at firm‐yearlevels.Industry,time,regionalandjobspellfixedeffectsincludedinallspecifications
Loghourlywage
FE FE‐IV
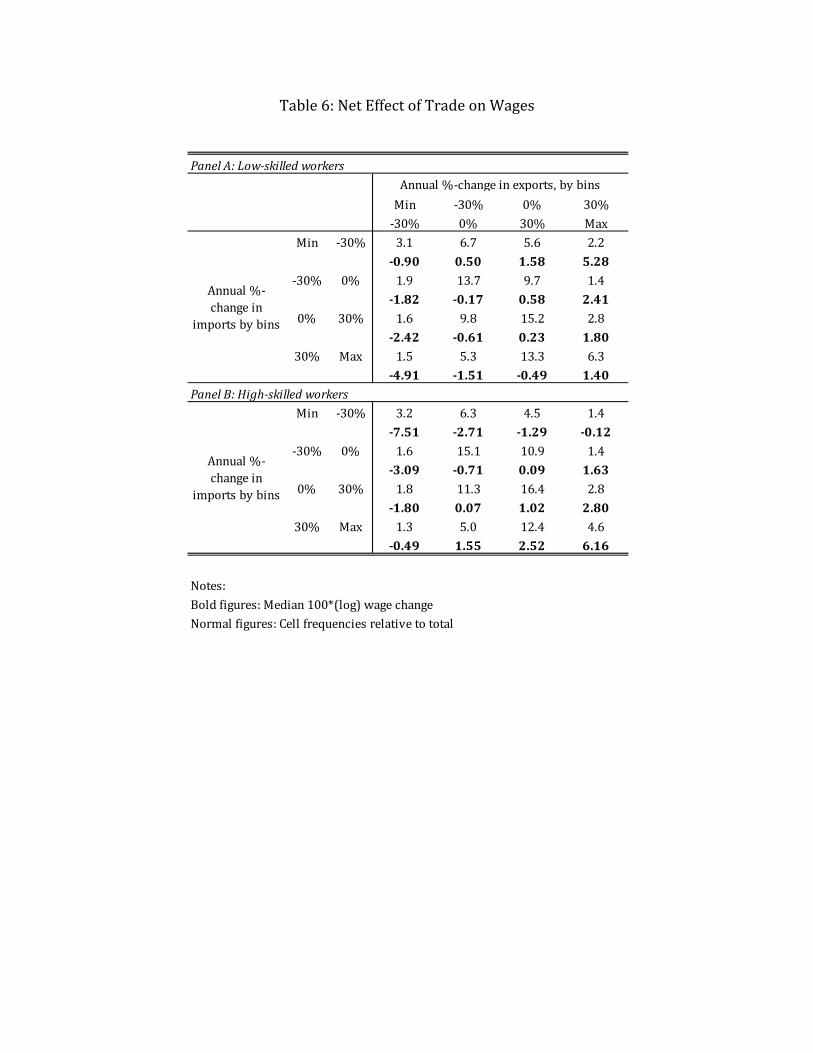
Table6:NetEffectofTradeonWages
PanelA:Low‐skilledworkers
Min ‐30% 0% 30%‐30% 0% 30% Max
Min ‐30% 3.1 6.7 5.6 2.2‐0.90 0.50 1.58 5.28
‐30% 0% 1.9 13.7 9.7 1.4‐1.82 ‐0.17 0.58 2.41
0% 30% 1.6 9.8 15.2 2.8‐2.42 ‐0.61 0.23 1.80
30% Max 1.5 5.3 13.3 6.3‐4.91 ‐1.51 ‐0.49 1.40
PanelB:High‐skilledworkersMin ‐30% 3.2 6.3 4.5 1.4
‐7.51 ‐2.71 ‐1.29 ‐0.12
‐30% 0% 1.6 15.1 10.9 1.4‐3.09 ‐0.71 0.09 1.63
0% 30% 1.8 11.3 16.4 2.8‐1.80 0.07 1.02 2.80
30% Max 1.3 5.0 12.4 4.6‐0.49 1.55 2.52 6.16
Notes:
Boldfigures:Median100*(log)wagechangeNormalfigures:Cellfrequenciesrelativetototal
Annual%‐changeinexports,bybins
Annual%‐changein
importsbybins
Annual%‐changein
importsbybins
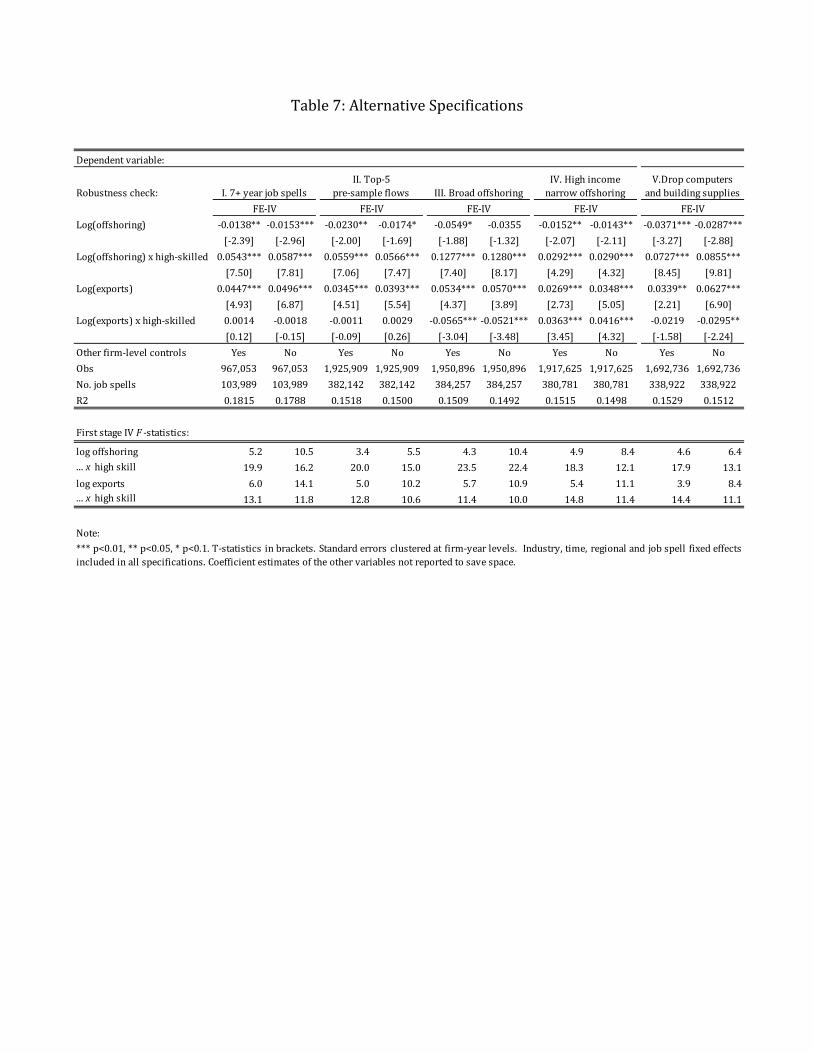
Table7:AlternativeSpecifications
Dependentvariable:
Robustnesscheck:
Log(offshoring) ‐0.0138** ‐0.0153*** ‐0.0230** ‐0.0174* ‐0.0549* ‐0.0355 ‐0.0152** ‐0.0143** ‐0.0371*** ‐0.0287***
[‐2.39] [‐2.96] [‐2.00] [‐1.69] [‐1.88] [‐1.32] [‐2.07] [‐2.11] [‐3.27] [‐2.88]
Log(offshoring)xhigh‐skilled 0.0543*** 0.0587*** 0.0559*** 0.0566*** 0.1277*** 0.1280*** 0.0292*** 0.0290*** 0.0727*** 0.0855***
[7.50] [7.81] [7.06] [7.47] [7.40] [8.17] [4.29] [4.32] [8.45] [9.81]
Log(exports) 0.0447*** 0.0496*** 0.0345*** 0.0393*** 0.0534*** 0.0570*** 0.0269*** 0.0348*** 0.0339** 0.0627***
[4.93] [6.87] [4.51] [5.54] [4.37] [3.89] [2.73] [5.05] [2.21] [6.90]
Log(exports)xhigh‐skilled 0.0014 ‐0.0018 ‐0.0011 0.0029 ‐0.0565*** ‐0.0521*** 0.0363*** 0.0416*** ‐0.0219 ‐0.0295**
[0.12] [‐0.15] [‐0.09] [0.26] [‐3.04] [‐3.48] [3.45] [4.32] [‐1.58] [‐2.24]
Otherfirm‐levelcontrols Yes No Yes No Yes No Yes No Yes No
Obs 967,053 967,053 1,925,909 1,925,909 1,950,896 1,950,896 1,917,625 1,917,625 1,692,736 1,692,736
No.jobspells 103,989 103,989 382,142 382,142 384,257 384,257 380,781 380,781 338,922 338,922
R2 0.1815 0.1788 0.1518 0.1500 0.1509 0.1492 0.1515 0.1498 0.1529 0.1512
FirststageIVF ‐statistics:
logoffshoring 5.2 10.5 3.4 5.5 4.3 10.4 4.9 8.4 4.6 6.4...xhighskill 19.9 16.2 20.0 15.0 23.5 22.4 18.3 12.1 17.9 13.1
logexports 6.0 14.1 5.0 10.2 5.7 10.9 5.4 11.1 3.9 8.4...xhighskill 13.1 11.8 12.8 10.6 11.4 10.0 14.8 11.4 14.4 11.1
Note:
V.Dropcomputersandbuildingsupplies
FE‐IV
*** p<0.01, ** p<0.05, * p<0.1. T‐statistics in brackets. Standard errors clustered at firm‐year levels. Industry, time, regional and job spell fixed effectsincludedinallspecifications.Coefficientestimatesoftheothervariablesnotreportedtosavespace.
I.7+yearjobspells
FE‐IVFE‐IV FE‐IV
II.Top‐5pre‐sampleflows III.Broadoffshoring
IV.Highincomenarrowoffshoring
FE‐IV
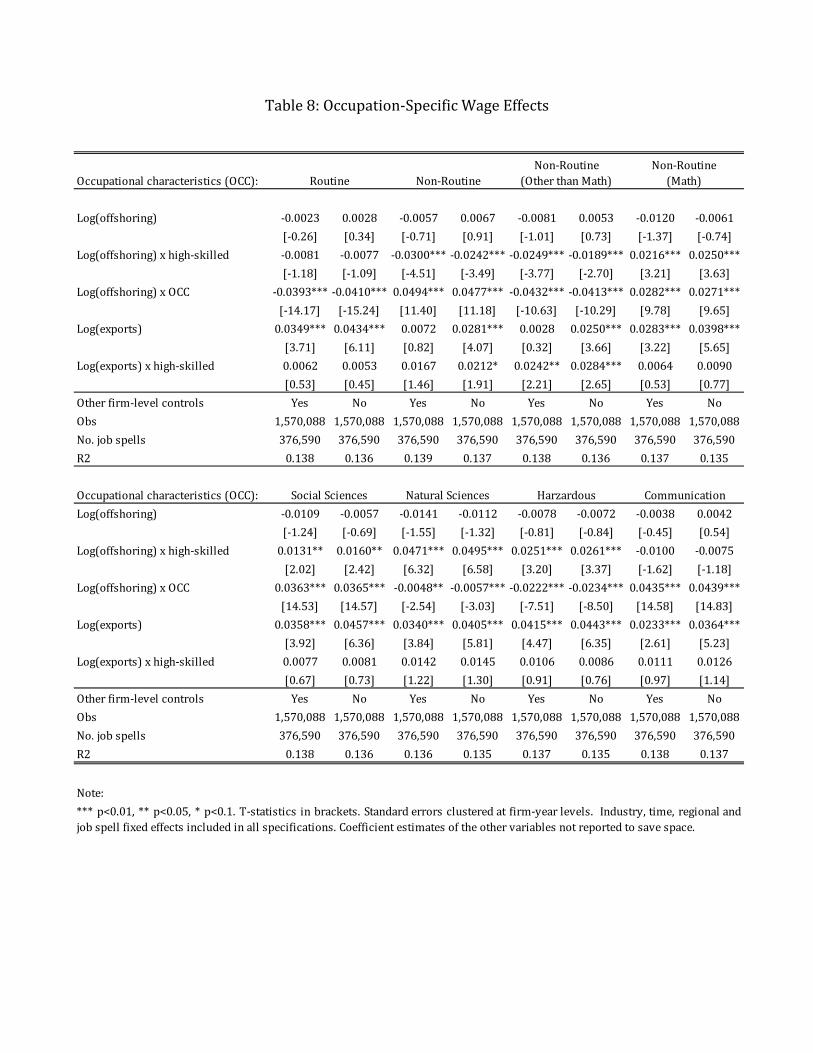
Table8:Occupation‐SpecificWageEffects
Occupationalcharacteristics(OCC):
Log(offshoring) ‐0.0023 0.0028 ‐0.0057 0.0067 ‐0.0081 0.0053 ‐0.0120 ‐0.0061
[‐0.26] [0.34] [‐0.71] [0.91] [‐1.01] [0.73] [‐1.37] [‐0.74]
Log(offshoring)xhigh‐skilled ‐0.0081 ‐0.0077 ‐0.0300*** ‐0.0242*** ‐0.0249*** ‐0.0189*** 0.0216*** 0.0250***
[‐1.18] [‐1.09] [‐4.51] [‐3.49] [‐3.77] [‐2.70] [3.21] [3.63]
Log(offshoring)xOCC ‐0.0393*** ‐0.0410*** 0.0494*** 0.0477*** ‐0.0432*** ‐0.0413*** 0.0282*** 0.0271***
[‐14.17] [‐15.24] [11.40] [11.18] [‐10.63] [‐10.29] [9.78] [9.65]
Log(exports) 0.0349*** 0.0434*** 0.0072 0.0281*** 0.0028 0.0250*** 0.0283*** 0.0398***
[3.71] [6.11] [0.82] [4.07] [0.32] [3.66] [3.22] [5.65]
Log(exports)xhigh‐skilled 0.0062 0.0053 0.0167 0.0212* 0.0242** 0.0284*** 0.0064 0.0090
[0.53] [0.45] [1.46] [1.91] [2.21] [2.65] [0.53] [0.77]
Otherfirm‐levelcontrols Yes No Yes No Yes No Yes No
Obs 1,570,088 1,570,088 1,570,088 1,570,088 1,570,088 1,570,088 1,570,088 1,570,088
No.jobspells 376,590 376,590 376,590 376,590 376,590 376,590 376,590 376,590
R2 0.138 0.136 0.139 0.137 0.138 0.136 0.137 0.135
Occupationalcharacteristics(OCC):
Log(offshoring) ‐0.0109 ‐0.0057 ‐0.0141 ‐0.0112 ‐0.0078 ‐0.0072 ‐0.0038 0.0042
[‐1.24] [‐0.69] [‐1.55] [‐1.32] [‐0.81] [‐0.84] [‐0.45] [0.54]
Log(offshoring)xhigh‐skilled 0.0131** 0.0160** 0.0471*** 0.0495*** 0.0251*** 0.0261*** ‐0.0100 ‐0.0075
[2.02] [2.42] [6.32] [6.58] [3.20] [3.37] [‐1.62] [‐1.18]
Log(offshoring)xOCC 0.0363*** 0.0365*** ‐0.0048** ‐0.0057*** ‐0.0222*** ‐0.0234*** 0.0435*** 0.0439***
[14.53] [14.57] [‐2.54] [‐3.03] [‐7.51] [‐8.50] [14.58] [14.83]
Log(exports) 0.0358*** 0.0457*** 0.0340*** 0.0405*** 0.0415*** 0.0443*** 0.0233*** 0.0364***
[3.92] [6.36] [3.84] [5.81] [4.47] [6.35] [2.61] [5.23]
Log(exports)xhigh‐skilled 0.0077 0.0081 0.0142 0.0145 0.0106 0.0086 0.0111 0.0126
[0.67] [0.73] [1.22] [1.30] [0.91] [0.76] [0.97] [1.14]
Otherfirm‐levelcontrols Yes No Yes No Yes No Yes No
Obs 1,570,088 1,570,088 1,570,088 1,570,088 1,570,088 1,570,088 1,570,088 1,570,088
No.jobspells 376,590 376,590 376,590 376,590 376,590 376,590 376,590 376,590
R2 0.138 0.136 0.136 0.135 0.137 0.135 0.138 0.137
Note:
*** p<0.01, ** p<0.05, * p<0.1. T‐statistics in brackets. Standard errors clustered at firm‐year levels. Industry, time, regional andjobspellfixedeffectsincludedinallspecifications.Coefficientestimatesoftheothervariablesnotreportedtosavespace.
Non‐Routine(Math)
SocialSciences Harzardous Communication
Routine Non‐Routine
NaturalSciences
Non‐Routine(OtherthanMath)