The revolution at face value. The invention of the Turkish ...

© Oliver Wyman
THE VOLUME-TO-VALUE REVOLUTION JULY 20, 2014
Adrian Slywotzky

Value Migration®

2 2 © Oliver Wyman | AJS-20140720-AHA-San Diego
Value Migration®
$ B
B
$ B
B
US Steel Nucor US Airways Southwest Airlines
Sears Walmart Compaq Dell Motorola Nokia

3 3 © Oliver Wyman | AJS-20140720-AHA-San Diego
-12
-10
-8
-6
-4
-2
0
2
4
6
8
'71 '73 '75 '77 '79 '81 '83 '85 '87 '89 '91 '93 '95 '97 '99 '01 '03 '05 '07
Net
Pro
fit (1
995
$BB
)
Source: Air Transport Association of America. +46.54/–58.50
No profit zone: Airline industry example Industry net profit

4 4 © Oliver Wyman | AJS-20140720-AHA-San Diego
Evolving no profit zones
• Airlines
• Consumer electronics
• PCs
• Homeowner’s insurance
• Cars
• Beverage in grocery
• Films
• Agriculture
• Environmental remediation
• Lots of manufacturing

5 5 © Oliver Wyman | AJS-20140720-AHA-San Diego
Are there any evolving no-profit zones in healthcare?
• 2014?
• 2017?

Market share – a very tricky idea

7 7 © Oliver Wyman | AJS-20140720-AHA-San Diego
0%
5%
10%
15%
0% 10% 20% 30% 40% 50%
Prof
itabi
lity
Market share
Chrysler
Ford
GM
Automotive – 1970s

8 8 © Oliver Wyman | AJS-20140720-AHA-San Diego
Automotive – 1990
0%
5%
10%
15%
0% 10% 20% 30% 40%
Chrysler
Ford GM
Prof
itabi
lity
Market share

9 9 © Oliver Wyman | AJS-20140720-AHA-San Diego
Automotive – 2002
0%
5%
10%
15%
0% 10% 20% 30%
Chrysler GM
Ford
Prof
itabi
lity
Market share

10 10 © Oliver Wyman | AJS-20140720-AHA-San Diego
Automotive – 2008
-25%
-20%
-15%
-10%
-5%
0%
5%
10%
15%
0% 10% 20% 30%
Chrysler
Ford
GM
Prof
itabi
lity
Market share

11 11 © Oliver Wyman | AJS-20140720-AHA-San Diego
My business design
Customer selection
Profit model
Strategic control
Today Next
Scope
Unique value proposition
Organization

12 12 © Oliver Wyman | AJS-20140720-AHA-San Diego
The biggest problem in business …
is staying with your previously successful business model
one year too long.

13 13 © Oliver Wyman | AJS-20140720-AHA-San Diego
Why is it …
that the mental model of industry leaders
lags the market
by 2–3 years?

14 14 © Oliver Wyman | AJS-20140720-AHA-San Diego
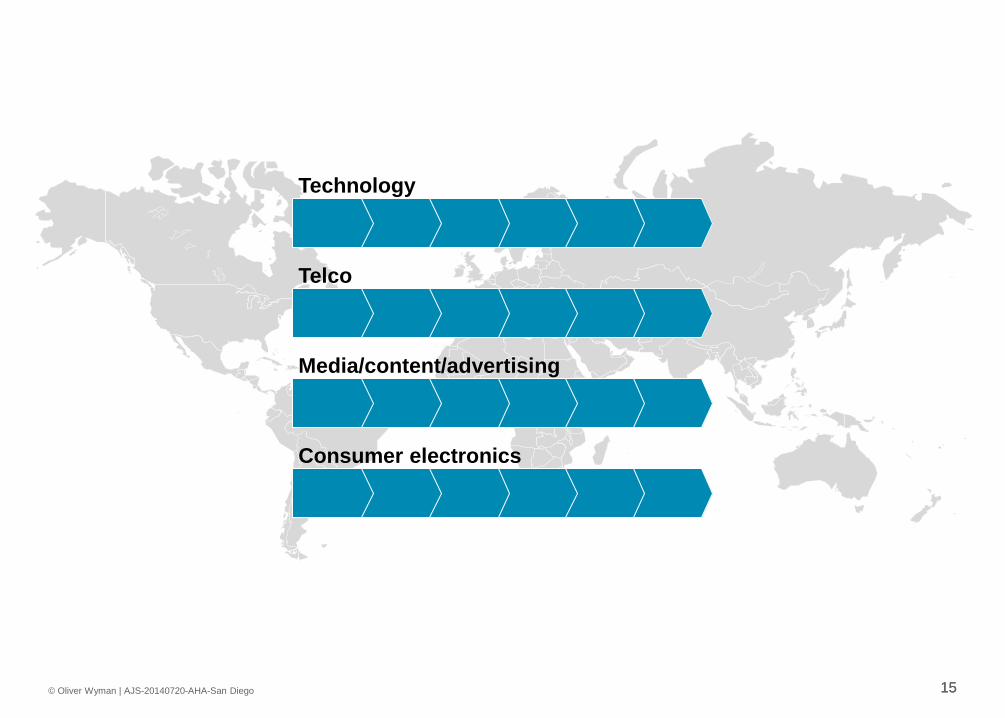
What happens when industries collide?
15 15 © Oliver Wyman | AJS-20140720-AHA-San Diego
Technology
Media/content/advertising
Telco
Consumer electronics

16 16 © Oliver Wyman | AJS-20140720-AHA-San Diego
The Four-Chain World consumer
Jennifer Stone: 50-year-old, small business owner

17 17 © Oliver Wyman | AJS-20140720-AHA-San Diego
The Four-Chain World consumer
Jennifer Stone: 50-year-old, small business owner

18 18 © Oliver Wyman | AJS-20140720-AHA-San Diego
Bloomberg Get updated information for stocks and markets
iXpenseit Create expense reports and summaries
Omni Invoice Generate sales quotes and customer invoices
OmniFocus Track tasks by project, place, person, or date
Streamtime Track customer information
FileMagnet Wirelessly transfer files from desktop computer
iShare Connect to Microsoft
SharePoint Server
Oracle Business Approvals for Managers Make intelligent business decisions on the go
LinkedIn Access your professional
network and contacts
iSpreadsheet Create, edit, and share
spreadsheets
Managing my business
Jennifer Stone: 50-year-old, small business owner

19 19 © Oliver Wyman | AJS-20140720-AHA-San Diego
Starting to manage my health?
RunKeeper
Weight Watchers Mobile
Nike+ Running
WebMD Map My Run
Healthline
First Aid by American Red Cross
Kaiser Permanente
Restaurant Nutrition
Fitbit
SparkPeople
ZocDoc
My Pregnancy Today
Healthy Diet & Grocery Food Scanner
iTriage
Vitals
HealthTap
CVS Caremark
The Eatery
Rite Aid
AARP Magazine

20 20 © Oliver Wyman | AJS-20140720-AHA-San Diego
Data comparison/ download problems
Incomplete information
Many screens and computers
A la carte pricing
Multiple logins
Multiple connections/ subscriptions
Easy to manipulate: access and downloading
Sleek dual-screen terminal
Single comprehensive platform
With Bloomberg
Without Bloomberg:
Bloomberg’s little box/big box value proposition The financial trading frustration chain: life without/with Bloomberg

21 © Oliver Wyman | AJS-20140720-AHA-San Diego
The trader’s terminal The physician’s desktop?
• 30,000 functions • Consistent/comparable data • Analytical templates • Creating algorithms
• Patient history • Predictive modeling • Best protocols • Best process controls/checklists • Diagnostic algorithm
“I have all I need at my fingertips.” What would the physician say?

22 22 © Oliver Wyman | AJS-20140720-AHA-San Diego
2000 value 2010 value
$2.6 trillion $1.6 trillion 21 Leaders
$80 billion $1 trillion 11 Cross-chain players
3% 40% Share of value
Value Migration® Four-Chain World

23 23 © Oliver Wyman | AJS-20140720-AHA-San Diego
Technology
Media/content/advertising
Telco
Consumer electronics
The Four-Chain World is really about the customers, not about industry value chains.

24 24 © Oliver Wyman | AJS-20140720-AHA-San Diego
Technology
Telco
Consumer electronics
Media/content/advertising
The customer’s hassle map

25 25 © Oliver Wyman | AJS-20140720-AHA-San Diego
The key point of the Four-Chain World
• Start with the customer
• Ask: – Who owns the hassle map of the customer? – Connect the dots to fix it. – Who is improving it the most quickly?

26 26 © Oliver Wyman | AJS-20140720-AHA-San Diego
E-book
• “Huge threat to my business”
• “Huge opportunity to create better experience for the customer
“Cool device”
The laws of perception: What do you see?

27 27 © Oliver Wyman | AJS-20140720-AHA-San Diego
What new things will my team have to learn in the next three years?

28 28 © Oliver Wyman | AJS-20140720-AHA-San Diego
$ B
B
$
$50
$100
$150
$200
$250
$300
$350
$400
Apple
Sony
Market capitalization: Sony versus Apple
2007 2001 2003 2005 2009 1999 2011

29 29 © Oliver Wyman | AJS-20140720-AHA-San Diego
$ B
B
$
$50
$100
$150
$200
$250
2007 2003 2005 2009 2011
Walt Disney
News Corp Time Warner
Viacom
2001
Value Migration®: Market capitalization

30 30 © Oliver Wyman | AJS-20140720-AHA-San Diego
X X Tech
Media
“Different clocks"

The Second Half of the Game

King Kong Godzilla vs.

33 33 © Oliver Wyman | AJS-20140720-AHA-San Diego
Tech Telco
Media
Consumer electronics
Tech
Telco
Media
Consumer electronics
Retail
Education
Tech
Financial services
Healthcare
Four chains to eight

34 34 © Oliver Wyman | AJS-20140720-AHA-San Diego
Healthcare convergence
• Cross-chain competition
• Hassle map
• The upside-down pyramid
• Capacity dislocations
• Compete/collaborate ratio

35 35 © Oliver Wyman | AJS-20140720-AHA-San Diego
Tech
• iPhone/iPad apps – iTriage
• Android ecosystem
• WellTok
• Castlight Health
• Cisco Telehealth
• IBM Watson

36 36 © Oliver Wyman | AJS-20140720-AHA-San Diego
Retail
Q: What is retail?
A: $900 BN looking for growth
Market cap Revenue Walmart 200 BN 500 BN
CVS 60 BN 100 BN
Walgreen’s 30 BN 70 BN
Kroger 13 BN 90 BN
Rite-Aid 2 BN 25 BN
Target 40 BN 70 BN
~ 350 BN ~ 900 BN

37 37 © Oliver Wyman | AJS-20140720-AHA-San Diego
Retailers
• Drugstores solved growth problem with cosmetics
• Discounters with grocery
• Both need more
• They think differently: – Sales per square foot – Foot traffic – Inventory turns – GM/square foot
• Now they’re starting to think Share of Wallet.
• They have the cards. They want more.

38 38 © Oliver Wyman | AJS-20140720-AHA-San Diego
Retail: Rapid evolution
Diagnostics
Simple coordination (with PCPs)
Telehealth
Wellness programs
distribution
Kiosk/ information
Acute episodic, flu shots

39 39 © Oliver Wyman | AJS-20140720-AHA-San Diego
Tech/Telco
“They love hassle maps”
Retail
Healthcare
New sources of competition for value
“They love high costs”

40 40 © Oliver Wyman | AJS-20140720-AHA-San Diego
No Coordination
of Care
Hard to fit patients in schedule
Lack resources to manage chronic
illnesses
Doctors Wait weeks
to see doctor
Too many patients, too little
time
No time or $ to talk end of life
Emotionally attached
Byzantine billing
More billing staff than nurses
Hard to be ideal doc
Professional frustration
Miss Appointments
Problems go unnoticed
Can’t Drive
Complicated referrals
15-20 medications
Patient
Expensive hospitalization
Multiple specialists
Conflicting treatments
No holistic care
Emergency? Call 911
Expensive co-pays
No end-of-life plan
Health Plan
Redundant treatment
Hard to find quality docs
Costly senior care
Risk of adverse selection
death spiral
Need to minimize
costs Staff focused on costs, not prevention
Small margin for Medicare patients Denial of
coverage
Even the toughest hassle maps are opportunities U.S. healthcare

41 41 © Oliver Wyman | AJS-20140720-AHA-San Diego
Afghanistan Stability/COIN Dynamics

42 42 © Oliver Wyman | AJS-20140720-AHA-San Diego
Healthcare = Hassle Map Heaven

43 43 © Oliver Wyman | AJS-20140720-AHA-San Diego
• Ellen
• Dan
• Joe

44 44 © Oliver Wyman | AJS-20140720-AHA-San Diego
• Impaired quality of life • Cost: $25,000
+$200/mo for oxygen
Difficulty breathing, onset of edema
Day 7
Steps on wireless
scale, +3lbs
Day 1
• Quality of life maintained
• Cost: $600
Fee-for-service
CareMore
Cough up frothy
sputum
Day 13
CareMore nurse calls, makes appt, sends car
Day 1
Ventilator, drugs, cardiac catheter
Days 14–19
Permanent damage,
on oxygen indefinitely?
Day 19+?
Sees NP, new Rx
Day 1
CareMore Clinic
Call 911 & emergency
room
Day 14
Hospital
Source: Interview with Alan Hoops, CareMore Senior Medical Officer and CEO respectively, conducted by Adrian Slywotzky and Karl Weber (08/10/2010); Zipprich, Bernard, “Interview with Dr. Carlos Cowley, cardiologist,” (10/5/2010); 56% figure comes from “Delivering Integrated Patient Care for Seniors,” CareMore (11/2008), p. 35
56% FEWER READMISSIONS
Crisis passes
Day 7
Fluid build up
Day 1
Fluid build up
Day 1
How do we reduce hospitalizations for CHF patients? Illustrative

45 45 © Oliver Wyman | AJS-20140720-AHA-San Diego
Recovery days Consultation Diagnostic
tests Pre-op prep Procedure
90 days post-op
follow-through
Geisinger – Standardization
• One invoice/one price • One point of accountability • Pro-patient standardization
$112K
$88K

46 46 © Oliver Wyman | AJS-20140720-AHA-San Diego
The upside-down pyramid
Innovations
Financial incentives to stay fit, health screenings, convenient access
Fixed bundled payments, EBM, standard protocols, checklists
Coordinated care, prevention, compliance, hospice, capitated payment
Costs Patients
Healthy, minor health issues
At-risk for major procedures (e.g. cardiology, oncology)
Polychronic, end of life
20%
5%
75%
35%
45%
20%

47 47 © Oliver Wyman | AJS-20140720-AHA-San Diego
Savings & Reinvestment
Focus on Top 5%
Savings & Reinvestment
Focus on Top 10%
Focus on Top 1%

48 48 © Oliver Wyman | AJS-20140720-AHA-San Diego
Employers
• Transfer risk: Deductibles and donut holes
• Information
• Incentives
• Support, coaching
• Experimentation
• Culture
• Self-reinforcing upward spiral

49 49 © Oliver Wyman | AJS-20140720-AHA-San Diego
Great employers are already connecting with great providers to get radically better outcomes for their employees:
• Lowes with Cleveland Clinic
• IBM with providers in Arizona
• Boeing experimenting with providers in Seattle

50 50 © Oliver Wyman | AJS-20140720-AHA-San Diego
A cascade of capacity dislocations
• Retail General practitioners
• Care teams Hospitals
Specialists
• Care teams Hospitals
(+ Tech + Retail) Specialists

51 51 © Oliver Wyman | AJS-20140720-AHA-San Diego
What will happen to competitive intensity?
• Internal competition ↑
• Cross-chain competition ↑
• Risk of downward spiral
Recall 2.6 → 1.6

52 52 © Oliver Wyman | AJS-20140720-AHA-San Diego
Business design challenges
• Hospitals – New revenue
• Medical groups – ACO plus profit model
• Insurers – What’s my next big piece of value added?
• Retailer – Profitable growth

53 53 © Oliver Wyman | AJS-20140720-AHA-San Diego
Industry profit margin
Collaboration should begin
Collaboration begins
Change the compete/collaborate ratio soon enough to make a difference
Compete/collaborate: Timing

54 54 © Oliver Wyman | AJS-20140720-AHA-San Diego
Compete
100
90
80
70
60
50
Collaborate
0
10
20
30
40
50
• What is the compete/ collaborate ratio in my industry today?
• What should be my compete/collaborate ratio?
Compete/collaborate: Ratio

55 55 © Oliver Wyman | AJS-20140720-AHA-San Diego
“Where do we allocate capital to activities that give us no differentiation?”

56 56 © Oliver Wyman | AJS-20140720-AHA-San Diego
Tech/Telco
Retail
Healthcare
Collaborations

57 57 © Oliver Wyman | AJS-20140720-AHA-San Diego
Globalization: Informational economics
• Mobile ecosystem
• Telehealth
• Social networking
• Watson
• Genomics
When intensely regional (HC) meets intensely global (info), global wins.
– Not a regional business
– Not a regional business
– Not a regional business
– Not a regional business
– Not a regional business

58 58 © Oliver Wyman | AJS-20140720-AHA-San Diego
Market 2.0
Care Teams
Quantified Self
Open Exchanges

59 59 © Oliver Wyman | AJS-20140720-AHA-San Diego
27,820
5,739
0
5,000
10,000
15,000
20,000
25,000
30,000
Dec 10 Dec 09 Dec 08 May 13 Dec 12 Dec 11
0
100
200
300
400
500
600
700
Q4 2010 Q4 2011 Q4 2012 Q4 2013
Clinicians
Sites
Note: Clinicians include physicians, physicians’ assistants, and nurse practitioners Source: http://www.ncqa.org/Portals/0/Public%20Policy/2013%20PDFS/
pcmh%202011%20fact%20sheet.pdf
Source: Leavitt Partners Center for Accountable Care Intelligence
ACO growth
606
NCQA PCMH growth

60 60 © Oliver Wyman | AJS-20140720-AHA-San Diego
The Resource Pyramid
• A much broader base for the pyramid
• “Top of license” on steroids
• Costs significantly lower
Doctors
Nurses Behaviorists
Medical Assistants
PCMHs Smart Care Team
Retail
Telehealth
Self-directed consumers
The power of the extended care team Leverage: Adding ultra-low-cost capacity to smart care teams
D N B
MA
Prevention Excellence

61 61 © Oliver Wyman | AJS-20140720-AHA-San Diego
12 17
55
70
89
0
10
20
30
40
50
60
70
80
90
100
2009 2010 2011 2012 2013
Num
ber o
f rou
nds
Number of rounds over $2M
7x growth over 5 years
Source: Crunchbase data referenced at http://techcrunch.com/2014/01/15/vcs-investing-to-heal-u-s-healthcare/
Note: Healthcare software and apps company early stage funding.
Venture funding of digital health companies $2,170M
$1,542M
$1,300M
$824M
$329M
$2.2
2.0
1.8
1.6
1.4
1.2
1.0
.8
.6
.4
.2
$0
Vent
ure
fund
ing
($B
B)
2009 2013 2012 2011 2010
Momentum building … Digital health funding growing at nearly 30% per year
Source: Thomson Reuters and Crunchbase for 2008 – 2010 data, Rock Health and Crunchbase for 2011 – 2013; includes top Rock Health digital health innovators and selected innovators identified by OW
Note: Only deals >$2M.

62 62 © Oliver Wyman | AJS-V2V2-20140611-V2V2 Graphics
Critical mass investments
$27$28
$30$30$30$31$31$31$32$32$32$33$34
$35$38
$40$41$41$41$42
$45$46$46
$48$49$49$50$50
$55$57
$58$63
$64$65
$70$73
$77$100$100
$148
$0 $10 $20 $30 $40 $50 $60 $70 $80 $90 $100 $110 $120 $130 $140 $150
Doximity Accolade
Humedica, Inc. Valence Health
Liazon
Airstrip Technologies CareCloud
GoHealth Care.com
FitBit Homecare Homebase
23andMe Proteus Digital Health
Lumos Labs, Inc. (Lumosity) HeartFlow
EGHC ShareCare
ZocDoc Castlight
Evolent Health Practice Fusion, Inc.
Nant Health Sotera Wireless
CardioInsight Watermark Medical BASIS Science Inc.
Modernizing Medicine
ABILITY Network
Teladoc MindBody HealthTap
Kinnser Software Audax Health
Awarepoint Vitals
Health Catalyst Genapsys
Best Doctors PatientSafe Solutions
OrthoSensor
Total capital raised among those who have raised at least $25M =
$2.0 Billion since 2011
Source: Rock Health

63 63 © Oliver Wyman | AJS-20140720-AHA-San Diego
The tech attack
• Scale
• Momentum
• Critical mass/company
• Consumer relevance
• Silicon speed

64 64 © Oliver Wyman | AJS-20140720-AHA-San Diego
Who’s at the edge of our radar screen?
New tech companies
Retailers New/independent care teams
Major tech incumbents
• Hospital systems • Medical groups • Insurers
• Competitors for value? • Good ideas? • Great partners?

65 65 © Oliver Wyman | AJS-20140720-AHA-San Diego
Biosensors
Apps
Social Networks
Exchanges
Retail
Crowd Sourcing
Mobile
Competition/ Games
The “Engaged Consumer”
The “Quantified Self”
The Quantified Self Health IQ

66 66 © Oliver Wyman | AJS-20140720-AHA-San Diego
Illustrative
Undiagnosed depression; pre-hypertensive
Poly-chronic, severe mobility impairment, depression, in skilled nursing facility
Overweight, diabetic, high blood pressure,
undiagnosed depression
Hea
lth s
tatu
s m
igra
tion
Lifetime
Psychologist catches early depression,
addresses it Nutritionist helps craft better diet to
promote good weight
PCP addresses high cholesterol with an Rx
Occasional home care visits help maintain
independence
Over weight, diabetic, high blood pressure, depression, CHF
Fully mobile
Care team prescribes coaching, diet, exercise program
Biosensors, light weight training, strength and stretch training
Changing lifetime trajectories

67 67 © Oliver Wyman | AJS-20140720-AHA-San Diego
Procedure Surgery Center of Oklahoma Competitor price
• Breast biopsy $3,505 $16,244
• Hernia repair $3,200 $17,200
• Carpal tunnel release surgery $2,750 $7,452
• Gall bladder removal $5,865 $21,556
• Hysterectomy $8,000 $37,174
Oklahoma Surgery Center
Infection rates
• Average hospital 3 – 6%
• Average ambulatory surgery 2.6%
• SCO .5%

68 68 © Oliver Wyman | AJS-20140720-AHA-San Diego
Extreme price variations happen everywhere and for every type of procedure.

69 69 © Oliver Wyman | AJS-20140720-AHA-San Diego
Source: CMS claims data for 0267 - Level III Diagnostic and Screening Ultrasound * Estimated savings relative to total bill submitted to CMS Note: Capping reimbursement at the market median could reduce prices by 23%* for these tests Average estimated submitted charges vs. outpatient discharges across US
Average price $1,064
Median price $945
Minimum price $156
Maximum price $7,566
Price variation Price & Volume: Level III Diagnostic and Screening Ultrasound
60
140
130
120
110
100
90
80
70
50
40
30
20
10
0
Volu
me
of p
roce
dure
s (in
thou
sand
s)
Price ($ 000s)
30+
8k
29-3
0
1k
28-2
9
1k
27-2
8
122k
8-9
127k
7-8
136k
6-7
124k
5-6
77k
4-5
57k
3-4
27k
2-3
6k
1-2
1k
12k
20-2
1
5k
19-2
0
11k
18-1
9
15k
17-1
8
26k
16-1
7
30k
15-1
6
35k
14-1
5
41k
13-1
4
65k
12-1
3
81k
11-1
2
77k
10-1
1
114k
9-10
2k
26-2
7
3k
25-2
6
10k
24-2
5
6k
23-2
4
12k
22-2
3
6k
21-2
2
Market median

70 70 © Oliver Wyman | AJS-20140720-AHA-San Diego
Mechanisms
• Calpers
• Walmart
• SCO
• Castlight Health
• ACO physician referrals

71 71 © Oliver Wyman | AJS-20140720-AHA-San Diego
Transparent markets Exchange evolution
Commercial Patient Centered
Medical Home (PCMH)
Polychronic PCMH
Population Health & Smart Care Teams
Frail/elder/ hospice
Mental Illness PCMH
Disease Specific PCMH
Consumers select their primary medical home as front door to the systems
ACO/Health System
Population health managers pull key health/ wellness/engagement services into model
Health Plan A
Health Plan C
Health Plan B
Consumers shop for retail services with price/value transparency
Consumer healthy living
Diagnostic services
Surgical services
Acute/ Episodic
Care Virtual Care
Monitoring services
Procedural care
Healthy Meals
Retail pharmacy
Health apps
Fitness/ wellness
Vision/ optical
Dental services
Health/ wealth
Wearables
Ancillary insurance
Urgent care
Transactional Care Healthy Living
Conventional insurance

72 72 © Oliver Wyman | AJS-20140720-AHA-San Diego
Business model alternatives
• What other important new business models will emerge/are emerging already?
• How effective are they?
• Which ones do a great job for consumers and investors?
• Which ones would you invest in? And why?
Category Design #1 Design #2
IBM’s Watson Technology licensor • “Bloomberg” for health professionals
iWatch Cool device • iPhone-like health ecosystem
Care team Medium-term prevention (reduced hospitalization, reduced specialist usage)
• Invest in biosensors, big data, Watson, genomics, coaches to add “20 more good years”
Hospital Cost-cutting, consolidation • Partner with and co-create smart care teams
Pharmacy Clinic • Clinic + telehealth + health coaches + care teams
Payor Insurer • Consumer health company

73 73 © Oliver Wyman | AJS-20140720-AHA-San Diego
When do I expect the inflection point to happen? Year
• Procedure price umbrella collapse
• Watson goes mainstream
• Care teams hit 20 percent of market
• Quantified self hits 20 percent of consumers
• Exchanges hit 20 percent of plans bought
• Genomics goes mainstream

74 74 © Oliver Wyman | AJS-20140720-AHA-San Diego
A changing market
Value
Three
Consumer
Prevention
Fixed payment
Collaborate
Volume
One value chain
Patient
Repair
FFS
Compete

75 75 © Oliver Wyman | AJS-20140720-AHA-San Diego
What can we do?
• Cost position
• Care teams
• Contracting/business design
• Collaboration energy
• Who will lead?
– Productivity breakthrough
– Who will own prevention?
– The sound of one hand clapping
– In every industry

76 76 © Oliver Wyman | AJS-20140720-AHA-San Diego
Who will own prevention?
Care Teams
Insurer Pharmacy
chain
Hospital system
Independent ACO/PCMH

77 77 © Oliver Wyman | AJS-20140720-AHA-San Diego
What can we do?
• Cost position
• Care teams
• Contracting/business design
• Collaboration energy
• Who will lead?
– Productivity breakthrough
– Who will own prevention?
– The sound of one hand clapping
– In every industry

78 78 © Oliver Wyman | AJS-20140720-AHA-San Diego
Strong business models exploit change;
weak business models lose value faster.
E.g. taking advantage of retail, mobile, telehealth, Watson, genomics