The viscosity at the glass transition of a liquid lubricant · JW parameter in the Johari &Whalley...
6
Friction 7(1): 86–91 (2019) ISSN 2223-7690 https://doi.org/10.1007/s40544-018-0210-1 CN 10-1237/TH SHORT COMMUNICATION The viscosity at the glass transition of a liquid lubricant Scott BAIR Center for High-Pressure Rheology, George W. Woodruff School of Mechanical Engineering, Georgia Institute of Technology, Atlanta GA 30332-0405, USA Received: 07 November 2017 / Revised: 29 December 2017 / Accepted: 29 January 2018 © The author(s) 2018. This article is published with open access at Springerlink.com Abstract: In the classical study of elastohydrodynamic lubrication (EHL) which does not employ real, measurable viscosity in analysis, the possibility of a glass transition has not been considered in many years. Indeed, the two rheological assumptions of classical EHL, the Newtonian inlet and the equivalence of a traction curve to a flow curve, would not have persisted so long had the pressure dependence of the viscosity been accurately stated. With the recent appearance of viscosity obtained from viscometers in EHL analysis, the possibility of a glass transition in the contact should be reexamined, especially for the fragile traction fluids. This article employs published data for a synthetic cycloaliphatic hydrocarbon to estimate the glass transition viscosity so that, when using real viscosities in EHL simulations, the state of the liquid may be assessed. Far into the glassy state the liquid should be treated as an elastic solid with a yield stress. Keywords: elastohydrodynamic lubrication; glass transition; high pressure viscosity; EHL friction 1 Introduction The glass transition in elastohydrodynamic lubrication (EHL) liquids under pressure has been the subject of discussion and speculation for more than forty years [1, 2]. The glass transition has not been a recent topic of classical EHL as the viscosity there is described by simple pressure relations based on fictional accounts [3] of viscometer measurements in which the viscosity does not usually reach to the large values for which the transition occurs. With the recent move towards quantitative EHL [4], which employs real thermophysical properties, the glass transition in EHL liquids should be reexamined. The limiting low shear viscosity at the glass transi- tion is most often given by a “rule-of-thumb” as 12 g 1 10 Pa·s [5] which seems to be more appro- priate for molten minerals [6] than organic liquids. Experimental measurements of the glass transition and the viscosity of liquid lubricants over a range of temperature and pressure more than thirty years ago [7] indicated that the glass viscosity must be much smaller, 10 7 Pa·s to 10 9 Pa·s. Schweyer [8] found g = 10 8 Pa·s for asphalts under pressure. Measurements at ambient pressure of viscosity up to 3.7 × 10 8 Pa·s from the University of Chicago [9] compared with glass transition measurements by transient hot-wire at Umea University [10] give the viscosity at the transition to be g = 1.23 × 10 7 Pa·s for squalane when the observation time is 0.3 seconds. 2 Glass transition temperature and pressure Glass transition temperatures and pressures [11] and precise viscosity [12] data exist for a liquid lubricant, MCS 460, a cycloaliphatic synthetic hydrocarbon produced by Monsanto. It is one of the model lubricants for which the properties have been tabulated by Hamrock et al. [13], although the pressure-viscosity plots in Ref. [13] are extrapolations not representative of the measured viscosity for this oil. MCS 460 displays a dynamic crossover in both the temperature-viscosity * Corresponding author: Scott BAIR, E-mail: [email protected]
-
Upload
truongdang -
Category
Documents
-
view
218 -
download
0
Transcript of The viscosity at the glass transition of a liquid lubricant · JW parameter in the Johari &Whalley...

Friction 7(1): 86–91 (2019) ISSN 2223-7690 https://doi.org/10.1007/s40544-018-0210-1 CN 10-1237/TH
SHORT COMMUNICATION
The viscosity at the glass transition of a liquid lubricant
Scott BAIR
Center for High-Pressure Rheology, George W. Woodruff School of Mechanical Engineering, Georgia Institute of Technology, Atlanta GA
30332-0405, USA
Received: 07 November 2017 / Revised: 29 December 2017 / Accepted: 29 January 2018
© The author(s) 2018. This article is published with open access at Springerlink.com
Abstract: In the classical study of elastohydrodynamic lubrication (EHL) which does not employ real, measurable
viscosity in analysis, the possibility of a glass transition has not been considered in many years. Indeed, the two
rheological assumptions of classical EHL, the Newtonian inlet and the equivalence of a traction curve to a flow
curve, would not have persisted so long had the pressure dependence of the viscosity been accurately stated.
With the recent appearance of viscosity obtained from viscometers in EHL analysis, the possibility of a glass
transition in the contact should be reexamined, especially for the fragile traction fluids. This article employs
published data for a synthetic cycloaliphatic hydrocarbon to estimate the glass transition viscosity so that,
when using real viscosities in EHL simulations, the state of the liquid may be assessed. Far into the glassy state
the liquid should be treated as an elastic solid with a yield stress.
Keywords: elastohydrodynamic lubrication; glass transition; high pressure viscosity; EHL friction
1 Introduction
The glass transition in elastohydrodynamic lubrication
(EHL) liquids under pressure has been the subject of
discussion and speculation for more than forty years
[1, 2]. The glass transition has not been a recent topic
of classical EHL as the viscosity there is described by
simple pressure relations based on fictional accounts
[3] of viscometer measurements in which the viscosity
does not usually reach to the large values for
which the transition occurs. With the recent move
towards quantitative EHL [4], which employs real
thermophysical properties, the glass transition in
EHL liquids should be reexamined.
The limiting low shear viscosity at the glass transi-
tion is most often given by a “rule-of-thumb” as
12g 1 10 Pa·s [5] which seems to be more appro-
priate for molten minerals [6] than organic liquids.
Experimental measurements of the glass transition
and the viscosity of liquid lubricants over a range of
temperature and pressure more than thirty years ago
[7] indicated that the glass viscosity must be much
smaller, 107 Pa·s to 109 Pa·s. Schweyer [8] found g =
108 Pa·s for asphalts under pressure. Measurements
at ambient pressure of viscosity up to 3.7 × 10⁸ Pa·s
from the University of Chicago [9] compared with
glass transition measurements by transient hot-wire
at Umea University [10] give the viscosity at the
transition to be g = 1.23 × 10⁷ Pa·s for squalane
when the observation time is 0.3 seconds.
2 Glass transition temperature and pressure
Glass transition temperatures and pressures [11] and
precise viscosity [12] data exist for a liquid lubricant,
MCS 460, a cycloaliphatic synthetic hydrocarbon
produced by Monsanto. It is one of the model lubricants
for which the properties have been tabulated by
Hamrock et al. [13], although the pressure-viscosity
plots in Ref. [13] are extrapolations not representative
of the measured viscosity for this oil. MCS 460 displays
a dynamic crossover in both the temperature-viscosity
* Corresponding author: Scott BAIR, E-mail: [email protected]

Friction 7(1): 86–91 (2019) 87
∣www.Springer.com/journal/40544 | Friction
http://friction.tsinghuajournals.com
Nomenclature
FC fragility parameter in the Johari and Whalley equation
FD fragility parameter in the VTF equation
p pressure, Pa
p pressure at which viscosity diverges, Pa
gp glass transition pressure, Pa
T temperature, K
BT crossover temperature, K
gT glass transition temperature, K
T divergence temperature, K
limiting low-shear viscosity, Pa·s
0 low-shear viscosity at p = 0, Pa·s
g low-shear viscosity at the glass transition, Pa·s
JW parameter in the Johari &Whalley relation, Pa·s
low-shear viscosity at infinite T, Pa·s
and the pressure-viscosity response at a viscosity of
the order of 100 Pa·s [12]. A dynamic crossover is not
unusual in fragile liquids.
The relative volumes in isobaric cooling and
isothermal compression experiments are plotted in
Figs. 1 and 2, respectively. These measurements were
performed in dilatometers described in [14]. For
characterization of the temperature and pressure
of the glass transition, it is not necessary to precisely
determine volumes (or densities), only the relative
changes in volume. The relative volumes reported in
Figs. 1 and 2 represent the positions of a piston that
applies the pressure and is not corrected for the elastic
deformation of the containment and is, therefore,
only a representation of the liquid volume through
an unknown linear relationship.
Fig. 1 The glass transition detected in isobaric cooling at pressure of 586 MPa. The arrow indicates the time sequence in which the measurements were made.
All measured glass temperatures for pressures from
400 to 700 MPa are shown in Fig. 3 and listed in Table 1.
Fig. 2 The glass transition detected in isothermal compression at 322 K. The arrow indicates the time sequence in which the measurements were made.
Fig. 3 The glass transition temperature as a function of pressure and the correlation of Oelsand Rehage.
88 Friction 7(1): 86–91 (2019)
| https://mc03.manuscriptcentral.com/friction
Table 1 The glass transition state (pressure and temperature) from experiment.
Path p/MPa T/K Isobaric cooling 586 338
Isothermal compression 397 308 Isothermal compression 470 322 Isothermal compression 601 343 Isothermal compression 701 358
The curve fitted to these data represents the equation
of Oels et al. [15]:
g g0 1 2ln 1T p T A A p (1)
with g0T 196.1 K (–81.55 °C), 1
A 130.16 K, and
2A 3.652 GPa–1. The fit is good with average absolute
deviation of 0.9 K.
3 Temperature and pressure dependence of
viscosity
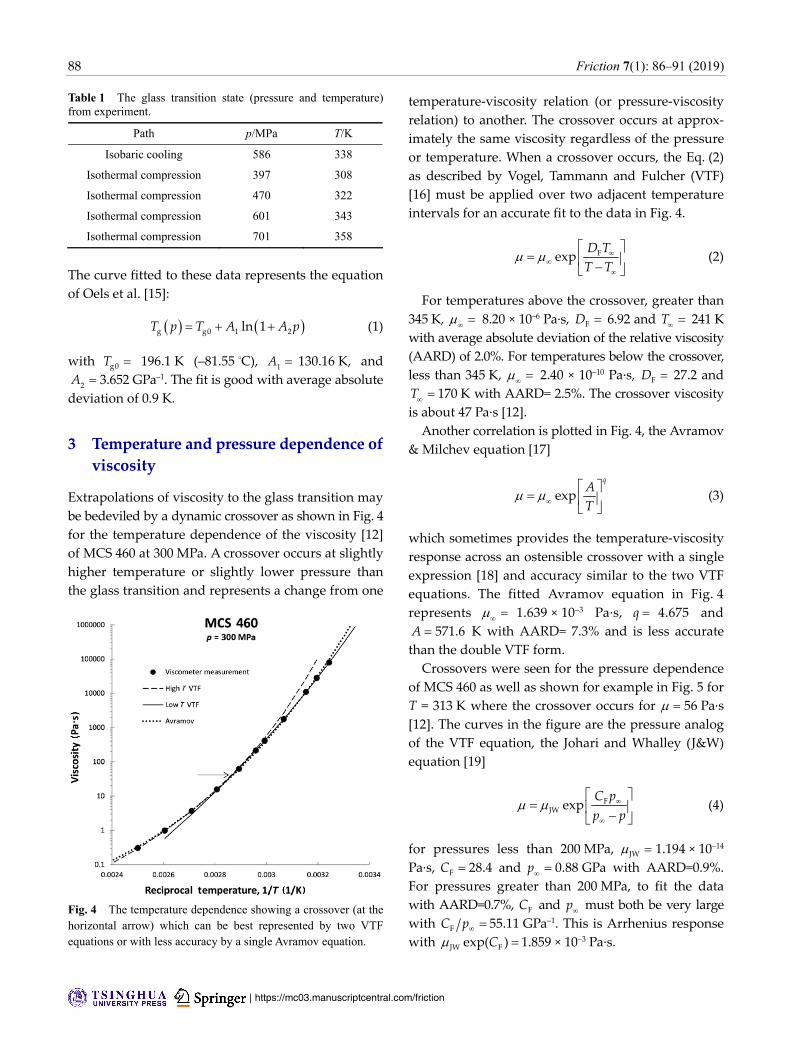
Extrapolations of viscosity to the glass transition may
be bedeviled by a dynamic crossover as shown in Fig. 4
for the temperature dependence of the viscosity [12]
of MCS 460 at 300 MPa. A crossover occurs at slightly
higher temperature or slightly lower pressure than
the glass transition and represents a change from one
Fig. 4 The temperature dependence showing a crossover (at the horizontal arrow) which can be best represented by two VTF equations or with less accuracy by a single Avramov equation.
temperature-viscosity relation (or pressure-viscosity
relation) to another. The crossover occurs at approx-
imately the same viscosity regardless of the pressure
or temperature. When a crossover occurs, the Eq. (2)
as described by Vogel, Tammann and Fulcher (VTF)
[16] must be applied over two adjacent temperature
intervals for an accurate fit to the data in Fig. 4.
FexpD T
T T (2)
For temperatures above the crossover, greater than
345 K, 8.20 × 10⁻⁶ Pa·s, FD 6.92 and T 241 K
with average absolute deviation of the relative viscosity
(AARD) of 2.0%. For temperatures below the crossover,
less than 345 K, 2.40 × 10⁻¹⁰ Pa·s, FD 27.2 and
T 170 K with AARD= 2.5%. The crossover viscosity
is about 47 Pa·s [12].
Another correlation is plotted in Fig. 4, the Avramov
& Milchev equation [17]
exp
qA
T
(3)
which sometimes provides the temperature-viscosity
response across an ostensible crossover with a single
expression [18] and accuracy similar to the two VTF
equations. The fitted Avramov equation in Fig. 4
represents 1.639 × 10⁻³ Pa·s, q 4.675 and
571.6A K with AARD= 7.3% and is less accurate
than the double VTF form.
Crossovers were seen for the pressure dependence
of MCS 460 as well as shown for example in Fig. 5 for
T = 313 K where the crossover occurs for 56 Pa·s
[12]. The curves in the figure are the pressure analog
of the VTF equation, the Johari and Whalley (J&W)
equation [19]
FJW exp
C p
p p (4)
for pressures less than 200 MPa, JW 1.194 × 10⁻¹⁴
Pa·s, FC 28.4 and p 0.88 GPa with AARD=0.9%.
For pressures greater than 200 MPa, to fit the data
with AARD=0.7%, FC and p must both be very large
with FC p 55.11 GPa–1. This is Arrhenius response
with JW Fexp( )C 1.859 × 10⁻³ Pa·s.

Friction 7(1): 86–91 (2019) 89
∣www.Springer.com/journal/40544 | Friction
http://friction.tsinghuajournals.com
Fig. 5 The pressure dependence at 313 K showing a crossover (at the horizontal arrow) which can be best represented by two J&W equations (4).
F
JW Fexp expC
C pp
(5)
The equation above is plotted in Fig. 5 marked
as Arrhenius. The parameters of the J&W equation
are tabulated in Ref. [12] for the other measured
isotherms.
Of course, thermal EHL analysis requires a tem-
perature as well as pressure correlation such as
the free volume models. The free volume approach
cannot reproduce the crossover [12]. Thermodynamic
scaling [20] is promising; however, it also requires
the equation of state.
The underlying mechanism of the crossover remains
the subject of intense speculation and research.
An excellent and detailed discourse on possible
mechanisms has been contributed by Roland and
coworkers [21].
4 Viscosity at the glass transition
The viscosities at the glass transition condition may
now be calculated at the pressure (300 MPa) for
which a viscosity isobar was obtained and the five
temperatures (293 K to 388 K) for which viscosity
isotherms were measured in Ref. [12]. See Table 2. The
transition viscosity varies from 2.30 × 10⁷ Pa·s to 15.6 ×
107 Pa·s with the arithmetic average being 6.2 × 10⁷ Pa·s
and the geometric mean being 4.7 × 10⁷ Pa·s. This is
in the same range as for the EHL reference liquid
squalane [10]. The glass transition viscosity is much
less than the “universal value” of 1012 Pa·s. Using
the “universal” glass transition viscosity and the
extrapolations of Barus and Roelands pressure-
viscosity equations given by Hamrock [13] for this
oil at 311 K, the glass transition pressure would
be 955 MPa and 855 MPa for Barus and Roelands,
respectively. In fact, the glass transition pressure
should be about 410 MPa as shown in Fig. 6 and this
oil will be in the glassy condition for a portion of an
EHL contact at this temperature.
Table 2 The glass transition state (pressure and temperature) from the Oels and Rehage equation (1) and the viscosity calculated by the given correlation.
p/MPa Tg/K g /Pa·s Viscosity correlation
300 288 8.69×10⁷ Avramov&Milchev 300 288 2.70×10⁷ Low TVTF* 323 293 3.08×10⁷ High p J&W (Arrhenius) 422 313 2.35×10⁷ High p J&W (Arrhenius) 569 338 2.30×10⁷ High p J&W (Arrhenius) 829 373 8.64×10⁷ High p J&W (Arrhenius) 964 388 1.56×10⁸ High p J&W (Arrhenius)
*The high temperature VTF relation gives 10g 2.3 10 Pa·s
for this state.
Fig. 6 The Barus and Roelands extrapolations of Hamrock et al. [13] compared with the measurements and showing the glass transition pressure.
90 Friction 7(1): 86–91 (2019)
| https://mc03.manuscriptcentral.com/friction
5 Conclusion
For much of the last forty years, the temperature and
pressure dependence of viscosity in EHL has been
specified by simple models which prevent the viscosity
from reaching realistic values. With the recent trend
toward the use of real viscosity in analyses, the
possibility of a glass transition in the lubricant film
cannot be overlooked. This event is more likely for
the liquids designed for high friction, traction fluids,
which are also susceptible to a dynamic crossover.
The glass transition is a phenomenon occurring at a
specific value of viscosity for a given liquid. It seems
well-established that for the much studied inorganic
liquids (mineral melts) the glass transition viscosity
is of the order of 1012 Pa·s, as in Ref. [22] for example.
However, the situation for organic liquids is less
clear [7, 8]. Here, for one liquid lubricant, the glass
transition by dilatometry combined with falling cylin-
der viscometry places the viscosity at the transition
at between 107 Pa·s and 108 Pa·s, in the same range as
squalane [10].
Open Access: The articles published in this journal
are distributed under the terms of the Creative
Commons Attribution 4.0 International License (http://
creativecommons.org/licenses/by/4.0/), which permits
unrestricted use, distribution, and reproduction in
any medium, provided you give appropriate credit to
the original author(s) and the source, provide a link
to the Creative Commons license, and indicate if
changes were made.
References
[1] Johnson K L, Cameron R. Fourth paper: shear behaviour
of elastohydrodynamic oil films at high rolling contact
pressures. Proc Inst Mech Eng 182(1): 307–330 (1967)
[2] Alsaad M A, Winer W O, Medina F D, O’Shea D C. Light-
scattering study of the glass transition in lubricants. J Lubr
Technol 100(3): 418–422 (1978)
[3] Bair S. Comment on “The relationship between friction and
film thickness in EHD point contacts in the presence of
longitudinal roughness” by Guegan, Kadiric, Gabelli, &
Spikes. Tribol Lett 65(3): 83 (2017)
[4] Bair S, Fernandez J, Khonsari M M, Krupka I, Qureshi F,
Vergne P, Wang Q J. Letter to the editor: An argument for a
change in elastohydrodynamic lubrication philosophy. Proc
Inst Mech Eng Part J 223(4): 1–12 (2009)
[5] Casalini R, Roland C M. Why liquids are fragile. Phys Rev
E Stat Nonlin Soft Matter Phys 72(3): 031503 (2005)
[6] Giordano D, Potuzak M, Romano C, Dingwell D B, Nowak
M. Viscosity and glass transition temperature of hydrous
melts in the system CaAl2Si2O8-CaMgSi2O6. Chem Geol
256(3–4): 203–215 (2008)
[7] Yasutomi S, Bair S, Winer W O. An application of a free
volume model to lubricant rheology I—Dependence of
viscosity on temperature and pressure. J Tribol 106(2):
291–302 (1984)
[8] Schweyer H E. Glass transition of asphalts under pressure. J
Test Eval 2(1): 50–56 (1974)
[9] Deegan R D, Leheny R L, Menon N, Nagel S R, Venerus D
C. Dynamic shear modulus of tricresyl phosphate and
squalane. J Phys Chem B 103(20): 4066–4070 (1999)
[10] Bair S S, Andersson O, Qureshi F S, Schirru M M. New
EHL modeling data for the reference liquids Squalane
and Squalane plus polyisoprene. Tribol Trans (2017) doi:
10.1080/10402004.2017.1310339
[11] Alsaad M, Bair S, Sanborn D M, Winer W O. Glass
transitions in lubricants: its relation to Elastohydrodynamic
lubrication (EHD). J Lubr Technol 100(3): 404–416 (1978)
[12] Bair S, Roland C M, Casalini R. Fragility and the dynamic
crossover in lubricants. Proc Inst Mech Eng Part J J Eng
Tribol 221(7): 801–811 (2007)
[13] Hamrock B J, Schmid S R, Jacobson B O. Fundamentals of
Fluid Film Lubrication. 2nd ed. New York (USA): Marcel
Dekker, 2004: 91–95.
[14] Bair S S. High Pressure Rheology for Quantitative
Elastohydrodynamics. Amsterdam (Germany): Elsevier
Science, 2007: 56–57.
[15] Oels H J, Rehage G. Pressure-volume-temperature measure-
ments on Atactic polystyrene. A thermodynamic view.
Macromolecules 10(5): 1036–1043 (1977)
[16] Angell C A. Relaxation in liquids, polymers and plastic
crystals—strong/fragile patterns and problems. J Non-Cryst
Solids 131–133: 13–31 (1991)
[17] Avramov I, Milchev A. Effect of disorder on diffusion and
viscosity in condensed systems. J Non-Cryst Solids 104(2–3):
253–260 (1988)
[18] Harris K R, Kanakubo M. High pressure studies of the
transport properties of ionic liquids. Faraday Discuss 154:
425–438 (2012)
[19] Johari G P, Whalley E. Dielectric properties of glycerol
in the range 0.1–105 Hz, 218-357 K, 0-53 kb. Faraday Sym
Chem Soc 6: 23–41 (1972)

Friction 7(1): 86–91 (2019) 91
∣www.Springer.com/journal/40544 | Friction
http://friction.tsinghuajournals.com
[20] Casalini R, Paluch M, Roland C M. The dynamic crossover
region in phenol-and cresol-phthalein-dimethylethers under
different conditions of pressure and temperature. J Phys
Condens Matter 15(11): S859-S867 (2003)
[21] Roland C M, Hensel-Bielowka S, Paluch M, Casalini R.
Supercooled dynamics of glass-forming liquids and polymers
under hydrostatic pressure. Rep Prog Phys 68(6): 1405–1478
(2005)
[22] Matusita K, Koide M, Komatsu T. Viscosity of fluoride
glasses at glass transition temperature. J Non-Cryst Solids
140: 119–122 (1992)
Scott BAIR. He received the B.S.,
M.S. and Ph.D degrees in mechanical
engineering from Georgia Institute
of Technology where he is Regents’
Researcher in the George W. Woodruff
School of Mechanical Engineering. He has been
performing experimental research in high pressure
rheology for 44 years and has eleven U.S. patents
and has published more than 180 journal articles.