The Variance Homogeneity Assumption and the Traditional ...
24
Gatekeeper for the ANOVA 1 The Variance Homogeneity Assumption and the Traditional ANOVA: Exploring a Better Gatekeeper Jamie Kim & Robert A. Cribbie Quantitative Methods Program Department of Psychology York University Send correspondence concerning this article to Rob Cribbie ([email protected]).
Transcript of The Variance Homogeneity Assumption and the Traditional ...

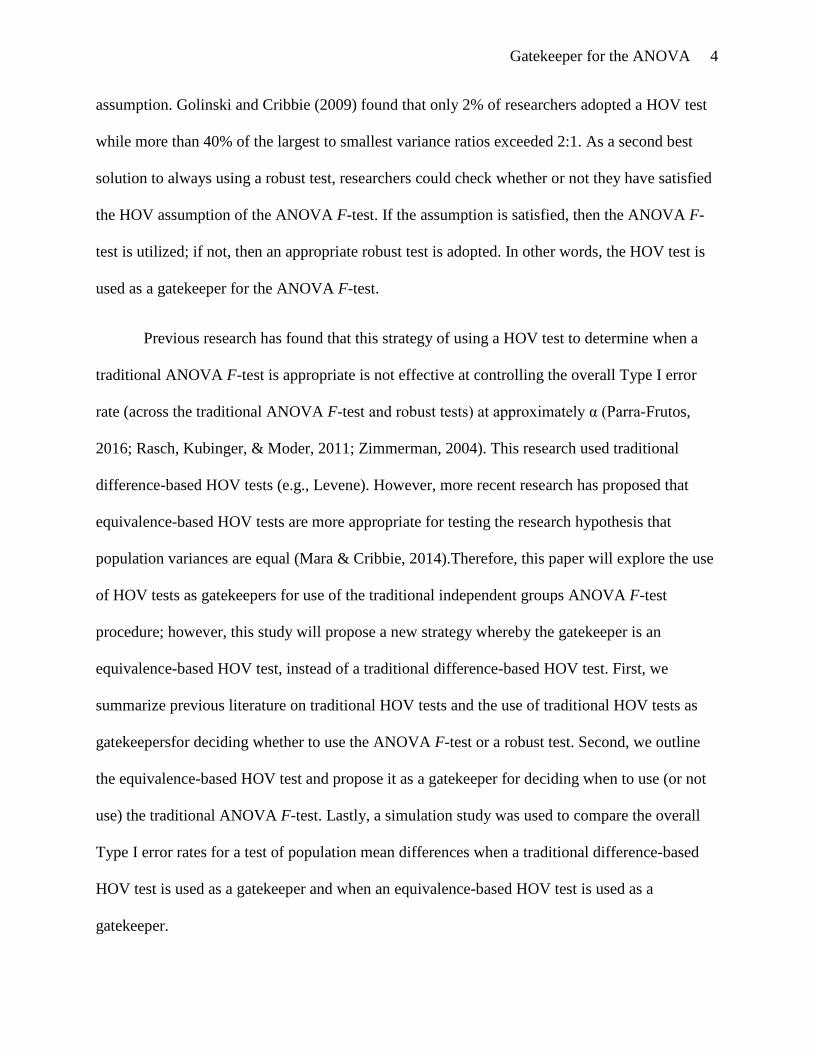
Gatekeeper for the ANOVA 1
The Variance Homogeneity Assumption and the Traditional ANOVA:
Exploring a Better Gatekeeper
Jamie Kim & Robert A. Cribbie
Quantitative Methods Program
Department of Psychology
York University
Send correspondence concerning this article to Rob Cribbie ([email protected]).

Gatekeeper for the ANOVA 2
Abstract
Valid use of the traditional independent samples ANOVA procedure requires that the population
variances are equal. Previous research has investigated whether variance homogeneity tests, such
as Levene’s test, are satisfactory as gatekeepers for identifying when to use or not to use the
ANOVA procedure. This research focuses on a novel homogeneity of variance test that
incorporates an equivalence testing approach. Instead of testing the null hypothesis that the
variances are equal against an alternate hypothesis that the variances are not equal, the
equivalence-based test evaluates the null hypothesis that the difference in the variances falls
outside or on the border of a predetermined interval against an alternate hypothesis that the
difference in the variances falls within the predetermined interval. Thus, with the equivalence-
based procedure, the alternate hypothesis is aligned with the research hypothesis (variance
equality). A simulation study demonstrated that the equivalence-based test of population
variance homogeneity is a better gatekeeper for the ANOVA than traditional homogeneity of
variance tests.
Keywords: equivalence testing, homogeneity of variance, ANOVA, Levene test

Gatekeeper for the ANOVA 3
The Variance Homogeneity Assumption and the Traditional ANOVA:
Exploring a Better Gatekeeper
The independent group analysis of variance (ANOVA) F- test is widely used to test
hypotheses regarding population means. For example, a researcher may want to know if the
number of words recalled from a list differs depending on the nature of the lists (e.g., happy, sad,
or neutral words). It is widely known that the ANOVA F-test is biased when the assumptions of
normality, homogeneity of variance (HOV), or independence of errors are violated (Choi, 2005;
Cochran, 1947; Cribbie, Fiksenbaum, Wilcox, &Keselman, 2012; Glass, Peckham, & Sanders,
1972; Hoekstra, Kiers, & Johnson, 2012; Olsen, 2003). In this paper, we explore the HOV
assumption of the ANOVA F-test. More specifically, we are interested in whether tests of the
HOV assumption can inform researchers regarding when it is appropriate/safe to use the
traditional ANOVA F-test and when it is recommended that they seek out an appropriate robust
test.
To be clear, our recommendation, which will be repeated in the discussion, is that
researchers always adopt tests that are robust to violations of the HOV assumption. However,
previous research (Golinski & Cribbie, 2009; Erceg-Hurn & Mirosevich, 2008; Grisson, 2000;
Keselman et al., 1998; Sharpe, 2013; Wilcox, 1998) indicates that researchers are resistant to
making robust techniques their 'go to' method. For example, in a study by Keselman et al. (1998)
examining articles in prominent education and psychology journals, 93.3% of the published
articles with independent group univariate designs used the traditional ANOVA F-test. This is
extremely troubling since research exploring assumption violation in independent groups
ANOVA designs has found that the data rarely meet the assumptions (Micceri, 1989; Golinski &
Cribbie, 2009), and as outlined above the ANOVA F-test is not robust to violations of the HOV
Gatekeeper for the ANOVA 4
assumption. Golinski and Cribbie (2009) found that only 2% of researchers adopted a HOV test
while more than 40% of the largest to smallest variance ratios exceeded 2:1. As a second best
solution to always using a robust test, researchers could check whether or not they have satisfied
the HOV assumption of the ANOVA F-test. If the assumption is satisfied, then the ANOVA F-
test is utilized; if not, then an appropriate robust test is adopted. In other words, the HOV test is
used as a gatekeeper for the ANOVA F-test.
Previous research has found that this strategy of using a HOV test to determine when a
traditional ANOVA F-test is appropriate is not effective at controlling the overall Type I error
rate (across the traditional ANOVA F-test and robust tests) at approximately α (Parra-Frutos,
2016; Rasch, Kubinger, & Moder, 2011; Zimmerman, 2004). This research used traditional
difference-based HOV tests (e.g., Levene). However, more recent research has proposed that
equivalence-based HOV tests are more appropriate for testing the research hypothesis that
population variances are equal (Mara & Cribbie, 2014).Therefore, this paper will explore the use
of HOV tests as gatekeepers for use of the traditional independent groups ANOVA F-test
procedure; however, this study will propose a new strategy whereby the gatekeeper is an
equivalence-based HOV test, instead of a traditional difference-based HOV test. First, we
summarize previous literature on traditional HOV tests and the use of traditional HOV tests as
gatekeepersfor deciding whether to use the ANOVA F-test or a robust test. Second, we outline
the equivalence-based HOV test and propose it as a gatekeeper for deciding when to use (or not
use) the traditional ANOVA F-test. Lastly, a simulation study was used to compare the overall
Type I error rates for a test of population mean differences when a traditional difference-based
HOV test is used as a gatekeeper and when an equivalence-based HOV test is used as a
gatekeeper.

Gatekeeper for the ANOVA 5
Homogeneity of Variance Tests as Gatekeepers
Many different tests for HOV have been proposed, with the Levene test on deviations
from the median (LM; Brown & Forsythe, 1974) often emerging as the recommended procedure
over a broad range of conditions (Conover, Johnson, & Johnson, 1981; Nordstokke & Zumbo,
2010; Sharma &Kibria, 2013) and available in many popular software packages. HOV tests have
been suggested as gatekeepers for deciding when to use a robust procedure (e.g., Welch’s, 1951,
heteroscedastic ANOVA F-test) or the traditional ANOVA (Rasche et al., 2011; Ruscio &
Roche, 2012). If the HOV test is satisfied, the traditional ANOVA F-test procedure can be used.
If the HOV test is violated, then a robust procedure should be adopted (see Figure 1).
However, simulation studies have shown that using traditional HOV tests as preliminary
tests (gatekeepers) for deciding when to use the ANOVA F-test or a robust test produces
unacceptable Type I error rates (Rasch et al., 2011; Zimmerman, 1996; Zimmerman, 2004).
Thus, traditional HOV tests are not effective gatekeepers for deciding when it is acceptable to
use, or not use, the traditional ANOVA F-test procedure.
One of the reasons for the ineffectiveness of these traditional HOV tests as gatekeepers is
that the goal (research hypothesis) of traditional difference-based HOV tests does not align with
the study goal. For example, when researchers use traditional HOV tests as gatekeepers for the
ANOVA F-test, the research hypothesis (variance equality) does not match the alternative
hypothesis of the test (variance inequality). With a traditional HOV test, such as the LM, the null
hypothesis is that the variances are equal, 𝐻0: 𝜎12 = 𝜎22 = ⋯ = 𝜎𝐽2, where 𝐽 is the number of
groups. This test is not optimal for detecting when population variances are equal since the
power for detecting equal variances decreases as sample sizes increase, whereas the chance of

Gatekeeper for the ANOVA 6
declaring the variances equal increases substantially as sample sizes decrease. Put in another
way, researchers with small sample sizes are more likely to conclude that the population
variances are equal than their counterparts with large sample sizes, even if the difference in the
variances remained constant. Further, not rejecting the null hypothesis does not prove that the
null hypothesis is true (Altman & Bland, 1995). In other words, failing to reject the null
hypothesis only shows that there is insufficient evidence to detect unequal population variances
(Mara & Cribbie, 2014). Thus, the present study aims to explore a more effective statistical
method for testing the homogeneity of variance assumption in order to derive improved
gatekeepers for the ANOVA F-test procedure.
Equivalence Testing Approach to Assessing Variance Homogeneity
As mentioned above, traditional difference-based null hypothesis tests (e.g., Levene-
based approaches) explore whether there are differences in the population parameter of interest;
the null hypothesis specifies a lack of relationship, whereas the alternative hypothesis specifies
the presence of a relationship. However, what is really desired is a test of the practical
equivalence of population variances; in other words, any differences in the variances should be
too small to be of any practical significance. Mara and Cribbie (2014) proposed the use of an
equivalence-based HOV test that was derived from Wellek’s (2010) one-way test of population
mean equivalence and Levene’s (1960) HOV test. With this test, the research hypothesis
(equivalence of population variances) is aligned with the alternative hypothesis (also equivalence
of population variances), not the null hypothesis. More specifically, the null hypothesis specifies
that the difference in the variances falls outside of or at the bounds of an a priori determined
interval based on the smallest practically significant difference, whereas the alternative
hypothesis declares that the difference among the variances of the groups falls within an interval

Gatekeeper for the ANOVA 7
based on this minimally important difference. The test statistic quantifies the standardized
squared Euclidian distance, and thus, the interval is one-sided. Mara and Cribbie (2014),
following Wellek (2010), proposed the following hypotheses:
𝐻0: Ψ∗2 ≥ ε2
𝐻1: Ψ∗2 < ε2
where Ψ∗2 quantifies the standardized squared Euclidian distance of the population variances,
and ε2 represents the minimally important practical distance for Ψ∗2. To provide some context
regarding these hypotheses, these are equivalent to the hypotheses used for evaluating the
equivalence of several independent population means (see Wellek, 2010). Since the Levene-
based tests use an ANOVA on the deviations from a measure of central tendency, it is logical
that an equivalence-based test following Levene’s methodology would have hypotheses
synchronous with a one-way independent group equivalence test. Before discussing the
equivalence-based test of equal variance, the traditional difference-based Levene tests of unequal
population variances will be discussed because the equivalence-based test of equal variances was
derived from these traditional tests.
Levene Difference-based Homogeneity of Variance Tests
Original Levene Test. The original Levene’s (1960) test is a traditional ANOVA F-test
on the absolute deviations of the sample scores from the sample mean, 𝑧𝑖𝑗 = �𝑋𝑖𝑗 − 𝑀𝑗�, j = 1, …,
J, in order to assess variance inequality across the groups, where 𝑋𝑖𝑗 is the sample raw score of
the 𝑖th individual in the 𝑗th group, and 𝑀𝑗 is the mean of the 𝑗th group.
Levene’s Median-based Test with Welch Adjustment (LWM). Numerous modifications
of the original Levene’s test have been proposed. Among the modifications, the present study

Gatekeeper for the ANOVA 8
explores Levene’s median-based test with a Welch adjustment (LWM; Keselman, Games, &
Clinch, 1979).
Levene’s median-based test with Welch adjustment (LWM) is a traditional ANOVA F-
test on the absolute deviations of the sample scores from the sample median, denoted as 𝑧𝑚𝑖𝑗,
that tests for variance differences across the groups:
𝑧𝑚𝑖𝑗 = �𝑋𝑖𝑗 − 𝑀𝐷𝑁𝑗�
where 𝑋𝑖𝑗 is the sample raw score of the 𝑖th individual in the 𝑗th group, and 𝑀𝐷𝑁𝑗 is the median
of the 𝑗th group. The null hypothesis of LWM, 𝐻0: 𝜎12 = ⋯ = 𝜎𝐽2, is rejected if 𝐹′ ≥ 𝐹𝛼,𝐽−1,𝑑𝑓′,
where:
𝐹′ =
∑𝑤𝑧𝑚𝑗(𝑧𝑚�����𝑗−𝑧𝑚�����′..)2
𝐽−1�
1+2(𝐽−2)𝐽2−1
∑� 1𝑛𝑗−1
��1−𝑤𝑧𝑚𝑗∑𝑤𝑧𝑚𝑗
�2 ,
𝑛𝑗 is the size of the 𝑗th group, 𝑠𝑧𝑚𝑗2 is the variance of the transformed scores for the 𝑗th group,
𝑤𝑧𝑚𝑗 = 𝑛𝑗𝑠𝑧𝑚𝑗2 is the size of 𝑗th group divided by the sample variance of the 𝑧𝑚𝑖𝑗 for the 𝑗th group,
𝑧𝑚����𝑗is the mean of the𝑧𝑚𝑖𝑗 for the 𝑗th group, and 𝑧𝑚����′.. =∑𝑤𝑧𝑚𝑗𝑧𝑚�����𝑗∑𝑤𝑧𝑚𝑗
is the mean of the 𝑧𝑚����𝑗. The
observed F-statistic (𝐹′) is approximately distributed as F with the nominal Type I error rate α,
𝐽 − 1 numerator degrees of freedom, and denominator degrees of freedom:
𝑑𝑓′ = 𝐽2−1
3∑� 1𝑛𝑗−1
��1−𝑤𝑧𝑚𝑗∑𝑤𝑧𝑚𝑗
�2.
The Welch adjusted test statistic and degrees of freedom help the control for any differences in
the variances of the deviations from the group medians.

Gatekeeper for the ANOVA 9
Equivalence-based Homogeneity of Variance Test
Several novel equivalence-based HOV tests were proposed and examined in the
simulation study by Mara and Cribbie (2014). Among the proposed tests, the simulations showed
that the Levene-Wellek median-based test with a Welch adjustment (LWWM) was the best-
performing equivalence-based test in terms of accurate Type I error rates and the highest power
for detecting equivalent variances across groups. Thus, the present study examines the
performance of the LWWM as a gatekeeper for the traditional ANOVA procedure. The
performance of the equivalence-based LWWM will be compared to the performance of the
traditional LWM, which is the difference-based counterpart of the LWWM discussed in the
previous section.
The LWWM uses transformed raw scores, which are the absolute deviations from the
median (𝑧𝑚𝑖𝑗), as also used in the LWM test. The null hypothesis of equivalence-based HOV
tests,𝐻0: Ψ∗2 ≥ ε2, is rejected if 𝐹′ < 𝐹𝛼,𝐽−1,𝑑𝑓′,𝑛�𝜀2, where 𝑛�ε2 is the noncentrality parameter.
Equivalence Interval. The equivalence interval, in this case a one-sided interval denoted
as 𝜀, outlines the smallest difference that is still practically significant. Thus, an appropriate
value of ε should be determined in the context of each research study. To facilitate an
understanding of the magnitude of ε, it is equivalent to Cohen’s d in the two group case,
𝑑 = 𝑀1−𝑀2𝑠𝑑(𝑋1−𝑋2), where M1, M2 are the sample means, sd is the standard deviation of difference
between X1 and X2, and X1, X2 are the scores in groups 1 and 2, respectively. For instance, ε =
d=.25. In five group case, Cohen’s d can be converted to Cohen’s f using 𝑓 = � 𝑑2
2𝐽 , where d is
the Cohen’s d and J is the number of groups (Mara & Cribbie, 2014). Cohen’s d of .25 is equated

Gatekeeper for the ANOVA 10
to Cohen’s f of approximately .08. As effect sizes are interpreted as small, medium, and large,
both Cohen’s d in two group case and Cohen’s f in five group case fall in small effect.
Rejecting the null hypothesis provides evidence that the differences in the variances are
small enough to be considered practically insignificant. Further, as discussed previously, the
research hypothesis of the equivalence-based HOV test (detecting equal population variances) is
aligned with the alternative hypothesis of the test, which is more theoretically appropriate
compared to traditional difference-based HOV tests.
Present Study
This study explores whether the novel equivalence-based HOV test (LWWM) can be an
effective gatekeeper for the traditional independent groups ANOVA F-test. More specifically,
the question we are exploring is whether using the equivalence–based HOV test to decide if the
traditional ANOVA F-test (when the null hypothesis of the equivalence-based HOV test is
rejected) or the Welch robust F-test (when the null hypothesis of the equivalence-based HOV
test is not rejected) should be used will provide acceptable overall Type I error control. It is
important to note that by Type I error control we are referring to the overall rate of Type I errors
for testing the null hypothesis that the population means are equal. Additionally, we also expect
that the traditional difference-based HOV test will not maintain the empirical Type I error rate at
the nominal rate based on the findings of past research.
Method
A simulation study was used to evaluate two strategies for deciding when to use the
traditional one-way ANOVA F-test and when to abandon the traditional ANOVA procedure in
favour of a robust test (Welch’s robust F-test in this study). More specifically, we evaluated the

Gatekeeper for the ANOVA 11
empirical Type I error rates of the traditional ANOVA F-test/Welch robust F-test combination
when the LWM test and LWWM tests were used as gatekeepers to decide when to adopt the
ANOVA F-test and when to adopt the Welch robust F-test (see Figure 1). We investigated
conditions where there J = 2 or J = 5 independent groups. We also varied the average per group
sample size from 𝑛� = 20 to 𝑛� = 200 (total N = 40 to 400 in the two group condition and N = 100
to 1000 in the five group condition). In each condition, five different population variance ratios
were used and three different sample size ratios were examined. Unequal population variances
were directly (positively) and inversely (negatively) paired with the unequal sample sizes (i.e., in
the directly paired condition, the largest variance was paired with the largest sample size and the
smallest variance was paired with the smallest sample size, and in the inversely paired condition,
the largest variance was paired with the smallest sample size and the smallest variance was
paired with the largest sample size). Since we are only investigating Type I errors, all population
means were fixed at zero. See Table 1 for the specific conditions used in the simulations.
The nominal Type I error rate (α) was set at .05, the equivalence interval (ε) for the
LWWM was set to .25 (conservative value recommended by Wellek, 2010), and all outcome
variables were normally distributed. We focused on the conservative ε as .25 since this is more in
line with the goals of our research (i.e., ensure that researchers are not accidentally steered in the
direction of the non-robust test). We used Bradley’s (1978) liberal limits (α ±.5α) to determine
whether empirical Type I error rates are acceptably close to the nominal rate. Although there are
numerous methods that could be adopted for evaluating robustness (see Serlin, 2000), we find
Bradley’s limits to be most appropriate for our goals. Specifically, we are looking for an
approach that provides satisfactory, not necessarily perfect, Type I error rates, and many

Gatekeeper for the ANOVA 12
approaches (e.g., two standard errors) would be too conservative. Bradley’s liberal limits provide
a compromise between conservative approaches and simple eye-balling the results.
Five thousand simulations were run for each of the 162 (2 group size X 3 total N X 3
sample size ratio X 9 population variance ratio) conditions, resulting in a standard error of
approximately .003 when the rejection rate was close to α. All analyses were run using R (R Core
Team, 2015).
Results
Empirical Type I error rates for J = 2 and J = 5 are presented in Tables 2 and 3,
respectively. Type I error rates when the sample sizes were equal never fell outside of Bradley’s
limits; therefore, we excluded those conditions from the tables. In other words, since all of the
procedures were satisfactory when sample sizes were equal, and further that equal sample sizes
are rare in empirical research, we do not discuss these results further. Additionally, the pattern of
results for 𝑛� = 50 were similar to that for 𝑛� = 200; therefore, we only present the results for 𝑛� =
20 and 𝑛� = 50.
No Preliminary Test/Gatekeeper
As expected, for both J = 2 and J = 5, the Type I error rates of the traditional ANOVA F-
test regularly fell outside of Bradley’s liberal limits, whereas, the rates for the Welch robust F-
test never fell outside of these limits. More specifically, the rates of the ANOVA F-test were
regularly conservative (reaching as low as .000) when the sample sizes and variances were
directly paired. On the other hand, the Type I error rates of the ANOVA F-test were regularly
liberal (reaching as high as .411) when the sample sizes and variances were inversely paired.
Gatekeeper for the ANOVA 13
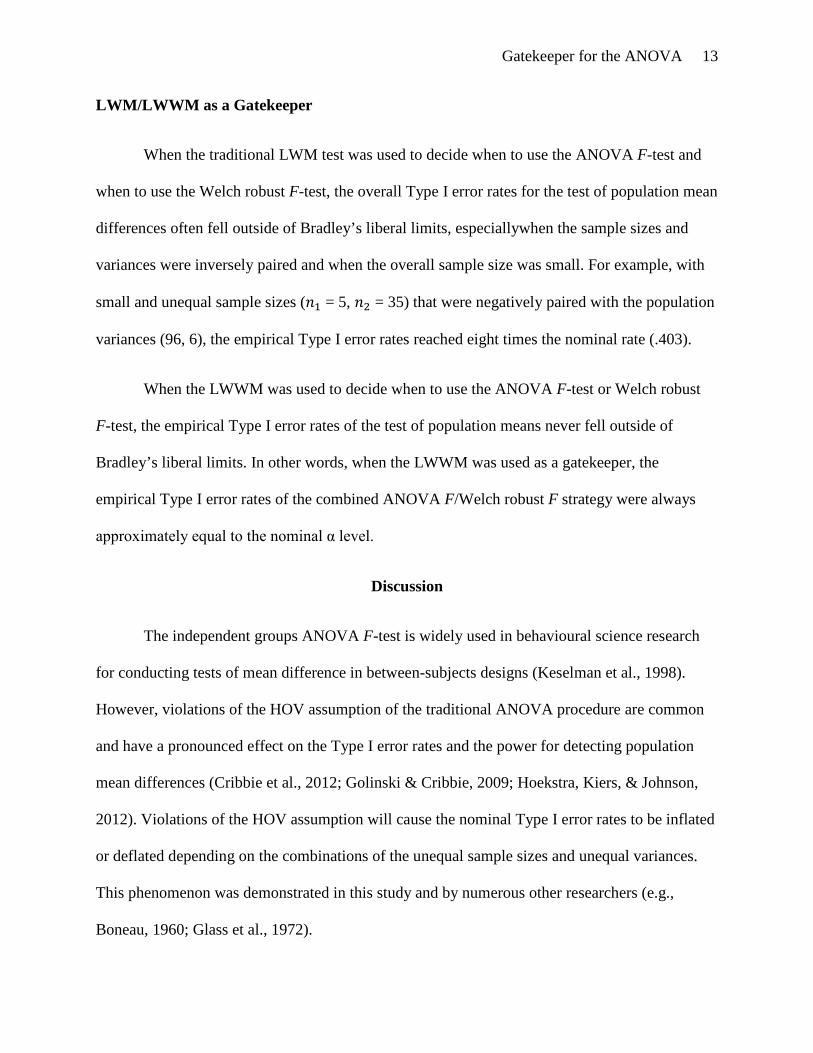
LWM/LWWM as a Gatekeeper
When the traditional LWM test was used to decide when to use the ANOVA F-test and
when to use the Welch robust F-test, the overall Type I error rates for the test of population mean
differences often fell outside of Bradley’s liberal limits, especiallywhen the sample sizes and
variances were inversely paired and when the overall sample size was small. For example, with
small and unequal sample sizes (𝑛1 = 5, 𝑛2 = 35) that were negatively paired with the population
variances (96, 6), the empirical Type I error rates reached eight times the nominal rate (.403).
When the LWWM was used to decide when to use the ANOVA F-test or Welch robust
F-test, the empirical Type I error rates of the test of population means never fell outside of
Bradley’s liberal limits. In other words, when the LWWM was used as a gatekeeper, the
empirical Type I error rates of the combined ANOVA F/Welch robust F strategy were always
approximately equal to the nominal α level.
Discussion
The independent groups ANOVA F-test is widely used in behavioural science research
for conducting tests of mean difference in between-subjects designs (Keselman et al., 1998).
However, violations of the HOV assumption of the traditional ANOVA procedure are common
and have a pronounced effect on the Type I error rates and the power for detecting population
mean differences (Cribbie et al., 2012; Golinski & Cribbie, 2009; Hoekstra, Kiers, & Johnson,
2012). Violations of the HOV assumption will cause the nominal Type I error rates to be inflated
or deflated depending on the combinations of the unequal sample sizes and unequal variances.
This phenomenon was demonstrated in this study and by numerous other researchers (e.g.,
Boneau, 1960; Glass et al., 1972).
Gatekeeper for the ANOVA 14
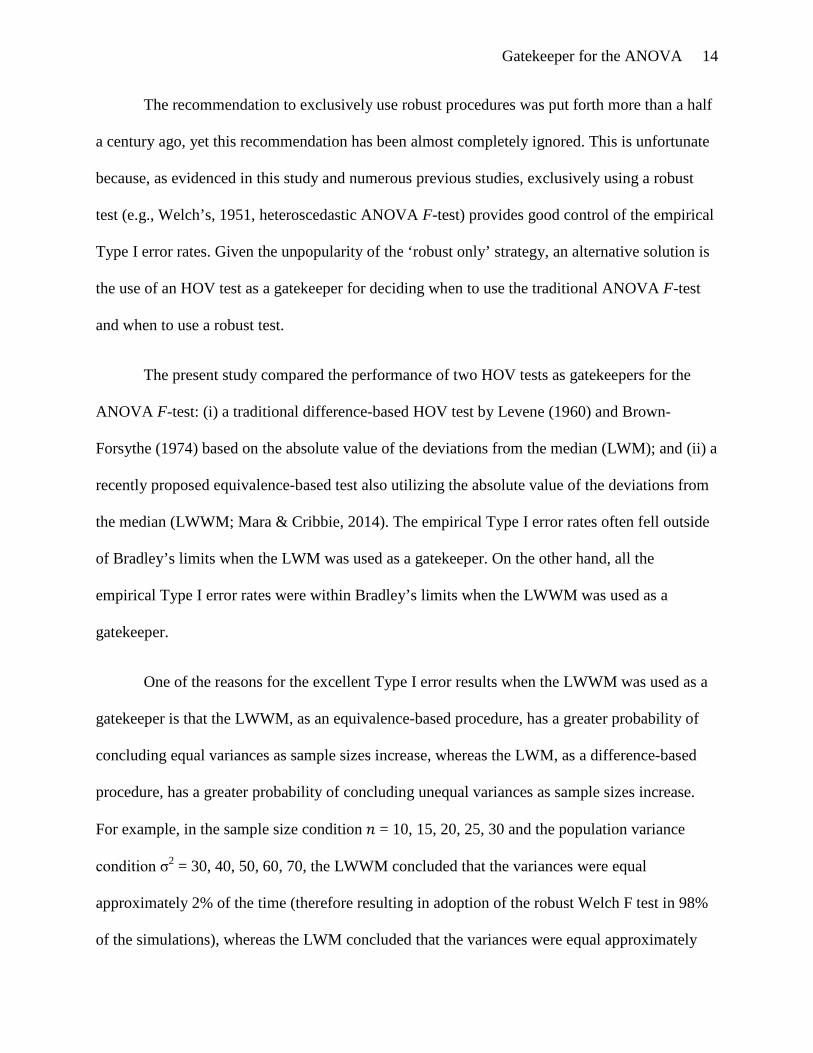
The recommendation to exclusively use robust procedures was put forth more than a half
a century ago, yet this recommendation has been almost completely ignored. This is unfortunate
because, as evidenced in this study and numerous previous studies, exclusively using a robust
test (e.g., Welch’s, 1951, heteroscedastic ANOVA F-test) provides good control of the empirical
Type I error rates. Given the unpopularity of the ‘robust only’ strategy, an alternative solution is
the use of an HOV test as a gatekeeper for deciding when to use the traditional ANOVA F-test
and when to use a robust test.
The present study compared the performance of two HOV tests as gatekeepers for the
ANOVA F-test: (i) a traditional difference-based HOV test by Levene (1960) and Brown-
Forsythe (1974) based on the absolute value of the deviations from the median (LWM); and (ii) a
recently proposed equivalence-based test also utilizing the absolute value of the deviations from
the median (LWWM; Mara & Cribbie, 2014). The empirical Type I error rates often fell outside
of Bradley’s limits when the LWM was used as a gatekeeper. On the other hand, all the
empirical Type I error rates were within Bradley’s limits when the LWWM was used as a
gatekeeper.
One of the reasons for the excellent Type I error results when the LWWM was used as a
gatekeeper is that the LWWM, as an equivalence-based procedure, has a greater probability of
concluding equal variances as sample sizes increase, whereas the LWM, as a difference-based
procedure, has a greater probability of concluding unequal variances as sample sizes increase.
For example, in the sample size condition 𝑛 = 10, 15, 20, 25, 30 and the population variance
condition σ2 = 30, 40, 50, 60, 70, the LWWM concluded that the variances were equal
approximately 2% of the time (therefore resulting in adoption of the robust Welch F test in 98%
of the simulations), whereas the LWM concluded that the variances were equal approximately

Gatekeeper for the ANOVA 15
70% of the time (therefore resulting in adoption of the robust Welch F test in only 30% of the
simulations). This clearly provides the LWWM with an advantage since it is less likely to adopt
the traditional non-robust ANOVA procedure when variances are very disparate and sample
sizes are small.
With all simulation studies, a limitation is that the results are only applicable to the
conditions investigated in this study. However, given the wide range of sample size and variance
conditions adopted, we expect that the results would hold generally in one-way independent
group designs. However, the present study only examined normally distributed data; therefore,
inferences based on our results are limited to normally distributed outcomes. To broaden the
applicability of our results, future studies should use nonnormally distributed data to examine
whether the results of our study can be applied to both normally and nonnormally distributed
data. The performance of this strategy, however, may depend onthe use of an appropriate
normality test and a robust test that is insensitive to violations of both the normality and HOV
assumptions (see Cribbie et al., 2012).
To conclude, it is important to reiterate that we recommend that researchers always adopt
tests that are robust to violations of the HOV assumption in order to ensure that empirical Type I
error rates are maintained at approximately nominal rate. However, numerous quantitative
methods researchers have made this recommendation with very little adoption by applied
researchers. Thus, we explored whether using an equivalence-based HOV test (LWWM) as a
gatekeeper could be an appropriate substitute for always using a robust test. Our results indicate
that adopting a robust test when the LWWM is not statistically significant and adopting the
traditional ANOVA F-test otherwise is an acceptable strategy for controlling overall empirical
Type I error rates for a test of population mean difference. In order to facilitate adoption of the

Gatekeeper for the ANOVA 16
equivalence-based HOV test as a gatekeeper, a user-friendly R (R Core Team, 2015) function ???
is available in the R package ??? (omitted for blind review).
Gatekeeper for the ANOVA 17
References
Altman, D. G. & Bland, J. M. (1995). Statistics notes: Absence of evidence is not evidence of
absence. British Medical Journal, 311, 485. doi:10.1136/bmj.311.7003.485.
Boneau, C. A. (1960). The effects of violations of assumptions underlying the t
test. Psychological bulletin, 57, 49.doi:10.1037/h0041412.
Bradley, J. V. (1978). Robustness? British Journal of Mathematical & Statistical Psychology, 31,
144-152. doi:10.1111/j.2044-8317.1978.tb00581.x.
Brown, M. B. & Forsythe, A. B. (1974). Robust tests for the equality of variances. Journal of the
American Statistical Association. 69, 364–367. doi:10.1080/01621459.1974.10482955.
Choi, P. T. (2005). Statistics for the reader: what to ask before believing the results. Canadian
Journal of Anesthesia/Journal canadiend'anesthésie, 52, R46-R46.
doi:10.1007/BF03023086.
Cochran, W. G. (1947). Some consequences when the assumptions for the analysis of variance
are not satisfied. Biometrics, 3, 22-38.doi:10.3102/00346543042003237.
Conover, W. J., Johnson, M. E., & Johnson, M. M. (1981). A comparative study of tests for
homogeneity of variances, with applications to the outer continental shelf bidding
data. Technometrics, 23, 351-361. doi:10.1080/00401706.1981.10487680.
Cribbie, R. A., Fiksenbaum, L., Wilcox, R. R., & Keselman, H. J. (2012).Effects of
nonnormality on test statistics for one-way independent groups designs. British Journal of
Mathematical and Statistical Psychology, 65, 56-73.

Gatekeeper for the ANOVA 18
Erceg-Hurn, D. &Mirosevich, V. M. (2008). Modern robust statistical methods: An easy way to
maximize the accuracy and power of your research. American Psychologist, 63, 591-601.
doi:10.1037/0003-066X.63.7.591.
Glass, G. V., Peckham, P. D., & Sanders, J. R. (1972). Consequences of failure to meet
assumptions underlying the fixed effects analyses of variance and covariance. Review of
educational research, 42, 237-288. doi:10.2307/1169991.
Golinski, C. & Cribbie, R. A. (2009). The expanding role of quantitative methodologists in
advancing psychology. Canadian Psychology/Psychologiecanadienne, 50, 83.
doi:10.1037/a0015180.
Grissom, R. J. (2000). Heterogeneity of variance in clinical data. Journal of Consulting and
Clinical Psychology, 68, 155-165. doi:10.1037/0022-006X.68.1.155.
Hoekstra, R., Kiers, H. A., & Johnson, A. (2012). Are assumptions of well-known statistical
techniques checked, and why (not). Front. Psychol, 3, 10-3389.
doi:10.3389/fpsyg.2012.00137.
Keselman, H. J., Gaines, P. A., & Clinch, J. J. (1979). Tests for homogeneity of
variance. Communications in Statistics-Simulation and Computation, 8, 113-129.
doi:10.1080/03610917908812108.
Keselman, H. J., Huberty, C. J., Lix, L. M., Olejnik, S., Cribbie, R. A., Donahue, B., ... & Levin,
J. R. (1998). Statistical practices of educational researchers: An analysis of their ANOVA,
MANOVA, and ANCOVA analyses. Review of Educational Research, 68, 350-386.
doi:10.3102/00346543068003350.

Gatekeeper for the ANOVA 19
Levene, H. (1960). Robust tests of equality of variances. In Contributions to Probability and
Statistics, Essays in Honor of Harold Hotelling, I. Olkin et al. (Eds.). Stanford University
Press, pp. 278-292.
Mara, C. A. & Cribbie, R. A. (2014). Testing for equivalence of group variances (Unpublished
doctoral dissertation). York University, Canada.
Micceri, T. (1989). The unicorn, the normal curve, and other improbable creatures.
Psychological Bulletin, 105, 156-166. doi:10.1037/0033-2909.105.1.156.
Nordstokke, D. W. & Zumbo, B. D. (2010). A new nonparametric Levene test for equal
variances. Psicológica, 31, 401-430.
Olsen, C. H. (2003). Review of the use of statistics in infection and immunity. Infection and
immunity, 71, 6689-6692. doi:10.1128/IAI.71.12.6689–6692.2003.
Parra-Frutos, I. (2016). Preliminary tests when comparing means. Computational Statistics, 1-25.
doi:10.1007/s00180-016-0656-4.
R Core Team (2015). R: A language and environment for statistical computing. R Foundation for
Statistical Computing, Vienna, Austria. URL: https://www.R-project.org/.
Rasch, D., Kubinger, K. D., & Moder, K. (2011). The two-sample t test: pre-testing its
assumptions does not pay off. Statistical Papers, 52, 219-231. doi: 10.1007/s00362-009-
0224-x.
Ruscio, J. & Roche, B. (2012). Variance heterogeneity in published psychological
research. Methodology, 8, 1-11. doi:10.1027/1614-2241/a000034.

Gatekeeper for the ANOVA 20
Serlin, R. C. (2000). Testing for robustness in Monte Carlo studies. Psychological methods, 5,
230-240. doi:10.1037/1082-989X.5.2.230.
Sharma, D. & Kibria, B. G. (2013). On some test statistics for testing homogeneity of variances:
a comparative study. Journal of Statistical Computation and Simulation, 83, 1944-1963.
doi:10.1080/00949655.2012.675336.
Sharpe, D. (2013). Why the resistance to statistical innovations? Bridging the communication
gap. Psychological methods, 18, 572. doi:10.1037/a0034177.
Vorapongsathorn, T., Taejaroenkul, S., & Viwatwongkasem, C. (2004). A comparison of type I
error and power of Bartlett’s test, Levene’s test and Cochran’s test under violation of
assumptions. Songklanakarin J. Sci. Technol, 26, 537-547. Retrieved from
http://bios.ph.mahidol.ac.th.
Wellek, S. (2010). Testing statistical hypotheses of equivalence, 2nd edition. Boca Raton, FL:
Chapman & Hall/CRC.
Wilcox, R. (1998). How many discoveries have been lost by ignoring modern statistical
methods? American Psychologist, 53, 300-314. doi:10.1037/0003-066X.53.3.300.
Zimmerman, D. W. (1996). Some properties of preliminary tests of equality of variances in the
two-sample location problem. The Journal of General Psychology, 123, 217-231.
doi:10.1080/00221309.1996.9921274.
Zimmerman, D. W. (2004). A note on preliminary tests of equality of variances. British Journal
of Mathematical and Statistical Psychology, 57, 173-181. doi:10.1348/000711004849222.

Gatekeeper for the ANOVA 21
Table 1 Conditions used in the Simulation Study.
𝑛� = 20 𝑛� = 50 𝑛� = 200 σ2
J = 2
20, 20 50, 50 200, 200 50, 50
10, 30 25, 75 100, 300 40, 60a
5, 35 15, 85 30, 350 35, 70a
20, 80a
6, 96a
J = 5
20, 20, 20, 20, 20 50, 50, 50, 50, 50 200, 200, 200, 200, 200 50, 50, 50, 50, 50
10, 15, 20, 25, 30 25, 40, 50, 60, 75 100, 150, 200, 250, 300 40, 45, 50, 55, 60a
5, 12, 20, 28, 35 15, 35, 50, 65, 85 50, 125, 200, 275, 350 30, 40, 50, 60, 70a
20, 35, 50, 65, 80a
6, 28, 50, 70, 96a
Note. 𝑛� = average sample size; σ2 = population variances; J = number of groups; a = this pattern of population variances was also reversed in order to created inversely paired population variances and sample sizes.

Gatekeeper for the ANOVA 21
Table 2.
Type I error results with and without a gatekeeper strategy for J = 2.
Gatekeeper Gatekeeper Gatekeeper Gatekeeper
F W LW
M
LW
WM
F W LW
M
LW
WM
F W LW
M
LW
WM
F W LW
M
LW
WM
𝜎2 N = (5, 35) N = (10, 30) N = (15, 85) N = (25, 75)
50, 50 .045 .055 .067 .060 .050 .053 .054 .055 .055 .057 .061 .060 .041 .042 .043 .042
40, 60 .023 .056 .053 .057 .034 .055 .044 .055 .028 .055 .044 .056 .031 .053 .042 .053
30, 70 .010 .050 .043 .050 .018 .054 .041 .054 .011 .049 .045 .049 .019 .049 .045 .049
20, 80 .003 .053 .049 .053 .010 .050 .045 .050 .002 .046 .045 .046 .008 .055 .055 .055
6, 96 .001 .057 .057 .057 .003 .051 .051 .051 .001 .048 .048 .048 .002 .049 .049 .049
60, 40 .093 .061 .105 .068 .079 .055 .080 .057 .087 .045 .085 .051 .077 .053 .073 .054
70, 30 .159 .055 .161 .065 .116 .056 .108 .057 .138 .048 .119 .051 .112 .053 .080 .053
80, 20 .232 .054 .234 .063 .156 .053 .128 .054 .201 .048 .120 .048 .154 .052 .064 .052
96, 6 .411 .053 .403 .053 .238 .050 .099 .050 .340 .050 .057 .050 .228 .052 .052 .052
Note. F = ANOVA F test; W = Welch F test; LW = Levene Welch Median Gatekeeper with Welch Robust test; LWWM = Levene Wellek
Welch Median Gatekeeper with Welch Robust test, Bold = Type I error rate fell outside of Bradley’s liberal limits (.025-.075)

Gatekeeper for the ANOVA 22
Table 3
Type I error results with and without a gatekeeper strategy for J = 5.
Gatekeeper Gatekeeper Gatekeeper Gatekeeper
F W LW
M
LW
WM
F W LW
M
LW
WM
F W LW
M
LW
WM
F W LW
M
LW
WM
𝜎2 N = (5, 12, 20, 28, 35) N = (10, 15, 20, 25, 30) N = (15, 35, 50, 65, 85) N = (25, 40, 50, 60, 75)
50, 50, 50, 50, 50 .052 .055 .064 .058 .052 .053 .054 .054 .054 .053 .057 .056 .051 .050 .052 .052
40, 45, 50, 55, 60 .037 .062 .061 .063 .044 .058 .053 .059 .038 .055 .047 .055 .036 .048 .041 .048
30, 40, 50, 60, 70 .028 .059 .056 .060 .040 .052 .052 .052 .026 .045 .042 .046 .038 .054 .052 .054
20, 35, 50, 65, 80 .022 .056 .055 .056 .029 .053 .052 .053 .019 .047 .047 .047 .030 .051 .050 .051
6, 28, 50, 70, 96 .021 .054 .054 .054 .029 .053 .053 .053 .023 .053 .053 .053 .027 .048 .048 .048
60, 55, 50, 45, 40 .075 .065 .083 .070 .065 .055 .068 .056 .072 .053 .071 .055 .067 .054 .066 .055
70, 60, 50, 40, 30 .112 .070 .117 .073 .090 .055 .086 .056 .100 .050 .082 .051 .078 .049 .064 .050
80, 65, 50, 35, 20 .149 .065 .135 .066 .106 .049 .087 .050 .139 .053 .056 .053 .100 .049 .050 .049
96, 70, 50, 28, 6 .223 .060 .061 .060 .149 .050 .050 .050 .190 .048 .048 .048 .144 .052 .052 .052
Note. F = ANOVA F test; W = Welch F test; LW = Levene Welch Median Gatekeeper with Welch Robust test; LWWM = Levene Wellek
Welch Median Gatekeeper with Welch Robust test, Bold = Type I error rate fell outside of Bradley’s liberal limits (.025-.075)

Gatekeeper for the ANOVA 23
Figure 1. Homogeneity of Variance Tests as Gatekeepers
Homogeneity of Variance Test (HOV)
HOV Satisfied HOV Violated
Traditional
ANOVA
Robust Test
(e.g., Welch F test)