THE VARIABLE USE OF NE - Digital Library/67531/metadc33157/m2/1/high... · Gould, Rebecca J. The...
78
APPROVED: Lawrence Williams, Major Professor Dorian Roehrs, Committee Member Donny A. Vigil, Committee Member Marie-Christine Koop, Chair of the Department of Foreign Languages and Literatures James D. Meernik, Acting Dean of the Robert B. Toulouse School of Graduate Studies THE VARIABLE USE OF NE IN NEGATIVE STRUCTURES: AN APPARENT-TIME VARIATIONIST STUDY OF SYNCHRONOUS ELECTRONIC FRENCH DISCOURSE Rebecca J. Gould Thesis Prepared for the Degree of MASTER OF ARTS UNIVERSITY OF NORTH TEXAS December 2010
Transcript of THE VARIABLE USE OF NE - Digital Library/67531/metadc33157/m2/1/high... · Gould, Rebecca J. The...
APPROVED: Lawrence Williams, Major Professor Dorian Roehrs, Committee Member Donny A. Vigil, Committee Member Marie-Christine Koop, Chair of the
Department of Foreign Languages and Literatures
James D. Meernik, Acting Dean of the Robert B. Toulouse School of Graduate Studies
THE VARIABLE USE OF NE IN NEGATIVE STRUCTURES: AN APPARENT-TIME
VARIATIONIST STUDY OF SYNCHRONOUS ELECTRONIC
FRENCH DISCOURSE
Rebecca J. Gould
Thesis Prepared for the Degree of
MASTER OF ARTS
UNIVERSITY OF NORTH TEXAS
December 2010
Gould, Rebecca J. The variable use of ne in negative structures: An apparent-
time variationist study of synchronous electronic French discourse. Master of Arts
(French), December 2010, 71 pp., 13 tables, 1 figure, references, 33 titles.
This study of the variable use of ne in synchronous electronic French discourse
follows the methodological guidelines and the theoretical framework proposed and
subsequently elaborated by Labov for analyzing variable features of language. This
thesis provides a quantitative variable rule (i.e., VARBRUL) analysis including age as a
factor group (i.e., independent variable), thereby making a new contribution to this area
of inquiry. The data (50,000 words from the vingtaine 'twentysomething' channel and
50,000 words from the cinquantaine 'fiftysomething' channel) are a subset of 100,000
words from a corpus of one million words collected in 2008 by the thesis director from
the public chat server EuropNet.
This study aims to answer the following overarching question: To what extent
does age—compared to other factors—influence the variable use of ne in verbal
negation in synchronous electronic French discourse? In order to answer this question,
and possibly others, the VARBRUL analysis will include age, subject (e.g., noun vs.
pronoun), type of second negative particle (e.g., pas 'not', jamais 'never', personne 'no
one'/'nobody', and so forth), as well as verbal mood/tense.

ii
Copyright 2010
by
Rebecca J. Gould
iii
TABLE OF CONTENTS
Page
LIST OF TABLES............................................................................................................v
LIST OF FIGURES.........................................................................................................vi
1. INTRODUCTION.........................................................................................................1
1.1 Aim and Scope................................................................................................1
1.2 Chat Discourse................................................................................................2
1.3 The Variationist Tradition in Sociolinguistics ..................................................5
1.4 The Origin and Development of Ne Use.........................................................7
1.5 Negation in French..........................................................................................8
2. PREVIOUS STUDIES OF NE RETENTION..............................................................13
2.1 Synthesis......................................................................................................13
2.2 Factors that Influence Ne Retention..............................................................15
2.2.1 Linguistic factors..............................................................................16
2.2.2 Individual (Macrosociological) Factors.............................................17
3. METHODOLOGY.......................................................................................................20
3.1 Description of the Corpus..............................................................................20
3.2 Coding...........................................................................................................22
3.3 Examples of Ne from the Corpus..................................................................23
3.4 Variable Rule Analysis..................................................................................25
3.5 Levels of Analysis in GoldVarb X..................................................................27
4. RESULTS AND ANALYSIS.......................................................................................32
4.1 Residuals (Percentages): Distribution of Ne Absence/Presence.................32
iv
4.2 Cross Tabulation...........................................................................................34
4.3 One-Level Binomial Analysis........................................................................35
4.4 Step-up/step-down analysis..........................................................................37
4.5 Statistical significance..................................................................................39
4.6 Ranges.........................................................................................................40
5. CONCLUSION...........................................................................................................41
Appendices
A. GOLDVARB X DATA CODING KEY.........................................................43
B. BINOMIAL ONE-STEP ANALYSIS WITH ALL DATA...............................46
C. CROSS TABULATION WITH ALL DATA.................................................50
D. KNOCKOUTS AND SINGLETONS FROM BINOMIAL ONE-STEP.........56
E. BINOMIAL ONE-STEP ANALYSIS REDONE EXCLUDING KNOCKOUTS,
SINGLETONS, VARIABLE 1 (SECOND NEGATIVE PARTICLE),
AND VARIABLE 3 AND (VERB MOOD/TENSE).............................58
F. CROSS TABULATION WITH VARIABLES 2 AND 4................................61
G. BINOMIAL STEP-UP ANALYSIS.............................................................63
H. BINOMIAL STEP-DOWN ANALYSIS.......................................................65 REFERENCES.............................................................................................................67
v
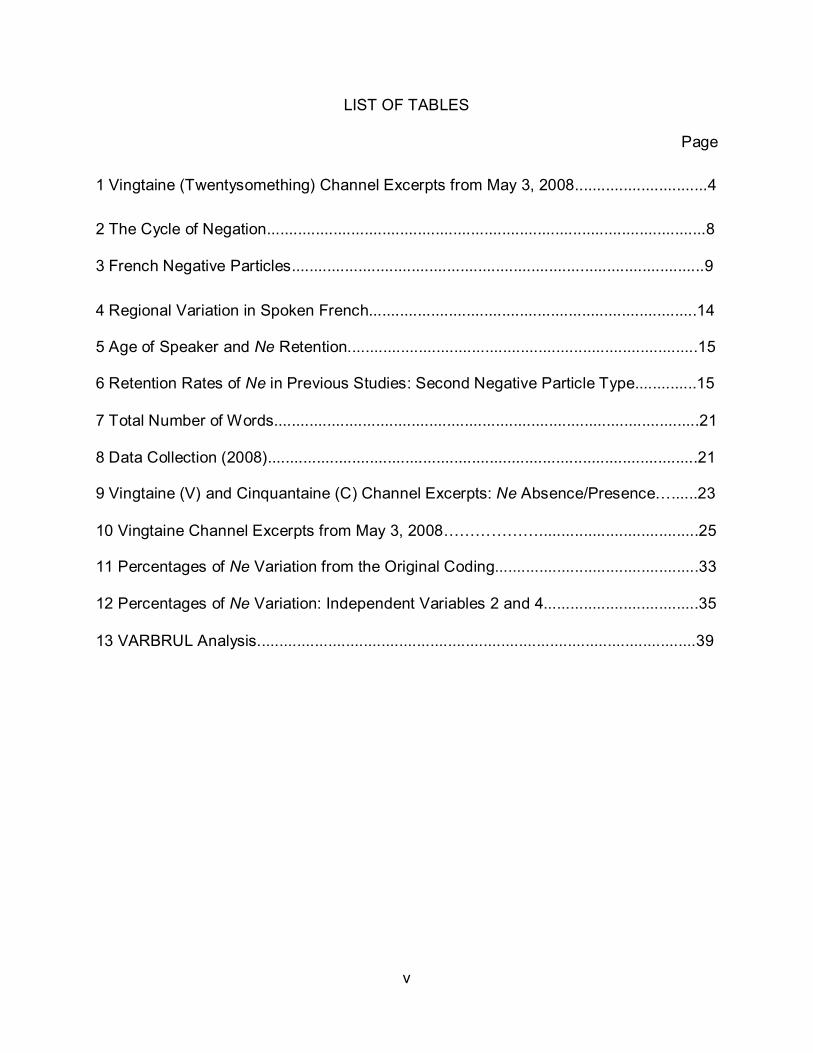
LIST OF TABLES
Page
1 Vingtaine (Twentysomething) Channel Excerpts from May 3, 2008..............................4 2 The Cycle of Negation...................................................................................................8
3 French Negative Particles.............................................................................................9
4 Regional Variation in Spoken French..........................................................................14
5 Age of Speaker and Ne Retention...............................................................................15
6 Retention Rates of Ne in Previous Studies: Second Negative Particle Type..............15 7 Total Number of Words................................................................................................21
8 Data Collection (2008).................................................................................................21
9 Vingtaine (V) and Cinquantaine (C) Channel Excerpts: Ne Absence/Presence…......23
10 Vingtaine Channel Excerpts from May 3, 2008………………....................................25
11 Percentages of Ne Variation from the Original Coding..............................................33
12 Percentages of Ne Variation: Independent Variables 2 and 4...................................35 13 VARBRUL Analysis...................................................................................................39

vi
LIST OF FIGURES
Page
1. Scattergram of recoded data: Binomial one-step analysis.........................................37
1
CHAPTER 1
INTRODUCTION
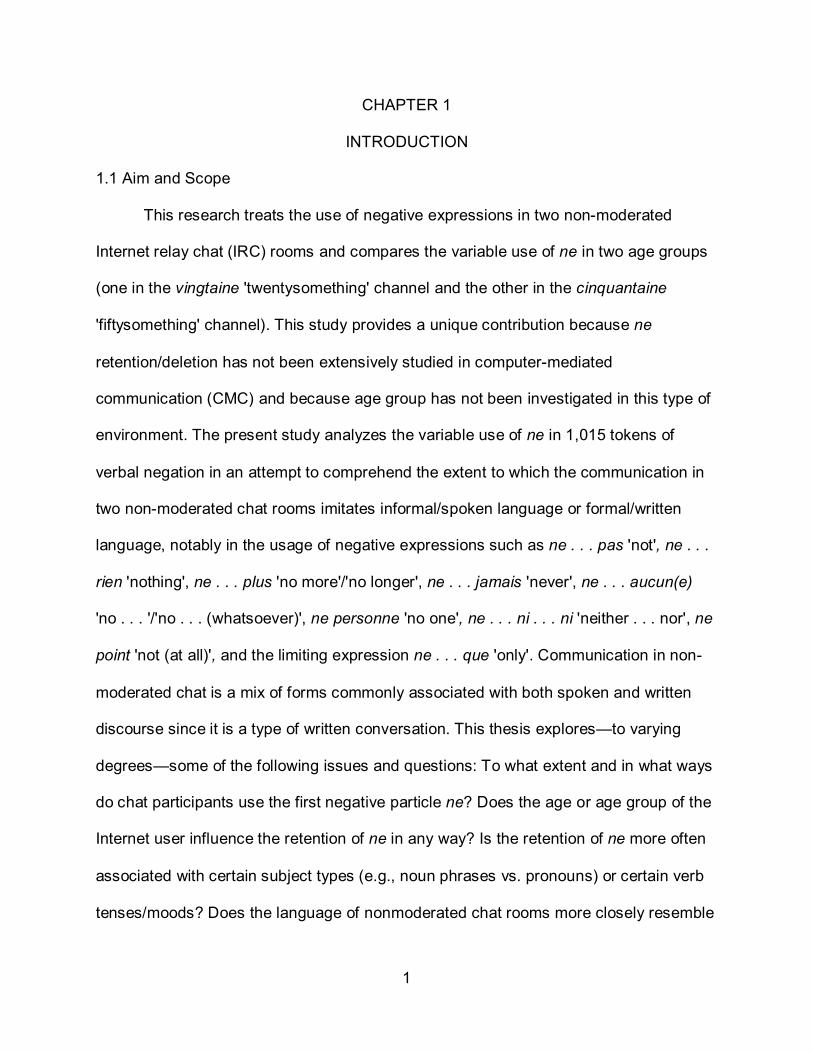
1.1 Aim and Scope
This research treats the use of negative expressions in two non-moderated
Internet relay chat (IRC) rooms and compares the variable use of ne in two age groups
(one in the vingtaine 'twentysomething' channel and the other in the cinquantaine
'fiftysomething' channel). This study provides a unique contribution because ne
retention/deletion has not been extensively studied in computer-mediated
communication (CMC) and because age group has not been investigated in this type of
environment. The present study analyzes the variable use of ne in 1,015 tokens of
verbal negation in an attempt to comprehend the extent to which the communication in
two non-moderated chat rooms imitates informal/spoken language or formal/written
language, notably in the usage of negative expressions such as ne . . . pas 'not', ne . . .
rien 'nothing', ne . . . plus 'no more'/'no longer', ne . . . jamais 'never', ne . . . aucun(e)
'no . . . '/'no . . . (whatsoever)', ne personne 'no one', ne . . . ni . . . ni 'neither . . . nor', ne
point 'not (at all)', and the limiting expression ne . . . que 'only'. Communication in non-
moderated chat is a mix of forms commonly associated with both spoken and written
discourse since it is a type of written conversation. This thesis explores—to varying
degrees—some of the following issues and questions: To what extent and in what ways
do chat participants use the first negative particle ne? Does the age or age group of the
Internet user influence the retention of ne in any way? Is the retention of ne more often
associated with certain subject types (e.g., noun phrases vs. pronouns) or certain verb
tenses/moods? Does the language of nonmoderated chat rooms more closely resemble
2
formal written French (where the ne is generally retained) or everyday spoken French
(where the ne is in many cases not used)? Which factor(s) most significantly favors ne
retention in this context?
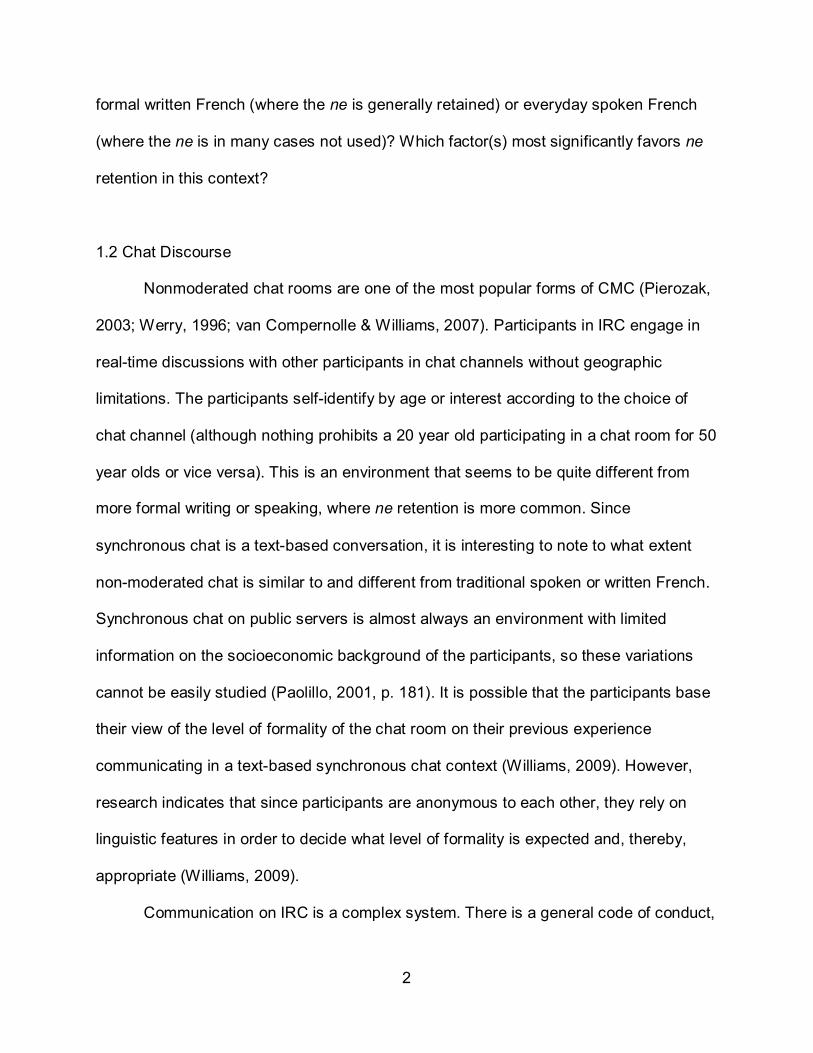
1.2 Chat Discourse
Nonmoderated chat rooms are one of the most popular forms of CMC (Pierozak,
2003; Werry, 1996; van Compernolle & Williams, 2007). Participants in IRC engage in
real-time discussions with other participants in chat channels without geographic
limitations. The participants self-identify by age or interest according to the choice of
chat channel (although nothing prohibits a 20 year old participating in a chat room for 50
year olds or vice versa). This is an environment that seems to be quite different from
more formal writing or speaking, where ne retention is more common. Since
synchronous chat is a text-based conversation, it is interesting to note to what extent
non-moderated chat is similar to and different from traditional spoken or written French.
Synchronous chat on public servers is almost always an environment with limited
information on the socioeconomic background of the participants, so these variations
cannot be easily studied (Paolillo, 2001, p. 181). It is possible that the participants base
their view of the level of formality of the chat room on their previous experience
communicating in a text-based synchronous chat context (Williams, 2009). However,
research indicates that since participants are anonymous to each other, they rely on
linguistic features in order to decide what level of formality is expected and, thereby,
appropriate (Williams, 2009).
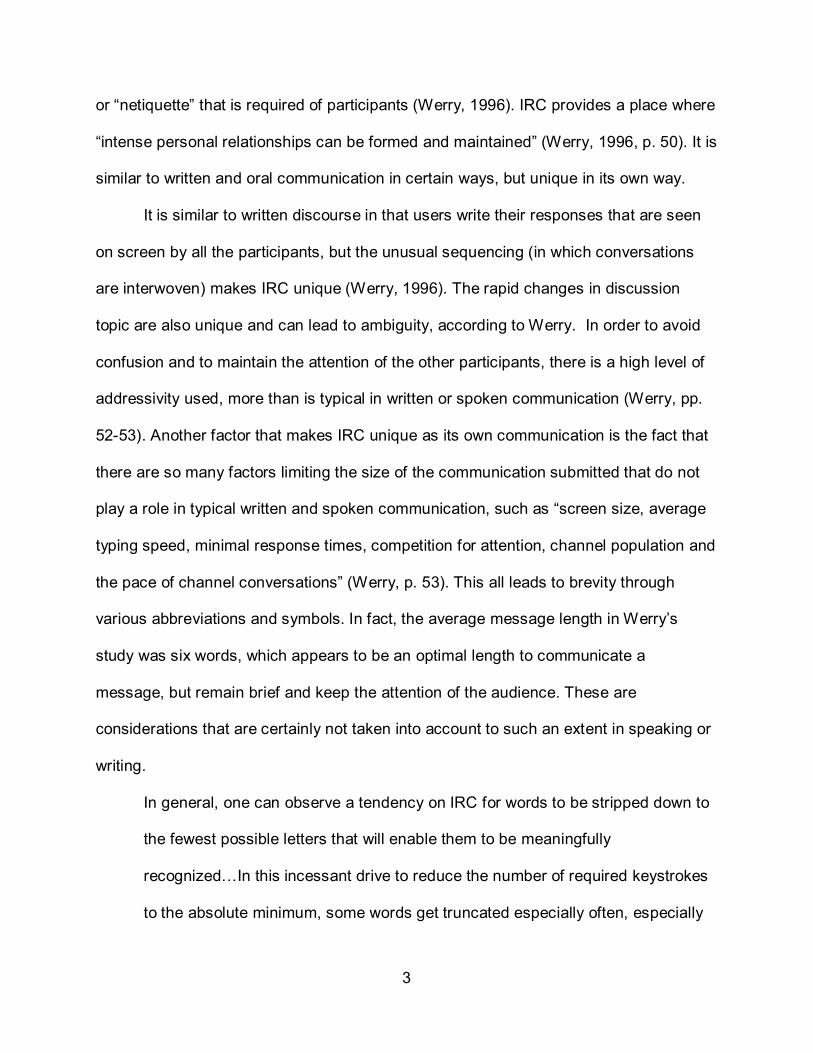
Communication on IRC is a complex system. There is a general code of conduct,
3
or “netiquette” that is required of participants (Werry, 1996). IRC provides a place where
“intense personal relationships can be formed and maintained” (Werry, 1996, p. 50). It is
similar to written and oral communication in certain ways, but unique in its own way.
It is similar to written discourse in that users write their responses that are seen
on screen by all the participants, but the unusual sequencing (in which conversations
are interwoven) makes IRC unique (Werry, 1996). The rapid changes in discussion
topic are also unique and can lead to ambiguity, according to Werry. In order to avoid
confusion and to maintain the attention of the other participants, there is a high level of
addressivity used, more than is typical in written or spoken communication (Werry, pp.
52-53). Another factor that makes IRC unique as its own communication is the fact that
there are so many factors limiting the size of the communication submitted that do not
play a role in typical written and spoken communication, such as “screen size, average
typing speed, minimal response times, competition for attention, channel population and
the pace of channel conversations” (Werry, p. 53). This all leads to brevity through
various abbreviations and symbols. In fact, the average message length in Werry’s
study was six words, which appears to be an optimal length to communicate a
message, but remain brief and keep the attention of the audience. These are
considerations that are certainly not taken into account to such an extent in speaking or
writing.
In general, one can observe a tendency on IRC for words to be stripped down to
the fewest possible letters that will enable them to be meaningfully
recognized…In this incessant drive to reduce the number of required keystrokes
to the absolute minimum, some words get truncated especially often, especially
4
those that resemble the sound of a single letter when pronounced. (Werry, p. 55)
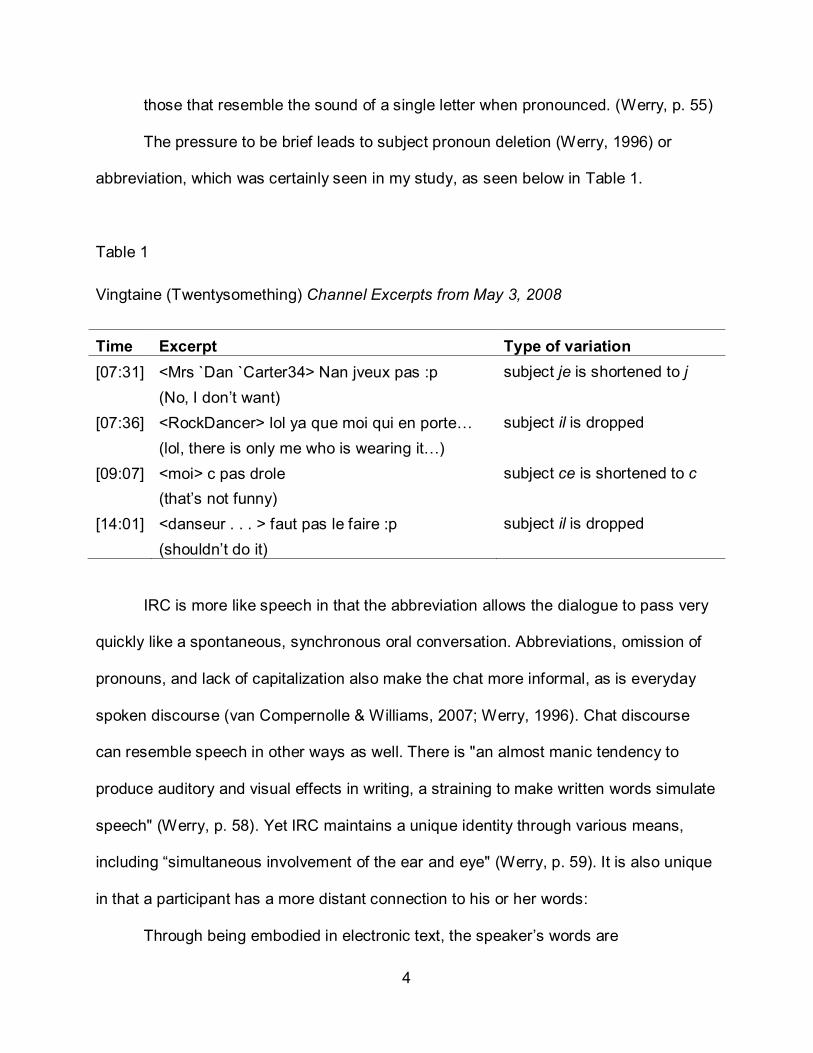
The pressure to be brief leads to subject pronoun deletion (Werry, 1996) or
abbreviation, which was certainly seen in my study, as seen below in Table 1.
Table 1
Vingtaine (Twentysomething) Channel Excerpts from May 3, 2008 Time Excerpt Type of variation [07:31] <Mrs `Dan `Carter34> Nan jveux pas :p
(No, I don’t want) subject je is shortened to j
[07:36] <RockDancer> lol ya que moi qui en porte… (lol, there is only me who is wearing it…)
subject il is dropped
[09:07] <moi> c pas drole (that’s not funny)
subject ce is shortened to c
[14:01] <danseur . . . > faut pas le faire :p (shouldn’t do it)
subject il is dropped
IRC is more like speech in that the abbreviation allows the dialogue to pass very
quickly like a spontaneous, synchronous oral conversation. Abbreviations, omission of
pronouns, and lack of capitalization also make the chat more informal, as is everyday
spoken discourse (van Compernolle & Williams, 2007; Werry, 1996). Chat discourse
can resemble speech in other ways as well. There is "an almost manic tendency to
produce auditory and visual effects in writing, a straining to make written words simulate
speech" (Werry, p. 58). Yet IRC maintains a unique identity through various means,
including “simultaneous involvement of the ear and eye" (Werry, p. 59). It is also unique
in that a participant has a more distant connection to his or her words:
Through being embodied in electronic text, the speaker’s words are
5
depersonalized, stripped of all of the material qualities that individualize them and
connect them to a particular speaker…The process of self-consciously
constructing the paralinguistic dimensions of communication may heighten the
sense of their artificiality, and lead to an increased tendency to experiment and
play with them. (Werry, p. 59)
Although there is no data on participants, internal linguistic factors, such as
subject and verb tense, can still be studied. This method of data collection, wherein
participants communicate with one another rather than an interviewer may be more
authentic and more revealing (Labov, 1972, pp. 89-90). Of course, this conversation
took place in a public space and since participants are aware of that, they may have
modified what they might have said in private.
1.3 The Variationist Tradition in Sociolinguistics
As language does not live in a vacuum, but rather in an active community of
dynamic participants in which “social pressures are continually operating upon
language” (Labov, 1972, p. 3), observers of the language may notice variations in each
speaker’s choice of words and pronunciations based on context.
As the founder of variationist sociolinguistics, William Labov has focused on
using variation to explain change. This is unique from earlier (socio)linguistic studies
because the focus is limited to features, structures, and elements that can be spoken or
written in at least two different ways. The speaker makes a choice based on certain
aspects of context or any other number of factors. Variationist sociolinguistics can often
provide clear answers that cannot be uncovered through many types of discrete
6
linguistic analysis. Some previous research has studied ne retention in a variationist-
inspired framework (Labov, 1972), which takes into consideration, among other things,
the age, gender, educational background, and social class of participants. This
approach also allows for the consideration of the influence of subject type and second
negative particle, among other internal/linguistic factors. The Labovian framework is
primarily interested in variation as a way to explain change in progress or completed
change(s). The variationist methodology is considered to be valid and lends legitimacy
to the methods employed in this study.
[E]very-day speech involved a great deal of variation, which the standard theory
was not equipped to deal with. The tools for studying variation and change in
progress emerged from that situation. Eventually, it turned out that the study of
variation gave clear answers to many of the problems that were not resolved by a
discrete view of linguistic structure. (Labov, 2007)
Labov preferred the study of everyday language to more formal contexts because he
found that everyday speech is more effective in addressing the major questions of
(socio)linguistics.
The problem of explaining language change seems to resolve itself into three
separate problems: the origin of linguistic variations; the spread and propagation
of linguistic changes; and the regularity of linguistic change. The model which
underlies this three-way division requires as a starting point a variation in one or
several words in the speech of one or two individuals. (Labov, 1972, p. 1)
Negation in French is an excellent element for demonstrating variation in language
since it can be studied using, among other things, the variationist approach. Its
7
frequency of appearance in natural, undirected discourse; its structure; its integration
into the communicative system; and its highly-stratified distribution (based on age or
other societal divisions) make it ideal for study (pp. 7-8).
1.4 The Origin and Development of Ne Use
The use of the negative particle ne has its origins in Old French when ne was the
sole component of the negative expression. It was located structurally before the verb.
In the Middle Ages, a second negative particle was often added for emphasis after the
verb (Rickard, 2003). Instead of simply being able to say not, a range of negative
expressions allowed for more specificity or for providing additional information. During
the period of Classical (Modern) French (17th and 18th centuries), as the second
negative expression became more widely used, the emphasis that it had implied before
was gone and the second part of the negative expression became standard (Rickard,
1989). And in modern French, the second negative expression carries more of the
semantic weight of the negative expression, making the retention of ne less important
for comprehension (Williams, 2009).
The deletion of ne is a fairly recent phenomenon, appearing in some literature
produced during the 17th and 18th centuries (where ne deletion was associated with
lower socioeconomic status), but not appearing to be widespread until the 19th century
(Ayers-Bennett, 1996). It is impossible from written texts to determine the exact timing in
which ne deletion became standard (i.e., included in grammars, dictionaries, and
curricula). In any case, it is clear that ne deletion is now common among a large
majority of French speakers in an informal setting (and, in some instances, even in
8
formal settings), regardless of socioeconomic status or age. Ne deletion continues to be
an important sociolinguistic tool to signal the speaker’s perception of the level of
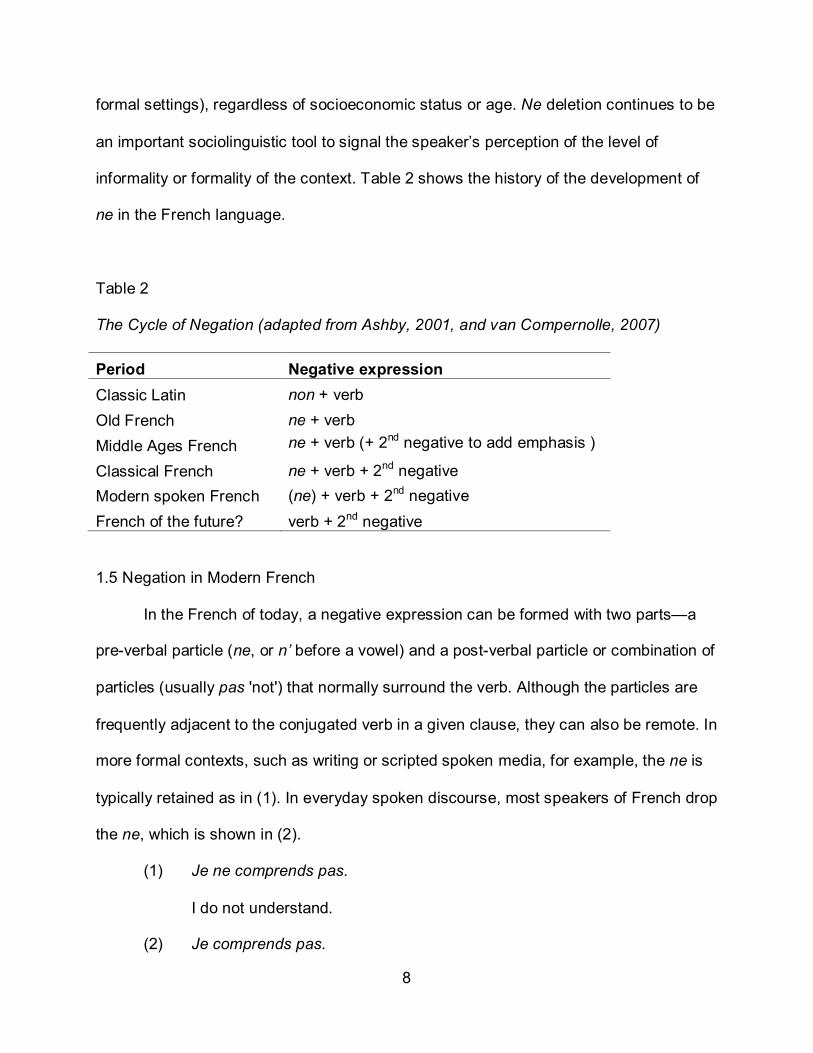
informality or formality of the context. Table 2 shows the history of the development of
ne in the French language.
Table 2
The Cycle of Negation (adapted from Ashby, 2001, and van Compernolle, 2007)
Period Negative expression Classic Latin non + verb Old French ne + verb Middle Ages French ne + verb (+ 2nd negative to add emphasis )
Classical French ne + verb + 2nd negative Modern spoken French (ne) + verb + 2nd negative French of the future? verb + 2nd negative
1.5 Negation in Modern French
In the French of today, a negative expression can be formed with two parts—a
pre-verbal particle (ne, or n’ before a vowel) and a post-verbal particle or combination of
particles (usually pas 'not') that normally surround the verb. Although the particles are
frequently adjacent to the conjugated verb in a given clause, they can also be remote. In
more formal contexts, such as writing or scripted spoken media, for example, the ne is
typically retained as in (1). In everyday spoken discourse, most speakers of French drop
the ne, which is shown in (2).
(1) Je ne comprends pas.
I do not understand.
(2) Je comprends pas.
9
I do not understand. (I don't understand.)
Both the first and second negative particles are placed before an infinitive.
(3) Tu essaies de ne pas oublier?
You are trying not to forget?
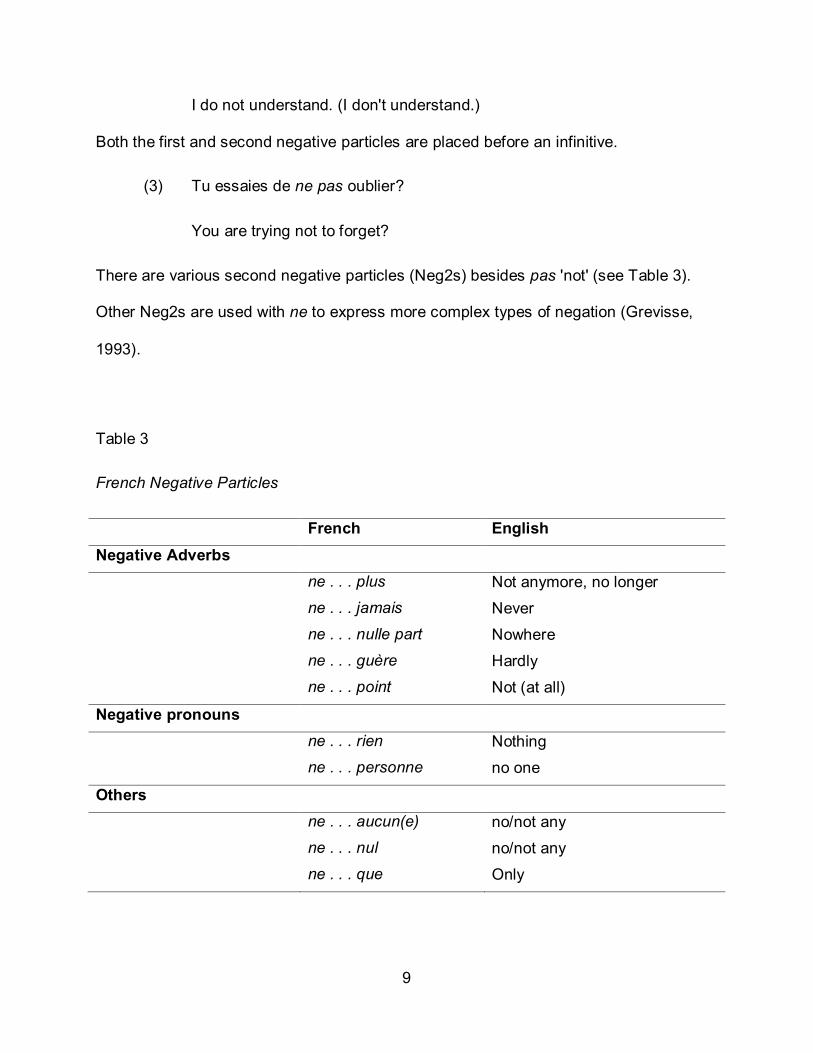
There are various second negative particles (Neg2s) besides pas 'not' (see Table 3).
Other Neg2s are used with ne to express more complex types of negation (Grevisse,
1993).
Table 3
French Negative Particles
French English Negative Adverbs
ne . . . plus Not anymore, no longer
ne . . . jamais Never
ne . . . nulle part Nowhere
ne . . . guère Hardly
ne . . . point Not (at all)
Negative pronouns
ne . . . rien Nothing
ne . . . personne no one
Others
ne . . . aucun(e) no/not any
ne . . . nul no/not any
ne . . . que Only
10
Selected examples of negative particles from Table 2 are provided below in (4), (5), (6),
(7), and (8).
(4) Il ne regarde plus.
He is not watching anymore.
(5) Elle n’a vu personne.
She saw no one.
(6) Nous n’avons rien mangé.
We did not eat anything./ We ate nothing.
(7) Je n’ai aucune idée.
I have no idea (whatsoever).
(8) Ils ne veulent que celui qui est grand.
They only want the big one.
Rien and personne can also be used as the subject of a sentence, as in (9) and (10).
(9) Rien n'est certain.
Nothing is certain.
(10) Personne ne sait.
No one knows.
Multiple negative words (other than pas) can be placed together as a simple negation,
as in (11).
11
(11) Elle n'a plus jamais rien dit à personne.
She never said anything else to anybody.
Double negative particles (i.e., pas 'not' followed by a second Neg2) form a double
negation, as shown in (12).
(12) Elle n'a pas vu personne.
She did not see nobody (i.e., she saw somebody).
In certain literary contexts, ne can express negation by itself without a second
negative particle. There are four verbs that may use this literary construction (pouvoir
'to be able to', savoir 'to know', oser 'to dare', and cesser 'to cease') as well as certain
proverbs and fixed expressions (Grevisse, 1993).
(13) (standard, ne + pas) Je ne sais pas. 'I do not know.'
(14) (casual, pas only) Je sais pas. 'I do not know.'/'I don't know.'
(15) (literary, ne only) Je ne sais. 'I do not know.'
The French expletive ne is used in certain cases without signifying any negation. It is
found in finite subordinate clauses (never before an infinitive) and is used only in the
following contexts (Grevisse, 1993):
• The complement clause of verbs expressing fear or avoidance: craindre (to fear), avoir peur (to be afraid), empêcher (to prevent), éviter (to avoid)
• The complement clause of verbs expressing doubt or denial: douter (to doubt), nier (to deny)
• Adverbial clauses introduced by the following expressions: avant que (before), à moins que (unless), de peur/crainte que (for fear that)
12
• Comparative constructions expressing inequality: autre (other), meilleur (better), plus fort (stronger), moins intelligent (less intelligent), etc.
(16) J'ai peur que cela ne se reproduise [Ø].
I am afraid that it might happen again.
(17) Il est arrivé avant que nous n'ayons [Ø] commencé.
He arrived before we started.
(18) Ils sont plus nombreux que tu ne le crois [Ø].
There are more of them than you think.
13
CHAPTER 2
PREVIOUS STUDIES OF NE DELETION/RETENTION
2.1 Synthesis
The negative particle ne is considered to be one of the primary indicators of
sociolinguistic variation in French (Coveney, 1996; Gadet, 1989; Williams, 2009) and is
thus an important area of study in linguistics. French negation was chosen for this
study because of its frequency of usage, its well-integrated structure, its possibility as a
variation between two choices (with or without the ne), its seemingly unpredictability,
and its distribution through social groups. The evolution of ne retention is incontestable
(Hansen & Malderez, 2004, p. 9). The retention of ne is generally associated with
written French or formal speech. Ne is normally dropped in casual conversation.
According to the sociolinguist Françoise Gadet, the ne has so often disappeared in
spoken French that this practice is no longer stigmatized (Fonseca-Greber, 2007) and
no longer is as closely associated with social class as it has been in the past (Hansen &
Malderez, p. 27). On the other hand, the frequency of the appearance of the ne in
written language remains at 33-75% (Hansen et Malderez). Previous studies of the use
of negative particles in e-mail, chat rooms, and forums (Panckhurst, 2007, p.121;
Williams, 2009) suggest that the use of pas without ne in negative structures is not
frequent for all speakers in all contexts (e.g., educational vs. noneducational contexts;
moderated chat vs. nonmoderated chat). However, the decreased use of the ne in
spoken French seems to be common for the majority of French speakers. The ne only
appeared in 10% of negative utterances in Fonseca-Greber's (2007) study of spoken
French, perhaps since it is the post-verbal negative expression that conveys the specific
14
nuance of negation in Modern French. Fonseca-Greber also found that the retention of
ne is more frequent when a person speaks with emphasis or adds an intensifying
adverb. Another study (Armstrong & Smith, 2002) that agrees with that of Greber
regarding the overall retention of ne suggests that the ne does not disappear if the
register of the language is at a high level or if the tone of the language is serious (p. 25).
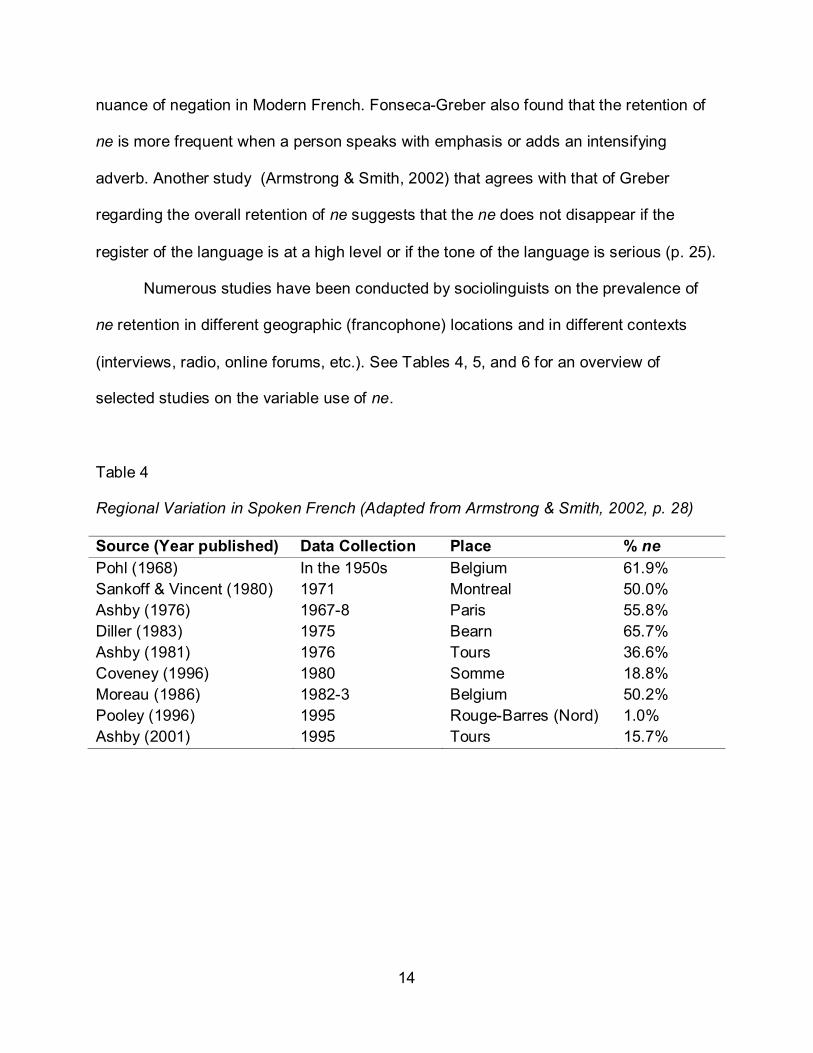
Numerous studies have been conducted by sociolinguists on the prevalence of
ne retention in different geographic (francophone) locations and in different contexts
(interviews, radio, online forums, etc.). See Tables 4, 5, and 6 for an overview of
selected studies on the variable use of ne.
Table 4
Regional Variation in Spoken French (Adapted from Armstrong & Smith, 2002, p. 28)
Source (Year published) Data Collection Place % ne Pohl (1968) In the 1950s Belgium 61.9% Sankoff & Vincent (1980) 1971 Montreal 50.0% Ashby (1976) 1967-8 Paris 55.8% Diller (1983) 1975 Bearn 65.7% Ashby (1981) 1976 Tours 36.6% Coveney (1996) 1980 Somme 18.8% Moreau (1986) 1982-3 Belgium 50.2% Pooley (1996) 1995 Rouge-Barres (Nord) 1.0% Ashby (2001) 1995 Tours 15.7%
15
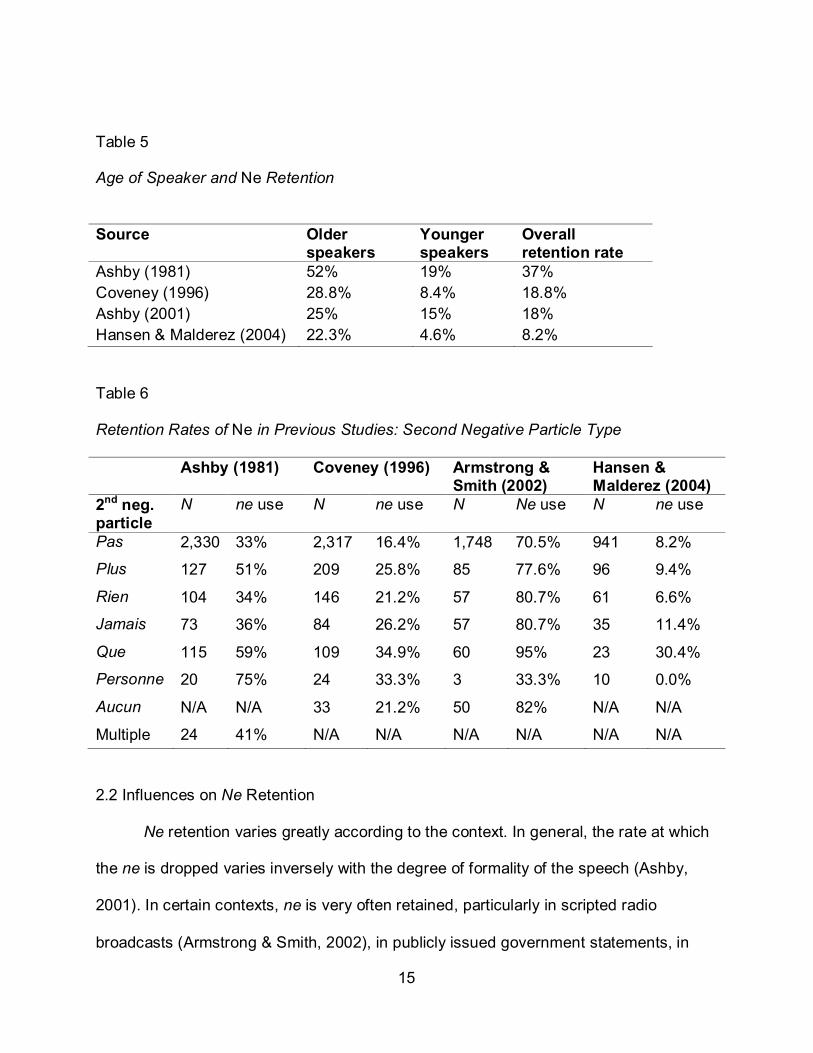
Table 5
Age of Speaker and Ne Retention
Source Older
speakers Younger speakers
Overall retention rate
Ashby (1981) 52% 19% 37% Coveney (1996) 28.8% 8.4% 18.8% Ashby (2001) 25% 15% 18% Hansen & Malderez (2004) 22.3% 4.6% 8.2% Table 6 Retention Rates of Ne in Previous Studies: Second Negative Particle Type Ashby (1981) Coveney (1996) Armstrong &
Smith (2002) Hansen & Malderez (2004)
2nd neg. particle
N ne use N ne use N Ne use N ne use
Pas 2,330 33% 2,317 16.4% 1,748 70.5% 941 8.2%
Plus 127 51% 209 25.8% 85 77.6% 96 9.4%
Rien 104 34% 146 21.2% 57 80.7% 61 6.6%
Jamais 73 36% 84 26.2% 57 80.7% 35 11.4%
Que 115 59% 109 34.9% 60 95% 23 30.4%
Personne 20 75% 24 33.3% 3 33.3% 10 0.0%
Aucun N/A N/A 33 21.2% 50 82% N/A N/A
Multiple 24 41% N/A N/A N/A N/A N/A N/A 2.2 Influences on Ne Retention
Ne retention varies greatly according to the context. In general, the rate at which
the ne is dropped varies inversely with the degree of formality of the speech (Ashby,
2001). In certain contexts, ne is very often retained, particularly in scripted radio
broadcasts (Armstrong & Smith, 2002), in publicly issued government statements, in
16
French-language newspaper and magazine articles (nearly 100% ne retention), in
forums, and in moderated chat (Williams, 2009). However, in sociolinguistic interviews
with participants, ne varies greatly, and in nonmoderated chat, the retention of ne can
be as low as around 16% (van Compernolle, 2008; Williams, 2009). The prevalence of
ne retention is not simply a matter of age, gender or social class. This linguistic variable
is found in all different speakers, although at different rates (Ashby, 2001).
2.2.1 Linguistic Factors
The prevalence of ne retention generally relies on several factors, including
which second negative expression is used. More commonly used second negative
expressions, such as pas, are less likely to be accompanied by the ne (Armstrong &
Smith, 2002; Hansen & Malderez, 2004, p. 15; van Compernolle, 2008, p. 317;
Williams, 2009, p. 474).
Subject type is another factor that generally affects ne retention. For example,
when the subject is a common noun or proper noun, the ne is more often retained. But
the ne is generally dropped when there is a subject pronoun (Armstrong & Smith, 2002;
Hansen & Malderez, 2004, pp. 15 and 21).
A third factor that appears to affect the prevalence of ne retention is verb
tense/mood and the frequency of the verb. Imperative clauses in particular appear to
have a high ne retention rate. Armstrong and Smith (2002) reported a rate of 95%.
Commonly used verbs (e.g. être, avoir, savoir and pouvoir) retain the ne less frequently
than other verbs (Hansen & Malderez, 2004). There is also evidence that ne retention
can be influenced by the presence of an object pronoun (Hansen & Malderez, 2004, p.
17
15), although that was not studied here.
2.2.2 Individual (Macrosociological) Factors
A fourth factor that appears to affect the prevalence of ne retention is the age of
the speaker. There has been a marked difference in ne retention amongst different age
groups. In particular, young people drop the ne in everyday conversation much more
commonly than older speakers (Ashby, 2001). In Ashby’s research (conducted in 1976
and 1995), age was one of the most important influences on ne retention (Ashby, 2001).
He found approximately 25% ne retention for 51-64 year olds and approximately 13%
ne retention for 14-22 year olds for his 1995 data (as compared to 52% and 19%
respectively in 1976) (Ashby, 2001). Coveney also found that age had a significant
effect on ne retention. He found 29% ne retention for 50-60 year olds and 8% for 17-22
year olds (Coveney, 1996, p. 86). Interestingly enough, the retirees in Ashby’s research
had adopted a more casual form of speech and tended to drop the ne more readily than
those still in the workforce (Ashby, 2001, p. 19). Hansen and Malderez (2004) found
that age had a much more convincing effect on ne retention than social class. Since
both age and subject type have both been shown consistently to favor ne retention in
past studies, it is important to note that this is the only online chat conducted that
compares these two factors to determine which is more likely to favor ne retention.
There are two possible explanations for the difference between the age groups
according to Ashby: 1) that ne is disappearing from spoken language, just as it virtually
has from Quebec French (Sankoff & Vincent, 1981) and is just happening more quickly
with younger speakers than older speakers, or 2) that the older speakers are simply
18
choosing a more formal linguistic style (called la langue de dimanche 'the language of
Sunday') than the younger speakers who choose to use so-called "everyday" language
(Ashby, 2001; Blanche-Benveniste & Jeanjean, 1987). Does a speaker make linguistic
changes over time or make consistent choices throughout his life in regards to ne
retention? Does he become more formal as he ages or does he remain the same while
the following generation is less formal? If individuals change their linguistic behavior
throughout their lifetimes, but the community as a whole does not, the pattern can be
characterized as one of age grading" (Labov, 1994, p. 84).
For the present study, an apparent-time approach was adopted, whereas Ashby
(2001) conducted a real-time study by collecting data from the same participants at two
different points in time. The only sure way to determine if there has been a linguistic
change is to undertake a real-time study (Ashby, 2001). “If we confine our observations
to distributions in apparent time, we will detect those conditions that lead to a
differentiation of generations: that is, age grading and generational change. We will not
be able to distinguish between the two" (Labov, 1994, p. 84).
A fifth factor that may affect the prevalence of ne retention is seriousness of
subject, for example religion or education, among others (Hansen & Malderez, 2004, p.
21; Williams, 2009, p. 474). Subject matter of the participants was not examined in the
present study since the range of topics in synchronous chat tends to be vast and the
focus of participants almost always seems scattered.
A sixth factor that appears to affect the prevalence of ne retention is social class
(Ashby, 2001). In Ashby’s research conducted in 1976 and 1995, the lower
socioeconomic class had a much lower ne retention than the middle and upper classes
19
(Ashby, 2001). One of his young bourgeois participants had a 93% ne retention rate.
The research of Hansen and Malderez had less clear results, perhaps because they
based the definition of social class simply on level of education without considering
other factors (background, professional activities, network, etc.) (Hansen & Malderez,
2004, p. 19). Since the participants in my study were anonymous, their socioeconomic
status was not examined.
Interestingly enough, Ashby found no significant difference between ne retention
in gender (Ashby, 2001). Neither did other studies (Coveney, 1996, p. 87, Hansen &
Malderez, 2004, p. 18). Gender was not considered in the present study due to the
unavailability of information on this feature.
One final factor that may influence ne retention is the geographic origin of the
individual. Hansen and Malderez found that speakers who were born in the Paris region
or in the Oise region (6.4% ne retention) dropped the ne more commonly than speakers
who were raised in other parts of France (17% ne retention) (Hansen & Malderez, 2004,
p. 20). Since geographic origin of the participants was not known (unless they by
chance revealed it in the conversation), this factor was not part of the present study.
Ne retention appears to be a choice of register based on various factors of the
individual (e.g. age, gender, class, education, etc.) and others related to the context
(e.g., speaking to a peer vs. an employer). For example, in Ashby’s work, speakers
taped at home had lower ne retention rates than those taped at their office (Ashby,
2001, p. 16). Also see Bell (1981) for a summary of research based on speakers
changing degree of formality based on context and on their perception of the listener.
20
CHAPTER 3
METHODOLOGY
3.1 Description of the Corpus
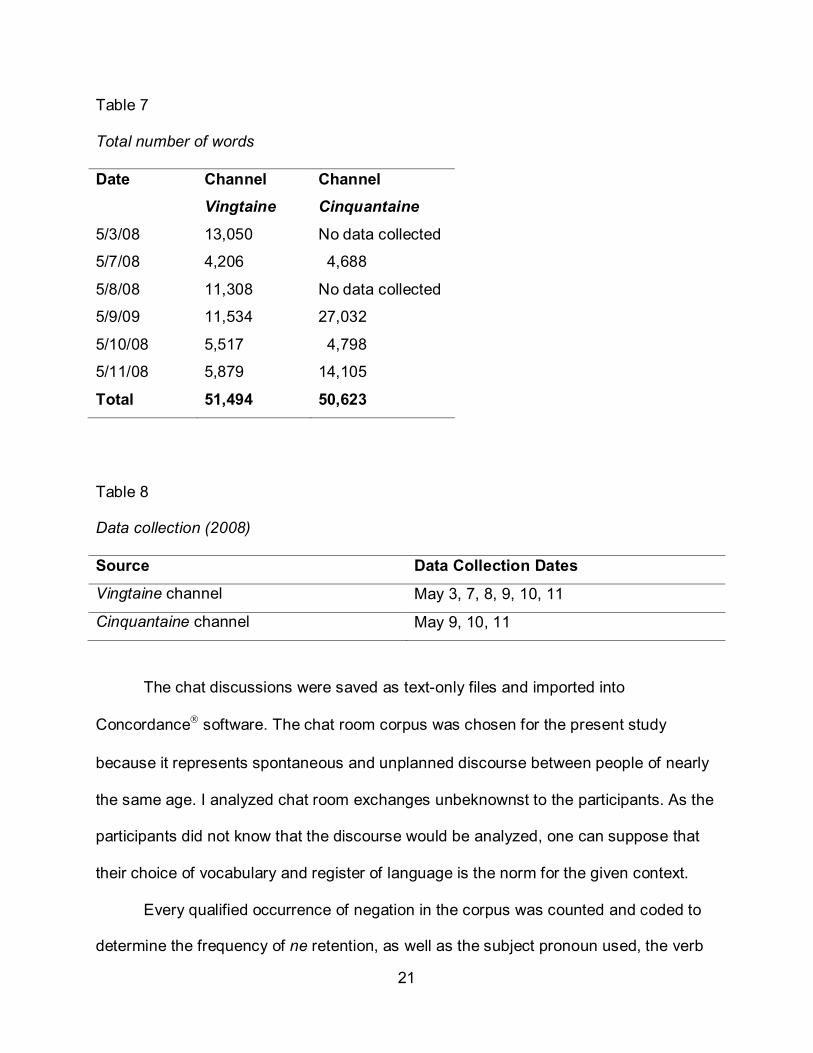
The data (51,494 words from the vingtaine 'twentysomething' channel; 50,623
words from the cinquantaine 'fiftysomething' channel) are a subset of approximately
100,000 words from a corpus of one million words collected in 2008 from the public chat
server EuropNet. Data for this study was collected from two public non-moderated
French language general discussion chat rooms over a period of several days in May
2008. The two channels were chosen approximately one generation apart, which adds
to the conclusions that may be drawn (Labov, 1972, p. 4). Anyone with Internet access
was eligible to join the discussion. Very little is known about the participants, as it is an
anonymous chat room, except that they are likely twenty-something and fifty-something
year olds. The participants were likely about 30 years apart, which provides a
generational division between the two groups, as was done with Ashby’s research
(2001). Participants created a unique username and voluntarily gave little to no
information about themselves. There were a variety of topics discussed at all different
times of day and all days of the week. Enough data were analyzed from each channel to
have statistically viable results. Fewer days of data were collected from the
cinquantaine group because each day’s data was more extensive. Each contribution
added by a participant (i.e. the turn-taking) was longer in general than those in the
vingtaine group, which meant that there were more examples in each day of ne
retention or deletion.
21
Table 7
Total number of words
Date Channel Channel Vingtaine Cinquantaine
5/3/08 13,050 No data collected
5/7/08 4,206 4,688
5/8/08 11,308 No data collected
5/9/09 11,534 27,032
5/10/08 5,517 4,798
5/11/08 5,879 14,105
Total 51,494 50,623
Table 8
Data collection (2008)
Source Data Collection Dates
Vingtaine channel May 3, 7, 8, 9, 10, 11
Cinquantaine channel May 9, 10, 11
The chat discussions were saved as text-only files and imported into
Concordance software. The chat room corpus was chosen for the present study
because it represents spontaneous and unplanned discourse between people of nearly
the same age. I analyzed chat room exchanges unbeknownst to the participants. As the
participants did not know that the discourse would be analyzed, one can suppose that
their choice of vocabulary and register of language is the norm for the given context.
Every qualified occurrence of negation in the corpus was counted and coded to
determine the frequency of ne retention, as well as the subject pronoun used, the verb
22
tense used, and the second negative particle used. Several categories of negation were
not counted as a part of this study, as they have been considered statistically
insignificant by other research and have not become standard in data collection of this
kind.
The chat corpus was studied in order to understand if participants use the ne
or pas—if they participate orthographically as if it is a written or spoken form of
communication. According to the study by Fonseca-Greber (2007), the age of
participants influenced the frequency of the usage of ne in spoken language. Older
people more often use the ne while speaking than younger. Two nonmoderated chat
rooms were chosen where the age of the participants is different. The analysis of the
quantitative method explores the context in order to understand how the ne functions in
nonmoderated chat.
It certainly would provide insightful to have a wide range of demographic
information on the participants, but this was not possible. It could be a beneficial study
in the future to have recruited participants interviewed beforehand. Demographic
information could be collected, yet participants could still be uninformed as to the exact
topic of the linguistic study so that they would not willingly (or without realizing it)
change their (socio)linguistic behavior, participation, or actions.
3.2 Coding
Each occurrence of negation was counted and coded according to the dependent
variable (absence or presence of ne) and according to four independent variables: 1)
second negative particle, 2) subject, 3) verb tense/mood, 4) vingtaine or cinquantaine
23
chat room. The variables were coded according to the following coding scheme to
prepare it for the GoldVarb X (Sankoff et al. 2005) so that VARBRUL analysis could be
done. The goal of using the GoldVarb X was to determine the influence that each
independent variable had on the dependent variable. The greater the weight of the
variable, the greater the probability that the variable had an influence on the absence or
presence of ne. The variables with a weaker weight have lower probability of having any
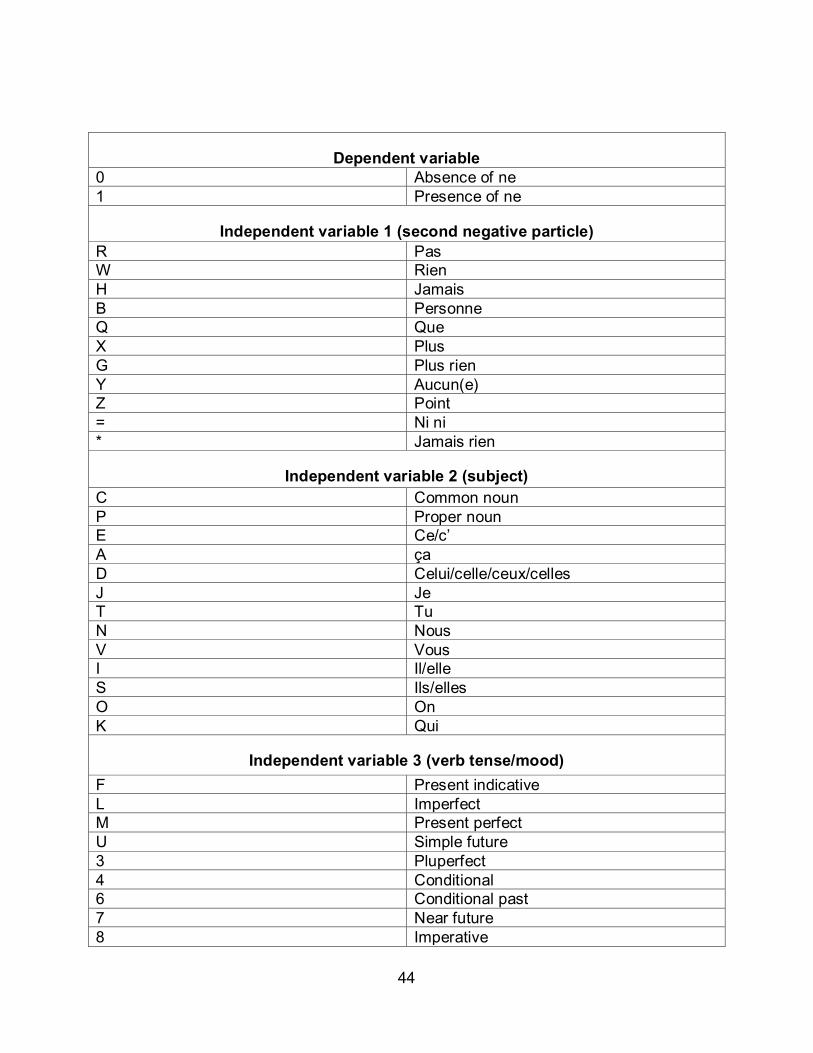
influence on ne retention. Appendix A shows the coding (including an example) used for
the dependent and independent variables.
3.3 Examples of Ne from the Corpus
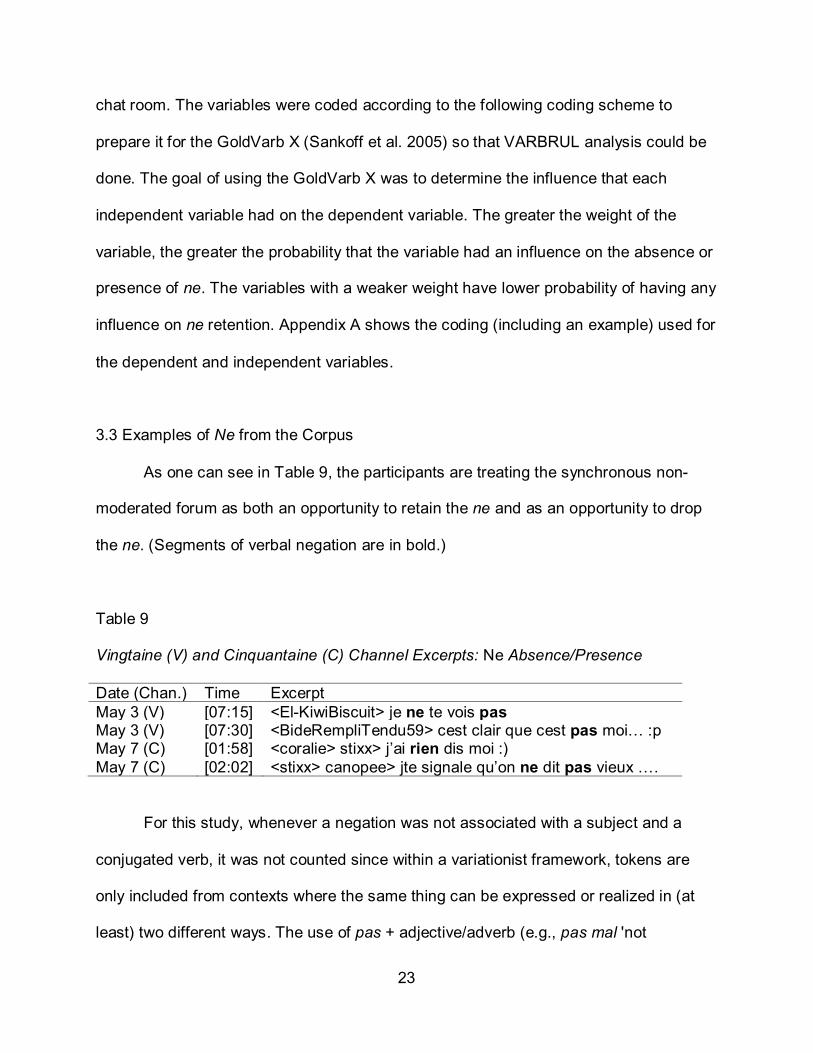
As one can see in Table 9, the participants are treating the synchronous non-
moderated forum as both an opportunity to retain the ne and as an opportunity to drop
the ne. (Segments of verbal negation are in bold.)
Table 9
Vingtaine (V) and Cinquantaine (C) Channel Excerpts: Ne Absence/Presence
Date (Chan.) Time Excerpt May 3 (V) [07:15] <El-KiwiBiscuit> je ne te vois pas May 3 (V) [07:30] <BideRempliTendu59> cest clair que cest pas moi… :p May 7 (C) [01:58] <coralie> stixx> j’ai rien dis moi :) May 7 (C) [02:02] <stixx> canopee> jte signale qu’on ne dit pas vieux ….
For this study, whenever a negation was not associated with a subject and a
conjugated verb, it was not counted since within a variationist framework, tokens are
only included from contexts where the same thing can be expressed or realized in (at
least) two different ways. The use of pas + adjective/adverb (e.g., pas mal 'not
24
bad'/'quite a few'; pas vraiment 'not really') that is not part of verbal negation, [ne . . .
pas 'not' + infinitive] and fixed expressions (e.g. n’est-ce pas? 'isn't that so?') were all
excluded, as well as any instance where the ne appeared without a second particle.
Expressions with ne and no second particle are not variable, which is the reason for
their exclusion from the coding and analysis. Other times, the ne deletion appeared to
be accidental on the part of the participant. Partial clauses without either a conjugated
verb or a subject were also excluded, as were tokens where what normally serves as
the second particle of the negative expression now serves as the subject or a
determiner/quantifier (e.g. Personne ne sait 'No one knows'; Aucune femme ne me
répond 'No woman is responding to me').
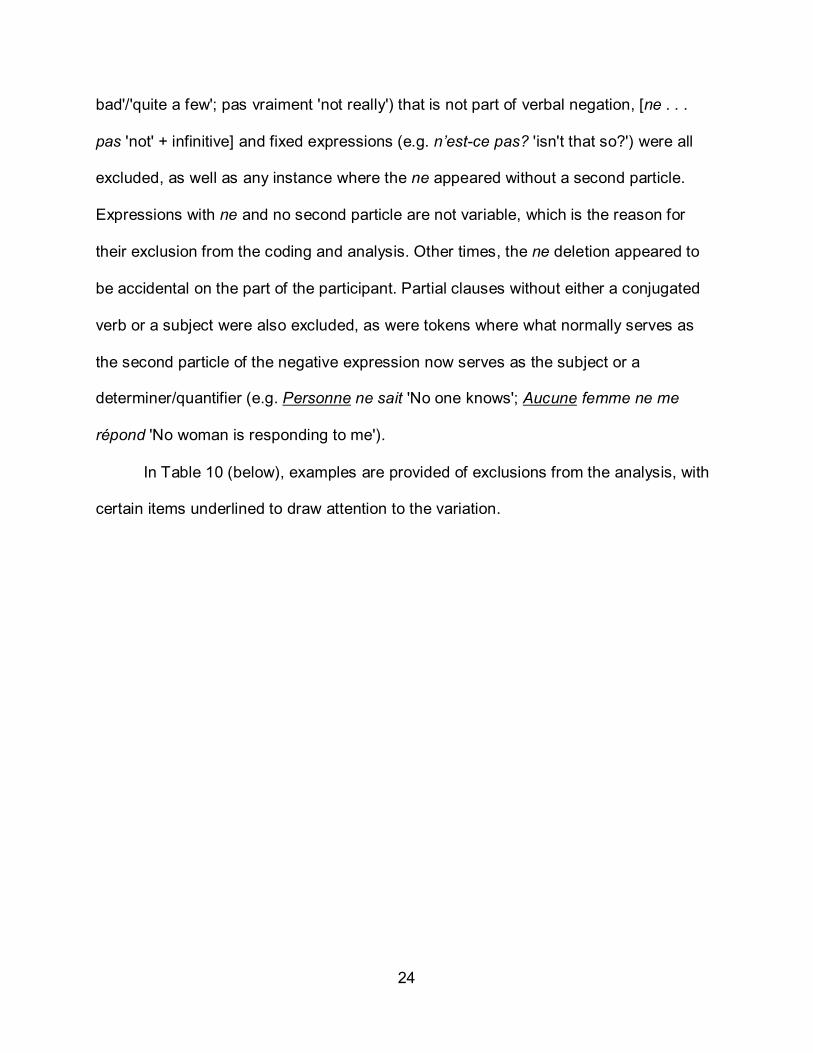
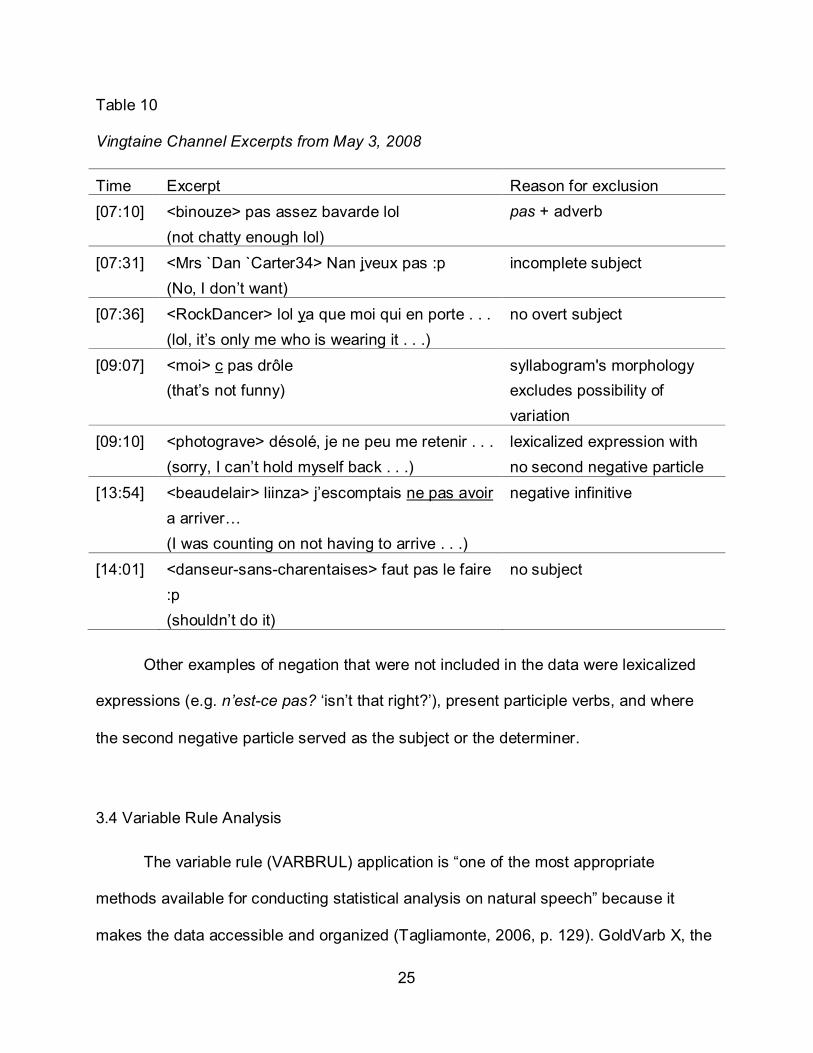
In Table 10 (below), examples are provided of exclusions from the analysis, with
certain items underlined to draw attention to the variation.
25
Table 10
Vingtaine Channel Excerpts from May 3, 2008
Time Excerpt Reason for exclusion [07:10] <binouze> pas assez bavarde lol
(not chatty enough lol) pas + adverb
[07:31] <Mrs `Dan `Carter34> Nan jveux pas :p (No, I don’t want)
incomplete subject
[07:36] <RockDancer> lol ya que moi qui en porte . . . (lol, it’s only me who is wearing it . . .)
no overt subject
[09:07] <moi> c pas drôle (that’s not funny)
syllabogram's morphology excludes possibility of variation
[09:10] <photograve> désolé, je ne peu me retenir . . . (sorry, I can’t hold myself back . . .)
lexicalized expression with no second negative particle
[13:54] <beaudelair> liinza> j’escomptais ne pas avoir a arriver… (I was counting on not having to arrive . . .)
negative infinitive
[14:01] <danseur-sans-charentaises> faut pas le faire :p (shouldn’t do it)
no subject
Other examples of negation that were not included in the data were lexicalized
expressions (e.g. n’est-ce pas? ‘isn’t that right?’), present participle verbs, and where
the second negative particle served as the subject or the determiner.
3.4 Variable Rule Analysis The variable rule (VARBRUL) application is “one of the most appropriate
methods available for conducting statistical analysis on natural speech” because it
makes the data accessible and organized (Tagliamonte, 2006, p. 129). GoldVarb X, the
26
version of software that was used for this research has been available since October
2005 (Tagliamonte, 2006, p. 158).
The variationist method of sociolinguistics is attributed to William Labov (1969),
who observed “speakers make choices when they use language, and further, that this
choice is systematic. Due to the systemacity of the process, the relative frequency of
selection can be predicted” (Tagliamonte, 2006, p. 130). The variable rule was
“designed as an accountable, empirical model for this phenomenon, thus introducing a
probabilistic component into the model of language” (Tagliomonte, 2006, p. 130). The
choice process is affected by many internal and external factors (Labov 1969, p. 759).
There are three prerequisites for variable rule analysis: 1) choice between two or
more sounds or words, 2) unpredictability and 3) recurrence (Sankoff 1988, p. 984).
Linguistic choice is a key component to VARBRUL:
Whenever a choice among two (or more) discrete alternatives can be perceived
as having been made in the course of linguistic performance, and where this
choice may have been influenced by factors such as: features in the phonological
environment, the syntactic context, discursive function of the utterance, topic,
style, interactional situation, personal or socio-demographic characteristics of the
speaker, other participants, then it is appropriate to invoke the statistical notions
and methods known to students of linguistic variation as “variable rules” (Sankoff,
1988, p. 984).
Once these three conditions are met, statistical inference can be made
(Tagliamonte, 2006, p. 131). The linguistic choice of the speaker being measured is
called the dependent variable. The linguistic or external factors, which may affect the
27
dependent variable, are called independent variables, factors, or factor groups
(Tagliamonte, 2006, p. 131). The record of which choice was actually made is called
the variant. Each instance where the variable appears is called a token. (Tagliamonte,
2006, p. 165)
3.5 Levels of Analysis in GoldVarb X
The first step in conducting variable rule is to establish that there is indeed an
effect on the linguistic choice. The null hypothesis has to be falsified (Tagliamonte,
2006, p. 132). “The null hypothesis is that none of the factors has any systematic effect
on the choice process and that any differences in the choice outcome among the
various contexts is attributed to statistical fluctuation” (Tagliamonte, 2006, p. 132).
However, “if we can prove that random processes alone are unlikely to have resulted in
the pattern of proportions observed, we may be able to attribute this pattern to the effect
of one or more of the factors” (Sankoff, 1988, pp. 987-992).
The second step in variable rule is to determine which set of factors will likely
influence the dependent variable. Here, the “likelihood criterion” is used because it
accounts for the “extreme distributional imbalances, including contrasting full versus
near-empty cells, in corpus-based data” (Tagliamonte, 2006, p. 133). The likelihood
criterion is vital to determine which factors will be a best fit to the data (Tagliamonte,
2006, p. 133). In this particular study, the factors determined to be the most likely to
have an effect on the dependent variable (ne retention) based upon a review of current
relevant research were second negative particle, subject type, verb tense/mood, and
age of the speaker. Factor groups should be independent of each other. (Tagliamonte,
28
2006, p. 181)
The third step in variable rule is to begin to analyze the data. It is important to
keep in mind that although the variable rule program is a very useful tool, it has
limitations: “VARBRUL only performs mathematical manipulations on a set of data. It
does not tell us what the numbers mean, let alone do linguistics for us (Guy, 1988, p.
133).” “. . . statistical analysis must be informed by linguistic insights.” (Tagliamonte,
2006, p. 225) In this study, GoldVarb X software was used. There are two ways to
conduct analysis of data with GoldVarb: 1) binomial one-step and 2) binomial step-
up/step-down (Tagliamonte, 2006, p. 139).
In binomial one-step analysis, the computation is done one step at a time. All
cells and all combinations are analyzed at the same time. This allows the researcher to
examine each cell to see how the combination appears and to see which cells fit the
model the best and the least (Tagliamonte, 2006, pp. 139-140). The cells that fit the
model the least can be excluded as exceptions (Tagliamonte, 2006, p. 140). A
*KnockOut* is when there is a zero percent or a 100 percent value in one of the cells of
the analysis. A variable rule analysis cannot be done in this case because there is no
variation in data and thus, these should be eliminated. (Tagliamonte, 2006, p. 152)
Another instance is with a Singleton Group, wherein there is only one token in the cell.
“Highly infrequent lexical items” either have to be removed or collapsed into another
category to successfully continue with the analysis. (Tagliamonte, 2006, p. 223)
The binomial step-up/step-down method is more often employed than the one-
step analysis because it provides the researcher three lines of evidence, each of which
are instrumental to interpreting the data: 1) statistical significance, 2) relative strength
29
(measured by the range, calculated by subtracting the lowest factor weight from the
highest) and 3) constraint ranking of factors (i.e. the hierarchy of categories within a
factor group) (Tagliamonte, 2006, pp. 140, 237, 242). VARBRUL begins with the step
up and then does the step down. The factor groups selected during stepping up are
significant, whereas the factors eliminated during stepping down are not significant.
(Tagliamonte, 2006, p. 251)
The first step in fitting the model to the data is to find the group that makes the
most significant change to the model when it is added or subtracted from the
rest. All factor groups are tested, in order to determine which one increases the
likelihood most significantly. The program retains the most significant group and
tries to add a second group, which increases the likelihood as significantly as
possible. It continues in this way until no further additions result in a statistically
significant improvement. The collection of groups incorporated in the model this
way is referred to as the step-up solution. (Tagliamonte, 2006, p. 140)
Once the step-up is completed, the step-down is done using the same principle,
but in reverse order: “The program starts by calculating the likelihood of the model when
all the factor groups are included in the regression simultaneously. Thereafter, it
discards the group whose loss least significantly reduces the likelihood (using the chi-
square test)” (Tagliamonte, 2006, p. 143). When a functional category is removed and
the log likelihood (a measurement of how accurate the analysis is) improves (moves
closer to zero), this is a factor group that has less of an effect on the dependent variable
(Tagliamonte, 2006, pp. 144, 156). When the data run returns to level #1, each factor is
tested independently and the “best run” is determined by GoldVarb. (Tagliamonte, 2006,
30
p. 146) The results for the step-up and the step-down should be the same and should
have the same “best run”. (Tagliamonte, 2006, pp. 145, 228, 235) The error measures
the accuracy with which the predicted data match the observed data (Tagliamonte,
2006, p. 156).
Interaction between factor groups may be visible during the step-up/step-down
process (Tagliamonte, 2006, p. 151). If during the process of step-up/step-down, there
is a large change, a cross-tabulation of factor groups can be conducted to verify
whether or not the two factor groups interact. “Cross tabulation is a key element of
variation analysis…you may uncover some of the most important findings.”
(Tagliamonte, 2006, p. 151) Varbrul analysis is the only way to compare different factors
and their respective influence on the dependent factor. All factor groups are cross-
tabulated with each other so that any interaction, empty cell, coding error, or anomaly
can be observed. (Tagliamonte, 2006, pp. 182, 220) The cross-tabulation process
produces a grid that will show the resulting interaction of each of the factor groups when
they are combined with another factor group (Tagliamonte, 2006, p. 207). This
information can be used to help determine the likelihood that the factor group affects ne
retention.
Factor weights should be considered in the analysis and can be valued from 0 to
1. “When a factor weight is closer to 1, it is interpreted as ‘favouring’ the application
value, whereas if it is closer to zero it is interpreted as ‘disfavouring’ the application
value…it is the relative position of factor weights, vis-à-vis each other, that is the
relevant criterion for interpreting the results” (Tagliamonte, 2006, p. 145). In other
words, the factor weights are a relative measure (compared to other factors in the same
31
factor group) of the probability of ne retention.
Degrees of freedom should also be considered in the analysis. These are “the
number of independent pieces of information available or used in an analysis of the
observed data” (Paolillo 2002, p. 109). “The more factors that are involved in a variable
rule analysis, the greater the degrees of freedom” (Tagliamonte, 2006, pp. 148-149).
Convergence is the ideal at each run of the step-up/step-down analysis;
however, this does not always occur even after multiple runs “where variation is so
infrequent, an accurate statistical model is difficult” (Tagliamonte, 2006, pp. 153-154).
32
CHAPTER 4
RESULTS AND ANALYSIS
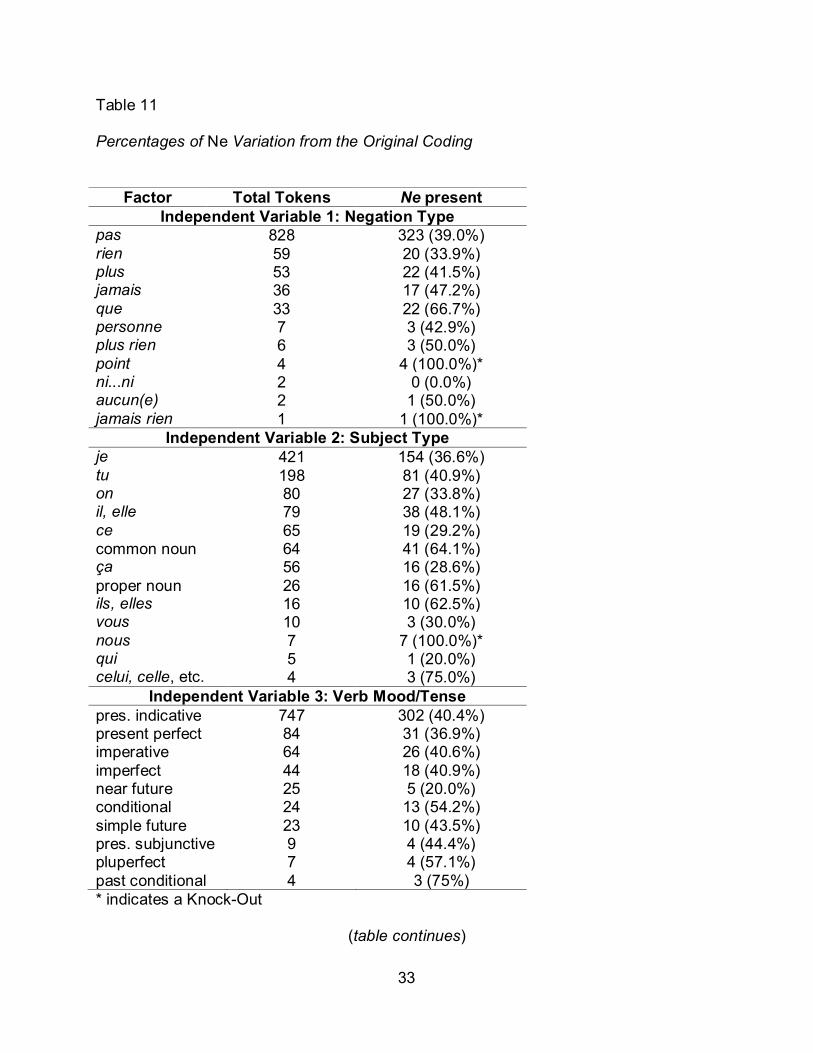
4.1 Residuals (Percentages): Distribution of Ne Absence/Presence
In all, 1,031 occurrences of verbal negation were found in the corpus, of which
1,015 were retained for the statistical analysis (after knockouts and singletons were
removed). This includes 405 occurrences with two-particle negation (39.9%) and 610
occurrences with single-particle negation (60.1%). There were 566 total tokens in the
vingtaine chat channel with 173 instances (30.6%) of second particle negation. There
were 449 total tokens collected in the cinquantaine chat room. Of these, there were 232
occurrences (51.7%) of ne retention. Table 11 shows the frequency of negative tokens
according to each independent variable in descending order. Pas has by far more
negative tokens (828) than all the other second negative particles combined. The same
is true in the verb tense/mood category—the present indicative has by far more
negative tokens (747) than all other verb moods/tenses combined. This is consistent
with previously conducted research (Hansen & Malderez, 2004, pp. 22-24) of
spontaneous discourse. The number of tokens of pas and the number of tokens of the
present indicative so exceeds the number of tokens for any other variant in their
respective categories that it is difficult to make a statistical comparison.
33
Table 11
Percentages of Ne Variation from the Original Coding
Factor Total Tokens Ne present Independent Variable 1: Negation Type
pas 828 323 (39.0%) rien 59 20 (33.9%) plus 53 22 (41.5%) jamais 36 17 (47.2%) que 33 22 (66.7%) personne 7 3 (42.9%) plus rien 6 3 (50.0%) point 4 4 (100.0%)* ni...ni 2 0 (0.0%) aucun(e) 2 1 (50.0%) jamais rien 1 1 (100.0%)*
Independent Variable 2: Subject Type je 421 154 (36.6%) tu 198 81 (40.9%) on 80 27 (33.8%) il, elle 79 38 (48.1%) ce 65 19 (29.2%) common noun 64 41 (64.1%) ça 56 16 (28.6%) proper noun 26 16 (61.5%) ils, elles 16 10 (62.5%) vous 10 3 (30.0%) nous 7 7 (100.0%)* qui 5 1 (20.0%) celui, celle, etc. 4 3 (75.0%)
Independent Variable 3: Verb Mood/Tense pres. indicative 747 302 (40.4%) present perfect 84 31 (36.9%) imperative 64 26 (40.6%) imperfect 44 18 (40.9%) near future 25 5 (20.0%) conditional 24 13 (54.2%) simple future 23 10 (43.5%) pres. subjunctive 9 4 (44.4%) pluperfect 7 4 (57.1%) past conditional 4 3 (75%) * indicates a Knock-Out
(table continues)
34
Table 11 (continued).
Independent Variable 4: Age Group vingtaine 573 178 (31.1%) cinquantaine 458 238 (52.0%) TOTAL 1,031 416 (40.3%)
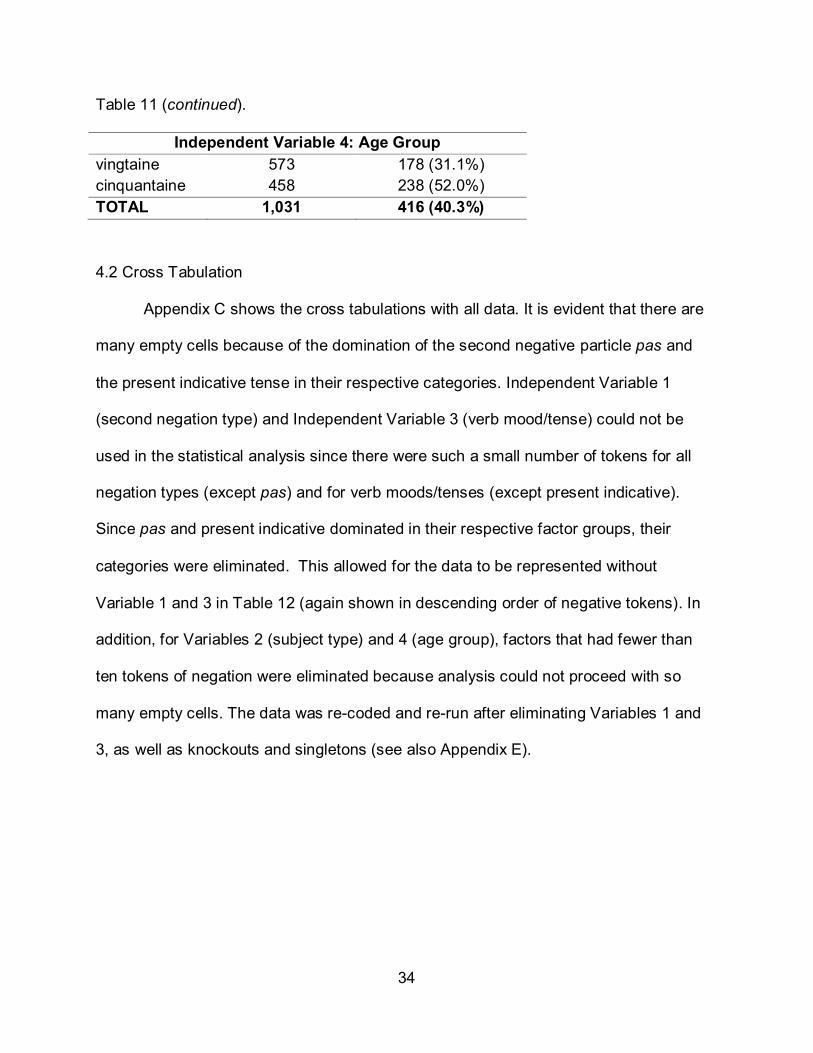
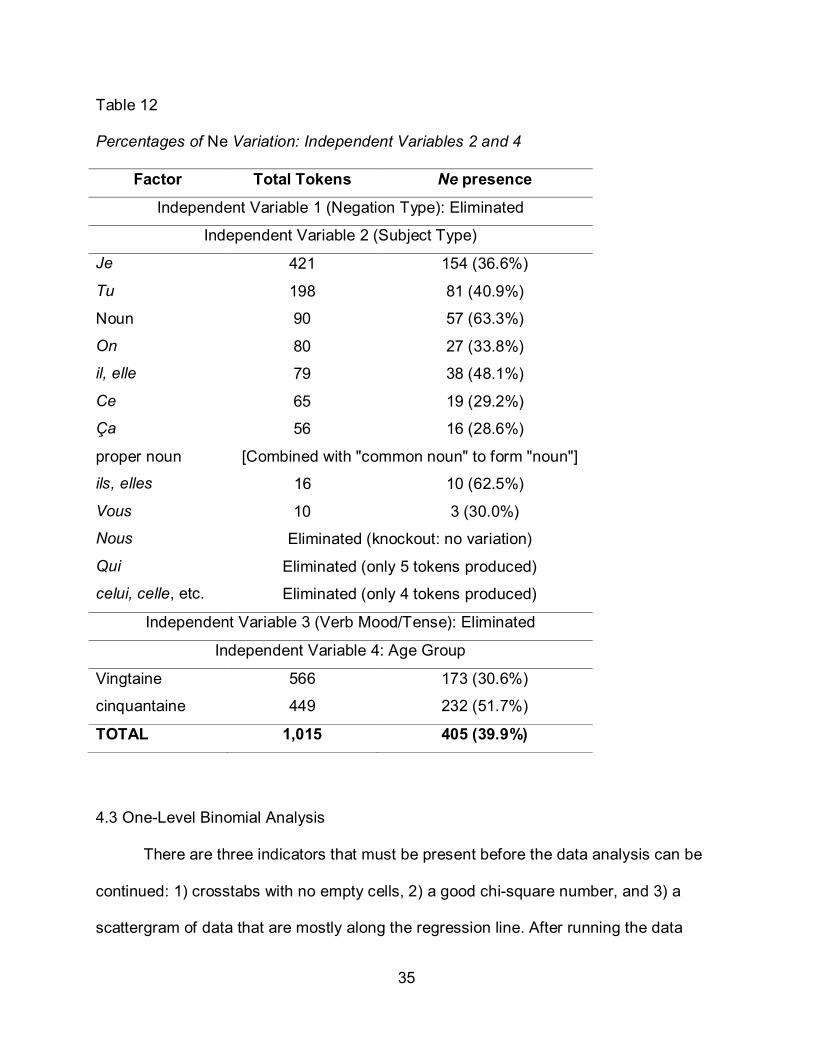
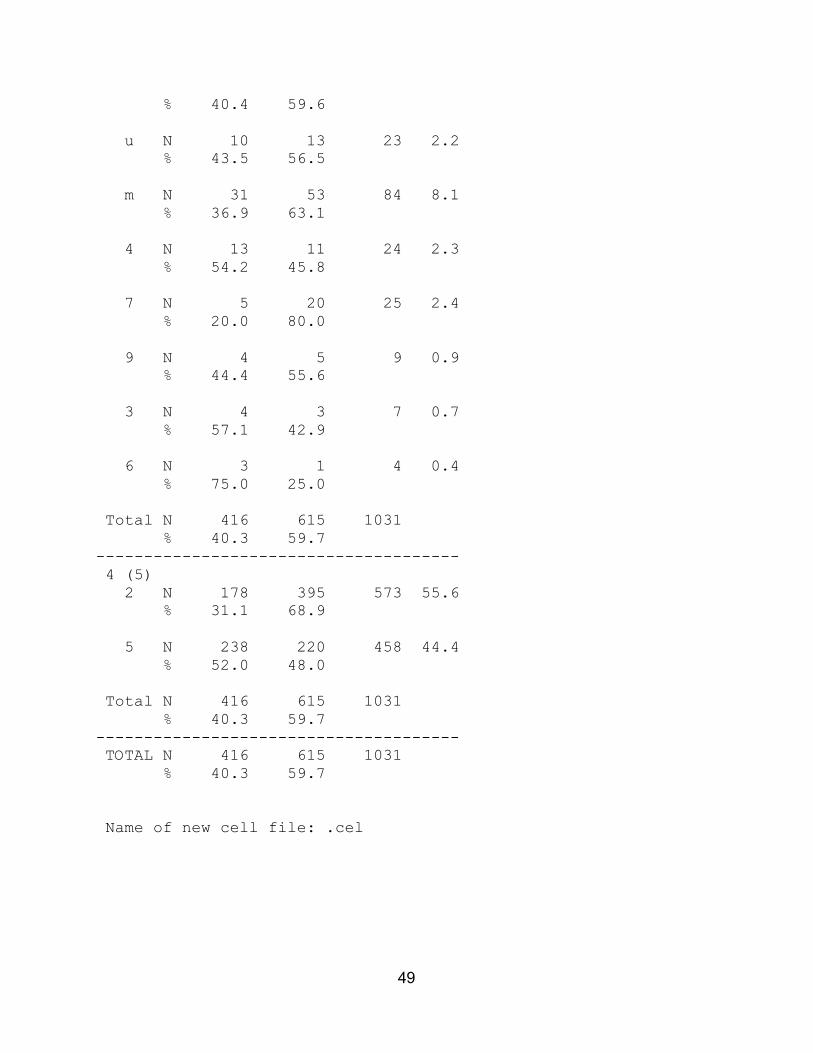
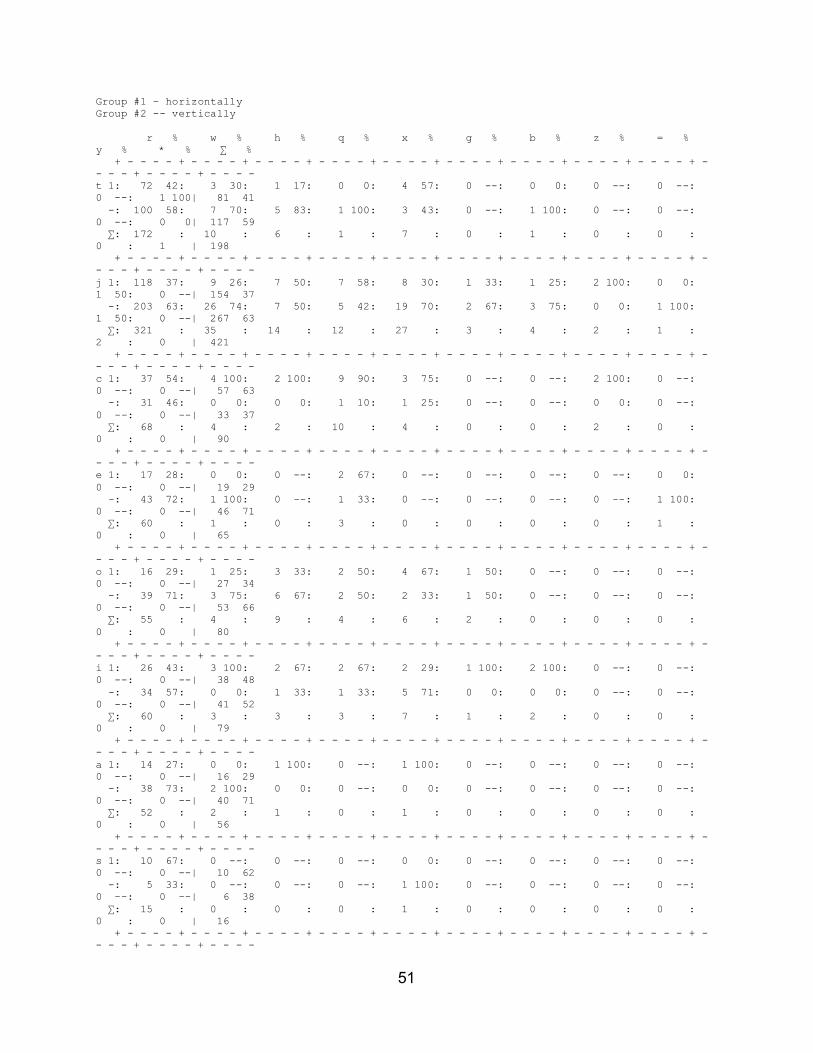
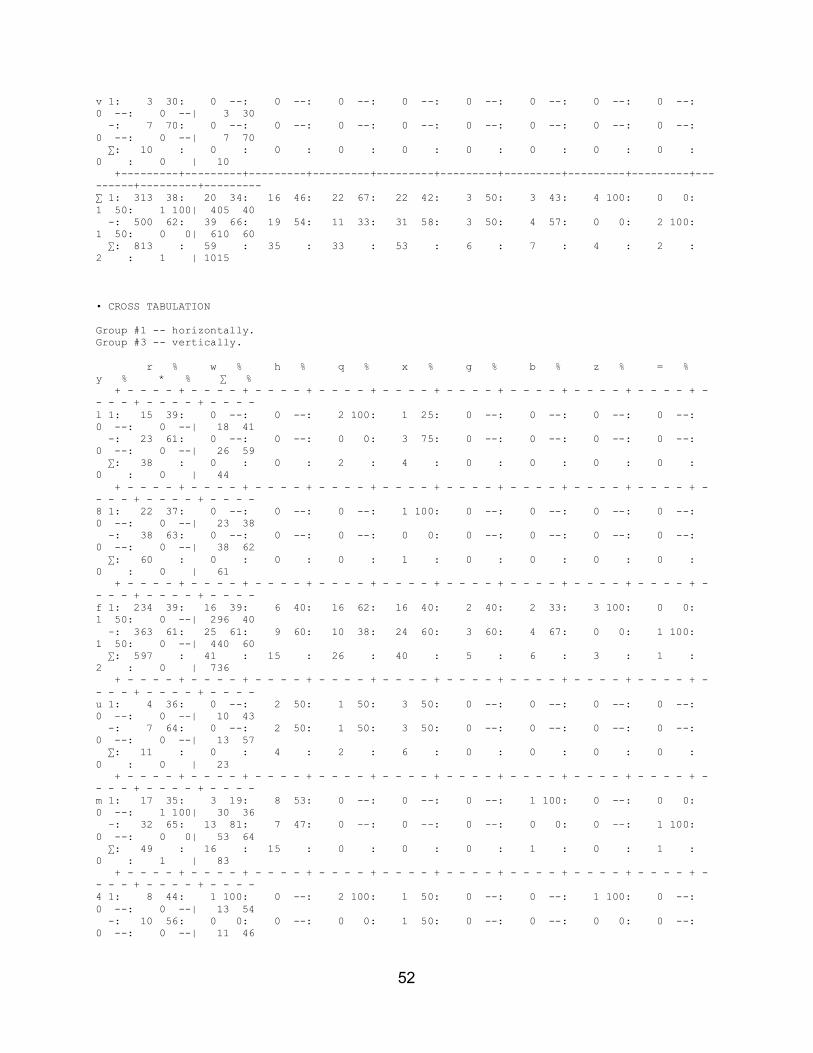
4.2 Cross Tabulation
Appendix C shows the cross tabulations with all data. It is evident that there are
many empty cells because of the domination of the second negative particle pas and
the present indicative tense in their respective categories. Independent Variable 1
(second negation type) and Independent Variable 3 (verb mood/tense) could not be
used in the statistical analysis since there were such a small number of tokens for all
negation types (except pas) and for verb moods/tenses (except present indicative).
Since pas and present indicative dominated in their respective factor groups, their
categories were eliminated. This allowed for the data to be represented without
Variable 1 and 3 in Table 12 (again shown in descending order of negative tokens). In
addition, for Variables 2 (subject type) and 4 (age group), factors that had fewer than
ten tokens of negation were eliminated because analysis could not proceed with so
many empty cells. The data was re-coded and re-run after eliminating Variables 1 and
3, as well as knockouts and singletons (see also Appendix E).
35
Table 12 Percentages of Ne Variation: Independent Variables 2 and 4
Factor Total Tokens Ne presence
Independent Variable 1 (Negation Type): Eliminated
Independent Variable 2 (Subject Type)
Je 421 154 (36.6%)
Tu 198 81 (40.9%)
Noun 90 57 (63.3%)
On 80 27 (33.8%)
il, elle 79 38 (48.1%)
Ce 65 19 (29.2%)
Ça 56 16 (28.6%)
proper noun [Combined with "common noun" to form "noun"]
ils, elles 16 10 (62.5%)
Vous 10 3 (30.0%)
Nous Eliminated (knockout: no variation)
Qui Eliminated (only 5 tokens produced)
celui, celle, etc. Eliminated (only 4 tokens produced)
Independent Variable 3 (Verb Mood/Tense): Eliminated
Independent Variable 4: Age Group
Vingtaine 566 173 (30.6%)
cinquantaine 449 232 (51.7%)
TOTAL 1,015 405 (39.9%)
4.3 One-Level Binomial Analysis
There are three indicators that must be present before the data analysis can be
continued: 1) crosstabs with no empty cells, 2) a good chi-square number, and 3) a
scattergram of data that are mostly along the regression line. After running the data
36
without the first variable (second negative particle type) and third variable (verb
mood/tense), I looked at the crosstabs and saw that there were no empty cells (see
Appendix F).
With no empty cells in the crosstabs, the chi-square number was then checked
(16.0173; see Appendix E). For the current study, this should ideally be below 16.919
(see Preston, 1996, for criteria; see also Paolillo, 2001). The lower the chi-square
number (based on data patterns and significance value), the better the scattergram
results (i.e., the closer the data appear to the regression line).
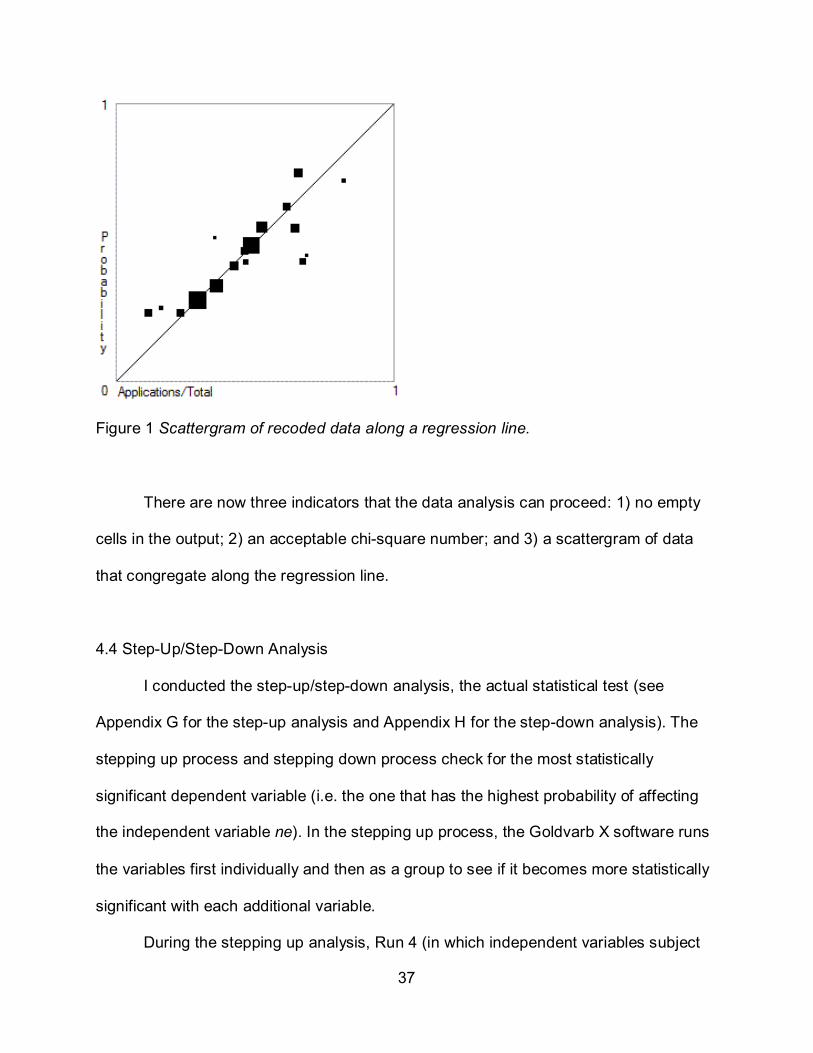
Since the chi-square value was acceptable, the scattergram was then checked.
Figure 1 is a scattergram of the data along a regression line. This provides a visual
representation of the data (Tagliamonte, 2006, p. 224). Ideally, everything groups
around the regression line, as it does here. "The size of the point is proportional to the
number of tokens in the corresponding cell(s)" (Rand & Sankoff, 1990, p. 24). This is the
third indication that it is acceptable to continue to the step-up/step-down analysis.
37
Figure 1 Scattergram of recoded data along a regression line.
There are now three indicators that the data analysis can proceed: 1) no empty
cells in the output; 2) an acceptable chi-square number; and 3) a scattergram of data
that congregate along the regression line.
4.4 Step-Up/Step-Down Analysis
I conducted the step-up/step-down analysis, the actual statistical test (see
Appendix G for the step-up analysis and Appendix H for the step-down analysis). The
stepping up process and stepping down process check for the most statistically
significant dependent variable (i.e. the one that has the highest probability of affecting
the independent variable ne). In the stepping up process, the Goldvarb X software runs
the variables first individually and then as a group to see if it becomes more statistically
significant with each additional variable.
During the stepping up analysis, Run 4 (in which independent variables subject
38
type and age were combined) was found to be the most statistically significant. During
the stepping down analysis, the most statistically significant run was 5 (which is the
same run—the last in step-up and the first in step-down, since step-down is done in the
reverse order). In addition, there were no groups eliminated while stepping down. In
other words, neither of the variables (subject type and age) was found to be statistically
insignificant, therefore indicating that both variables are statistically significant. The
prevalence of ne retention was more statistically significant when these variables were
run together than when they were run separately. The log likelihood is the closest to
zero in Run 4/5 (-643.277) compared with the other data runs.
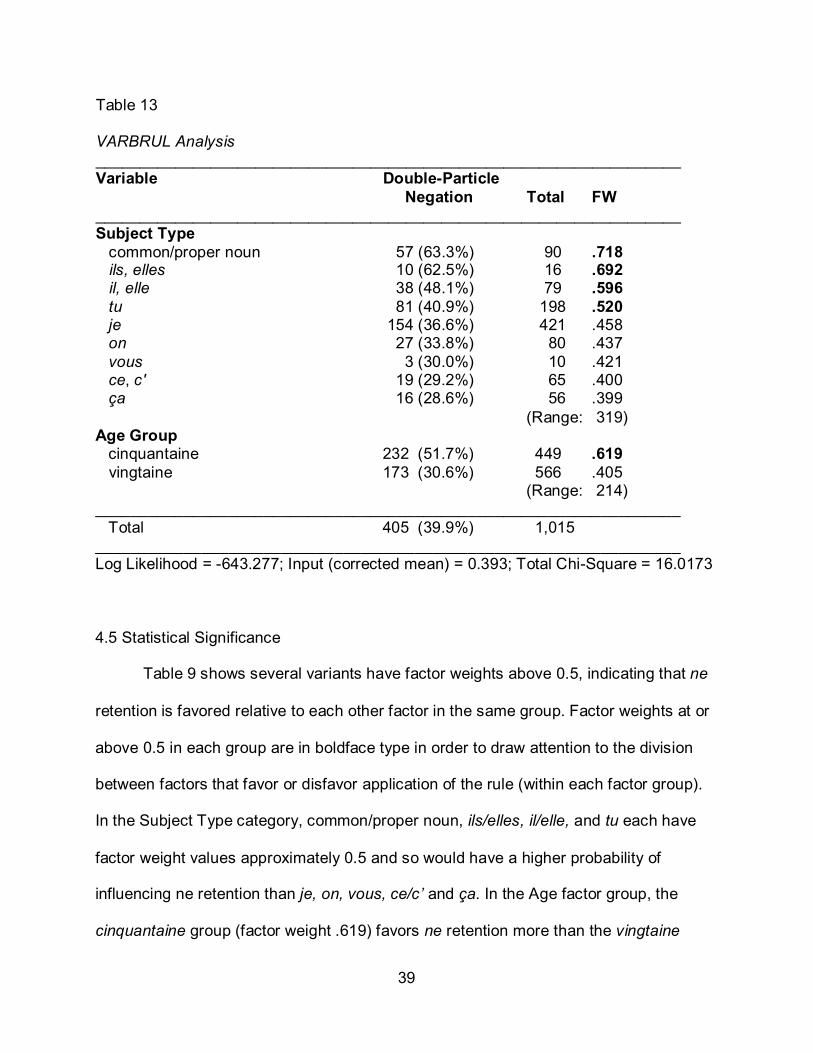
Table 13 shows the VARBRUL analysis of subject type and age group. The
differences between factor weights within each group are statistically significant. A
higher number indicates a higher probability of influencing ne retention relative to other
factors in the same group.
39
Table 13 VARBRUL Analysis __________________________________________________________________ Variable Double-Particle Negation Total FW __________________________________________________________________ Subject Type common/proper noun 57 (63.3%) 90 .718 ils, elles 10 (62.5%) 16 .692 il, elle 38 (48.1%) 79 .596 tu 81 (40.9%) 198 .520 je 154 (36.6%) 421 .458 on 27 (33.8%) 80 .437 vous 3 (30.0%) 10 .421 ce, c' 19 (29.2%) 65 .400 ça 16 (28.6%) 56 .399 (Range: 319) Age Group cinquantaine 232 (51.7%) 449 .619 vingtaine 173 (30.6%) 566 .405 (Range: 214) __________________________________________________________________ Total 405 (39.9%) 1,015 __________________________________________________________________ Log Likelihood = -643.277; Input (corrected mean) = 0.393; Total Chi-Square = 16.0173
4.5 Statistical Significance
Table 9 shows several variants have factor weights above 0.5, indicating that ne
retention is favored relative to each other factor in the same group. Factor weights at or
above 0.5 in each group are in boldface type in order to draw attention to the division
between factors that favor or disfavor application of the rule (within each factor group).
In the Subject Type category, common/proper noun, ils/elles, il/elle, and tu each have
factor weight values approximately 0.5 and so would have a higher probability of
influencing ne retention than je, on, vous, ce/c’ and ça. In the Age factor group, the
cinquantaine group (factor weight .619) favors ne retention more than the vingtaine
40
group (factor weight .405). Goldvarb X shows subject type to be more statistically
significant than age group because it has a greater range (319 versus 214).
To find the degrees of freedom, simply subtract the number of groups (2) from
the number of factors (11). There are 9 degrees of freedom. That is relatively low since
there are only two factor groups.
While age is influential, its likelihood to affect ne retention is lower than subject
type. This significant influence on negation is consistent with van Compernolle’s
analysis of synchronous non-moderated chat in 2007 and the study by Williams in 2009.
4.6 Ranges
In order to find the range of a statistically significant factor group in the binomial
analysis, subtract the lowest factor weight from the highest. The group of data with the
highest range more greatly influences the variation. In Appendix G, in Run 4 (the most
statistically significant group where subject type and age were combined), the range can
be found by looking at both Group 1 (subject type) and Group 2 (age). Then a
comparison can be made between the two ranges to determine which has a higher
probability of favoring ne retention. As you can see in Table 9, in Group 1, subtract the
lowest factor weight (399) from the highest factor weight (718) for a range of 319. In
Group 2, subtract the lowest factor weight (405) from the highest factor weight (619) for
a range of 214. Group 1’s range (319) is greater than Group 2’s range (214). This
means that subject type has a relatively higher probability of favoring ne retention than
age. One explanation for this would be that high frequency subjects (e.g. je or I) tend to
be used more casually and so the ne is dropped more frequently.
41
CHAPTER 5
CONCLUSION
The results of the analysis have shown that age group was a significant factor
in the variable use of ne, but subject type had an even greater influence on ne absence
or presence. The ne in verbal negation is more often retained by the cinquantaine group
than by the vingtaine group, as might be expected based on previous research. A
common or proper noun was the most likely variable in this study to affect ne retention.
The results of this study conform to what could have been expected for this
context. The results show us that non-moderated chat conforms to the informality of
spoken French in terms of ne retention. There is also a clear difference in ne retention
between the two age groups. This was a context of casual written conversation, where
negative second particles were regularly typed incorrectly and the ne was regularly
dropped. This corresponds to the non-moderated chat room findings done previously by
van Compernolle (2007). As is typical with other research, the ne was dropped more
commonly with pas than it was with other negative expressions.
For further research, it would be interesting to continue the work of investigation
of ne retention in synchronous non-moderated chat rooms and consider the influence of
inversion, object pronouns, and seriousness of topic. Other sources for analysis may
include blogs, curriculum vitaes, job application cover letters, general business
correspondence (online and traditional) and complaint correspondence (online and
traditional). Some data (particularly those related to professional networking) may
provide significant demographic data for further analysis.
Another possibility would be to conduct the same research in a controlled

42
environment where participants are interviewed beforehand, but not given information
about the specifics of the study. Then other sociological factors could be considered.
43
APPENDIX A
DATA CODING
44
Dependent variable 0 Absence of ne 1 Presence of ne
Independent variable 1 (second negative particle) R Pas W Rien H Jamais B Personne Q Que X Plus G Plus rien Y Aucun(e) Z Point = Ni ni * Jamais rien
Independent variable 2 (subject) C Common noun P Proper noun E Ce/c’ A ça D Celui/celle/ceux/celles J Je T Tu N Nous V Vous I Il/elle S Ils/elles O On K Qui
Independent variable 3 (verb tense/mood) F Present indicative L Imperfect M Present perfect U Simple future 3 Pluperfect 4 Conditional 6 Conditional past 7 Near future 8 Imperative
45
9 Subjunctive present
Independent variable 4 (age group) 2 Vingtaine chat channel 5 Cinquantaine chat channel For example, a sentence like Je n’aime pas (I don’t like) from the fifty something chat
room would be coded the following:
1RJF5 1 = ne present R = pas was the second negative particle J = je was the subject pronoun F = verb aime is in the present indicative 5 = data is from the fifty something chat room
46
APPENDIX B
BINOMAIL ONE-STEP ANALYSIS WITH ALL DATA
47
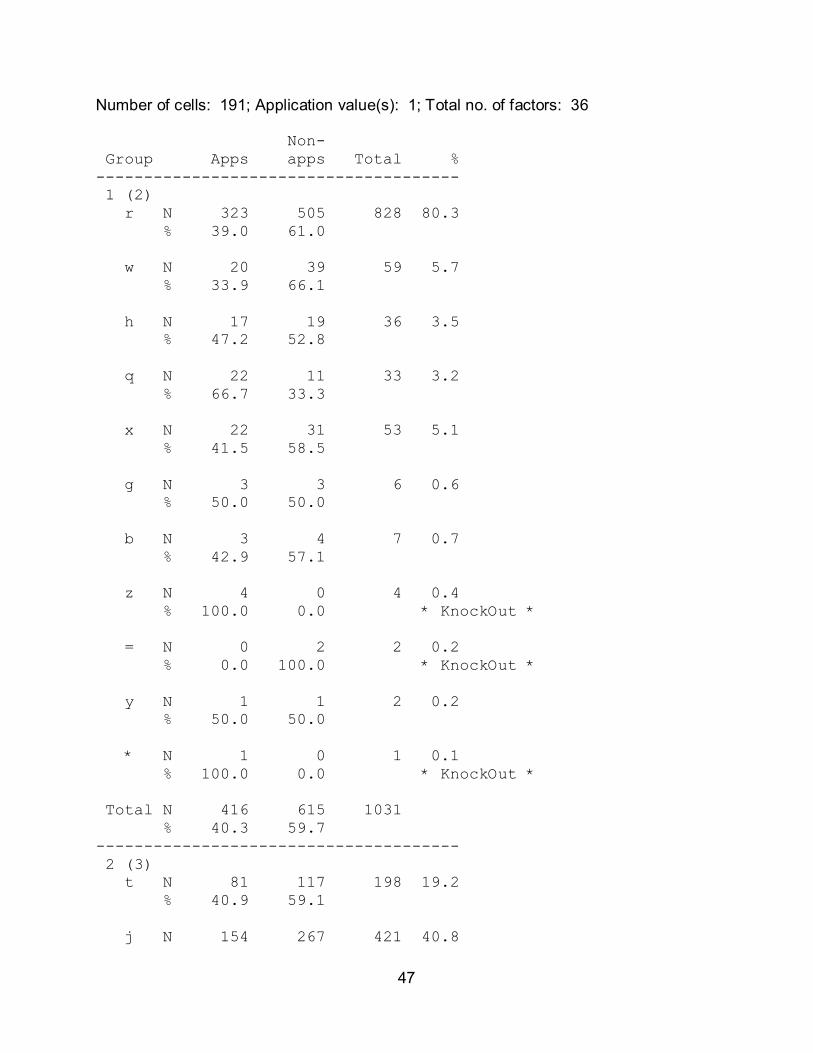
Number of cells: 191; Application value(s): 1; Total no. of factors: 36 Non- Group Apps apps Total % -------------------------------------- 1 (2) r N 323 505 828 80.3 % 39.0 61.0 w N 20 39 59 5.7 % 33.9 66.1 h N 17 19 36 3.5 % 47.2 52.8 q N 22 11 33 3.2 % 66.7 33.3 x N 22 31 53 5.1 % 41.5 58.5 g N 3 3 6 0.6 % 50.0 50.0 b N 3 4 7 0.7 % 42.9 57.1 z N 4 0 4 0.4 % 100.0 0.0 * KnockOut * = N 0 2 2 0.2 % 0.0 100.0 * KnockOut * y N 1 1 2 0.2 % 50.0 50.0 * N 1 0 1 0.1 % 100.0 0.0 * KnockOut * Total N 416 615 1031 % 40.3 59.7 -------------------------------------- 2 (3) t N 81 117 198 19.2 % 40.9 59.1 j N 154 267 421 40.8
48
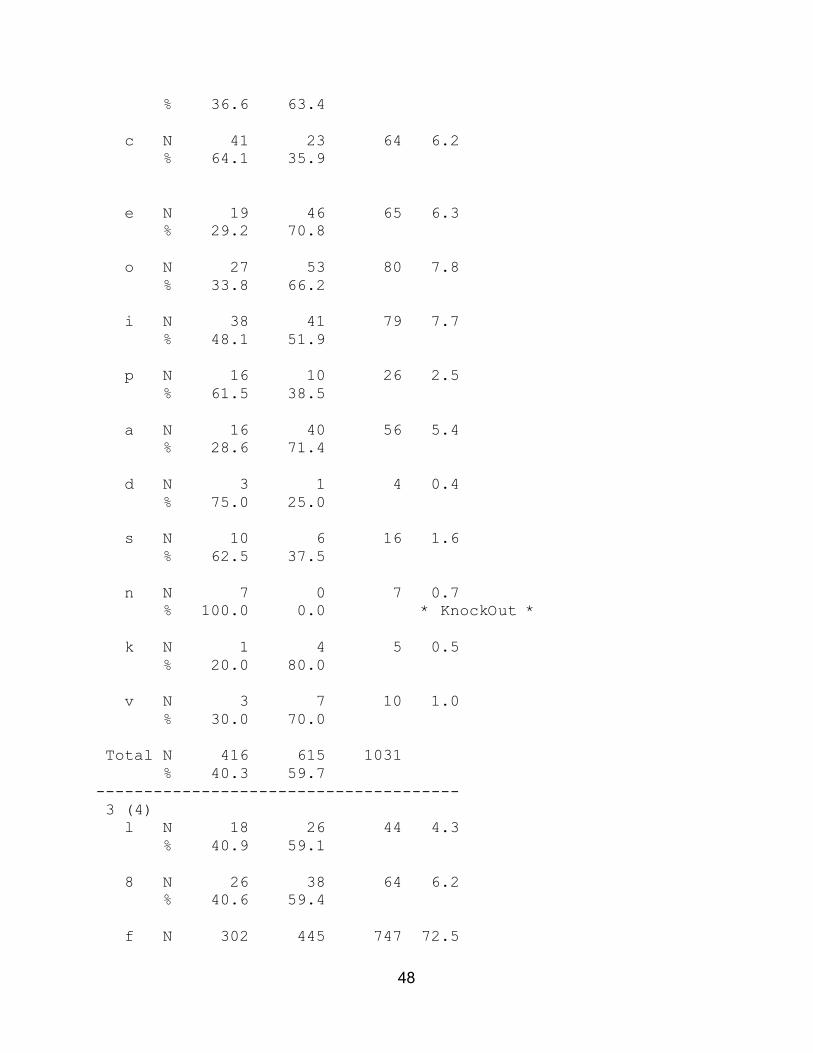
% 36.6 63.4 c N 41 23 64 6.2 % 64.1 35.9 e N 19 46 65 6.3 % 29.2 70.8 o N 27 53 80 7.8 % 33.8 66.2 i N 38 41 79 7.7 % 48.1 51.9 p N 16 10 26 2.5 % 61.5 38.5 a N 16 40 56 5.4 % 28.6 71.4 d N 3 1 4 0.4 % 75.0 25.0 s N 10 6 16 1.6 % 62.5 37.5 n N 7 0 7 0.7 % 100.0 0.0 * KnockOut * k N 1 4 5 0.5 % 20.0 80.0 v N 3 7 10 1.0 % 30.0 70.0 Total N 416 615 1031 % 40.3 59.7 -------------------------------------- 3 (4) l N 18 26 44 4.3 % 40.9 59.1 8 N 26 38 64 6.2 % 40.6 59.4 f N 302 445 747 72.5
49
% 40.4 59.6 u N 10 13 23 2.2 % 43.5 56.5 m N 31 53 84 8.1 % 36.9 63.1 4 N 13 11 24 2.3 % 54.2 45.8 7 N 5 20 25 2.4 % 20.0 80.0 9 N 4 5 9 0.9 % 44.4 55.6 3 N 4 3 7 0.7 % 57.1 42.9 6 N 3 1 4 0.4 % 75.0 25.0 Total N 416 615 1031 % 40.3 59.7 -------------------------------------- 4 (5) 2 N 178 395 573 55.6 % 31.1 68.9 5 N 238 220 458 44.4 % 52.0 48.0 Total N 416 615 1031 % 40.3 59.7 -------------------------------------- TOTAL N 416 615 1031 % 40.3 59.7 Name of new cell file: .cel
50
APPENDIX C
CROSS TABULATIONS
51
Group #1 – horizontally Group #2 -- vertically r % w % h % q % x % g % b % z % = % y % * % ∑ % + - - - - + - - - - + - - - - + - - - - + - - - - + - - - - + - - - - + - - - - + - - - - + - - - - + - - - - + - - - - t 1: 72 42: 3 30: 1 17: 0 0: 4 57: 0 --: 0 0: 0 --: 0 --: 0 --: 1 100| 81 41 -: 100 58: 7 70: 5 83: 1 100: 3 43: 0 --: 1 100: 0 --: 0 --: 0 --: 0 0| 117 59 ∑: 172 : 10 : 6 : 1 : 7 : 0 : 1 : 0 : 0 : 0 : 1 | 198 + - - - - + - - - - + - - - - + - - - - + - - - - + - - - - + - - - - + - - - - + - - - - + - - - - + - - - - + - - - - j 1: 118 37: 9 26: 7 50: 7 58: 8 30: 1 33: 1 25: 2 100: 0 0: 1 50: 0 --| 154 37 -: 203 63: 26 74: 7 50: 5 42: 19 70: 2 67: 3 75: 0 0: 1 100: 1 50: 0 --| 267 63 ∑: 321 : 35 : 14 : 12 : 27 : 3 : 4 : 2 : 1 : 2 : 0 | 421 + - - - - + - - - - + - - - - + - - - - + - - - - + - - - - + - - - - + - - - - + - - - - + - - - - + - - - - + - - - - c 1: 37 54: 4 100: 2 100: 9 90: 3 75: 0 --: 0 --: 2 100: 0 --: 0 --: 0 --| 57 63 -: 31 46: 0 0: 0 0: 1 10: 1 25: 0 --: 0 --: 0 0: 0 --: 0 --: 0 --| 33 37 ∑: 68 : 4 : 2 : 10 : 4 : 0 : 0 : 2 : 0 : 0 : 0 | 90 + - - - - + - - - - + - - - - + - - - - + - - - - + - - - - + - - - - + - - - - + - - - - + - - - - + - - - - + - - - - e 1: 17 28: 0 0: 0 --: 2 67: 0 --: 0 --: 0 --: 0 --: 0 0: 0 --: 0 --| 19 29 -: 43 72: 1 100: 0 --: 1 33: 0 --: 0 --: 0 --: 0 --: 1 100: 0 --: 0 --| 46 71 ∑: 60 : 1 : 0 : 3 : 0 : 0 : 0 : 0 : 1 : 0 : 0 | 65 + - - - - + - - - - + - - - - + - - - - + - - - - + - - - - + - - - - + - - - - + - - - - + - - - - + - - - - + - - - - o 1: 16 29: 1 25: 3 33: 2 50: 4 67: 1 50: 0 --: 0 --: 0 --: 0 --: 0 --| 27 34 -: 39 71: 3 75: 6 67: 2 50: 2 33: 1 50: 0 --: 0 --: 0 --: 0 --: 0 --| 53 66 ∑: 55 : 4 : 9 : 4 : 6 : 2 : 0 : 0 : 0 : 0 : 0 | 80 + - - - - + - - - - + - - - - + - - - - + - - - - + - - - - + - - - - + - - - - + - - - - + - - - - + - - - - + - - - - i 1: 26 43: 3 100: 2 67: 2 67: 2 29: 1 100: 2 100: 0 --: 0 --: 0 --: 0 --| 38 48 -: 34 57: 0 0: 1 33: 1 33: 5 71: 0 0: 0 0: 0 --: 0 --: 0 --: 0 --| 41 52 ∑: 60 : 3 : 3 : 3 : 7 : 1 : 2 : 0 : 0 : 0 : 0 | 79 + - - - - + - - - - + - - - - + - - - - + - - - - + - - - - + - - - - + - - - - + - - - - + - - - - + - - - - + - - - - a 1: 14 27: 0 0: 1 100: 0 --: 1 100: 0 --: 0 --: 0 --: 0 --: 0 --: 0 --| 16 29 -: 38 73: 2 100: 0 0: 0 --: 0 0: 0 --: 0 --: 0 --: 0 --: 0 --: 0 --| 40 71 ∑: 52 : 2 : 1 : 0 : 1 : 0 : 0 : 0 : 0 : 0 : 0 | 56 + - - - - + - - - - + - - - - + - - - - + - - - - + - - - - + - - - - + - - - - + - - - - + - - - - + - - - - + - - - - s 1: 10 67: 0 --: 0 --: 0 --: 0 0: 0 --: 0 --: 0 --: 0 --: 0 --: 0 --| 10 62 -: 5 33: 0 --: 0 --: 0 --: 1 100: 0 --: 0 --: 0 --: 0 --: 0 --: 0 --| 6 38 ∑: 15 : 0 : 0 : 0 : 1 : 0 : 0 : 0 : 0 : 0 : 0 | 16 + - - - - + - - - - + - - - - + - - - - + - - - - + - - - - + - - - - + - - - - + - - - - + - - - - + - - - - + - - - -
52
v 1: 3 30: 0 --: 0 --: 0 --: 0 --: 0 --: 0 --: 0 --: 0 --: 0 --: 0 --| 3 30 -: 7 70: 0 --: 0 --: 0 --: 0 --: 0 --: 0 --: 0 --: 0 --: 0 --: 0 --| 7 70 ∑: 10 : 0 : 0 : 0 : 0 : 0 : 0 : 0 : 0 : 0 : 0 | 10 +---------+---------+---------+---------+---------+---------+---------+---------+---------+---------+---------+--------- ∑ 1: 313 38: 20 34: 16 46: 22 67: 22 42: 3 50: 3 43: 4 100: 0 0: 1 50: 1 100| 405 40 -: 500 62: 39 66: 19 54: 11 33: 31 58: 3 50: 4 57: 0 0: 2 100: 1 50: 0 0| 610 60 ∑: 813 : 59 : 35 : 33 : 53 : 6 : 7 : 4 : 2 : 2 : 1 | 1015 • CROSS TABULATION Group #1 -- horizontally. Group #3 -- vertically. r % w % h % q % x % g % b % z % = % y % * % ∑ % + - - - - + - - - - + - - - - + - - - - + - - - - + - - - - + - - - - + - - - - + - - - - + - - - - + - - - - + - - - - l 1: 15 39: 0 --: 0 --: 2 100: 1 25: 0 --: 0 --: 0 --: 0 --: 0 --: 0 --| 18 41 -: 23 61: 0 --: 0 --: 0 0: 3 75: 0 --: 0 --: 0 --: 0 --: 0 --: 0 --| 26 59 ∑: 38 : 0 : 0 : 2 : 4 : 0 : 0 : 0 : 0 : 0 : 0 | 44 + - - - - + - - - - + - - - - + - - - - + - - - - + - - - - + - - - - + - - - - + - - - - + - - - - + - - - - + - - - - 8 1: 22 37: 0 --: 0 --: 0 --: 1 100: 0 --: 0 --: 0 --: 0 --: 0 --: 0 --| 23 38 -: 38 63: 0 --: 0 --: 0 --: 0 0: 0 --: 0 --: 0 --: 0 --: 0 --: 0 --| 38 62 ∑: 60 : 0 : 0 : 0 : 1 : 0 : 0 : 0 : 0 : 0 : 0 | 61 + - - - - + - - - - + - - - - + - - - - + - - - - + - - - - + - - - - + - - - - + - - - - + - - - - + - - - - + - - - - f 1: 234 39: 16 39: 6 40: 16 62: 16 40: 2 40: 2 33: 3 100: 0 0: 1 50: 0 --| 296 40 -: 363 61: 25 61: 9 60: 10 38: 24 60: 3 60: 4 67: 0 0: 1 100: 1 50: 0 --| 440 60 ∑: 597 : 41 : 15 : 26 : 40 : 5 : 6 : 3 : 1 : 2 : 0 | 736 + - - - - + - - - - + - - - - + - - - - + - - - - + - - - - + - - - - + - - - - + - - - - + - - - - + - - - - + - - - - u 1: 4 36: 0 --: 2 50: 1 50: 3 50: 0 --: 0 --: 0 --: 0 --: 0 --: 0 --| 10 43 -: 7 64: 0 --: 2 50: 1 50: 3 50: 0 --: 0 --: 0 --: 0 --: 0 --: 0 --| 13 57 ∑: 11 : 0 : 4 : 2 : 6 : 0 : 0 : 0 : 0 : 0 : 0 | 23 + - - - - + - - - - + - - - - + - - - - + - - - - + - - - - + - - - - + - - - - + - - - - + - - - - + - - - - + - - - - m 1: 17 35: 3 19: 8 53: 0 --: 0 --: 0 --: 1 100: 0 --: 0 0: 0 --: 1 100| 30 36 -: 32 65: 13 81: 7 47: 0 --: 0 --: 0 --: 0 0: 0 --: 1 100: 0 --: 0 0| 53 64 ∑: 49 : 16 : 15 : 0 : 0 : 0 : 1 : 0 : 1 : 0 : 1 | 83 + - - - - + - - - - + - - - - + - - - - + - - - - + - - - - + - - - - + - - - - + - - - - + - - - - + - - - - + - - - - 4 1: 8 44: 1 100: 0 --: 2 100: 1 50: 0 --: 0 --: 1 100: 0 --: 0 --: 0 --| 13 54 -: 10 56: 0 0: 0 --: 0 0: 1 50: 0 --: 0 --: 0 0: 0 --: 0 --: 0 --| 11 46
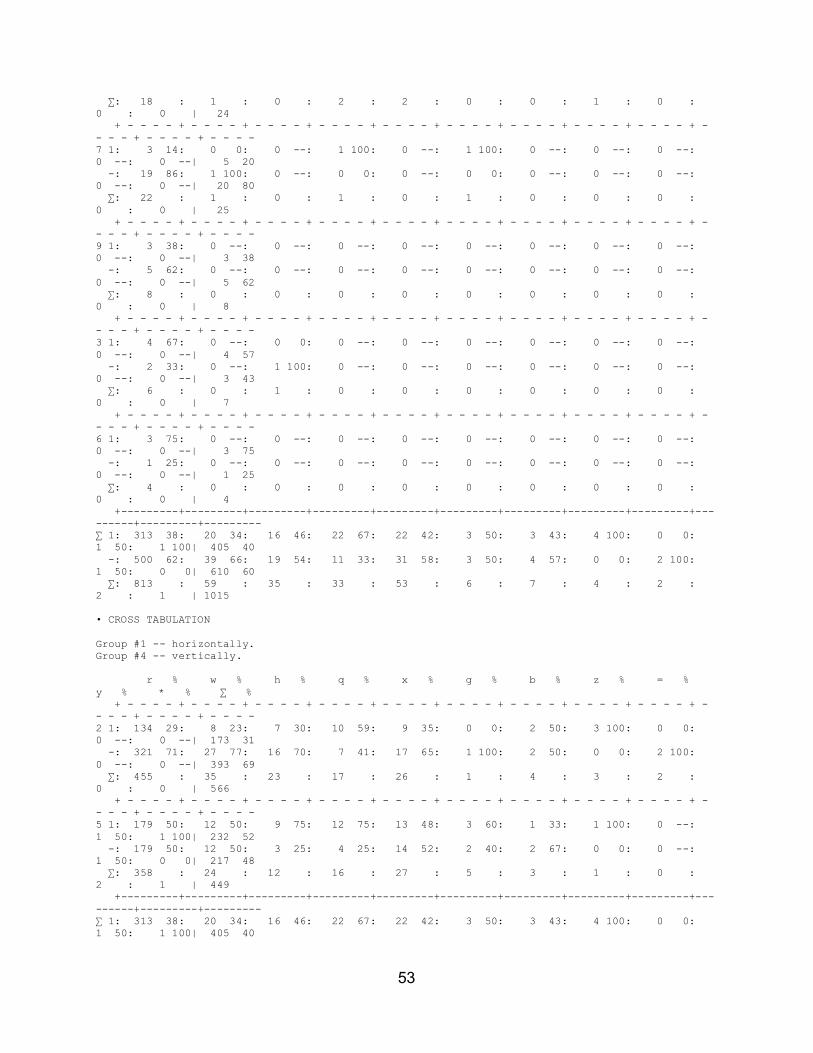
53
∑: 18 : 1 : 0 : 2 : 2 : 0 : 0 : 1 : 0 : 0 : 0 | 24 + - - - - + - - - - + - - - - + - - - - + - - - - + - - - - + - - - - + - - - - + - - - - + - - - - + - - - - + - - - - 7 1: 3 14: 0 0: 0 --: 1 100: 0 --: 1 100: 0 --: 0 --: 0 --: 0 --: 0 --| 5 20 -: 19 86: 1 100: 0 --: 0 0: 0 --: 0 0: 0 --: 0 --: 0 --: 0 --: 0 --| 20 80 ∑: 22 : 1 : 0 : 1 : 0 : 1 : 0 : 0 : 0 : 0 : 0 | 25 + - - - - + - - - - + - - - - + - - - - + - - - - + - - - - + - - - - + - - - - + - - - - + - - - - + - - - - + - - - - 9 1: 3 38: 0 --: 0 --: 0 --: 0 --: 0 --: 0 --: 0 --: 0 --: 0 --: 0 --| 3 38 -: 5 62: 0 --: 0 --: 0 --: 0 --: 0 --: 0 --: 0 --: 0 --: 0 --: 0 --| 5 62 ∑: 8 : 0 : 0 : 0 : 0 : 0 : 0 : 0 : 0 : 0 : 0 | 8 + - - - - + - - - - + - - - - + - - - - + - - - - + - - - - + - - - - + - - - - + - - - - + - - - - + - - - - + - - - - 3 1: 4 67: 0 --: 0 0: 0 --: 0 --: 0 --: 0 --: 0 --: 0 --: 0 --: 0 --| 4 57 -: 2 33: 0 --: 1 100: 0 --: 0 --: 0 --: 0 --: 0 --: 0 --: 0 --: 0 --| 3 43 ∑: 6 : 0 : 1 : 0 : 0 : 0 : 0 : 0 : 0 : 0 : 0 | 7 + - - - - + - - - - + - - - - + - - - - + - - - - + - - - - + - - - - + - - - - + - - - - + - - - - + - - - - + - - - - 6 1: 3 75: 0 --: 0 --: 0 --: 0 --: 0 --: 0 --: 0 --: 0 --: 0 --: 0 --| 3 75 -: 1 25: 0 --: 0 --: 0 --: 0 --: 0 --: 0 --: 0 --: 0 --: 0 --: 0 --| 1 25 ∑: 4 : 0 : 0 : 0 : 0 : 0 : 0 : 0 : 0 : 0 : 0 | 4 +---------+---------+---------+---------+---------+---------+---------+---------+---------+---------+---------+--------- ∑ 1: 313 38: 20 34: 16 46: 22 67: 22 42: 3 50: 3 43: 4 100: 0 0: 1 50: 1 100| 405 40 -: 500 62: 39 66: 19 54: 11 33: 31 58: 3 50: 4 57: 0 0: 2 100: 1 50: 0 0| 610 60 ∑: 813 : 59 : 35 : 33 : 53 : 6 : 7 : 4 : 2 : 2 : 1 | 1015 • CROSS TABULATION Group #1 -- horizontally. Group #4 -- vertically. r % w % h % q % x % g % b % z % = % y % * % ∑ % + - - - - + - - - - + - - - - + - - - - + - - - - + - - - - + - - - - + - - - - + - - - - + - - - - + - - - - + - - - - 2 1: 134 29: 8 23: 7 30: 10 59: 9 35: 0 0: 2 50: 3 100: 0 0: 0 --: 0 --| 173 31 -: 321 71: 27 77: 16 70: 7 41: 17 65: 1 100: 2 50: 0 0: 2 100: 0 --: 0 --| 393 69 ∑: 455 : 35 : 23 : 17 : 26 : 1 : 4 : 3 : 2 : 0 : 0 | 566 + - - - - + - - - - + - - - - + - - - - + - - - - + - - - - + - - - - + - - - - + - - - - + - - - - + - - - - + - - - - 5 1: 179 50: 12 50: 9 75: 12 75: 13 48: 3 60: 1 33: 1 100: 0 --: 1 50: 1 100| 232 52 -: 179 50: 12 50: 3 25: 4 25: 14 52: 2 40: 2 67: 0 0: 0 --: 1 50: 0 0| 217 48 ∑: 358 : 24 : 12 : 16 : 27 : 5 : 3 : 1 : 0 : 2 : 1 | 449 +---------+---------+---------+---------+---------+---------+---------+---------+---------+---------+---------+--------- ∑ 1: 313 38: 20 34: 16 46: 22 67: 22 42: 3 50: 3 43: 4 100: 0 0: 1 50: 1 100| 405 40
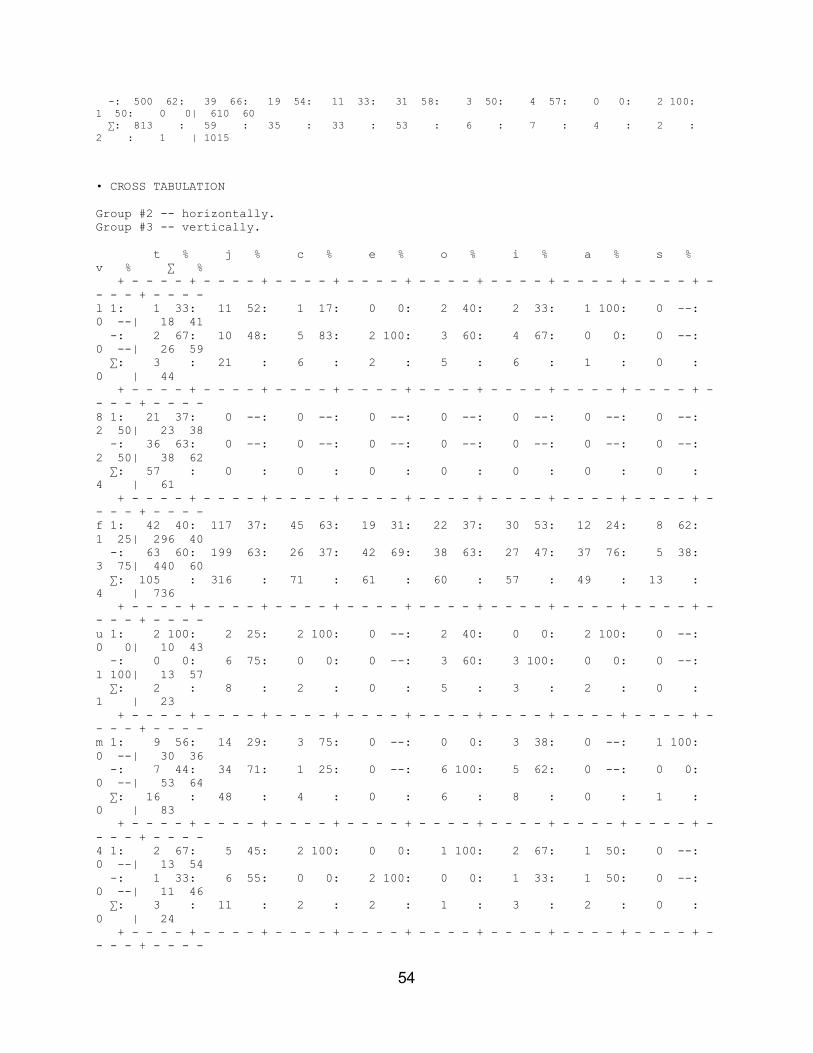
54
-: 500 62: 39 66: 19 54: 11 33: 31 58: 3 50: 4 57: 0 0: 2 100: 1 50: 0 0| 610 60 ∑: 813 : 59 : 35 : 33 : 53 : 6 : 7 : 4 : 2 : 2 : 1 | 1015 • CROSS TABULATION Group #2 -- horizontally. Group #3 -- vertically. t % j % c % e % o % i % a % s % v % ∑ % + - - - - + - - - - + - - - - + - - - - + - - - - + - - - - + - - - - + - - - - + - - - - + - - - - l 1: 1 33: 11 52: 1 17: 0 0: 2 40: 2 33: 1 100: 0 --: 0 --| 18 41 -: 2 67: 10 48: 5 83: 2 100: 3 60: 4 67: 0 0: 0 --: 0 --| 26 59 ∑: 3 : 21 : 6 : 2 : 5 : 6 : 1 : 0 : 0 | 44 + - - - - + - - - - + - - - - + - - - - + - - - - + - - - - + - - - - + - - - - + - - - - + - - - - 8 1: 21 37: 0 --: 0 --: 0 --: 0 --: 0 --: 0 --: 0 --: 2 50| 23 38 -: 36 63: 0 --: 0 --: 0 --: 0 --: 0 --: 0 --: 0 --: 2 50| 38 62 ∑: 57 : 0 : 0 : 0 : 0 : 0 : 0 : 0 : 4 | 61 + - - - - + - - - - + - - - - + - - - - + - - - - + - - - - + - - - - + - - - - + - - - - + - - - - f 1: 42 40: 117 37: 45 63: 19 31: 22 37: 30 53: 12 24: 8 62: 1 25| 296 40 -: 63 60: 199 63: 26 37: 42 69: 38 63: 27 47: 37 76: 5 38: 3 75| 440 60 ∑: 105 : 316 : 71 : 61 : 60 : 57 : 49 : 13 : 4 | 736 + - - - - + - - - - + - - - - + - - - - + - - - - + - - - - + - - - - + - - - - + - - - - + - - - - u 1: 2 100: 2 25: 2 100: 0 --: 2 40: 0 0: 2 100: 0 --: 0 0| 10 43 -: 0 0: 6 75: 0 0: 0 --: 3 60: 3 100: 0 0: 0 --: 1 100| 13 57 ∑: 2 : 8 : 2 : 0 : 5 : 3 : 2 : 0 : 1 | 23 + - - - - + - - - - + - - - - + - - - - + - - - - + - - - - + - - - - + - - - - + - - - - + - - - - m 1: 9 56: 14 29: 3 75: 0 --: 0 0: 3 38: 0 --: 1 100: 0 --| 30 36 -: 7 44: 34 71: 1 25: 0 --: 6 100: 5 62: 0 --: 0 0: 0 --| 53 64 ∑: 16 : 48 : 4 : 0 : 6 : 8 : 0 : 1 : 0 | 83 + - - - - + - - - - + - - - - + - - - - + - - - - + - - - - + - - - - + - - - - + - - - - + - - - - 4 1: 2 67: 5 45: 2 100: 0 0: 1 100: 2 67: 1 50: 0 --: 0 --| 13 54 -: 1 33: 6 55: 0 0: 2 100: 0 0: 1 33: 1 50: 0 --: 0 --| 11 46 ∑: 3 : 11 : 2 : 2 : 1 : 3 : 2 : 0 : 0 | 24 + - - - - + - - - - + - - - - + - - - - + - - - - + - - - - + - - - - + - - - - + - - - - + - - - -
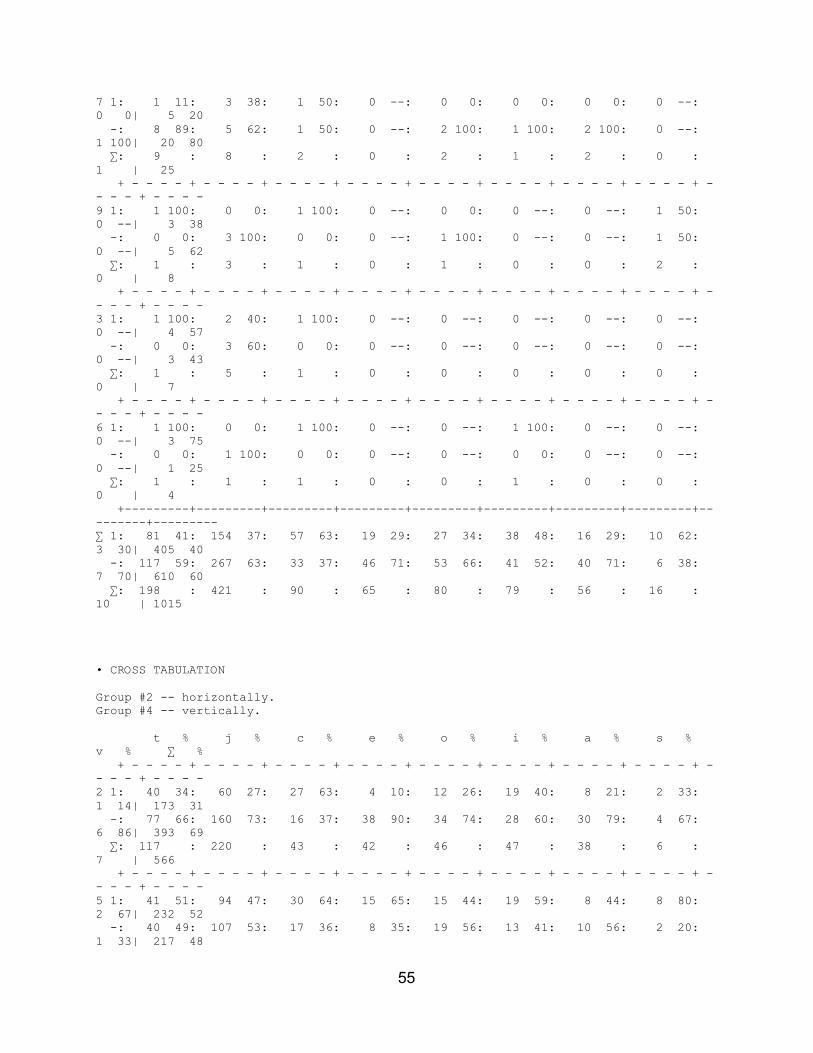
55
7 1: 1 11: 3 38: 1 50: 0 --: 0 0: 0 0: 0 0: 0 --: 0 0| 5 20 -: 8 89: 5 62: 1 50: 0 --: 2 100: 1 100: 2 100: 0 --: 1 100| 20 80 ∑: 9 : 8 : 2 : 0 : 2 : 1 : 2 : 0 : 1 | 25 + - - - - + - - - - + - - - - + - - - - + - - - - + - - - - + - - - - + - - - - + - - - - + - - - - 9 1: 1 100: 0 0: 1 100: 0 --: 0 0: 0 --: 0 --: 1 50: 0 --| 3 38 -: 0 0: 3 100: 0 0: 0 --: 1 100: 0 --: 0 --: 1 50: 0 --| 5 62 ∑: 1 : 3 : 1 : 0 : 1 : 0 : 0 : 2 : 0 | 8 + - - - - + - - - - + - - - - + - - - - + - - - - + - - - - + - - - - + - - - - + - - - - + - - - - 3 1: 1 100: 2 40: 1 100: 0 --: 0 --: 0 --: 0 --: 0 --: 0 --| 4 57 -: 0 0: 3 60: 0 0: 0 --: 0 --: 0 --: 0 --: 0 --: 0 --| 3 43 ∑: 1 : 5 : 1 : 0 : 0 : 0 : 0 : 0 : 0 | 7 + - - - - + - - - - + - - - - + - - - - + - - - - + - - - - + - - - - + - - - - + - - - - + - - - - 6 1: 1 100: 0 0: 1 100: 0 --: 0 --: 1 100: 0 --: 0 --: 0 --| 3 75 -: 0 0: 1 100: 0 0: 0 --: 0 --: 0 0: 0 --: 0 --: 0 --| 1 25 ∑: 1 : 1 : 1 : 0 : 0 : 1 : 0 : 0 : 0 | 4 +---------+---------+---------+---------+---------+---------+---------+---------+---------+--------- ∑ 1: 81 41: 154 37: 57 63: 19 29: 27 34: 38 48: 16 29: 10 62: 3 30| 405 40 -: 117 59: 267 63: 33 37: 46 71: 53 66: 41 52: 40 71: 6 38: 7 70| 610 60 ∑: 198 : 421 : 90 : 65 : 80 : 79 : 56 : 16 : 10 | 1015 • CROSS TABULATION Group #2 -- horizontally. Group #4 -- vertically. t % j % c % e % o % i % a % s % v % ∑ % + - - - - + - - - - + - - - - + - - - - + - - - - + - - - - + - - - - + - - - - + - - - - + - - - - 2 1: 40 34: 60 27: 27 63: 4 10: 12 26: 19 40: 8 21: 2 33: 1 14| 173 31 -: 77 66: 160 73: 16 37: 38 90: 34 74: 28 60: 30 79: 4 67: 6 86| 393 69 ∑: 117 : 220 : 43 : 42 : 46 : 47 : 38 : 6 : 7 | 566 + - - - - + - - - - + - - - - + - - - - + - - - - + - - - - + - - - - + - - - - + - - - - + - - - - 5 1: 41 51: 94 47: 30 64: 15 65: 15 44: 19 59: 8 44: 8 80: 2 67| 232 52 -: 40 49: 107 53: 17 36: 8 35: 19 56: 13 41: 10 56: 2 20: 1 33| 217 48
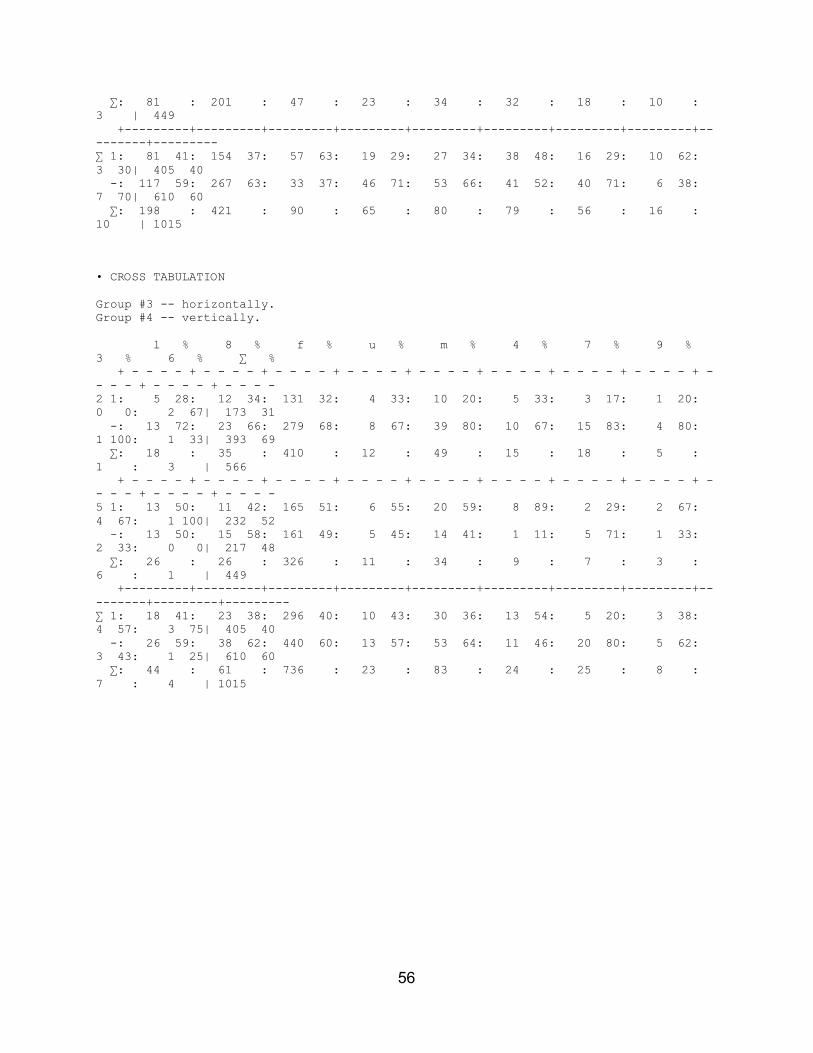
56
∑: 81 : 201 : 47 : 23 : 34 : 32 : 18 : 10 : 3 | 449 +---------+---------+---------+---------+---------+---------+---------+---------+---------+--------- ∑ 1: 81 41: 154 37: 57 63: 19 29: 27 34: 38 48: 16 29: 10 62: 3 30| 405 40 -: 117 59: 267 63: 33 37: 46 71: 53 66: 41 52: 40 71: 6 38: 7 70| 610 60 ∑: 198 : 421 : 90 : 65 : 80 : 79 : 56 : 16 : 10 | 1015 • CROSS TABULATION Group #3 -- horizontally. Group #4 -- vertically. l % 8 % f % u % m % 4 % 7 % 9 % 3 % 6 % ∑ % + - - - - + - - - - + - - - - + - - - - + - - - - + - - - - + - - - - + - - - - + - - - - + - - - - + - - - - 2 1: 5 28: 12 34: 131 32: 4 33: 10 20: 5 33: 3 17: 1 20: 0 0: 2 67| 173 31 -: 13 72: 23 66: 279 68: 8 67: 39 80: 10 67: 15 83: 4 80: 1 100: 1 33| 393 69 ∑: 18 : 35 : 410 : 12 : 49 : 15 : 18 : 5 : 1 : 3 | 566 + - - - - + - - - - + - - - - + - - - - + - - - - + - - - - + - - - - + - - - - + - - - - + - - - - + - - - - 5 1: 13 50: 11 42: 165 51: 6 55: 20 59: 8 89: 2 29: 2 67: 4 67: 1 100| 232 52 -: 13 50: 15 58: 161 49: 5 45: 14 41: 1 11: 5 71: 1 33: 2 33: 0 0| 217 48 ∑: 26 : 26 : 326 : 11 : 34 : 9 : 7 : 3 : 6 : 1 | 449 +---------+---------+---------+---------+---------+---------+---------+---------+---------+---------+--------- ∑ 1: 18 41: 23 38: 296 40: 10 43: 30 36: 13 54: 5 20: 3 38: 4 57: 3 75| 405 40 -: 26 59: 38 62: 440 60: 13 57: 53 64: 11 46: 20 80: 5 62: 3 43: 1 25| 610 60 ∑: 44 : 61 : 736 : 23 : 83 : 24 : 25 : 8 : 7 : 4 | 1015
57
APPENDIX D
CONDITION FILE EXCLUDING KNOCKOUTS AND SINGLETONS FROM BINOMIAL
ONE -STEP ANALYSIS
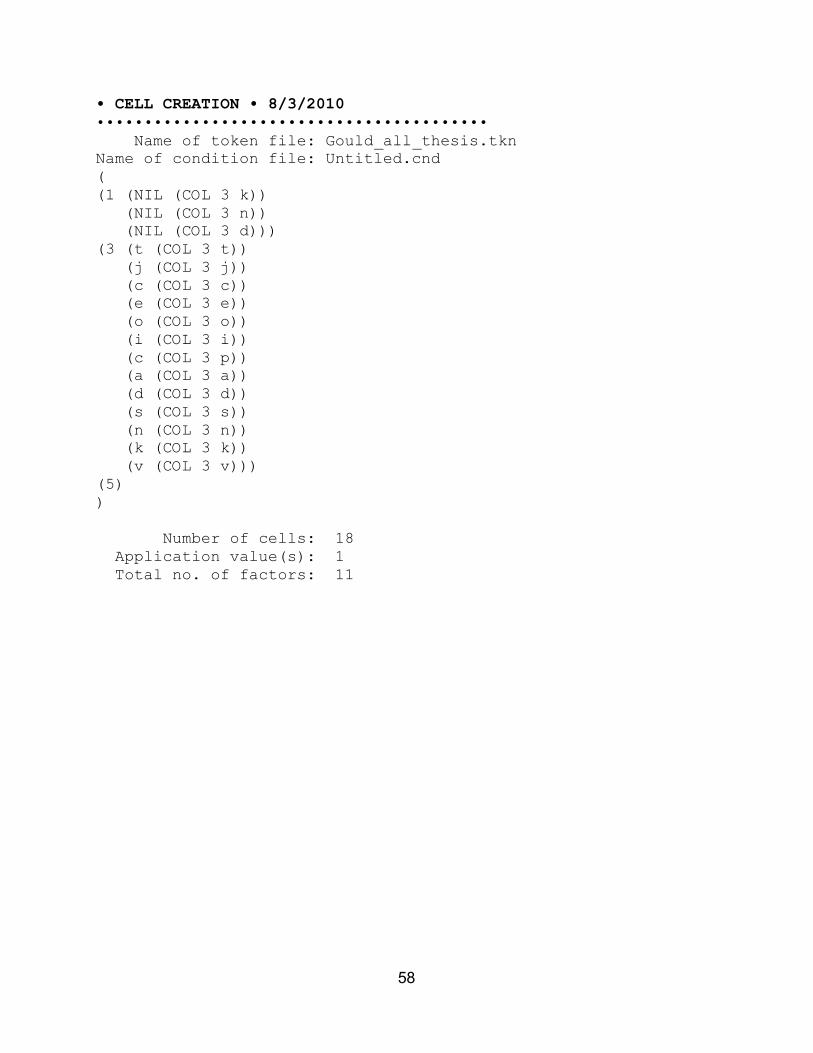
58
• CELL CREATION • 8/3/2010 ••••••••••••••••••••••••••••••••••••••••• Name of token file: Gould_all_thesis.tkn Name of condition file: Untitled.cnd ( (1 (NIL (COL 3 k)) (NIL (COL 3 n)) (NIL (COL 3 d))) (3 (t (COL 3 t)) (j (COL 3 j)) (c (COL 3 c)) (e (COL 3 e)) (o (COL 3 o)) (i (COL 3 i)) (c (COL 3 p)) (a (COL 3 a)) (d (COL 3 d)) (s (COL 3 s)) (n (COL 3 n)) (k (COL 3 k)) (v (COL 3 v))) (5) ) Number of cells: 18 Application value(s): 1 Total no. of factors: 11

59
APPENDIX E
BINOMIAL ONE-STEP ANALYSIS EXCLUDING KNOCKOUTS AND SINGLETONS
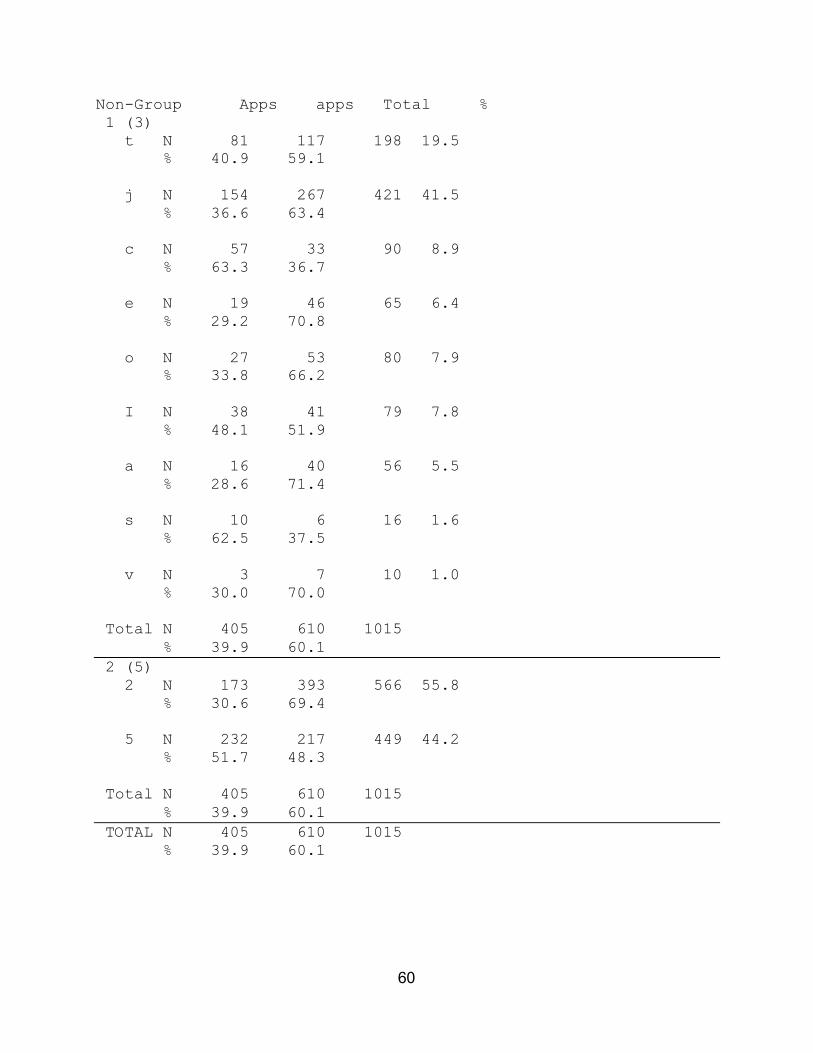
60
Non-Group Apps apps Total % 1 (3) t N 81 117 198 19.5 % 40.9 59.1 j N 154 267 421 41.5 % 36.6 63.4 c N 57 33 90 8.9 % 63.3 36.7 e N 19 46 65 6.4 % 29.2 70.8 o N 27 53 80 7.9 % 33.8 66.2 I N 38 41 79 7.8 % 48.1 51.9 a N 16 40 56 5.5 % 28.6 71.4 s N 10 6 16 1.6 % 62.5 37.5 v N 3 7 10 1.0 % 30.0 70.0 Total N 405 610 1015 % 39.9 60.1 2 (5) 2 N 173 393 566 55.8 % 30.6 69.4 5 N 232 217 449 44.2 % 51.7 48.3 Total N 405 610 1015 % 39.9 60.1 TOTAL N 405 610 1015 % 39.9 60.1
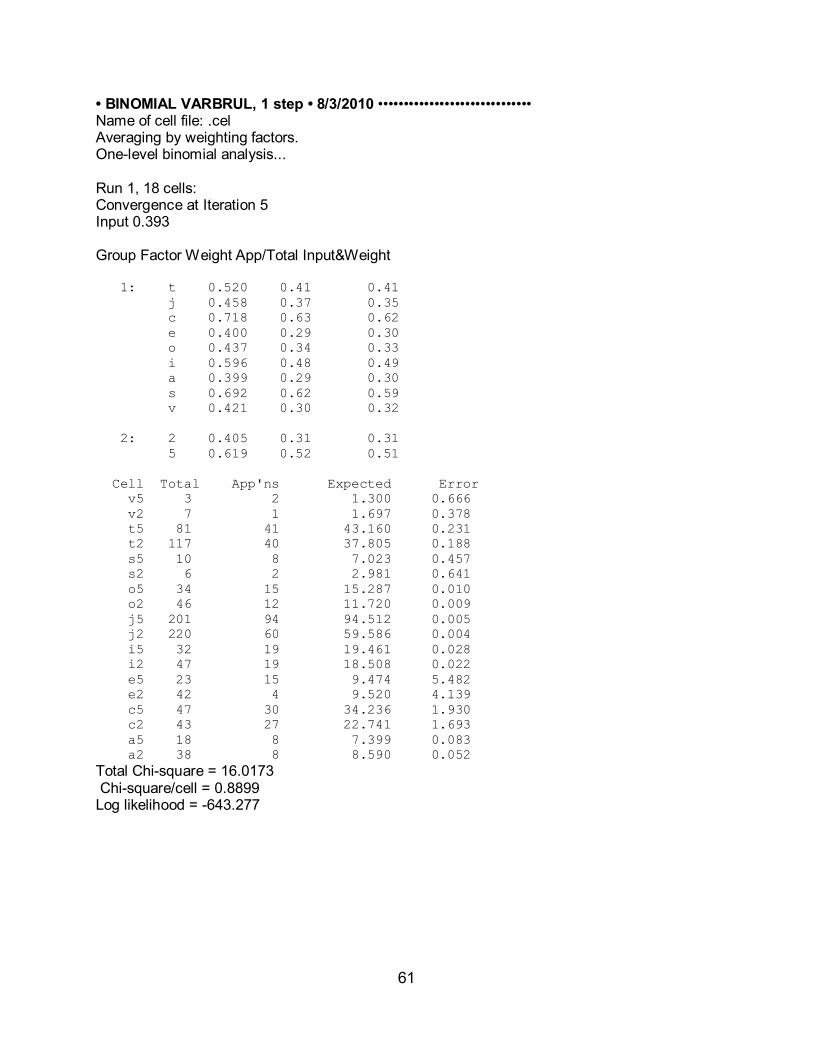
61
• BINOMIAL VARBRUL, 1 step • 8/3/2010 •••••••••••••••••••••••••••••• Name of cell file: .cel Averaging by weighting factors. One-level binomial analysis... Run 1, 18 cells: Convergence at Iteration 5 Input 0.393 Group Factor Weight App/Total Input&Weight 1: t 0.520 0.41 0.41 j 0.458 0.37 0.35 c 0.718 0.63 0.62 e 0.400 0.29 0.30 o 0.437 0.34 0.33 i 0.596 0.48 0.49 a 0.399 0.29 0.30 s 0.692 0.62 0.59 v 0.421 0.30 0.32 2: 2 0.405 0.31 0.31 5 0.619 0.52 0.51 Cell Total App'ns Expected Error v5 3 2 1.300 0.666 v2 7 1 1.697 0.378 t5 81 41 43.160 0.231 t2 117 40 37.805 0.188 s5 10 8 7.023 0.457 s2 6 2 2.981 0.641 o5 34 15 15.287 0.010 o2 46 12 11.720 0.009 j5 201 94 94.512 0.005 j2 220 60 59.586 0.004 i5 32 19 19.461 0.028 i2 47 19 18.508 0.022 e5 23 15 9.474 5.482 e2 42 4 9.520 4.139 c5 47 30 34.236 1.930 c2 43 27 22.741 1.693 a5 18 8 7.399 0.083 a2 38 8 8.590 0.052 Total Chi-square = 16.0173 Chi-square/cell = 0.8899 Log likelihood = -643.277
62
APPENDIX F
CROSS TABULATIONS WITH INDEPENDENT VARIABLES 2 (SUBJECT TYPE) AND 4 (AGE GROUP)
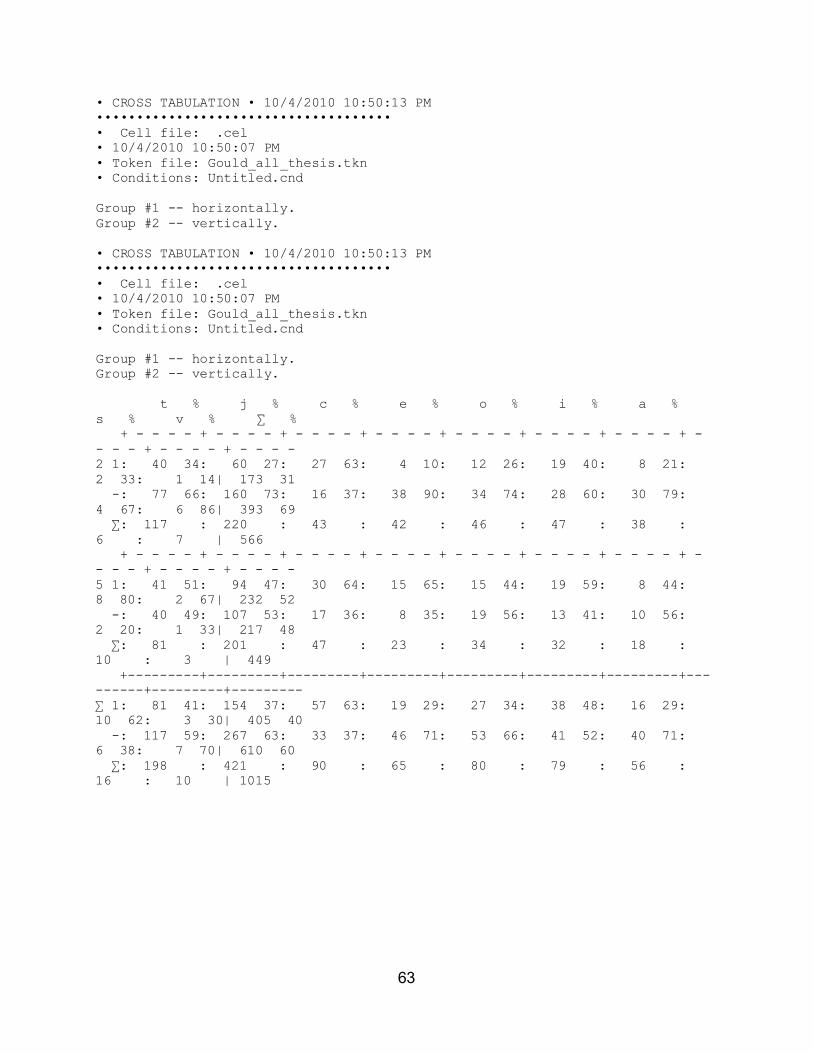
63
• CROSS TABULATION • 10/4/2010 10:50:13 PM ••••••••••••••••••••••••••••••••••••• • Cell file: .cel • 10/4/2010 10:50:07 PM • Token file: Gould_all_thesis.tkn • Conditions: Untitled.cnd Group #1 -- horizontally. Group #2 -- vertically. • CROSS TABULATION • 10/4/2010 10:50:13 PM ••••••••••••••••••••••••••••••••••••• • Cell file: .cel • 10/4/2010 10:50:07 PM • Token file: Gould_all_thesis.tkn • Conditions: Untitled.cnd Group #1 -- horizontally. Group #2 -- vertically. t % j % c % e % o % i % a % s % v % ∑ % + - - - - + - - - - + - - - - + - - - - + - - - - + - - - - + - - - - + - - - - + - - - - + - - - - 2 1: 40 34: 60 27: 27 63: 4 10: 12 26: 19 40: 8 21: 2 33: 1 14| 173 31 -: 77 66: 160 73: 16 37: 38 90: 34 74: 28 60: 30 79: 4 67: 6 86| 393 69 ∑: 117 : 220 : 43 : 42 : 46 : 47 : 38 : 6 : 7 | 566 + - - - - + - - - - + - - - - + - - - - + - - - - + - - - - + - - - - + - - - - + - - - - + - - - - 5 1: 41 51: 94 47: 30 64: 15 65: 15 44: 19 59: 8 44: 8 80: 2 67| 232 52 -: 40 49: 107 53: 17 36: 8 35: 19 56: 13 41: 10 56: 2 20: 1 33| 217 48 ∑: 81 : 201 : 47 : 23 : 34 : 32 : 18 : 10 : 3 | 449 +---------+---------+---------+---------+---------+---------+---------+---------+---------+--------- ∑ 1: 81 41: 154 37: 57 63: 19 29: 27 34: 38 48: 16 29: 10 62: 3 30| 405 40 -: 117 59: 267 63: 33 37: 46 71: 53 66: 41 52: 40 71: 6 38: 7 70| 610 60 ∑: 198 : 421 : 90 : 65 : 80 : 79 : 56 : 16 : 10 | 1015

64
APPENDIX G
BINOMIAL STEP-UP ANALYSIS
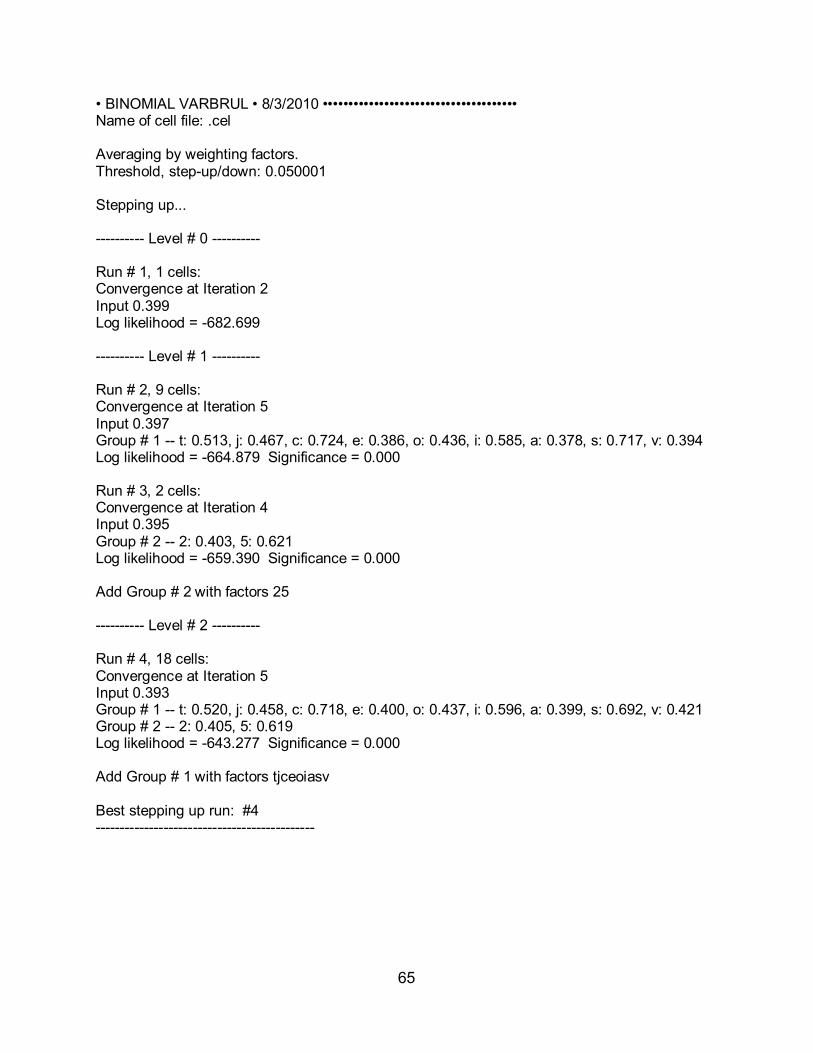
65
• BINOMIAL VARBRUL • 8/3/2010 •••••••••••••••••••••••••••••••••••••• Name of cell file: .cel Averaging by weighting factors. Threshold, step-up/down: 0.050001 Stepping up... ---------- Level # 0 ---------- Run # 1, 1 cells: Convergence at Iteration 2 Input 0.399 Log likelihood = -682.699 ---------- Level # 1 ---------- Run # 2, 9 cells: Convergence at Iteration 5 Input 0.397 Group # 1 -- t: 0.513, j: 0.467, c: 0.724, e: 0.386, o: 0.436, i: 0.585, a: 0.378, s: 0.717, v: 0.394 Log likelihood = -664.879 Significance = 0.000 Run # 3, 2 cells: Convergence at Iteration 4 Input 0.395 Group # 2 -- 2: 0.403, 5: 0.621 Log likelihood = -659.390 Significance = 0.000 Add Group # 2 with factors 25 ---------- Level # 2 ---------- Run # 4, 18 cells: Convergence at Iteration 5 Input 0.393 Group # 1 -- t: 0.520, j: 0.458, c: 0.718, e: 0.400, o: 0.437, i: 0.596, a: 0.399, s: 0.692, v: 0.421 Group # 2 -- 2: 0.405, 5: 0.619 Log likelihood = -643.277 Significance = 0.000 Add Group # 1 with factors tjceoiasv Best stepping up run: #4 ---------------------------------------------
66
APPENDIX H
BINOMIAL STEP-DOWN ANALYSIS
67
Stepping down... ---------- Level # 2 ---------- Run # 5, 18 cells: Convergence at Iteration 5 Input 0.393 Group # 1 -- t: 0.520, j: 0.458, c: 0.718, e: 0.400, o: 0.437, i: 0.596, a: 0.399, s: 0.692, v: 0.421 Group # 2 -- 2: 0.405, 5: 0.619 Log likelihood = -643.277 ---------- Level # 1 ---------- Run # 6, 2 cells: Convergence at Iteration 4 Input 0.395 Group # 2 -- 2: 0.403, 5: 0.621 Log likelihood = -659.390 Significance = 0.000 Run # 7, 9 cells: Convergence at Iteration 5 Input 0.397 Group # 1 -- t: 0.513, j: 0.467, c: 0.724, e: 0.386, o: 0.436, i: 0.585, a: 0.378, s: 0.717, v: 0.394 Log likelihood = -664.879 Significance = 0.000 All remaining groups significant Groups eliminated while stepping down: None Best stepping up run: #4 Best stepping down run: #5
68
REFERENCES
Armstrong, N. & Smith, A. (2002). The influence of linguistic and social factors on the
recent decline of French ne. Journal of French Language Studies, 12, 23-41.
Ashby, W. (1976). The loss of the negative morpheme ne in Parisian French. Lingua,
39, 119-137.
Ashby, W. (1981). The loss of the negative particle ne in French: A syntactic change in
progress. Language, 57, 674-687.
Ashby, W. (2001). Un nouveau regard sur la chute du ne en français parlé tourangeau:
S’agit-il d'un changement en cours? Journal of French Language Studies, 11, 1-
22.
Bell, A. (1984). Language style as audience design. Language in Society, 13, 145-204.
Ayers-Bennett, W. (1996). A history of the French language through texts. London:
Routledge.
Blanche-Benveniste, C., & Jeanjean, C. (1987). Le Français parlé: transcription et
édition. Paris: Didier.
Coveney, A. (1996). Variability in spoken French: A sociolinguistic study of interrogation
and negation. Exeter, England: Elm Bank.
Diller, A.-M. (1983). Subject NP structure and variable constraints: The case of ne
deletion. In R. Fasold (Ed.), Variation in the form and use of language (pp. 167-
175). Washington, DC: Georgetown University Press.
Fonseca-Greber, B. (2007). The emergence of emphatic ne in conversational Swiss
French. Journal of French Language Studies, 17, 249-275.
69
Grevisse, M. (1993). Le Bon usage: Grammaire française [Good usage: French
grammar] (13th ed.). Paris: Duculot.
Guy, G. (1988). Advanced Varbrul analysis. In K. Ferrara, B. Brown, K. Walters, & J.
Baugh (Eds.), Linguistic change and contact (pp. 124-136). Texas Linguistic
Forum, 30. Austin: University of Texas, Department of Linguistics.
Hansen, B., & Malderez, I. (2004). Le ne de négation en région parisienne: Une étude
en temps réel. Langage & Société, 107, 5-30.
Labov, W. (1972). Sociolinguistic patterns. Philadelphia: University of Pennsylvania
Press.
Labov, W. (2007). Sociolinguistics: An interview with William Labov. Revista Virtual de
Estudos da Linguagem (ReVEL), 5. Available from http://www.revel.inf.br/
site2007/_pdf/9/entrevistas/revel_9_interview_labov.pdf
Moreau, M.-L. (1986). Les Séquences préformées: entre les combinaisons libres et les
idiomatismes. Le cas de la négation avec et sans ne. Le Français moderne, 54,
137-160.
Paolillo, J. (2002). Analyzing linguistic variation: Statistical models and methods.
Stanford, CA: Center for the Study of Language and Information.
Panckhurst, Rachel (2007). Discours électronique médié : quelle évolution depuis une
décennie? In J. Gerbault (Ed.), La langue du cyberespace : de la diversité aux
normes (pp. 121-136). Paris: L'Harmattan.
Pierozak, Isabelle. (2003). Le “français tchaté”: Un objet à géométrie variable?
Langage & Société, 104, 123-144.
Pohl, J. (1968). Ne dans le français parlé contemporain: Les modalités de son abandon.
70
Actes du XIe Congrès International de Linguistique et Philologie Romanes, Vol.
3, 1343–59.
Pooley, T. (1996). Chtimi: The urban vernaculars of Northern France. Clevedon,
England: Multilingual Matters.
Preston, Dennis. (1996). Variationist perspectives on second language acquisition. In R.
Bayley & D. Preston (Eds.), Second language acquisition and linguistic variation
(pp. 1-45). Amsterdam: John Benjamins.
Rand, D., & Sankoff, D. (1990). Goldvarb 2.1: A variable rule application for the
Macintosh. Montreal: Centre de Recherches Mathématiques, Université de
Montréal. Version 2. Available from http://www.crm.umontreal.ca/
~sankoff/GoldVarb_Eng.html
Rickard, P. (2003). A history of the French language (2nd ed.). London: Routledge.
Sankoff, G., Tagliamonte, S., & Smith, E. (2005). Goldvarb X: A variable rule application
for Macintosh and Windows. Toronto, Canada: Department of Linguistics,
University of Toronto.
Sankoff, G., & Vincent, D. (1981). The productive use of ne in spoken Montreal French.
Le Francais moderne, 45, 243-256.
Sankoff, G. (1988). Variable rules. In U. Ammon, N. Dittmar, & K. Mattheier (Eds.),
Sociolinguistics: An international handbook of the science of language and
society (pp. 984-997). Berlin: de Gruyter.
Tagliamonte, S. (2006). Analysing sociolinguistic variation. Cambridge, England:
Cambridge University Press.
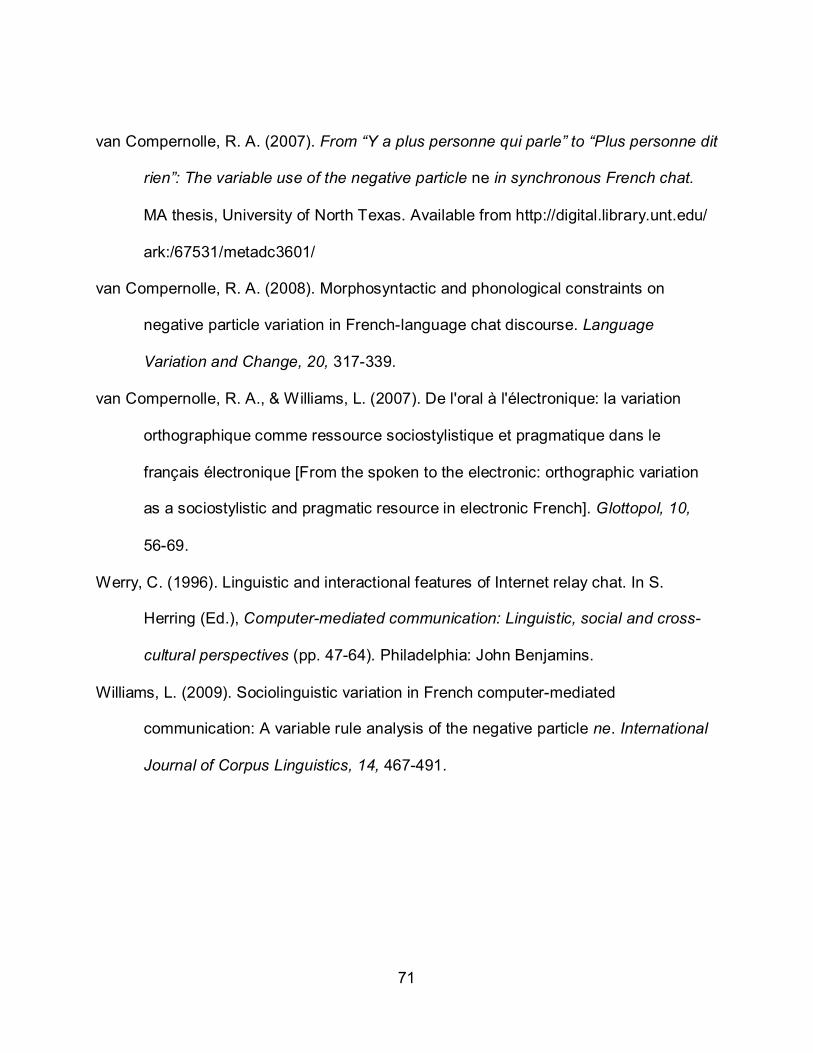
71
van Compernolle, R. A. (2007). From “Y a plus personne qui parle” to “Plus personne dit
rien”: The variable use of the negative particle ne in synchronous French chat.
MA thesis, University of North Texas. Available from http://digital.library.unt.edu/
ark:/67531/metadc3601/
van Compernolle, R. A. (2008). Morphosyntactic and phonological constraints on
negative particle variation in French-language chat discourse. Language
Variation and Change, 20, 317-339.
van Compernolle, R. A., & Williams, L. (2007). De l'oral à l'électronique: la variation
orthographique comme ressource sociostylistique et pragmatique dans le
français électronique [From the spoken to the electronic: orthographic variation
as a sociostylistic and pragmatic resource in electronic French]. Glottopol, 10,
56-69.
Werry, C. (1996). Linguistic and interactional features of Internet relay chat. In S.
Herring (Ed.), Computer-mediated communication: Linguistic, social and cross-
cultural perspectives (pp. 47-64). Philadelphia: John Benjamins.
Williams, L. (2009). Sociolinguistic variation in French computer-mediated
communication: A variable rule analysis of the negative particle ne. International
Journal of Corpus Linguistics, 14, 467-491.