The Variable Effect of Polyploidization on the Phenotype ...Denaeghel et al. Polyploidization and...
17
ORIGINAL RESEARCH published: 20 March 2018 doi: 10.3389/fpls.2018.00354 Frontiers in Plant Science | www.frontiersin.org 1 March 2018 | Volume 9 | Article 354 Edited by: Sergio J. Ochatt, INRA UMR1347 Agroécologie, France Reviewed by: Margherita Irene Beruto, Istituto Regionale per la Floricoltura (IRF), Italy Xiyin Wang, North China University of Science and Technology, China *Correspondence: Hanne E. R. Denaeghel [email protected] Katrijn Van Laere [email protected] Specialty section: This article was submitted to Plant Breeding, a section of the journal Frontiers in Plant Science Received: 03 January 2018 Accepted: 02 March 2018 Published: 20 March 2018 Citation: Denaeghel HER, Van Laere K, Leus L, Lootens P, Van Huylenbroeck J and Van Labeke M-C (2018) The Variable Effect of Polyploidization on the Phenotype in Escallonia. Front. Plant Sci. 9:354. doi: 10.3389/fpls.2018.00354 The Variable Effect of Polyploidization on the Phenotype in Escallonia Hanne E. R. Denaeghel 1,2 *, Katrijn Van Laere 1 *, Leen Leus 1 , Peter Lootens 1 , Johan Van Huylenbroeck 1 and Marie-Christine Van Labeke 2 1 Applied Genetics and Breeding, Plant Sciences Unit, Flanders Research Institute for Agriculture, Fisheries and Food, Melle, Belgium, 2 Department of Plant Production, Faculty of Bioscience Engineering, Ghent University, Ghent, Belgium To induce new variation within the Escallonia genus, chromosome doubling was performed in E. rubra, E. rosea, and E. illinita, three important species within this genus of mainly evergreen woody ornamental species. Obtained tetraploids and diploid controls were analyzed for rooting capacity, leaf and flower characteristics, and plant architecture using image analysis and cold tolerance. In the present study, a breeders’ collection of 23 accessions was characterized cytogenetically and described morphologically. All analyzed species and cultivars were diploid (2n = 2x = 24), with exception of E. pendula, a tetraploid. Today, breeding in Escallonia is limited to lucky finds in seedling populations and few efforts in interspecific hybridization. Three selected Escallonia species underwent an in vitro chromosome doubling with both oryzalin and trifluralin applied as either a continuous or shock treatment. The treatments successfully induced polyploids in all three species. Image analysis revealed that tetraploid E. rosea had decreased shoot length (from 3.8 to 1.3 cm), higher circularity and more dense growth habit compared to diploids. No significant changes in cold tolerance were seen. Tetraploid E. illinita did not differ in shoot length, but an increased outgrowth of axillary buds on the main axis led to denser plants. For tetraploid E. rubra, an increase in plant height (from 4.9 to 5.5 cm) was observed together with a large decrease in circularity and density due to a more polar outgrowth of branches on the main axis. E. rubra tetraploids bore larger flowers than diploids and had an increased cold tolerance (from −7.7 to −11.8 ◦ C). Leaf width and area of tetraploids increased for both E. illinita and E. rubra, while a decrease was seen in E. rosea genotypes. For all three species, the rooting capacity of the tetraploids did not differ from the diploids. We conclude that the effect of polyploidization on Escallonia was highly variable and species dependent. Keywords: chromosome doubling, cold tolerance, compactness, image analysis, plant architecture, rooting capacity INTRODUCTION Polyploidization is a breeding tool that creates variation in phenotype and physiology (Horn, 2002; Dhooghe et al., 2011; Sattler et al., 2016). The basic consequence of polyploidization is an increase in cell size caused by the larger number of gene copies (gigas effect) (Sattler et al., 2016). Therefore, polyploids may have larger organs than their diploid counterparts, such as larger and
Transcript of The Variable Effect of Polyploidization on the Phenotype ...Denaeghel et al. Polyploidization and...

ORIGINAL RESEARCHpublished: 20 March 2018
doi: 10.3389/fpls.2018.00354
Frontiers in Plant Science | www.frontiersin.org 1 March 2018 | Volume 9 | Article 354
Edited by:
Sergio J. Ochatt,
INRA UMR1347 Agroécologie, France
Reviewed by:
Margherita Irene Beruto,
Istituto Regionale per la Floricoltura
(IRF), Italy
Xiyin Wang,
North China University of Science and
Technology, China
*Correspondence:
Hanne E. R. Denaeghel
Katrijn Van Laere
Specialty section:
This article was submitted to
Plant Breeding,
a section of the journal
Frontiers in Plant Science
Received: 03 January 2018
Accepted: 02 March 2018
Published: 20 March 2018
Citation:
Denaeghel HER, Van Laere K, Leus L,
Lootens P, Van Huylenbroeck J and
Van Labeke M-C (2018) The Variable
Effect of Polyploidization on the
Phenotype in Escallonia.
Front. Plant Sci. 9:354.
doi: 10.3389/fpls.2018.00354
The Variable Effect ofPolyploidization on the Phenotype inEscallonia
Hanne E. R. Denaeghel 1,2*, Katrijn Van Laere 1*, Leen Leus 1, Peter Lootens 1,
Johan Van Huylenbroeck 1 and Marie-Christine Van Labeke 2
1 Applied Genetics and Breeding, Plant Sciences Unit, Flanders Research Institute for Agriculture, Fisheries and Food, Melle,
Belgium, 2Department of Plant Production, Faculty of Bioscience Engineering, Ghent University, Ghent, Belgium
To induce new variation within the Escallonia genus, chromosome doubling was
performed in E. rubra, E. rosea, and E. illinita, three important species within this genus
of mainly evergreen woody ornamental species. Obtained tetraploids and diploid controls
were analyzed for rooting capacity, leaf and flower characteristics, and plant architecture
using image analysis and cold tolerance. In the present study, a breeders’ collection
of 23 accessions was characterized cytogenetically and described morphologically. All
analyzed species and cultivars were diploid (2n= 2x= 24), with exception of E. pendula,
a tetraploid. Today, breeding in Escallonia is limited to lucky finds in seedling populations
and few efforts in interspecific hybridization. Three selected Escallonia species underwent
an in vitro chromosome doubling with both oryzalin and trifluralin applied as either a
continuous or shock treatment. The treatments successfully induced polyploids in all
three species. Image analysis revealed that tetraploid E. rosea had decreased shoot
length (from 3.8 to 1.3 cm), higher circularity and more dense growth habit compared to
diploids. No significant changes in cold tolerance were seen. Tetraploid E. illinita did not
differ in shoot length, but an increased outgrowth of axillary buds on the main axis led to
denser plants. For tetraploid E. rubra, an increase in plant height (from 4.9 to 5.5 cm) was
observed together with a large decrease in circularity and density due to a more polar
outgrowth of branches on the main axis. E. rubra tetraploids bore larger flowers than
diploids and had an increased cold tolerance (from −7.7 to −11.8◦C). Leaf width and
area of tetraploids increased for both E. illinita and E. rubra, while a decrease was seen
in E. rosea genotypes. For all three species, the rooting capacity of the tetraploids did
not differ from the diploids. We conclude that the effect of polyploidization on Escallonia
was highly variable and species dependent.
Keywords: chromosome doubling, cold tolerance, compactness, image analysis, plant architecture, rooting
capacity
INTRODUCTION
Polyploidization is a breeding tool that creates variation in phenotype and physiology (Horn,2002; Dhooghe et al., 2011; Sattler et al., 2016). The basic consequence of polyploidization is anincrease in cell size caused by the larger number of gene copies (gigas effect) (Sattler et al., 2016).Therefore, polyploids may have larger organs than their diploid counterparts, such as larger and
Denaeghel et al. Polyploidization and Phenotyping in Escallonia
thicker leaves, flowers, and fruits (Tang et al., 2010; Fenget al., 2017). However, increased cell size does not implicateincreased plant size as the number of cell divisions can bereduced in polyploids and thus result in more compact growinggenotypes (Horn, 2002; Sattler et al., 2016; Hias et al., 2017).Development of compact growing plants is a major goal inmany breeding programs. Currently, compactness is obtained byfrequent pruning (Meijon et al., 2009;Mutlu andKurtulan, 2015),by changing environmental factors such as light and temperatureregimes for indoor plants (Clifford et al., 2004; Löfkvist, 2010;Bergstrand and Schussler, 2013), or by using plant growthregulators such as chlormequat, paclobutrazol, trinexapac-ethyl,and daminozide (Meijon et al., 2009; Löfkvist, 2010; Lutken et al.,2012; Mutlu and Kurtulan, 2015; PPDB, 2017). The chemicalapproach is currently under debate for environmental reasons(Wang et al., 2011; Lutken et al., 2012). More compact growingpolyploids have been found inMalus (Hias et al., 2017), Buddleja(Rose et al., 2000), Petunia (Regalado et al., 2017), Rosa (Fenget al., 2017), Platanus (Liu et al., 2007), and Eriobotrya (Blascoet al., 2015) among others. Besides morphological changes,physiological changes, e.g., stress resistance and flowering period,are reported for polyploid plants (Levin, 2002; Van Laere et al.,2010; Regalado et al., 2017) due to an increase in genomeflexibility (Levin, 2002). A change in drought tolerance wasfound in tetraploid Spathiphyllum (Van Laere et al., 2010), inautotetraploid Malus (Zhang et al., 2015) and in pentaploidBetula (Li et al., 1996). An increase in drought tolerance wasfound in Citrus (Ruiz et al., 2016). In tetraploid Lonicera,an increase in both heat tolerance and drought was observed(Li et al., 2009, 2011).
In vivo and in vitro polyploidy induction has been widelyapplied in ornamental breeding. However, each species respondsdifferently to polyploidization and tailored protocols need tobe developed. Most protocols are developed in vitro, but somespecies are very difficult to initiate and propagate in vitro,and in vivo chromosome doubling protocols are needed, e.g.,for Ziziphus (Shi et al., 2015). Once polyploids are created,traits need to be evaluated. Most phenotyping studies onpolyploid ornamentals measure the characteristics of interest,e.g., internode length, leaf length and width, flower diameter,number, and length of branches, etc., manually on a limitednumber of plants (Stanys et al., 2006; Liu et al., 2007; Tang et al.,2010; Van Laere et al., 2010; Regalado et al., 2017). However, incontrast, image analysis enables a more in-depth analysis of plantcharacteristics (Fahlgren et al., 2015), as performed on leaf areaon tetraploid apple trees (Hias et al., 2017). Image analysis of
Abbreviations: BAP, 6-benzylaminopurine; BL, Branch Length; BIL, BranchInternode Length; BR, bounding rectangle; CoHu, convex hull; Coll, collection;D, Diploid; DAPI, 4′,6-diaminidino-2-phenylindole ; EC, electrical conductivity;EtOH, ethanol; I(t), Index of Injury at a given temperature t; MBC, minimalbounding circle; MS, Murashige & Skoog medium; NAA, 1-naphtaleneacetic acid;NSL, new shoot length; NSIL, new shoot internode length; ORY, oryzalin; PCA,principal component analysis; PC, principal component; PI, propidium iodide; T,tetraploid; TRI, trifluralin; TV, top view; TV_circ, plant circularity in top view;TV_fill, % of the area of the minimal bounding circle that was filled by the plant;TV_pl_ar, plant area in top view; T-yield, tetraploid yield; SV, side view; SV_fill, %of the area of the bounding rectangle was filled by the plant; SV_he, plant height inside view; SV_pl_ar, plant area in side view; SV_wi, plant width in side view.
the whole shoot augmented the information and the number ofplants that could be analyzed in rose (Li-Marchetti et al., 2015)and pea (Humplik et al., 2015a).
The present study was conducted on the genus EscalloniaMutis ex L.f. This genus belongs to the Escalloniaceae family andcontains about 40 flowering woody ornamental species, endemicto South America, especially Chile. Most species are evergreen,have white to red flowers, a honey fragrance, and resin glands onleaves and branches (Bean and Murray, 1989). Escallonia is usedas a hedging plant, especially in coastal regions. Depending on thespecies, Escallonia can thrive in USDA zones from 10 to 7b, whichcorresponds to mean minimum temperatures ranging from−1.1to −14.9◦C (Hoffman and Ravesloot, 1998). Numerous hybridsand cultivars have been described, and many of them have anE. rubra and E. virgata background, such as the F1 hybridsE. “Langleyensis” and E. “Edinburgh” (=E. “Edinensis”). E.“Donard Seedling,” E. “Apple Blossom,” and E. “Slieve Donard”are backcrosses of E. virgata × E. “Langleyensis,” while E. rubra“C.F. Ball” is a backcross of E. rubra var.macrantha× (E. rubra×E. rubra var.macrantha). The genotype E. “Red Elf” is an E. rubra“C.F. Ball” and E. “William Watson” hybrid, with the latterbeing a seedling of E. “Langleyensis” (Krüsmann, 1960; Bean andMurray, 1989; Hilliers Garden, 1991). Genetic and cytogeneticdata of Escallonia are rarely available. Chromosome counts wereperformed for 21 Escallonia genotypes; all are reported to bediploid with 24 chromosomes (Darlington and Wylie, 1955;Zielinski, 1955; Hanson and Leitch, 2002).
The aims of this study were (1) cytogenetic analysis of abreeders’ collection of Escallonia; (2) induction of polyploids ofa selected number of Escallonia species; and (3) quantificationof horticultural traits, plant architecture, winter hardiness androoting capacity in generated tetraploids.
MATERIALS AND METHODS
Plant MaterialOur collection contained 23 Escallonia accessions. Table 1
presents the acquisition origin, reported winter hardiness andsome morphological characteristics such as height and flowercolor. All genotypes were acquired in 3-fold, one plant wasplanted in the field (51◦0′N, 3◦48′E, Melle, Belgium) and twowere grown as a container plant in a peat-based substrate(Saniflor: 1.5 kg/m fertilizer: 12N:14P:24K + trace elements, pH5.0-6.5, EC 0.450 mS/cm) and kept in a frost-free glasshouse(min. temperature 6◦C).
Three species (E. illinita Presl. (1), E. rosea Griseb. andE. rubra (Ruiz & Pav.) Pers.) were chosen for further experiments.They displayed differences in growth rate, size and plant habitus,as observed in the collection and verified in literature (Table 1).
Young shoots of the greenhouse grown plants were sterilizedand nodes were initiated on a Murashige and Skoog (MS)medium (Murashige and Skoog, 1962) (MS including vitamins,Duchefa Farma, Haarlem, The Netherlands) containing 30g/L sucrose, 2 mg/L 6-benzylaminopurine (BAP), 0.1 mg/L1-naphtaleneacetic acid (NAA), 7 g/L agar (Lab M Limited,Heywood, Lancashire, UK) with pH = 5.9 ± 0.1. Shoots thatdeveloped on the nodes were transferred after 2–10 weeks to MS
Frontiers in Plant Science | www.frontiersin.org 2 March 2018 | Volume 9 | Article 354

Denaeghel et al. Polyploidization and Phenotyping in Escallonia
TABLE 1 | The collection of Escallonia genotypes with their acquisition origin and accession number and observed morphologic and cytogenetic characteristics.
Escallonia genotype Acquisition Winter hardiness
(◦C)bFlower colorc Plant height
(m)c2C-value
(pg)
Chromosome
number (n = 12)Grower/botanical
gardenaAccession
number
Literature Own
observation
E. alpina DC. (1) HG −6.6 Red White 0.6–3.5 1.16 ± 0.07 24
E. alpina DC. (2) BRMB Red = 1.13 ± 0.04 24
E. ‘Apple Blossom’ PE −14.9 White with
pale rose
= 1.5–2.5 1.13 ± 0.03 24
E. bifida Link & Otto BGM 19084138 −6.6 White = >3 1.43 ± 0.03 24
E. ‘Donard Seedling’ DN −14.9 White with
pale rose
= ≥2.5 1.07 ± 0.06 24
E. ‘Edinburgh’ RBGE 20050334A −12.2 Rosy carmine = – – 24
E. illinita Presl. (1) DN −12.2 White White with
pale rose
3 1.18 ± 0.04 24
E. illinita Presl. (2) BGUW XX-0-WU-
ESC000001
White = 1.31 ± 0.08 24
E. ‘Iveyi’ (Veith) DN −14.9 White = >2.5 1.32 ± 0.16 24
E. iveyi (x) Veith BGM 19391832 White = 1.25 ± 0.03 24
E. laevis ‘Gold Ellen’ DN −12.2 Dark rose = – 1.21 ± 0.12 24
E. ‘Langleyensis’ (Veith) TS 1347 −12.2 Rosy carmine = 2.5 1.06 ± 0.02 24
E. myrtoidea Bertero ex DC. RBGE 20130304 – – – – 1.20 ± 0.03 24
E. pendula Ruiz & Pav. BGM 19843175 – White – >3 2.17 ± 0.16 48
E. ‘Red Dream’ DN −12.2 Red = – 1.20 ± 0.12 24
E. ‘Red Elf’ DN −12.2 Red = 1.5–2.5 1.11 ± 0.06 24
E. rosea Griseb. HG – White White with
pale rose
1–2.5 1.11 ± 0.06 24
E. rubra (Ruiz & Pav.) Pers. RBGE 19924317*B −12.2 Rose to deep
crimson
= 4.5 1.07 ± 0.06 24
E. rubra ‘C.F. Ball’ BGM 19810040 Crimson = 2.1–3 1.07 ± 0.03 24
E. rubra var. macrantha
(Hook. & Arn.) Reiche
DN rose to red = 1.8–3 1.12 ± 0.03 24
E. rubra var. rubra HB C0834 – Red – 1.12 ± 0.02 24
E. ‘Slieve Donard’ RBGE 19653608A −14.9 Lightly rose
with carmine
= 1.5–2.1 – 24
E. stricta (x) Remy. HG – Red = – 1.15 ± 0.04 24
bWinter hardiness, cflower color and cplant height derived from literature were compared to the acquired plants. 2C value and chromosome number were measured.aDN, tree nursery De Neve, Oosterzele, Belgium; BGM, Botanical Garden Meise, Meise, Belgium; RBGE, Royal Botanical Garden Edinburgh, Edinburgh, Scotland; HG, Hillier Gardens,
Ampfield, Romsey, UK; BGUW, Botanischer Garten Universität Wien, Vienna, Austria; HB, Hortus Botanicus, Amsterdam, The Netherlands; BRMB, Boomkwekerij Rein & Mark Bulk,
Boskoop, The Netherlands; TS, Ter Saksen, Beveren, Belgium; PE, Plantentuin Esveld, Boskoop, The Netherlands.bHoffman and Ravesloot, 1998.cData from Bean and Murray (1989), Hilliers Garden (1991), and Krüsmann (1960). −, no information available. Own observation, when matching literature; −, is noted, when no flowers
appeared; −, is noted. Otherwise, the observed color is described.
growth medium (Duchefa) containing 30 g/L sucrose, 0.15 mg/LBAP, 0.05 mg/L NAA, 7 g/L agar (Lab M), and pH = 5.9 ± 0.1.They were grown in the growth chamber (ambient temperature:23 ± 1◦C, photoperiod: 16 h, light intensity: 35 µmol m−2s−1,bottom cooling: 18 ± 1◦C) in a 500mL jar. The in vitro stock,which was started 6–12 months before the experiments, wassub-cultured on fresh medium every 3–4 months.
AFLP AnalysisAFLP was performed on the Escallonia collection. For DNAextraction, the modified CTAB DNA isolation protocol of Doyleand Doyle (1987) was used with 20mg of lyophilized youngleaf material as starting material. AFLP reactions were executed
according to the protocol described by Van Laere et al. (2011a).AFLP reactions were run on an ABI Prism 3130xl GeneticAnalyzer (Applied Biosystems, Foster City, CA, USA) with theGeneScan 500Rox kit for labeling (Applied Biosystems). Fourfluorescent-labeled EcoRI and MseI primer combinations withsix selective bases were used for the selective amplification, i.e.,E-AAC + M-CTG, E-ACA + M-CAT, E-ACT + M-CTA andE-AGG + M-CTT. Peaks lower than 50 were removed fromthe analysis, together with all markers occurring in either morethan 95% or <5% of the population. A phylogenetic tree wasconstructed using a UPGMA clustering method with Jaccardindices and bootstrap values, executed in R (R version 3.2.0)(R Core Team, 2015).
Frontiers in Plant Science | www.frontiersin.org 3 March 2018 | Volume 9 | Article 354

Denaeghel et al. Polyploidization and Phenotyping in Escallonia
Chromosome Counts and Determination of2C ValueAll genotypes in the collection were analyzed for 2C value andchromosome number. The 2C values were determined with aflow cytometer equipped with a laser (488 nm, 20 mW solid statelaser, Sapphire 488-20) (Pas III, Partec). Samples were choppedaccording to Galbraith et al. (1983). Staining with propidiumiodide (PI) was performed using the commercially available PICystain kit (Partec). The samples were incubated in the dark at5◦C for at least 30min before measuring. As internal standard thetomato Solanum esculentum “Stupicke” (2C = 1.96 pg) (Dolezelet al., 1992) was used. Each measurement was repeated at leastfive times on at least 3 days. Histograms were analyzed usingFloMax software (Partec). Terminology on 2C values was used asdefined by Greilhuber et al. (2005). The ratio between the peaksof tomato and the Escallonia genotype measured was multipliedwith the 2C value of tomato to determine the Escallonia genotype.
Chromosome numbers from the plants in the collection weredetermined from actively growing root meristems. Young roottips (±1 cm) were incubated for 3 h in an antimitotic mixture(2.5mM colchicine + 1mM 8-hydroxyquinoline) and fixatedin 3:1 EtOH:acetic acid for 45–60min at room temperature.Digestion was performed at 37◦C for 60–100min (depending onthe genotype) using 1% enzyme suspension (1% cellulase and1% pectolyase in 10mM citric acid buffer). Slides were madeaccording to the SteamDrop protocol (Kirov et al., 2014) with2:1 and 1:1 EtOH:acetic acid as the first and second fixative, andstained with 4′,6-diaminidino-2-phenylindole (DAPI, 1 mg/mL).Slides were examined using fluorescence microscopy (LeicaDMIRB, 1000x, LEICA microsystems) equipped with a DFC450camera and LAS software (LEICA microsystems). Chromosomeanalyses were carried out on 10 well-spread metaphases of eachgenotype by DRAWID software version 0.26 (http://drawid.xyz/;Kirov et al., 2017).
Chromosome DoublingShock TreatmentsNodal explants (0.2–0.5mm) of E. illinita, E. rosea, and E. rubrawere submerged in 100mL liquid MS medium (Duchefa) with30 g/L sucrose, pH = 5.9 ± 0.1, with addition of 0, 50, 150,or 250µM of oryzalin (ORY; dissolved in 1mL 99% EtOH)or trifluralin (TRI; dissolved in 1mL acetone). The nodes wereincubated for 2, 3, or 4 days on a gyratory shaker (60 rpm) ina growth chamber (conditions as above). Each treatment wasperformed on 30 nodes (2 jars with 15 nodes). The controltreatment (0µM; only addition of 1mL EtOH or acetone inanalogy with the treatments) contained 18 nodal explants (2 jarswith 9 nodes). When the allotted exposure time was reached(2, 3, or 4 days) the nodal explants were rinsed with steriledemineralized water and transferred to solid MS growth medium(Duchefa), with 30 g/L sucrose, 0.15 mg/L BAP, 0.05 mg/L NAA,7 g/L agar (Lab M), and pH = 5.9 ± 0.1, (6 nodes per jar) andplaced in the growth chamber.
Continuous TreatmentsNodal explants (0.2–0.5mm) of E. illinita, E. rosea, and E. rubrawere placed on 100mL solid MS growth medium containing
either 0, 1, 5, or 10µM ORY (dissolved in 40 µL EtOH) or TRI(dissolved in 40 µL acetone) and grown in the growth chamber(for conditions see above) for 6, 8, or 10 weeks. Each treatmentwas performed on 30 nodes (6 per jar). The control treatment(0µM; only addition of 40 µL EtOH or acetone in analogy withthe treatments) contained 18 nodal explants (6 per jar). After theallotted exposure time (6, 8, or 10 weeks), the nodal explants wererinsed with sterile distilled water, transferred to 100ml solid MSgrowth medium (Duchefa), with 30 g/L sucrose, 0.15 mg/L BAP,0.05mg/L NAA, 7 g/L agar (LabM), and pH= 5.9± 0.1, (6 nodesper jar) and placed in the growth chamber.
Analysis of Ploidy Level With Flow CytometryThe mortality (%) and tetraploid yield (T-yield, %) of theshock and continuous treatments were determined 12 weeksafter the start of the experiment. From each surviving nodalexplant, a single developing axillary shoot was selected, indicatingone possible polyploidization event. To determine the ploidylevel, a young leaf was sampled (10 à 20 mm2). Samples werechopped according to Galbraith et al. (1983), stained with 4′,6-diaminidino-2-phenylindole (DAPI) using a citrate buffer (500µL 0.1M citric acid monohydrate and 0.5% Tween 20) anda phosphate buffer (750 µL 0.4M Na2HPO4.12H2O, 2 mg/LDAPI, 0.1% polyvinylpyrrolidone (PVP) (modified from Otto,1990), and analyzed with a flow cytometer equipped with a UVLED (365 nm) (Cyflow Space, Partec). Histograms were analyzedusing FloMax software (Partec). An in vitro sample of a non-treated diploid plant of the same species was used to calibrate theflow cytometer.
After acclimatization in the greenhouse, 10 diploid controlsand 23 tetraploid numbers of E. illinita were randomly chosenfrom all acclimatized plantlets for further phenotyping. ForE. rosea and E. rubra, 6 and 23 tetraploid numbers, respectively,and 4 and 16 diploid controls, respectively, were obtained froma similar, preliminary experiment with ORY and TRI (Denaeghelet al., 2015). Each event that resulted in a tetraploid was identifiedby a unique code (T01, T02,. . . ) for each species. Diploid plantsfrom the control treatment were similarly named (D01, D02,. . . ).The diploid controls and tetraploid events are therefore referredto by these codes below.
Characterization of the TetraploidsPlant MaterialAll tetraploid shoots and an equal number of diploid shootsfrom the control treatment were transferred to a solid MS(Duchefa) rooting medium (30 g/l sucrose, 0.5 mg/l NAA, 7g/l agar (Lab M), pH = 5.9 ± 0.1) for approximately 6 weeks.When the first roots emerged, plantlets were acclimated in thegreenhouse (16L:8D; mean temperature day: 22.9◦C and night:19.9◦C; fertilization: N-P-K+MgO 20-5-10+2 at EC = 1 mS/cmand pH = 5) in a peat based substrate (Saniflor: 1.5 kg/m3
fertilizer: 12N:14P:24K + trace elements, pH 5.0-6.5, EC 0.450mS/cm). These plants were used as mother plants for cuttingproduction. Cuttings were rooted in peat substrate (Saniflor: 1.5kg/m2 fertilizer, 12N:14P:24K + trace elements, pH 5.0-6.5, EC0.450 mS/cm) without auxin treatment in the greenhouse under
Frontiers in Plant Science | www.frontiersin.org 4 March 2018 | Volume 9 | Article 354

Denaeghel et al. Polyploidization and Phenotyping in Escallonia
a tunnel covered with white plastic to maintain humidity at 100%RH. Rooted cuttings were used for further experiments.
Rooting CapacityFor this experiment, the diploid and tetraploid numbers weregrouped in homoploid groups. For E. rosea and E. rubra, 4replicates of ±50 cuttings (±5 cm) were made from the diploidcontrol group and from the tetraploid group. For E. illinita,2 replicates of ±60 cuttings (±5 cm) were made per group.The cuttings were taken from randomly chosen numbers in thehomoploid groups. After 5 weeks, the rooted cuttings were rinsedwith tap water, photographed, the roots were excised and thefresh weight of the roots was determined on an analytical balance.Subsequently, the roots were dried for 48 h at 70◦C and weighedagain to determine the dry matter content.
Morphological Traits
Growth, branching, and leaf characteristicsApical cuttings (±5 cm) were made for each number from6-month-old mother plants. Five weeks after cutting,measurements were made on at least four rooted cuttingsper number. The length of the new apical shoot (NSL) and itsinternode length (NSIL) were determined. Subsequently, thecuttings were pinched, leaving four nodes of the new grownshoot. Seven weeks after pinching, the axillary budburst (% ofnodes on the main stem that sprouted), axillary branch length(BL) and the branch internode length (BIL) were measured onthe plantlets. Ten full-grown leaves were collected on each offive randomly chosen plantlets of each tetraploid and diploidnumber. Leaf length, width, and surface area were measuredin ImageJ. The length was measured from the leaf base to thetip. The width was measured on the widest point of the leaf,perpendicular to the height.
Flower characteristicsTetraploid and diploid mother plants were planted in the field(51◦0′N, 3◦48′E, Melle, Belgium) in October 2016 for E. roseaand E. rubra and in October 2017 for E. illinita. At the time ofthis writing, flowering has occurred only on E. rubra diploidsand tetraploids and on E. rosea diploids. The start and end dateof flowering were recorded. The flowers of the diploid controlsand tetraploid genotypes were grouped. For the diploid group, 96flowers were collected vs. 93 flowers for the tetraploid group. Inaddition, 76 flowers were collected from the original plant in ourbreeders’ collection in the field. Top and side view photographswere taken of the flowers then analyzed for flower length, tubewidth and corolla surface area using ImageJ (Abramoff et al.,2004). The flower length was measured from the base of thereceptacle to the corolla.
Plant ArchitectureEleven weeks after pinching the plantlets, photographs weretaken of the individual E. rosea and E. rubra diploid andtetraploid number. From each tetraploid number and eachdiploid control, 10 clones were photographed overhead. For fiveclones, three side views were taken after turning the plant 120◦
after each photograph. For the top view, convex hull (CoHu)
area and perimeter, and theminimal bounding circle (MBC) weredetermined in ImageJ (Abramoff et al., 2004; Figure 1A). Theconvex hull was created with the Hull and Circle plugin providedby ImageJ (Abramoff et al., 2004). With the convex hull area andperimeter, the circularity (Circ) was determined. This formulareturns a value between 0 and 1, with 1 being a perfect circle.
Circ =4 ∗ π ∗ CoHu area
(CoHu perimeter)2(1)
For the side view, the plant surface, width and height weredetermined in ImageJ (Abramoff et al., 2004; Figure 1B), by usingthe Measure function (bounding rectangle) on the selected plantsurface.
Controlled Freezing TestShoots of at least one diploid and one tetraploid number ofE. rosea and E. rubra were collected after a cold period (13 daysin November and December 2016 with minimum temperatures<0◦C) on field-grown plants. The analyzed numbers werechosen randomly. No cold tolerance test could be performed onE. illinita, as they had not yet been cold-acclimated. The shootswere dissected in stem pieces of ±1 cm, each containing oneaxillary bud. Ten randomly chosen stem pieces were weighedon an analytical balance, dried for 48 h at 70◦C, then weighedagain to determine the dry matter content. Fifty stem piecesper number were placed in Eppendorf tubes (2mL) with 0.5mLdistilled water and a few clean grains of sand. The stem tissuewas frozen in a cryostat (Polystat 37, Fisher Scientific, Waltham,MA, USA) from 0 to −35◦C at a rate of 6◦C h−1. This was donefor five replicates per cultivar and per freezing temperature. Thepositive controls were kept at a reference temperature of 4◦C,the negative controls at −80◦C. After the target temperatureswere reached, the samples were transferred to vials containing10mL of incubation medium with 0.002% Triton-X and 10mMboric acid (Ögren et al., 1997). The vials were shaken (200rpm) for 20 h. To determine the degree of injury, the electricalconductivity (EC) of the samples was determined before (ECsamp)and after autoclaving (ECsamp,aut). The positive control was usedas reference (ECref and ECref,aut). The index of injury (Flint et al.,1967) was determined for each sample as follows:
I (t) =
(
EC samp
EC samp, aut−
EC ref
EC ref, aut
)
1−EC ref
EC ref, aut
∗ 100 (2)
The formula to determine the index of injury [I(t)] is based onthe principle that when dying plant cells burst, they release theircontent, and thus the EC value of the surrounding solution rises,which was measured after the cold treatment and the shaking.Subsequently, the surviving cells were killed by autoclavingand the total EC value was determined. The EC values of thereference samples at 4◦C take the damage caused by samplingand the experiment itself into account. To calculate the LT50,the % of injury at −80◦C was interpreted as 100%, and theother injury values were compared with this value. LT50-values
Frontiers in Plant Science | www.frontiersin.org 5 March 2018 | Volume 9 | Article 354
Denaeghel et al. Polyploidization and Phenotyping in Escallonia
FIGURE 1 | (A) Side view photograph of the tetraploid Escallonia rubra T04 with the bounding rectangle (blue) and analyzed plant area (red) indicated. (B) Top view
photograph of the diploid E. rubra D04 with the convex hull (CoHu, blue), the minimal bounding circle (MBC, purple), and the analyzed plant area (red) indicated.
(the temperature where 50% of plant cells were injured) weredetermined via sigmoidal regression on the adjusted injury valuesas determined by Lim and Arora (1998).
Statistical AnalysisStatistical analysis was done in R, version 3.2.0 (R Core Team,2015). All data were first analyzed for normality using theShapiro-Wilk Test (p = 0.05). For data that were not normallydistributed, group comparison was done with the Kruskal-WallisTest (KWT) and pairwise comparison with the Mann-WhitneyU-Test (MWUT). This was done for the data on rooting capacityand the data on root dry weight. MWUT and KWT were alsoused for part of the data concerning growth and branching,namely BL, BIL, and axillary budburst of E. illinita, all thecharacteristics of E. rosea, and the BL, BIL, and axillary budburstof E. rubra. The data of the leaf sizes of E. rosea and E. rubrawere not normally distributed, as were the data from the top viewand side view images of E. rosea and E. rubra, and the lengthand width of the flower tube of E. rubra. All data were analyzedusing p = 0.05 unless stated otherwise. Boxplots for the figuresin Supplementary Data were plotted in R, version 3.2.0 (R CoreTeam, 2015) using the boxplot function. The bottom and topof the box are the lower and upper quartiles; the band in themiddle displays the median. The upper/lower whisker extends tothe highest/lowest value, up to a maximum length of 1.5 timesthe box length. Higher/lower values are indicated as a dot. Thediploid and tetraploid numbers were sorted by means.
For normally distributed data, group comparisons wereperformed with ANOVA and pairwise comparison was doneusing the t-test. This was done for the data on growth andbranching, namely NSL and NSIL of E. illinita, and the NSL andNSIL of E. rubra. The data of the leaves of E. illinita and the areaof the flower top viewwere analyzed using ANOVA and the t-test.
The phylogenetic trees were plotted with the pvclust package,using the UPGMA clustering method with Jaccard indices in R(version 3.2.0) (R Core Team, 2015).
A principal component analysis (PCA) was executed for thediploids and tetraploids of E. illinita, E. rosea, and E. rubra. Allthree genotypes were analyzed for obtained morphological traits,namely the length of the new apical shoot (NSL) and its internodelength (NSIL), the axillary budburst (BB), axillary branch length
(BL) and the branch internode length (BIL). PCA of E. rosea andE. rubra included the plant architecture traits from the pictures intop view (TV), namely the plant area (TV_pl_ar), the circularity(TV_circ) and the % of the area of the minimal boundingcircle that was filled by the plant (TV_fill). The architecturetraits from the pictures in side view (SV) used were the plantarea (SV_pl_ar), the plant height and width (SV_he and SV_wi,respectively) and the % of the area of the bounding rectanglethat was filled by the plant (SV_fill). The graphs were made inR (version 3.2.0) using the prcomp function and plotted with theggbiplot function, with ellipses drawn with a probability of 0.95(R Core Team, 2015).
RESULTS
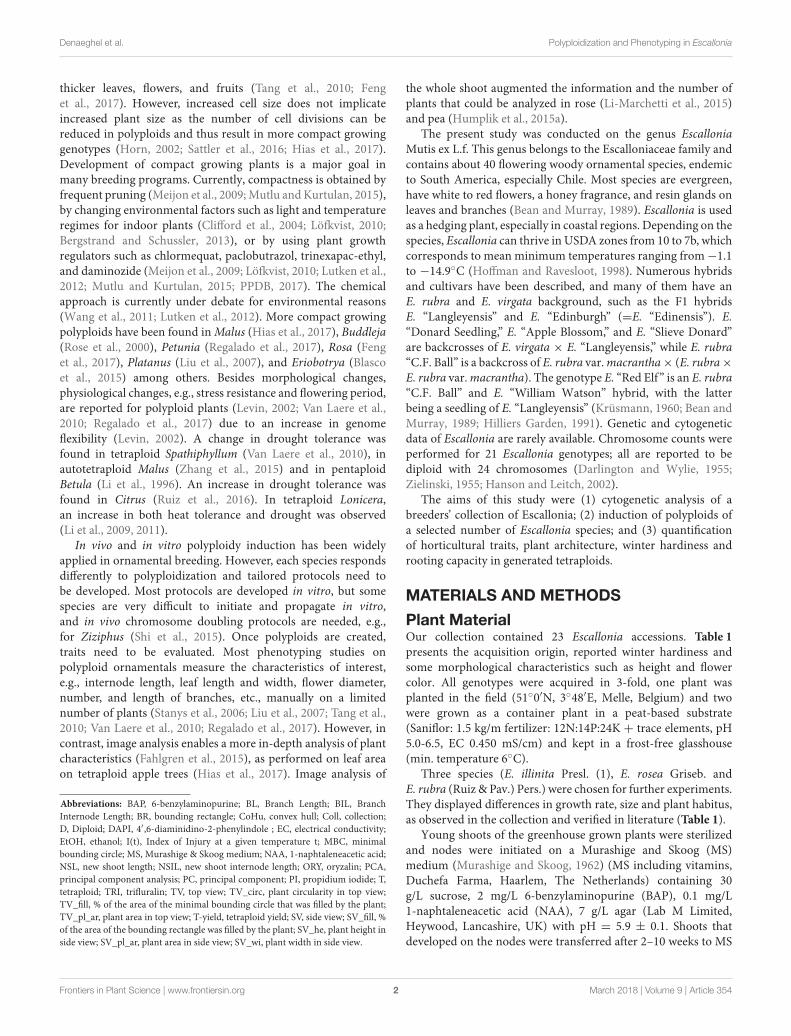
Characterization of the CollectionIn the collection, 22 genotypes were diploid with 24chromosomes. E. pendula was a tetraploid with 48 chromosomes(Table 1). Genome sizes ranged from 1.06 ± 0.02 pg/2C to1.43 ± 0.03 pg/2C for the diploid genotypes. The tetraploidE. pendula had a genome size of 2.17 ± 0.16 pg/2C. Based ona brief morphological characterization and comparison of thegenotypes in our collection with descriptions in botanical guides(Krüsmann, 1960; Bean and Murray, 1989; Hilliers Garden,1991), we observed differences in flower color between the twogenotypes of E. alpina and of E. illinita. The flower color ofE. alpina (2) and E. illinita (2) were as described in literature(Krüsmann, 1960; Bean and Murray, 1989; Hilliers Garden,1991). E. alpina (1) and E. illinita (1) had a deviating flowercolor. The flower color of E. rosea did not match the descriptions(Krüsmann, 1960; Bean and Murray, 1989; Hilliers Garden,1991). The phylogenetic tree resulting from the AFLP analysis(Figure 2) shows that the two E. illinita genotypes and the two E.alpina genotypes differed. E. pendula was most distant related tothe other Escallonia genotypes.
E. illinita (1), E. rosea, and E. rubra were chosen for furtherexperiments. E. illinita (1) is a tall (2–3m) shrub with a looseplant habitus comprised of long, arching branches. E. rosea is asmaller (1–1.5m), densely branched shrub. E. rubra is the tallestof the three species (up to 4.5m), but densely branched and
Frontiers in Plant Science | www.frontiersin.org 6 March 2018 | Volume 9 | Article 354
Denaeghel et al. Polyploidization and Phenotyping in Escallonia
FIGURE 2 | Phylogenetic tree of the collection of Escallonia species. AU,
Approximately Unbiased p-values, computed by multiscale bootstrap
resampling (red). BP, Bootstrap Probability value (green).
slower growing than E. illinita (1). Also based on AFLP data,these three species did not show a close relation (Figure 2).
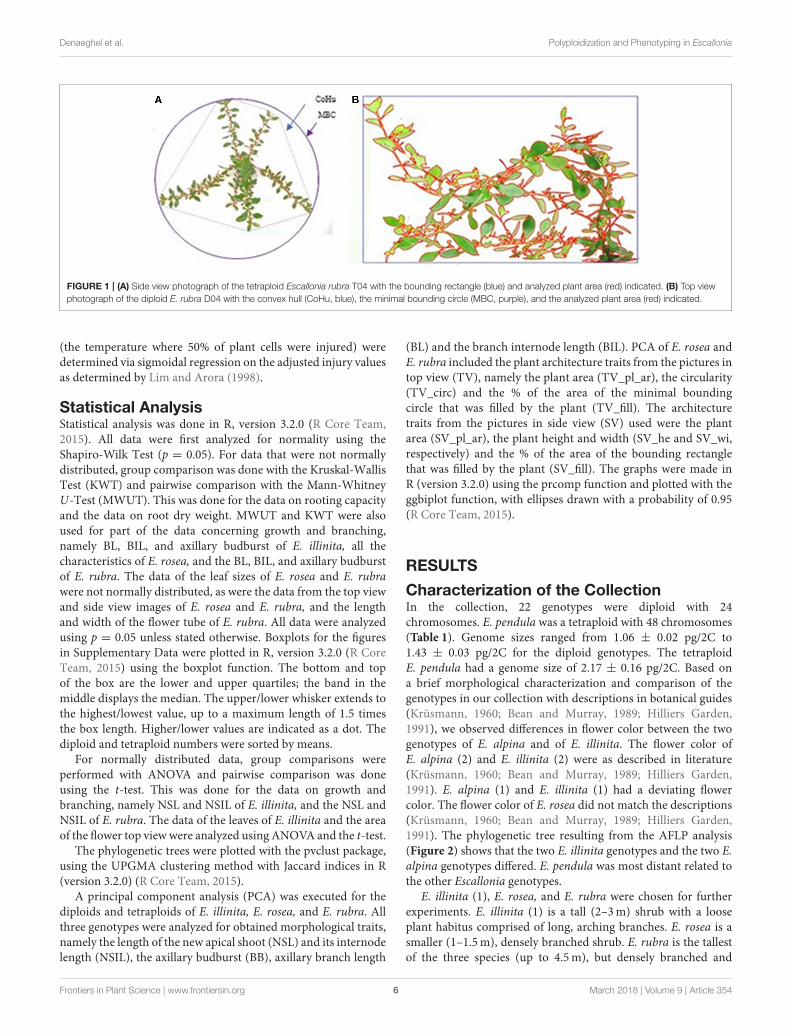
Chromosome DoublingShock TreatmentsThe tetraploid yield (T-yield, %) and the mortality (%) of theshock treatments are shown in Figures 3A,B. In E. illinita, onaverage a higher T-yield was reached with TRI (23.4%) than withORY (8.3%), and in E. rosea a higher mortality was observed withTRI (41.6%) compared to ORY (19.6%).
In ORY treatments, a positive correlation between T-yieldand concentration of ORY was found for all three genotypes,with an overall average from 5.5% up to 24.9% for 50µM and250µM, respectively. In TRI treatments T-yield reached a plateauat 50µM for E. rosea and E. rubra and at 150µM for E. illinita.An increase in exposure time caused a decrease in T-yield (onaverage from 21.4 to 6.8% for 2–4 days, respectively) and anincrease inmortality (on average from 6.8 to 30.2% for 2 to 4 days,respectively) in ORY treatments. Only for E. illinita, the effecton the mortality was reversed, with a small decrease in mortalityfrom 14.4 to 8.9%. In TRI treatments, the exposure time did notcause changes in T-yield and mortality.
The ORY treatment that yielded the best results for all threeEscallonia genotypes was 2 days of 250µM ORY, resulting in
a high T-yield (22.0–56.7%) and low corresponding mortality(0.0–4.9%). No best treatment for TRI could be identified, asall concentrations yielded the approximate same number oftetraploids. In the control treatment of E. rosea a limited numberof tetraploids and mixoploids were found.
Some octaploids were generated for E. illinita in thetreatments with 150µM TRI for 2, 3, and 4 days, and with150µM ORY for 2 and 4 days. One octaploid E. roseawas recovered after 4 days in the presence of 50µM TRI.The following treatments yielded one octaploid E. rubra: 4days of 150µM TRI, 2 days with 150µM ORY, and 3 dayswith 50µM TRI. Two octaploid E. rubra were recoveredafter 3 days with 250µM ORY. The percentage mixoploidsfor the shock experiments with ORY reached up to 33.3%,and with TRI up to 31.7%. No mixoploids were retainedfor further evaluation, since sufficient tetraploid plants wereavailable.
Continuous TreatmentsThe resulting T-yield and mortality of the continuous treatmentsare shown in Figures 3C,D. Differences between TRI andORY were observed. For all three species, TRI induced moretetraploids compared to ORY. This effect was most substantialin E. illinita (on average 5.5% T-yield with ORY, 32.3% with TRI).On average, ORY led to higher mortalities than TRI.
The T-yield reached a plateau at 5µMORY for E. rosea, and at1µM ORY for E. rubra. For E. illinita, the T-yield was positivelycorrelated with the concentration. The mortality of all threespecies increased with ORY concentrations (on average from 11.6to 38.7%). For TRI treatments, similar observations were madefor both T-yield and mortality. For E. rosea and E. rubra theplateau in T-yield was reached at 5µM TRI, while the T-yieldof E. illinita increased with the concentration. No clear effectof the exposure time on the T-yield and mortality was foundfor both ORY and TRI. E. rosea and E. rubra showed a smalldecline in T-yield with increasing exposure and a small increasein mortality.
In this continuous treatment experiment, a 10 week exposureof 5µM of TRI was the best treatment overall, despite species-dependent sensitivity toward the antimitotic agents used. ForE. rosea and E. rubra, this resulted in 43.5 and 54.2% tetraploids,respectively. For E. illinita, 10 weeks on 5µM of TRI resulted ina 63.4% T-yield, which was a close second to 8 weeks of 10µMwith a T-yield of 65.5%. The mortality of 10 weeks of 5µMTRI of all three species was 12.5% or lower. For ORY, the bestyielding treatment, or a close second best for E. rosea, was 8weeks with 1µM of ORY. However, the T-yield of the best ORYtreatment was much lower or similar to the T-yield in the bestTRI treatment.
Some continuous treatments yielded octaploids. One E. illinitaoctaploid was recovered after 10 weeks with 10µM TRI. ForE. rosea, all 10 and 6 week TRI treatments yielded a sum of10 octaploids. For E. rubra, the following treatments yielded 14octaploids together: 6 weeks of 1µM and 5µM ORY, 6 weeksof 1µM and 10µM TRI, 8 weeks of 5µM and 10µM TRIand 10 weeks of 5µM TRI. The percentage mixoploids for thecontinuous experiments with ORY reached up to 31.0%, and
Frontiers in Plant Science | www.frontiersin.org 7 March 2018 | Volume 9 | Article 354

Denaeghel et al. Polyploidization and Phenotyping in Escallonia
FIGURE 3 | Tetraploid yield (T-yield, %) and mortality for Escallonia illinita, E. rosea, and E. rubra in a shock experiment of 2, 3, and 4 days with 0 (control), 50, 150,
and 250µM of (A) oryzalin (ORY) or (B) trifluralin (TRI), and in a continuous experiment of 6, 8, and 10 weeks with 0 (control), 1, 5, and 10µM of oryzalin (ORY) (C)
and trifluralin (TRI) (D). Graphs plotted in R (version 3.2.0) (R Core Team, 2015).
with TRI up to 82.9%. No mixoploids were retained for furtherevaluation, since sufficient tetraploid plants were available.
In total, for both the shock and continuous experiments, 1,431nodes of E. illinita were treated with ORY or TRI, with 218tetraploid numbers created. For E. rosea, 195 tetraploids wereinduced on a total of 1,210 nodes, and for E. rubra, 221 tetraploidswere obtained on 932 nodes.
Characterization of the TetraploidsRooting CapacityThe rooting capacity after 5 weeks did not differ between thediploid and tetraploid group for any of the three species (Table 2).In addition, the root dry weight did not significantly differbetween diploids and tetraploids.
Morphological Traits
Growth and branchingFor all three species, much phenotypic variation for each trait waspresent within both the diploid control group and the tetraploidgroup. The individual numbers from the homoploid groupswere not always clearly separated: many diploid and tetraploidnumbers had an intermediary morphology (SupplementaryFigures 1–3). But when analyzing the average results, differenttrends could be observed (Table 3).
For E. illinita, the average length of the new apical shoot (NSL)did not differ significantly between diploids and tetraploids,yet its mean internode length (NSIL) increased significantly.In a further developed state (7 weeks later), tetraploids had asignificantly higher axillary budburst (+2.4%) on the main stemthan diploids. The presence of more branches in tetraploidscaused a significant decrease in average branch length. Theinternode length of the axillary branches (BIL) was alsosignificantly increased with ±0.1 cm in tetraploids, as was thecase for the NSIL. Thus, for E. illinita, the added variation createda tendency for shorter branches but longer internodes.
For E. rosea, on average the tetraploids reached abouthalf the length of diploids (Table 3). Both the NSL and theBL of tetraploids were significantly shorter. In addition, theinternode length was significantly shorter in tetraploids than indiploids for both the NSIL and the BIL. The diploid axillarybudburst decreased significantly by±8% due to polyploidization.Polyploidization resulted in a one-directional change towardsmaller and slower growing plants for E. rosea.
Tetraploids of E. rubrawere larger and faster growing than thediploid controls (Table 3). The NSL increased significantly with0.6 cm. The increase was smaller for BL (only±0.4 cm) but highlysignificant. NSIL and BIL increased significantly. The axillarybudburst of the diploid controls was significantly higher (5%)
Frontiers in Plant Science | www.frontiersin.org 8 March 2018 | Volume 9 | Article 354
Denaeghel et al. Polyploidization and Phenotyping in Escallonia
TABLE 2 | Rooting capacity and dry weight of cuttings of diploid (D) and tetraploid (T) E. illinita, E. rosea, and E. rubra.
Escallonia genotype Ploidy group Number of cuttings Repetitions Rooting (%) Root dry weight (mg)
E. illinita D 136 2 94.9NS 1.11 ± 0.96NS
T 126 2 96.1 1.06 ± 0.74
E. rosea D 194 4 78.9NS 0.56 ± 0.44NS
T 252 4 78.2 0.49 ± 0.31
E. rubra D 188 4 80.3NS 1.66 ± 2.71NS
T 192 4 79.2 1.84 ± 2.29
Statistical differences per genotype between diploids and tetraploids (MWUT, NS, not significant; S, significant at p = 0.05).
TABLE 3 | New apical shoot length (NSL) and its internode length (NSIL), axillary branch length (BL) and its internode length (BIL), and the axillary budburst (% of buds on
the main stem that sprouted) of E. illinita, E. rosea, and E. rubra diploid controls (D) and tetraploid numbers (T), measured on at least 4 four plantlets per plant number
(mean ± standard deviation).
Escallonia species Ploidy group Analyzed plant numbers NSL (cm) NSIL (cm) BL (cm) BIL (cm) Axillary budburst (%)
E. illinita D 6 11.0 ± 4.5NS 1.0 ± 0.2*** 23.6 ± 2.6* 1.4 ± 0.1* 15.6 ± 2.0**
T 23 11.4 ± 2.4 1.1 ± 0.2 20.1 ± 2.9 1.5 ± 0.1 18.0 ± 2.3
E. rosea D 4 3.8 ± 2.8*** 0.3 ± 0.1*** 6.8 ± 2.2*** 0.4 ± 0.1*** 93.1 ± 10.3**
T 6 1.3 ± 1.2 0.2 ± 0.2 3.4 ± 2.0 0.3 ± 0.1 85.1 ± 15.2
E. rubra D 16 4.9 ± 4.3* 0.4 ± 0.3*** 8.2 ± 2.1*** 0.6 ± 0.1*** 81.5 ± 17.0**
T 23 5.5 ± 3.9 0.5 ± 0.3 8.6 ± 2.0 0.7 ± 0.1 76.2 ± 16.7
Statistical analysis within the genotype between diploids and tetraploids with MWUT for pairwise comparison, except for NSL and NSIL of E. illinita and E. rubra, a T-test for pairwise
comparison was used. NS, Not significant; *p = 0.05; **p = 0.01; ***p = 0.001.
than of the tetraploid numbers. Therefore, it could be concludedthat polyploidization resulted in a one-sided broadening or thevariation present in the diploid group toward faster growing andtaller plants.
Leaf morphologyFor both E. illinita and E. rubra, chromosome doubling causedwider leaves and a larger leaf surface (Table 4). The leavesfrom tetraploid E. illinita numbers were significantly wider, butnot longer than the leaves of diploid controls. This resultedin a significant decrease in length/width ratio (l/w) and in asignificant increase in leaf surface of ±0.71 cm2. TetraploidE. rubra leaves were significantly wider (±0.51 cm), but notlonger than the leaves of diploids. This resulted in a significantdecrease in l/w and a significant increase in leaf surfaceof ±1.14 cm2. In contrast, E. rosea tetraploid leaves weresignificantly reduced in both leaf length and width, resulting ina significant decrease of ±0.27 cm2 in leaf surface. The decreasewas proportional for length and width, so no significant changesin l/w ratio were observed.
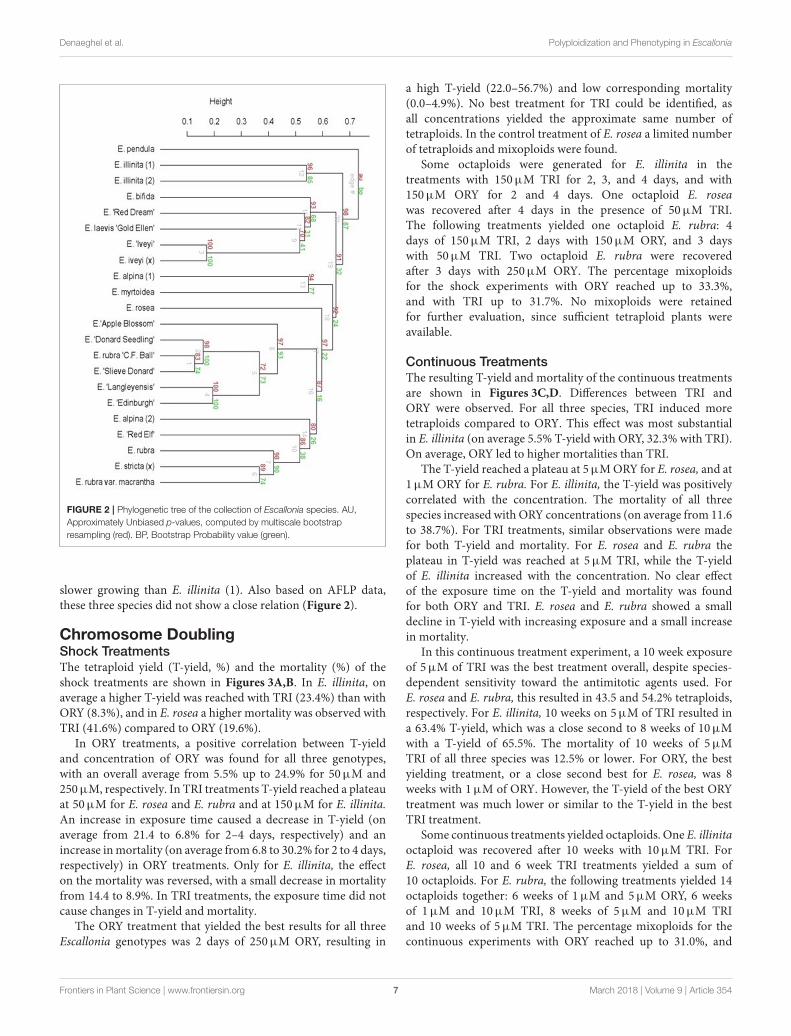
Flower characteristicsAt the time of this writing, tetraploid and diploid genotypes ofE. rosea and E. illinita have not flowered. The diploid controls(D), the plants in our collection (Coll) and the tetraploid numbers(T) of E. rubra started flowering by mid-June (Figure 4). Flowersfrom the diploid control plants were significantly shorter (D: 0.96± 0.06 cm; Coll: 0.99 ± 0.06 cm) and wider (D: 0.28 ± 0.03 cm;Coll: 0.27 ± 0.03 cm) than flowers from the genotype of E. rubrain the collection (p = 0.001 and 0.01 respectively). The corolla
surface (D: 0.31 ± 0.06 cm2; Coll: 0.30 ± 0.04 cm2) was notsignificantly different between diploid controls and the collectiongenotype. As shown in Figure 4, the flowers of the tetraploidgroup were significantly larger and wider than both the collectionand diploid flowers (T: 1.18 ± 0.11 cm long and 0.35 ± 0.03 cmwide) (p = 0.001). The corolla surface of the tetraploid flowers(0.47± 0.08 cm2) was significantly larger than the corolla surfaceof both the collection and diploid flowers (p= 0.001).
Plant ArchitectureThe results from the image analysis of E. rosea and E. rubra isshown in Table 5. The tetraploids of E. rosea were much smallerthan the diploids. The average plant area decreased significantlyby ±60% in top view and with ±33% in side view. The plantwidth and height of tetraploids decreased significantly. However,the percentage of the area the plant occupies in the boundingrectangle (BR) was significantly larger in tetraploids than indiploids. This was also shown by the percentage of the minimalbounding circle (MBC) filled by the plants, where tetraploidsfilled a significantly larger area. In addition, the circularity of thetetraploids was significantly larger than the diploids. These datashowed that the tetraploid numbers were not only smaller in area,height and width, but they were much denser and less spindlythan the diploids. The variation within individual diploids andtetraploids is shown in Supplementary Figure 4.
For E. rubra, the average plant area viewed from theside decreased significantly (±6%) in tetraploids compared todiploids (Table 5), due to a reduction in plant width of ±14%.The plant height and plant area in top view did not change. Thecircularity of tetraploids was significantly lower than in diploids.
Frontiers in Plant Science | www.frontiersin.org 9 March 2018 | Volume 9 | Article 354

Denaeghel et al. Polyploidization and Phenotyping in Escallonia
TABLE 4 | Leaf length, width, length/width ratio (l/w), and leaf surface of diploid (D) and tetraploid (T) E. illinita, E. rosea, and E. rubra, collected on at least 4 four plantlets
per plant number (means ± standard deviation).
Escallonia genotype Ploidy group Analyzed plant numbers Number of leaves Length (cm) Width (cm) l/w ratio Leaf surface (cm2)
E. illinita D 6 390 4.17 ± 0.70NS 1.75 ± 0.31*** 2.40 ± 0.25*** 4.49 ± 1.32***
T 23 1,270 4.12 ± 0.83 2.10 ± 0.46 1.98 ± 0.24 5.20 ± 1.99
E. rosea D 4 180 2.55 ± 0.73** 0.92 ± 0.32** 2.92 ± 0.64NS 1.63 ± 0.88***
T 6 320 2.33 ± 0.66 0.85 ± 0.33 2.87 ± 0.60 1.36 ± 0.82
E. rubra D 16 450 4.27 ± 0.83NS 1.70 ± 0.35*** 2.53 ± 0.36*** 4.80 ± 1.80***
T 23 1,259 4.26 ± 0.81 2.21 ± 0.47 1.96 ± 0.25 5.94 ± 2.14
Statistical analysis within the genotype between diploids and tetraploids (NS, Not significant; **p = 0.01; ***p = 0.001. Pairwise comparison with the Mann-Whitney U-Test for E. rosea
and E. rubra, T-Test for E. illinita.
FIGURE 4 | Side view and top view of flowers of E. rubra from the plant in our
collection (Coll), from the diploid controls (D), and the tetraploid numbers (T) in
the field. (bar = 1 cm).
The percentage in which the area of theMBC and the BR are filledby the plants both increase significantly.
PCA of the Phenotyping TraitsPCA of E. rosea on 12 traits could be reduced to 2 PCs, explaining85.0% of the variation (Figure 5). PC1 was mostly determined bythe positively correlated SV_fill and TV_circ (0.897 and 0.856)and by the negatively correlated NSL, NSIL, BL, BIL, TV_pl_ar,SV_pl_ar, SV_he, and SV_wi (−0.822, −0.783, −0.979, −0.968,−0.980, −0.945, −0.885, and −0.962 respectively). The diploidand tetraploid group were mainly separated by BB and TV_fill.However, if we do not take the deviating phenotypes of T03 andD02 into account, than any of the used traits could be used asgroup separators.
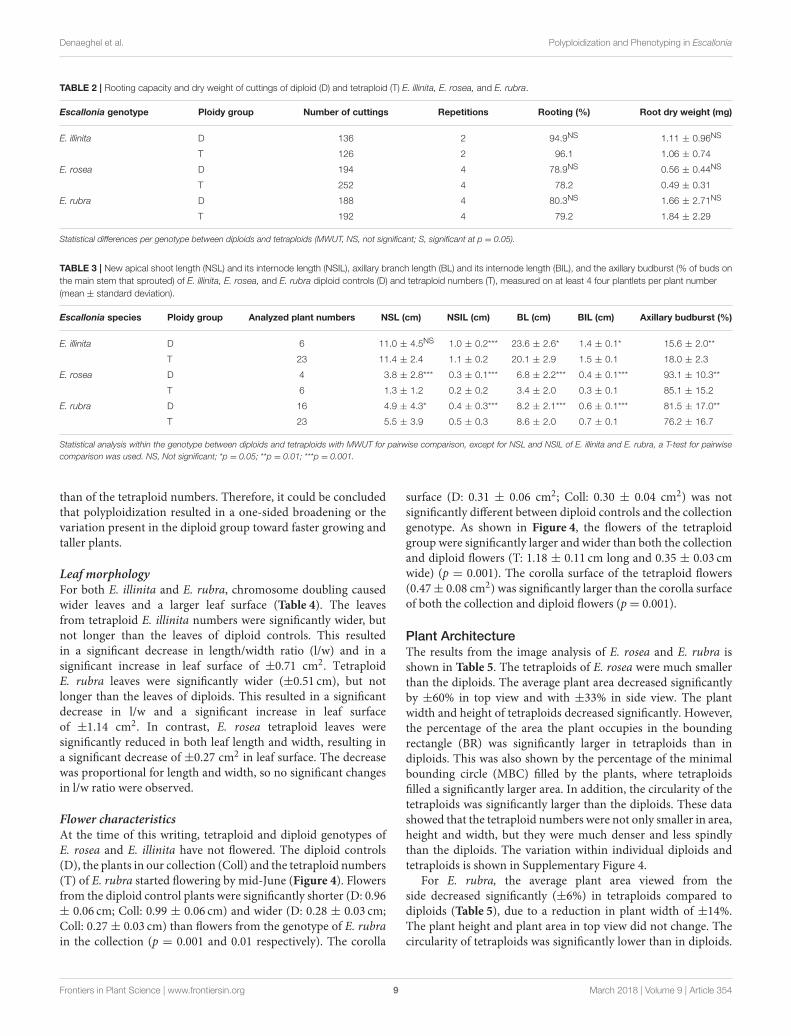
For E. rubra, five PCs had an eigenvalue higher than 1,which explains 84.5% of the variance between all the homoploidgroups. PC1 was positively correlated with SV_wi (0.730) andnegatively correlated with NSL, NSIL, and TV_fill (−0.673,−0.678, and −0.617 respectively). PC2 was mostly determinedby the positively correlated traits BL, BIL, TV_circ and TV_fill(0.636, 0.692, 0.667, and 0.628 respectively). In Figure 6A, aclear separation between diploids and tetraploids was made byTV_fill, TV_circ and SV_wi. PC3 was determined positively bySV_he (0.686) and negatively by SV_fill (−0.653). ComparingPC1 to PC3 (Figure 6B), group separation was mainly causedby SV_pl_ar and TV_pl_ar, and to a minor extent by SV_wiand BL. The most distinguishing trait to determine PC4 was thepositively correlated SV_he (0.621) and for PC5 BIL (−0.525)and SV_pl_ar (0.563). Although PC4 and PC5 explained 11.9
and 10.5% of the variance, respectively, no separation wasmade between the diploid and the tetraploid group with thesecomponents.
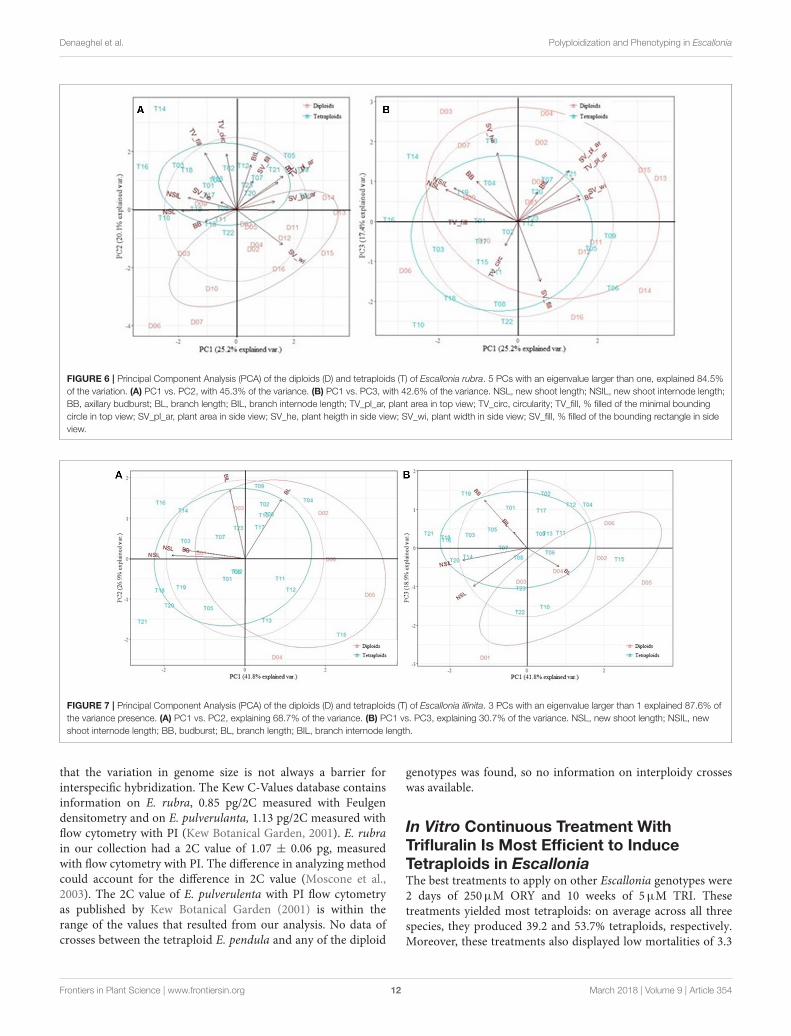
The PCA analysis on E. illinita was conducted for fivemorphological traits, namely NSL, NSIL, BL, BIL, and BB.Three principal components had an eigenvalue larger thanone, explaining 87.6% of the variance present (Figure 7). PC1was mostly determined by the negatively correlated NSL,NSIL, and BB (−0.730, −0.925, and −0.611 respectively);traits explaining PC 2 were BL and BIL (0.747 and 0.877,respectively). PC3 was determined mostly by one trait, namelyBB (0.681). As shown in Figure 7A, separation between thediploid and tetraploid group by comparing PC1 and PC2was mainly caused by NSL and NSIL and to a lesseramount by BB. When comparing PC1 and PC3 (Figure 7B),group separation was caused by BB, and only marginally byBIL and BL.
Cold ToleranceThe index of injury for E. rosea and E. rubra for the analyzedtemperatures are shown in Figure 8. For E. rosea, 1 diploid(D02) and 2 tetraploids (T03 and T05) were analyzed inthe controlled freezing test (Figure 8A). Polyploidization hadno effect on the calculated LT50: −15.1 and −13.8◦C forT03 and T05, respectively, compared to −14.6◦C for thediploid D02.
In contrast to E. rosea, a positive effect of polyploidizationon cold tolerance was observed in E. rubra. The LT50 for T05of E. rubra was significantly lower compared to D02, namely−11.8◦C vs.−7.7◦C, respectively (Figure 8B).
DISCUSSION
Morphological and Genetic VariationWithin the Escallonia CollectionCorrect identification of available germplasm and knowledgeon phylogenetic relatedness between different accessions areimportant for plant breeding. The accessions were verified usingmorphological descriptions, AFLP analysis and (cyto)geneticinformation. The phylogenetic tree (Figure 2) showed that E.pendula was the most distantly related species. This concurs withthe results of Sede et al. (2013), who created a phylogenetictree of Escallonia spp. using plastid DNA. E. pendula was also
Frontiers in Plant Science | www.frontiersin.org 10 March 2018 | Volume 9 | Article 354

Denaeghel et al. Polyploidization and Phenotyping in Escallonia
TABLE 5 | Plant area, circularity of the convex hull and the % filled by the plant in the minimal bounding circle (MBC) from the overhead images, and the plant area, width,
height, and the % of the bounding rectangle (BR) filled by the plant from the side view images, measured on at least 4 plantlets per number (mean ± standard deviation).
Escallonia
species
Ploidy
group
Analyzed plant
numbers
Top view Side view
Plant area (cm2) Circularitya % of MBC filled Plant area (cm2) Plant width (cm) Plant height (cm) % of BR filled
E. rosea D 4 319.1 ± 141.4*** 0.76 ± 0.08** 12.6 ± 4.7*** 136.5 ± 59.0*** 47.7 ± 15.2*** 16.6 ± 8.5** 18.6 ± 4.4***
T 6 129.7 ± 102.1 0.81 ± 0.07 24.5 ± 8.7 91.7 ± 48.7 29.0 ± 12.1 12.5 ± 5.2 26.3 ± 6.2
E. rubra D 16 394.1 ± 110.7NS 0.75 ± 0.09*** 12.1 ± 3.3*** 191.0 ± 54.6* 58.2 ± 14.5*** 21.0 ± 8.8NS 17.9 ± 6.0*
T 23 371.5 ± 86.8 0.46 ± 0.08 15.0 ± 4.8 180.4 ± 49.2 50.1 ± 13.3 20.8 ± 7.8 19.5 ± 6.5
Statistical analysis within the genotype between diploids and tetraploids with MWUT for pairwise comparison. NS, Not significant; *p = 0.05; **p = 0.01; ***p = 0.001.aCircularity= 4 * π * area of convex hull/(perimeter of convex hull)2.
FIGURE 5 | Principal Component Analysis (PCA) of the diploids (D) and tetraploids (T) of Escallonia rosea. 2 PCs with an eigenvalue higher than one, explained 85.0%
of the variation. NSL, new shoot length; NSIL, new shoot internode length; BB, axillary budburst; BL, branch length; BIL, branch internode length; TV_pl_ar, plant area
in top view; TV_circ, circularity; TV_fill, % filled of the minimal bounding circle in top view; SV_pl_ar, plant area in side view; SV_he, plant height in side view, SV_wi,
plant width in side view; SV_fill, % filled of the bounding rectangle in side view.
the only tetraploid species. Several genotypes with the samename from different accession sites displayed differences inmorphology. Based on morphological descriptions E. alpina (2)from the Tree Nursury of Rein and Mark Bulk (BRMB, Boskoop,The Netherlands) was a true E. alpina (Krüsmann, 1960; Beanand Murray, 1989; Hilliers Garden, 1991), while E. alpina (1)from Hillier Garden (HG, Ampfield, United Kingdom) had adeviating flower color (white instead of red). E. illinita (2) fromthe Botanical Garden from the University of Vienna (BGUW,Vienna, Austria) was a true E. illinita, because the genotypeconcurred best with the description in literature (Krüsmann,1960; Bean and Murray, 1989; Hilliers Garden, 1991). E. illinita(1) from Tree Nursery De Neve (DN, Oosterzele, Belgium)resembles the phenotype of E. illinita (2) very closely, except forthe flower color, which is pink instead of white, which mightbe the result of a natural hybridization or a mutation. Thegenotypes E. “Iveyi” and E. iveyi (x) [=(E. rosea × E. rubra)× E. bifida] (Krüsmann, 1960; Bean and Murray, 1989; Hilliers
Garden, 1991) were most likely the same genotype from adifferent acquisition site from Tree Nursery De Neve (DN,Oosterzele, Belgium) and the Botanical Garden Meise (Meise,Belgium) respectively, since they clustered very closely together(Figure 2).
Many natural Escallonia hybrid cultivars are described,indicating an easy interspecific hybridization. Data ofchromosome counts showed that all but one species have24 chromosomes. Diploid genome sizes varied between 1.06 ±
0.02 pg/2C for E. “Langleyensis” and 1.43 ± 0.03 pg/2C for E.bifida. No information was found about crosses between theselatter two species. However, E. “Iveyi” [or E. iveyi (x)] is a hybridof [=(E. rosea × E. rubra) × E. bifida], and the genome sizes ofE. rosea and E. rubra were also rather small (1.11 ± 0.06pg/2Cand 1.07 ± 0.06 pg/2C respectively), while the genome sizeof E. bifida is about 30% bigger. The hybrid E. “Iveyi” and E.iveyi (x) had 2C values of 1.32 ± 0.16 and 1.25 ± 0.03 pg/2C,respectively, in between the parental genome sizes. This indicates
Frontiers in Plant Science | www.frontiersin.org 11 March 2018 | Volume 9 | Article 354
Denaeghel et al. Polyploidization and Phenotyping in Escallonia
FIGURE 6 | Principal Component Analysis (PCA) of the diploids (D) and tetraploids (T) of Escallonia rubra. 5 PCs with an eigenvalue larger than one, explained 84.5%
of the variation. (A) PC1 vs. PC2, with 45.3% of the variance. (B) PC1 vs. PC3, with 42.6% of the variance. NSL, new shoot length; NSIL, new shoot internode length;
BB, axillary budburst; BL, branch length; BIL, branch internode length; TV_pl_ar, plant area in top view; TV_circ, circularity; TV_fill, % filled of the minimal bounding
circle in top view; SV_pl_ar, plant area in side view; SV_he, plant heigth in side view; SV_wi, plant width in side view; SV_fill, % filled of the bounding rectangle in side
view.
FIGURE 7 | Principal Component Analysis (PCA) of the diploids (D) and tetraploids (T) of Escallonia illinita. 3 PCs with an eigenvalue larger than 1 explained 87.6% of
the variance presence. (A) PC1 vs. PC2, explaining 68.7% of the variance. (B) PC1 vs. PC3, explaining 30.7% of the variance. NSL, new shoot length; NSIL, new
shoot internode length; BB, budburst; BL, branch length; BIL, branch internode length.
that the variation in genome size is not always a barrier forinterspecific hybridization. The Kew C-Values database containsinformation on E. rubra, 0.85 pg/2C measured with Feulgendensitometry and on E. pulverulanta, 1.13 pg/2C measured withflow cytometry with PI (Kew Botanical Garden, 2001). E. rubrain our collection had a 2C value of 1.07 ± 0.06 pg, measuredwith flow cytometry with PI. The difference in analyzing methodcould account for the difference in 2C value (Moscone et al.,2003). The 2C value of E. pulverulenta with PI flow cytometryas published by Kew Botanical Garden (2001) is within therange of the values that resulted from our analysis. No data ofcrosses between the tetraploid E. pendula and any of the diploid
genotypes was found, so no information on interploidy crosseswas available.
In Vitro Continuous Treatment WithTrifluralin Is Most Efficient to InduceTetraploids in EscalloniaThe best treatments to apply on other Escallonia genotypes were2 days of 250µM ORY and 10 weeks of 5µM TRI. Thesetreatments yielded most tetraploids: on average across all threespecies, they produced 39.2 and 53.7% tetraploids, respectively.Moreover, these treatments also displayed low mortalities of 3.3
Frontiers in Plant Science | www.frontiersin.org 12 March 2018 | Volume 9 | Article 354

Denaeghel et al. Polyploidization and Phenotyping in Escallonia
FIGURE 8 | The Index of injury [I(t)] of the controlled freezing test for (A) 1 diploid (D02) and 2 tetraploid (T03 and T05) numbers of E. rosea. and (B) 1 diploid (D02)
and 1 tetraploid (T05) number of E. rubra, with the calculated LT50 values.
and 5.6%, respectively. Compared to similar studies (Dhoogheet al., 2011), the chosen polyploidization treatments were highlyefficient with low mortalities. In mandarins, a submersion ofshoot tips in a colchicine solution yielded no tetraploids, and onlyin some cases a few chimeras (2x-4x), while themortalities rangedbetween 20 and 100% (Aleza et al., 2009). A shock treatment withoryzalin on nodal segments of Rosa rugosa showed mortalitiesbetween 25 and 80%, but a tetraploid yield of 44% was reached(Allum et al., 2007). Nodal segments of Rosa “Thérèse Bugnet”were exposed to 5µM of oryzalin on solid medium for 1–3 days.A tetraploid yield of 67% was reached, but with high mortalitiesof 80–100% (Kermani et al., 2003).
In all shock treatments, the mortality was erratic and quitehigh, even in control treatments, indicating a high stress levelcaused by the shaking treatment and the addition of EtOH oracetone as solvents for ORY and TRI. As a consequence ofthat stress, several tetraploids and mixoploids were recovered inthe control treatment of E. rosea. High stress levels can causeendopolyploidy or endoreduplication (Barrow and Jovtchev,2007). Spontaneous induction of polyploid plants during in vitroregeneration has also been reported in Phalaenopsis (Chen et al.,2009) and in Gentiana (Tomiczak et al., 2015). Given that thestress induced by the shock treatment caused great variation inmortality, we could conclude that the continuous treatment wasmost stable.
Octaploid Escallonia were recovered in all three species andfor both mitotic agents from several treatments. Trifluralininduced more octaploids compared to oryzalin: in total, 1.7and 0.5%, respectively, or 29 and 9 octaploids for all threespecies across all experiments. Long exposure times can lead toa redoubling to produce octaploids (Allum et al., 2007; Dhoogheet al., 2011). However, no octaploids could be acclimatized dueto poor viability and lack of growth vigor. This unfavorable effectof higher ploidy levels has also been observed in octaploid Rosarugosa hybrids (Allum et al., 2007).
Differences in T-yield and mortality were observed betweenORY and TRI, while these mitotic inhibitors have the same modeof action (Dhooghe et al., 2011). A preliminary study with E. roseaand E. rubra showed a very low T-yield with colchicine comparedto ORY and TRI, even though 10x higher concentrations ofcolchicine were used (Denaeghel et al., 2015). Colchicine, ORY,and TRI are all metaphase inhibitors. They disturb the formationof the spindle, which is essential for polar migration of thehomologous chromosomes to the daughter cells (Dewitte andMurray, 2003). The difference in T-yield when using differentmitotic inhibitors might be due to differences between theantimitotica in solubility, in penetration or transportation inthe plant tissue, but also in sensitivity among the Escalloniagenotypes.
Changes in Plant Morphology andPhysiology After PolyploidizationThree Escallonia species were polyploidized, and speciesdependent effects on the plant growth and architecture wereobserved. Our results indicate that no phenotypic predictionson the outcome of a polyploidization experiment can bemade, as every species has to be evaluated separately. Thisinteraction between genetic background and ploidy level was alsodemonstrated by Riddle et al. (2006) who studied the effect ofpolyploidization on the phenotype of 1x, 2x, and 4x plants of fourZea mays cultivars.
Plant architecture determines the visual attractiveness, animportant criterion for the commercial success of ornamentalplants (Li-Marchetti et al., 2015). The architecture of a plantconsists of the relative arrangement of each of its parts. Fourmajor categories can be distinguished: (1) branching process, (2)growth process, (3) the morphological differentiation of axes,and (4) the position of reproductive structures (Barthelemy andCaraglio, 2007). In the present study the branching process
Frontiers in Plant Science | www.frontiersin.org 13 March 2018 | Volume 9 | Article 354

Denaeghel et al. Polyploidization and Phenotyping in Escallonia
and growth process were analyzed for tetraploid and diploidEscallonia genotypes.
An increased budburst or axillary branching on the main stemwas obtained in tetraploid E. illinita, while both E. rubra andE. rosea displayed a decrease in axillary budburst in tetraploids.The branching is controlled by the apical dominance, whilethe shoot apex controls the outgrowth of axillary buds (Cline,1994). Several hypotheses attempt to explain branching controlby apical dominance, but a common factor appears to be thelevels of auxin and cytokinin, or the sensitivity of the plant tissuestoward these hormones (Dun et al., 2006). If polyploidizationinfluences the production, transport or sensitivity toward auxinor cytokinin, changes in apical dominance can occur. A lowerapical dominance leads to a higher axillary budburst and morebranches, i.e., a higher number of nutrient sinks. The sameamount of nutrients that normally would go to the outgrowthof the apical shoot is divided among the branches, leading to aslower growth of each of the branches compared to the apicalshoot (Dun et al., 2006). This process is applied artificially bygrowers of ornamentals by frequent mechanical or chemicalpruning, or by applying plant hormones exogenously (Meijonet al., 2009; Mutlu and Kurtulan, 2015). To analyze the growthprocess, the primary growth of the rooted cutting and theoutgrowth of axillary branches after pinching were measuredand the internodal distance was determined. Clearly, both resultsof branching and internode length were necessary to interpretthe effect on the overall plant size. The increase in axillarybudburst for tetraploid E. illinita could potentially cause more,shorter branches to grow. However, an increased internodelength reduced the effect of the increased axillary budburst onthe compactness, resulting in only slightly shorter branches.The combination of a decrease in both axillary budburst andinternode length led to a large decrease in size and plant areain tetraploid E. rosea. A decrease in plant height by reducinginternode length after polyploidization was also observed ingarden petunia (Regalado et al., 2017), in Rosa multiflora (Fenget al., 2017), in Platanus (Liu et al., 2007), in Thymus (Tavan et al.,2015), and in Eriobotrya (Blasco et al., 2015). In tetraploid E.rubra, chromosome doubling caused both a significant increasein internode length and a decrease in axillary budburst. Theoverall effect was an increased plant size and a looser planthabitus, as shown by the decrease in circularity. A similar increasein plant size was found inVitex (Ari et al., 2015) and in some Rosagenotypes (Kermani et al., 2003).
Image analysis of E. rosea and E. rubra confirmed theeffects on plant habitus as determined by measuring on theplants themselves, and added some information regarding visualattractiveness, such as circularity and the bushiness. In E. rosea,where a significantly lower axillary budburst in tetraploids couldindicate less dense plants, the circularity and the % filled bythe plant of the MBC and the BR clearly showed more circularand dense plants. For E. rubra, the image analysis showed noincrease in size, except for plant width. The increase in the %of area of the MBC or BR that was filled by the plant, waslikely caused by an increase in leaf area. The large decreasein circularity was caused by a polar outgrowth of branches onthe main axis in tetraploids. This is not a desired characteristic
by growers or consumers. It is clear that the image analysisadds valuable information about the plant architecture thatcould not be derived from the measurements of plant height,internode length and axillary budburst. Traits such as plantarea and circularity would have been very difficult to determinecorrectly by means of visual scoring. This type of 2D imageanalysis has several advantages. It is non-invasive and couldbe repeated to analyze the growth dynamic over time (Fioraniand Schurr, 2013). Free, open-source software, such as ImageJ,is available to create a customized program for analysis. Thecorrect analysis of the plant area, however, can be biased byoverlapping or curling leaves when the image is taken fromonly one view (e.g., overhead view) (Humplik et al., 2015b).This was a problem with tetraploid E. rubra, where a decreasein plant width and axillary budburst should have resulted in adecreased plant area in top view, but was counteracted by anincreased leaf area. Therefore, side view images from differentangles were included. The efficiency of this image analysis couldbe optimized by determining the number of pictures in side viewnecessary to obtain the required information. A high-throughputphenotyping study on cereals and pea only included two side viewimages, rotated 90◦ vertically (Golzarian et al., 2011; Humpliket al., 2015a), which could reduce the time needed to take theimages.
A PCA was conducted on the traits resulting from the growthand branching analysis and the image analysis in order tofind the traits that are most important in discerning diploidsfrom tetraploids. For E. rosea, the homoploid groups couldbe separated by BB and TV_fill. However, two highly deviantphenotypes were present, namely D05 and T03. If these numberswere not present in the PCA, all traits analyzed could be used todiscern the homoploid groups. This indicates that for E. rosea,polyploidization causes changes in all morphological andarchitectural traits analyzed. For E. rubra, the most discerningtraits were TV_fill, TV_circ, SV_wi, SV_pl_ar and TV_pl_ar.Unfortunately, no image analysis was done for E. illinita, and thePCA was made with only the growth and branching parametersmeasured on the plantlets. In this case, NSL, NSIL and BB werediscerning traits. Globally, for each of the species, either BB orTV_fill is important, and only analyzing these two traits couldhelp in separating the homoploid groups if other ploidy detectionmethods, e.g., flow cytometry, are not available. However, thesetraits alone are not capable of determining the compactness ofthe plants.
In all analyzed genotypes, the tetraploids broadened thephenotypic variation that was already present in the originaldiploid phenotype (Supplementary Figures 1–5). A genome-dosage effect is considered as a major contributor to the addedvariation by polyploidization. However, this usually leads tomore intermediate phenotypes, and only for some alleles toextreme phenotypes (Osborn et al., 2003). This effect has mostlybeen studied on an evolutionary scale for natural auto- orallo-polyploids, and only occasionally in the first generation ofsynthetic autopolyploids.
Beside plant architecture, foliage and flower morphologyare important characteristics for visual attractiveness of anornamental. An increase in organ size is quite common after
Frontiers in Plant Science | www.frontiersin.org 14 March 2018 | Volume 9 | Article 354

Denaeghel et al. Polyploidization and Phenotyping in Escallonia
polyploidization (Dhooghe et al., 2011). The observed leafmorphology changes after polyploidization differed for the threeEscallonia genotypes. Tetraploid E. illinita and E. rubra showedwider leaves than diploids, thus a decrease in l/w ratio andincrease in leaf surface. An increase in leaf size due to in vitrochromosome doubling has been observed in Rosa (Allum et al.,2007; Feng et al., 2017) and in Vitex (Ari et al., 2015), and afterin vivo chromosome doubling in Ziziphus (Shi et al., 2015). Adecrease in l/w ratio was also observed in Spathiphyllum (VanLaere et al., 2010). A decrease in leaf area, as was the case forE. rosea, was similarly present in tetraploid apple (Hias et al.,2017) and in Buddleja globosa (Van Laere et al., 2011b). Flowersof E. rubra tetraploids were larger than flowers of the diploidcounterparts. An increase in flower size was reported for Rosa(Allum et al., 2007), Vitex (Ari et al., 2015), and Paulownia (Tanget al., 2010).
Rooting capacity, which is important for commercialpropagation, was not affected by polyploidization. A delay inrooting and a decreased root length has been reported previouslyin tetraploid Thymus (Tavan et al., 2015), but for Escallonia,this was not the case. Changes in stress resistance are often aconsequence of chromosome doubling (Levin, 2002; Van Laereet al., 2010; Regalado et al., 2017). Since winter hardiness is anissue for Escallonia breeders, a cold tolerance test was conducted.Polyploidization did not have a negative effect on the coldtolerance of the tetraploids, and even an increase in cold tolerancewas measured for tetraploid E. rubra. According to Hoffman andRavesloot (1998) E. rubra can survive up to −12.2◦C. However,this manual on nursery plants does not indicate how this value isachieved, and no further literature has been found. For E. rosea,no data on winter hardiness could be found, therefore our datacould not be compared to literature.
GENERAL CONCLUSIONS
In this study, an efficient polyploidization protocol for the studiedEscallonia species was set up, and tetraploids were characterizedfor their morphological traits and plant architecture. For both
E. illinita and E. rosea, more compact phenotypes were obtained,but further field evaluations are needed to evaluate largerplants. In addition, both rooting and cold tolerance for thetetraploids scored at least as good as the original diploidgenotypes. Therefore, we conclude that polyploidization is anefficient breeding tool to induce useful variation in Escallonia.The results of the image analysis added valuable information onthe compactness and visual attractiveness of the plants, whichwould be hard to quantify with the standard morphologicalmeasurements such as shoot length and number of branches.
AUTHOR CONTRIBUTIONS
Study conception and design: HD, KV, LL, PL, JV, and M-CV.Acquisition of data: HD. Analysis and interpretation of data: HD,KV, LL, PL, and M-CV. Drafting of manuscript: HD and KV.Critical revision: KV, LL, JV, and M-CV.
ACKNOWLEDGMENTS
The authors thank BestSelect CVBA for their financial support.We gratefully acknowledge the botanical gardens (BotanicalGarden Meise, Royal Botanical Garden Edinburgh, HillierGardens, Botanischer Garten Universität Wien, HortusBotanicus Amsterdam, and Hof Ter Saksen Beveren) forthe plant material. We thank the lab staff of ILVO AppliedGenetics and Breeding and Lin Ouyang of the Ghent UniversityDepartment of Plant Production for their technical assistanceduring the experiments. We also acknowledge the ILVO fieldstaff for their care of the collection, the plants on the field and inthe greenhouse. We thank Dr. ir. Jan De Riek for composing thePCA and subsequent interpretation.
SUPPLEMENTARY MATERIAL
The Supplementary Material for this article can be foundonline at: https://www.frontiersin.org/articles/10.3389/fpls.2018.00354/full#supplementary-material
REFERENCES
Abramoff, M. D., Magalhaes, P. J., and Ram, S. J. (2004). Image processing withImageJ. Biophotonics Int. 11, 36–42.
Aleza, P., Juarez, J., Ollitrault, P., and Navarro, L. (2009). Production of tetraploidplants of non apomictic citrus genotypes. Plant Cell Rep. 28, 1837–1846.doi: 10.1007/s00299-009-0783-2
Allum, J. F., Bringloe, D. H., and Roberts, A. V. (2007). Chromosome doubling in aRosa rugosa Thunb. hybrid by exposure of in vitro nodes to oryzalin: the effectsof node length, oryzalin concentration and exposure time. Plant Cell Rep. 26,1977–1984. doi: 10.1007/s00299-007-0411-y
Ari, E., Djapo, H., Mutlu, N., Gurbuz, E., and Karaguzel, O. (2015). Creationof variation through gamma irradiation and polyploidization in Vitex agnus-
castus L. Sci. Hortic. 195, 74–81. doi: 10.1016/j.scienta.2015.08.039Barrow, M., and Jovtchev, G. (2007). “Endoploidy in plants and its analysis by flow
cytometry,” in Flow Cytometry with Plant Cells, eds J. Dolezel, J. Greilhuber andJ. Suda (Weinheim: Wiley), 349–372.
Barthelemy, D., and Caraglio, Y. (2007). Plant architecture: a dynamic, multileveland comprehensive approach to plant form, structure and ontogeny. Ann. Bot.99, 375–407. doi: 10.1093/aob/mcl260
Bean, W. J., and Murray, J. (1989). Trees and Shrubs Hardy in the British Isles.
London: Butler & Tanner Ltd.Bergstrand, K. J., and Schussler, H. K. (2013). Growth, development and
photosynthesis of some horticultural plants as affected by differentsupplementary lighting technologies. Eur. J. Hortic. Sci. 78, 119–125.doi: 10.17660/eJHS.2016/81.5.1
Blasco, M., Badenes, M. L., and Naval, M. D. (2015). Colchicine-inducedpolyploidy in loquat (Eriobotrya japonica (Thunb.) Lindl.). Plant Cell TissueOrgan Cult. 120, 453–461. doi: 10.1007/s11240-014-0612-3
Chen, W. H., Tang, C. Y., and Kao, Y. L. (2009). Ploidy doubling by in vitro cultureof excised protocorms or protocorm-like bodies in Phalaenopsis species. PlantCell Tissue Organ Cult. 98, 229–238. doi: 10.1007/s11240-009-9557-3
Clifford, S. C., Runkle, E. S., Langton, F. A., Mead, A., Foster, S. A., Pearson, S., et al.(2004). Height control of Poinsettia using photoselective filters.HortScience 39,383–387.
Cline, M. G. (1994). The role of hormones in apical dominance. New approachesto an old problem in plant development. Physiol. Plant 90, 230–237.doi: 10.1111/j.1399-3054.1994.tb02216.x
Darlington, C. D., and Wylie, A. P. (1955). Chromosome Atlas of Flowering Plants.Aberdeen: The University Press.
Frontiers in Plant Science | www.frontiersin.org 15 March 2018 | Volume 9 | Article 354
Denaeghel et al. Polyploidization and Phenotyping in Escallonia
Denaeghel, H., Van Laere, K., Leus, L., van Huylenbroeck, J., and van Labeke, M. C.(2015). Induction of tetraploids in Escallonia spp. Acta Hortic. 1087, 453–458.doi: 10.17660/ActaHortic.2015.1087.61
Dewitte, W., and Murray, J. A. (2003). The plant cell cycle. Annu. Rev. Plant Biol.54, 235–264. doi: 10.1146/annurev.arplant.54.031902.134836
Dhooghe, E., Van Laere, K., Eeckhaut, T., Leus, L., and Van Huylenbroeck, J.(2011). Mitotic chromosome doubling of plant tissues in vitro. Plant Cell TissueOrgan Cult. 104, 359–373. doi: 10.1007/s11240-010-9786-5
Dolezel, J., Sgorbati, S., and Lucretti, S. (1992). Comparison of three DNAfluorochromes for flow cytometric estimation of nuclear DNA content inplants. Physiol. Plant. 85, 625–636. doi: 10.1111/j.1399-3054.1992.tb04764.x
Doyle, J. J., and Doyle, J. L. (1987). A rapid DNA isolation procedure for smallquantities of fresh leaf tissue. Phytochem. Bull. 19, 11–14.
Dun, E. A., Ferguson, B. J., and Beveridge, C. A. (2006). Apical dominance andshoot branching. Divergent opinions or divergent mechanisms? Plant Physiol.142, 812–819. doi: 10.1104/pp.106.086868
Fahlgren, N., Gehan, M. A., and Baxter, I. (2015). Lights, camera, action: high-throughput plant phenotyping is ready for a close-up. Curr. Opin. Plant Biol.24, 93–99. doi: 10.1016/j.pbi.2015.02.006
Feng, H., Wang, M. L., Cong, R. C., and Dai, S. L. (2017). Colchicine- andtrifluralin-mediated polyploidization of Rosa multiflora Thunb. var. inermisand Rosa roxburghii f. normalis. J. Hortic. Sci. Biotechnol. 92, 279–287.doi: 10.1080/14620316.2016.1249964
Fiorani, F., and Schurr, U. (2013). Future scenarios for plant phenotyping. Annu.Rev. Plant Biol. 64, 267–291. doi: 10.1146/annurev-arplant-050312-120137
Flint, H. L., Boyce, B. R., and Beattie, D. J. (1967). Index of injury-A usefulexpression of freezing injury to plant tissues as determined by the electrolyticmethod. Can. J. Plant Sci. 47, 229–230. doi: 10.4141/cjps67-043
Galbraith, D. W., Harkins, K. R., Maddox, J. M., Ayres, N. M., Sharma, D. P., andFiroozabady, E. (1983). Rapid flow cytometric analysis of the cell cycle in intactplant tissues. Science 220, 1049–1051. doi: 10.1126/science.220.4601.1049
Golzarian, M. R., Frick, R. A., Rajendran, K., Berger, B., Roy, S., Tester, M., et al.(2011). Accurate inference of shoot biomass from high-throughput images ofcereal plants. Plant Methods 7, 1–11. doi: 10.1186/1746-4811-7-2
Greilhuber, J., Dolezel, J., Lysak, M. A., and Bennett, M. D. (2005). Theorigin, evolution and proposed stabilization of the terms “genome size’and ’C-value’ to describe nuclear DNA contents. Ann. Bot. 95, 255–260.doi: 10.1093/aob/mci019
Hanson, L., and Leitch, I. J. (2002). DNA amounts for five pteridophyte speciesfill phylogenetic gaps in C-value data. Bot. J. Linn. Soc. 140, 169–173.doi: 10.1046/j.1095-8339.2002.00083.x
Hias, N., Leus, L., Davey, M. W., Vanderzande, S., Van Huylenbroeck,J., and Keulemans, J. (2017). Effect of polyploidization on morphologyin two apple (Malus x domestica) genotypes. Hortic. Sci. 44, 55–63.doi: 10.17221/7/2016-HORTSCI
Hilliers Garden (1991). The Hillier Manual of Trees and Shrubs. Melksham;Wiltshire: Redwood Press Ltd.
Hoffman, M. H. A., and Ravesloot, M. B. M. (1998). Winterhardheid van
Boomkwekerijgewassen. Boskoop: Praktijkonderzoek Plant &Omgeving, SectorBomen.
Horn, W. (2002). “Breeding methods and breeding research,” in Breeding for
Ornamentals: Classical and Molecular Approaches, ed A. Vainstein (Dordrecht:Kluwer Academic Publishers), 47–84.
Humplik, J. F., Lazar, D., Furst, T., Husickova, A., Hybl, M., and Spichal, L. (2015a).Automated integrative high-throughput phenotyping of plant shoots: a casestudy of the cold-tolerance of pea (Pisum sativum L.). Plant Methods 11:20.doi: 10.1186/s13007-015-0063-9
Humplik, J. F., Lazar, D., Husickova, A., and Spichal, L. (2015b). Automatedphenotyping of plant shoots using imaging methods for analysis of plantstress responses-a review. Plant Methods 11:29. doi: 10.1186/s13007-015-0072-8
Kermani, M. J., Sarasan, V., Roberts, A. V., Yokoya, K., Wentworth, J., and Sieber,V. K. (2003). Oryzalin-induced chromosome doubling in Rosa and its effecton plant morphology and pollen viability. Theor. Appl. Genet. 107, 1195–1200.doi: 10.1007/s00122-003-1374-1
Kew Botanical Garden (2001). Plant DNA C-Values Database. London: Board ofTrustees of the Royal Botanic Gardens, Kew.
Kirov, I., Divashuk, M., Van Laere, K., Soloviev, A., and Khrustaleva, L. (2014).An easy “SteamDrop” method for high quality plant chromosome preparation.Mol. Cytogenet. 7:21. doi: 10.1186/1755-8166-7-21
Kirov, I., Khrustaleva, L., Van Laere, K., Soloviev, A., Meeus, S., Romanov,D., et al. (2017). DRAWID: user-friendly java software for chromosomemeasurements and idiogram drawing. Comp. Cytogenet. 11, 747–757.doi: 10.3897/compcytogen.v11i4.20830
Krüsmann, G. (1960). “Handbüch der Laubgehölze in zwei Bänden,” in Handbüch
der Laubgehölze in zwei Bänden. (Berling, Germany: Paul Pary in Berlin andHamburg), 608.
Levin, D. A. (ed.) (2002). The Role of Chromosomal Change in Plant Evolution. NewYork, NY: Oxford University Press.
Li, W.-D., Biswas, D. K., Xu, H., Xu, C.-Q., Wang, X.-Z., Liu, J.-K., et al. (2009).Photosynthetic responses to chromosome doubling in relation to leaf anatomyin Lonicera japonica subjected to water stress. Funct. Plant Biol. 36, 783–792.doi: 10.1071/FP09022
Li, W. D., Hu, X., Liu, J. K., Jiang, G. M., Li, O., and Xing, D.(2011). Chromosome doubling can increase heat tolerance in Lonicera
japonica as indicated by chlorophyll fluorescence imaging. Biol. Plant. 55:6.doi: 10.1007/s10535-011-0039-1
Li, W.-L., Berlyn, G. P., and Ashton, P. M. S. (1996). Polyploids and their structuraland physiological characteristics relative to water deficit in Betula papyrifera.
Am. J. Bot. 83, 15–20. doi: 10.1002/j.1537-2197.1996.tb13869.xLi-Marchetti, C., Le Bras, C., Relion, D., Citerne, S., Huche-Thelier, L., Sakr,
S., et al. (2015). Genotypic differences in architectural and physiologicalresponses to water restriction in rose bush. Front. Plant Sci. 6:355.doi: 10.3389/fpls.2015.00355
Lim, C. C., and Arora, R. (1998). Comparing gompertz and richards functionsto estimate freezing injury in Rhododendron using electrolyte leakage. J. Am.
Hortic. Sci. 123, 246–252.Liu, G., Li, Z., and Bao, M. (2007). Colchicine-induced chromosome doubling in
Platanus acerifolia and its effect on plant morphology. Euphytica 157, 145–154.doi: 10.1007/s10681-007-9406-6
Löfkvist, K. (2010). Irrigation and Horticultural Practices in Ornamental
Greenhouse Production. Doctoral Thesis, Swedish University of AgriculturalSciences.
Lutken, H., Clarke, J. L., andMuller, R. (2012). Genetic engineering and sustainableproduction of ornamentals: current status and future directions. Plant Cell Rep.31, 1141–1157. doi: 10.1007/s00299-012-1265-5
Meijon, M., Rodriguez, R., Canal, M. J., and Feito, I. (2009). Improvement ofcompactness and floral quality in azalea bymeans of application of plant growthregulators. Sci. Hortic. 119, 169–176. doi: 10.1016/j.scienta.2008.07.023
Moscone, E. A., Baranyi, M., Ebert, I., Greilhuber, J., Ehrendorfer, F., andHunziker, A. T. (2003). Analysis of nuclear DNA content in Capsicum
(Solanaceae) by flow cytometry and Feulgen densitometry. Ann. Bot. 92, 21–29.doi: 10.1093/aob/mcg105
Mutlu, S. S., and Kurtulan, N. (2015). Trinexapac-ethyl modifies plantarchitecture of ornamental pepper. Eur. J. Hortic. Sci. 80, 280–287.doi: 10.17660/eJHS.2015/80.6.3
Murashige, T., and Skoog, F. (1962). A revised medium for rapid growthand bio essays with tobacco tissue cultures. Physiol. Plant. 15, 473–497.doi: 10.1111/j.1399-3054.1962.tb08052.x
Ögren, E., Nilsson, T., and Sundblad, L.-G. (1997). Relationship betweenrespiratory depletion of sugars and loss of cold hardiness in coniferousseedlings over-wintering at raised temperatures: indications of differentsensitivities of spruce and pine. Plant Cell Environ. 20, 247–254.doi: 10.1046/j.1365-3040.1997.d01-56.x
Osborn, T. C., Chris Pires, J., Birchler, J. A., Auger, D. L., Jeffery Chen, Z., Lee,H.-S., et al. (2003). Understanding mechanisms of novel gene expression inpolyploids. Trends Genet. 19, 141–147. doi: 10.1016/S0168-9525(03)00015-5
Otto, F. (1990). DAPI staining of fixed cells for high-resolutionflow cytometry of nuclear DNA. Methods Cell Biol. 33, 105–110.doi: 10.1016/S0091-679X(08)60516-6
PPDB (2017). Pesticide Properties DataBase. Hertfordshire: University ofHerfordshire (Accessed June, 06, 2017).
R Core Team (2015). R: A Language and Environment for Statistical Computing. Rversion 3.2.0 (2015-04-16)–“Full of Ingredients.” (Vienna).
Frontiers in Plant Science | www.frontiersin.org 16 March 2018 | Volume 9 | Article 354
Denaeghel et al. Polyploidization and Phenotyping in Escallonia
Regalado, J. J., Carmona-Martin, E., Querol, V., Velez, C. G., Encina,C. L., and Pitta-Alvarez, S. I. (2017). Production of compact petuniasthrough polyploidization. Plant Cell Tissue Organ Cult. 129, 61–71.doi: 10.1007/s11240-016-1156-5
Riddle, N. C., Kato, A., and Birchler, J. A. (2006). Genetic variation for theresponse to ploidy change in Zea mays L. Theor. Appl. Genet. 114, 101–111.doi: 10.1007/s00122-006-0414-z
Rose, J. B., Kubba, J., and Tobutt, K. R. (2000). Induction of tetraploidyin Buddleia globosa. Plant Cell Tissue Organ Cult. 63, 121–125.doi: 10.1023/A:1006434803003
Ruiz, M., Quinones, A., Martinez-Alcantara, B., Aleza, P., Morillon, R., Navarro, L.,et al. (2016). Tetraploidy enhances boron-excess tolerance in carrizo citrange(Citrus sinensis L. Osb. x Poncirus trifoliata L. Raf.). Front Plant Sci. 7:701.doi: 10.3389/fpls.2016.00701
Sattler, M. C., Carvalho, C. R., and Clarindo, W. R. (2016). Thepolyploidy and its key role in plant breeding. Planta 243, 281–296.doi: 10.1007/s00425-015-2450-x
Sede, S. M., Dürnhöfer, S. I., Morello, S., and Zapata, F. (2013). Phylogenetics ofEscallonia (Escalloniaceae) based on plastid DNA sequence data. Bot. J. Linn.Soc. 173, 442–451. doi: 10.1111/boj.12091
Shi, Q. H., Liu, P., Liu, M. J., Wang, J. R., and Xu, J. (2015). A novel method forrapid in vivo induction of homogeneous polyploids via calluses in a woodyfruit tree (Ziziphus jujuba Mill.). Plant Cell Tissue Organ Cult. 121, 423–433.doi: 10.1007/s11240-015-0713-7
Stanys, V., Weckman, A., Staniene, G., and Duchovskis, P. (2006). In
vitro induction of polyploidy in japanese quince (Chaenomeles japonica).Plant Cell Tissue Organ Cult. 84, 263–268. doi: 10.1007/s11240-005-9029-3
Tang, Z. Q., Chen, D. L., Song, Z. J., He, Y. C., and Cai, D. T. (2010). In vitro
induction and identification of tetraploid plants of Paulownia tomentosa. PlantCell Tissue Organ Cult. 102, 213–220. doi: 10.1007/s11240-010-9724-6
Tavan, M., Mirjalili, M. H., and Karimzadeh, G. (2015). In vitro polyploidyinduction: changes in morphological, anatomical and phytochemicalcharacteristics of Thymus persicus (Lamiaceae). Plant Cell Tissue Organ
Cult. 122, 573–583. doi: 10.1007/s11240-015-0789-0
Tomiczak, K., Mikula, A., Slewinska, E., and Rybczynski, J. J. (2015).Autotetraploid plant regeneration by indirect somatic embryogenesis from leafmesophyll protoplasts of diploid Gentiana decumbens L.f. In Vitro Cell. Dev.
Biol,. Plant 51:10. doi: 10.1007/s11627-015-9674-0Van Laere, K., França, S. C., Vansteenkiste, H., Van Huylenbroeck, J., Steppe, K.,
and Van Labeke, M.-C. (2010). Influence of ploidy level onmorphology, growthand drought susceptibility in Spathiphyllum wallisii. Acta Physiol. Plant. 33,1149–1156. doi: 10.1007/s11738-010-0643-2
Van Laere, K., Hermans, D., Leus, L., and Van Huylenbroeck, J. (2011a).Genetic relationships in European and Asiatic Buxus species based on AFLPmarkers, genome sizes and chromosome numbers. Plant Syst. Evol. 293, 1–11.doi: 10.1007/s00606-011-0422-6
Van Laere, K., Van Huylenbroeck, J., and Van Bockstaele, E. (2011b). Introgressionof yellow flower colour in Buddleja davidii by means of polyploidisation andinterspecific hybridisation. Hortic. Sci. 38:8. doi: 10.17221/61/2011-HORTSCI
Wang, K. S., Lu, C. Y., and Chang, S. H. (2011). Evaluation of acute toxicity andteratogenic effects of plant growth regulators by Daphnia magna embryo assay.J. Hazard. Mater. 190, 520–528. doi: 10.1016/j.jhazmat.2011.03.068
Zielinski, Q. B. (1955). Escallonia: the genus and its chromosomes. Bot. Gazette117, 166–172. doi: 10.1086/335904
Zhang, F., Xue, H., Lu, X., Zhang, B., Wang, F., Ma, Y., et al. (2015).Autotetraploidization enhances drought stress tolerance in two apple cultivars.Trees 29, 1773–1780. doi: 10.1007/s00468-015-1258-4
Conflict of Interest Statement: The authors declare that the research wasconducted in the absence of any commercial or financial relationships that couldbe construed as a potential conflict of interest.
Copyright © 2018 Denaeghel, Van Laere, Leus, Lootens, Van Huylenbroeck and Van
Labeke. This is an open-access article distributed under the terms of the Creative
Commons Attribution License (CC BY). The use, distribution or reproduction in
other forums is permitted, provided the original author(s) and the copyright owner
are credited and that the original publication in this journal is cited, in accordance
with accepted academic practice. No use, distribution or reproduction is permitted
which does not comply with these terms.
Frontiers in Plant Science | www.frontiersin.org 17 March 2018 | Volume 9 | Article 354