THE VARIABILITY OF DENGUE INCIDENCE IN...
106
Transcript of THE VARIABILITY OF DENGUE INCIDENCE IN...

THE VARIABILITY OF DENGUE INCIDENCE IN THREE LOCALITIES IN FIJI IN RELATION TO CLIMATE
VARIABILITY AND CHANGE.
by Kelera Salusalunitoba Oli
A thesis submitted in fulfillment of the requirements for the degree of Masters of Science in
Climate Change at the University of the South Pacific.
Copyright © 2013 by Kelera Salusalunitoba Oli
Pacific Centre for Environment and Sustainable Development
University of the South Pacific
February, 2013

DEDICATION
Dedicated to the memory of my parents,
Luke Seruvatu Oli (2008) and Miliakere Ravouvou Oli (2009).
They inspired me and molded me.

i
ACKNOWLEDGEMENTS
I acknowledge and thank God, the Almighty for His provision and guidance in my undertaking
this research at the University of the South Pacific.
The following institutions are acknowledged for their support and contribution towards my
research:
� European Union for the scholarship;
� Ministry of Health-Permanent Secretary, Health Information Unit, Environmental Health
Unit, Subdivisional Medical Officers/Subdivisional Health Inspectors/Laboratory
Supervisors/Recorders of Ba, Lautoka and Nadroga, Fiji Centre for Communicable
Disease Control (Mataika House);
� Ba Town Council, Lautoka City Council, Sigatoka Town Council;
� Communities of Tauvegavega Housing , Natabua Housing and Nayawa Housing;
� Fiji Meteorology Services of Fiji;
� Bureau of Statistics, Fiji; and
� PACE-SD Postgraduate students, especially Linda (Masters and PhD).
Special appreciation to my Principal Supervisor, Dr. Karen McNamara: I personally say, thank
you for your support and patience.
I also thank my external supervisor, Dr. Simon Hales.
The tremendous support and encouragement from my friends and colleagues kept me going.
Finally, I thank my family for their prayers and without them, I would not have risen to the
challenge.
Thank you all.
ii
ABSTRACT The capacity of climate change to alter ecological systems has been observed to have the
potential in favouring disease transmission. Dengue is identified as one of the four climate
sensitive diseases in Fiji. Consequently, this study explored the variability of dengue incidence in
three localities in Fiji in relation to climate variability and change from 1996-2010.
Confirmed dengue cases in Ba, Lautoka and Nadroga were collected from hospital registers and
the Patient Information System. Monthly data of minimum and maximum temperatures, rainfall
and relative humidity were collated from the Fiji Meteorology Services of Fiji. The association
between dengue incidence and climate variables was explored. Questionnaires, key informant
interviews and observational surveys were conducted in the three case study areas to assess
possible impacts of non-climatic variables on dengue incidence.
There were 1,279 confirmed dengue cases for the period 1996-2010 in Ba, Lautoka and Nadroga.
Three outbreak episodes were recorded within the studied period yielding a total of 1,209 cases.
The results showed that the relationship between dengue incidence, temperature and rainfall is
statistically significant. In Ba, dengue incidence is significantly correlated to temperatures
(minimum and maximum), whereas the correlation of dengue and maximum temperature is
statistically significant in Lautoka and the correlation of dengue incidence and rainfall is
statistically significant in Nadroga. However, analysis of the questionnaire, observation and key
informants’ interview showed that the correlation between the incidence of dengue as surveyed
and the non-climatic variables are not statistically significant.
This study reveals that the risk of dengue transmission increases with climate variability and
change if the non-climatic factors of mosquito control and surveillance are poor. Climate
projections for Fiji have shown that the country’s climate will continue to change. The
temperature in Fiji will continue to rise by at least an estimated range of 0.4-1.0°C by 2030.
There will be more very hot days and warm nights and a decline in cooler weather. It is predicted
that extreme rainfall days are likely to occur more often in Fiji. Therefore, it is essential that the
public health infrastructure is strengthened to combat the threat of climate variability and change
and its impact on dengue incidence.

iii
TABLE OF CONTENTS Acknowledgements ………………………………………………………………………...………………………….i Abstract…………………………………………………………………………......................................................ii Table of contents………………………………………………………………………………………………………iii List of table……………………………………………………………………………………………………………. v List of figures…………………………………………………………………………………………………………..v List of plate……………………………………………………………………. .. ………………. ……… vii List of appendices……………………………………………………………………………… ........................... . vii List of abbreviations……………………………………………………………………………… ...................... . viii
CHAPTER ONE THESIS INTRODUCTION ..................................................................................................... 1
1.1 Background ....................................................................................................................................... 1
1.2 Overview of the issues ....................................................................................................................... 4
1.3 Thesis aim and objectives ................................................................................................................. 5
1.4 Thesis structure ................................................................................................................................. 5
1.5 Chapter conclusion ........................................................................................................................... 6
CHAPTER TWO LITERATURE REVIEW ..................................................................................................... 7
2.1 Chapter introduction ......................................................................................................................... 7
2.2 Global climate change ...................................................................................................................... 7
2.3 Climate change in Fiji....................................................................................................................... 9
2.4 Infectious diseases .......................................................................................................................... 11
2.5 Vector borne diseases ..................................................................................................................... 12
2.6 Dengue vector ................................................................................................................................. 12
2.7 Dengue epidemiology ...................................................................................................................... 14
2.8 Dengue and climate change ............................................................................................................ 17
2.9 Modeling dengue and climate change ............................................................................................ 19
2.9.1 Mathematical models ......................................................................................................... 19
2.9.2 Empirical models ................................................................................................................. 20
2.10 Chapter conclusion ......................................................................................................................... 21
CHAPTER THREE STUDY SITES AND METHODOLOGY ............................................................................. 22
3.1 Chapter introduction ....................................................................................................................... 22
3.2 Study sites........................................................................................................................................ 22
Figure 3.2.1: Map ....................................................................................................................................... 23
3.3 Overview of method ........................................................................................................................ 24

iv
3.4 Data collection techniques .............................................................................................................. 24
3.4.1 Secondary data .................................................................................................................... 24
3.4.2 Primary data: Household questionnaire ............................................................................. 26
3.4.3 Primary data: In-depth interviews ............................................................................................. 27
3.4.4 Observational survey .......................................................................................................... 27
3.5 Data processing and analysis ......................................................................................................... 28
3.6 Challenges and limitations.............................................................................................................. 29
3.7 Chapter conclusion ......................................................................................................................... 30
CHAPTER FOUR RESULTS AND ANALYSIS ............................................................................................. 31
4.1 Chapter introduction ....................................................................................................................... 31
4.2 Climate data analysis ...................................................................................................................... 31
4.3 Dengue data analysis ...................................................................................................................... 34
4.4 Time-series analysis of climate variables with dengue incidence................................................... 39
4.5 Correlation analysis of climate variables with dengue incidence ................................................. 46
4.6 Chapter conclusion ......................................................................................................................... 52
CHAPTER FIVE RESULTS AND ANALYSIS – CASE STUDY AREAS .............................................................. 53
5.1 Chapter introduction ....................................................................................................................... 53
5.2 Dengue transmission analysis ......................................................................................................... 53
5.3 Demographics and socio economic factors .................................................................................... 61
5.4 Knowledge, attitude and behaviour ................................................................................................ 64
5.5 Observed correlations of knowledge, attitude and behaviours with dengue incidence as collated from the questionnaire ................................................................................................................................ 75
CHAPTER SIX CONCLUSION AND RECOMMENDATIONS ....................................................................... 78
6.1 Chapter introduction ....................................................................................................................... 78
6.2 Summary of major findings ............................................................................................................. 78
6.3 Recommendations ........................................................................................................................... 79
REFERENCES ................................................................................................................................................ 84
APPENDIX 1: QUESTIONNAIRE .................................................................................................................... 89
APPENDIX 2: INFORMATION SHEET ............................................................................................................ 91
APPENDIX 3: CONSENT FORM..................................................................................................................... 92
APPENDIX 4: INTERVIEW SCHEDULE ........................................................................................................... 93
v
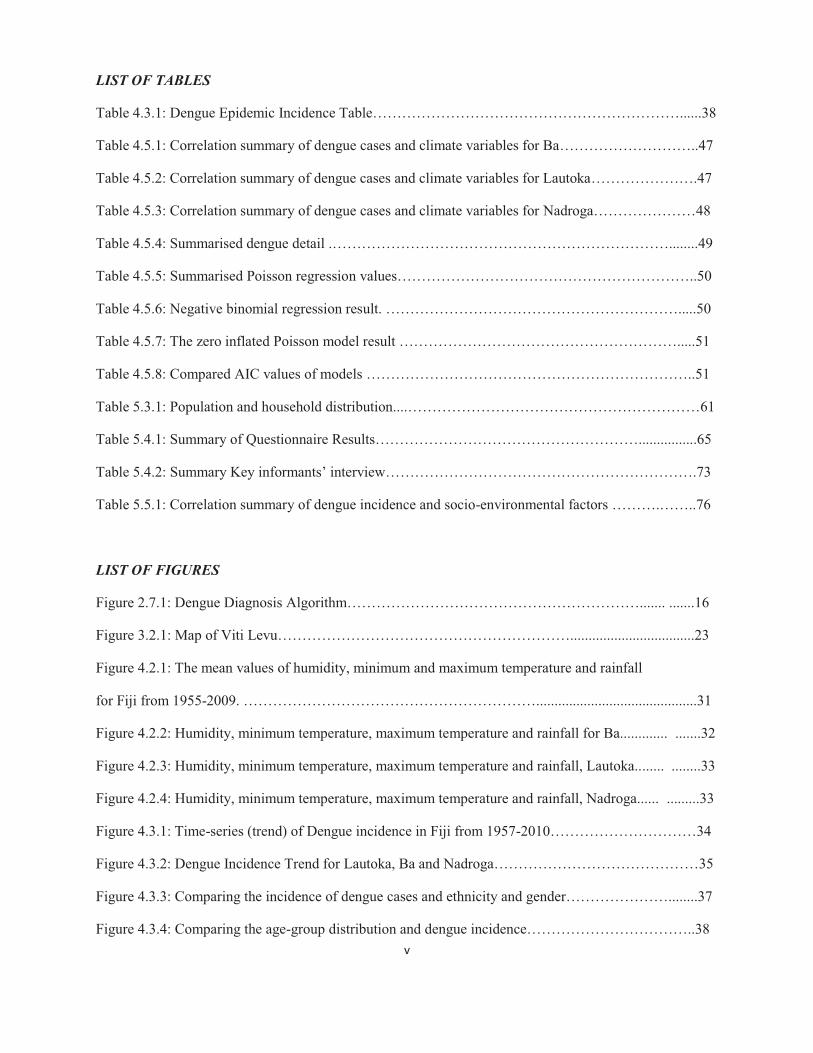
LIST OF TABLES
Table 4.3.1: Dengue Epidemic Incidence Table………………………………………………………......38
Table 4.5.1: Correlation summary of dengue cases and climate variables for Ba………………………..47
Table 4.5.2: Correlation summary of dengue cases and climate variables for Lautoka………………….47
Table 4.5.3: Correlation summary of dengue cases and climate variables for Nadroga…………………48
Table 4.5.4: Summarised dengue detail .……………………………………………………………........49
Table 4.5.5: Summarised Poisson regression values……………………………………………………..50
Table 4.5.6: Negative binomial regression result. …………………………………………………….....50
Table 4.5.7: The zero inflated Poisson model result ………………………………………………….....51
Table 4.5.8: Compared AIC values of models …………………………………………………………..51
Table 5.3.1: Population and household distribution....……………………………………………………61
Table 5.4.1: Summary of Questionnaire Results………………………………………………................65
Table 5.4.2: Summary Key informants’ interview……………………………………………………….73
Table 5.5.1: Correlation summary of dengue incidence and socio-environmental factors ……….……..76
LIST OF FIGURES
Figure 2.7.1: Dengue Diagnosis Algorithm……………………………………………………....... .......16
Figure 3.2.1: Map of Viti Levu……………………………………………………..................................23
Figure 4.2.1: The mean values of humidity, minimum and maximum temperature and rainfall
for Fiji from 1955-2009. ……………………………………………………............................................31
Figure 4.2.2: Humidity, minimum temperature, maximum temperature and rainfall for Ba............. .......32
Figure 4.2.3: Humidity, minimum temperature, maximum temperature and rainfall, Lautoka........ ........33
Figure 4.2.4: Humidity, minimum temperature, maximum temperature and rainfall, Nadroga...... .........33
Figure 4.3.1: Time-series (trend) of Dengue incidence in Fiji from 1957-2010…………………………34
Figure 4.3.2: Dengue Incidence Trend for Lautoka, Ba and Nadroga……………………………………35
Figure 4.3.3: Comparing the incidence of dengue cases and ethnicity and gender…………………........37
Figure 4.3.4: Comparing the age-group distribution and dengue incidence……………………………..38

vi
Figure 4.4.1: Dengue Incidence with Minimum and Maximum Temperatures in Ba……………….....40
Figure 4.4.2: Dengue Incidence with Minimum and Maximum Temperatures in Lautoka…………....40
Figure 4.4.3: Two year trend for the epidemic years…………………………………………………..41
Figure 4.4.4: Dengue Incidence with Minimum and Maximum Temperatures Nadroga…………..….41
Figure 4.4.5: Dengue Incidence with Humidity and Rainfall in Ba……………………………..……. 43
Figure 4.4.6: Dengue Incidence with Humidity and Rainfall in Lautoka………………………..…….44
Figure 4.4.7: Dengue Incidence with Humidity and Rainfall in Nadroga………………………...….. 44
Figure 5.2.1: The Dengue transmission pattern and geographical distribution for Ba……………..... ..54
Figure 5.2.2: The geographical distribution of part of the first ten cases for Ba…………………...….54
Figure 5.2.3: The geographical distribution of part of the first ten cases for Ba………………….. ….55
Figure 5.2.4: The Dengue transmission pattern and geographical distribution, Lautoka………….. ... 56
Figure 5.2.5: The geographical distribution of part of the first ten cases, Lautoka………………..…..57
Figure 5.2.6: The geographical distribution of part of the first ten cases, Lautoka…………….….. . ..57
Figure 5.2.7: The Dengue transmission pattern and geographical distribution, Nadroga…………...…59
Figure 5.2.8: The geographical distribution of part of the first ten cases, Nadroga……………..… ….59
Figure 5.2.9: The geographical distribution of part of the first ten cases, Nadroga……………………60
Figure 5.3.1: Proportion of the population within each study site...........................................................61
Figure 5.3.2: Employment Status in Tauvegavega, Ba…………………………………………….......62
Figure 5.3.3: Employment Status in Natabua, Lautoka……………………………………….…...…...63
Figure 5.3.4: Employment Status in Nayawa, Nadroga…………………………………………..….....63
Figure 5.4.1: Proportions of the various water storage facilities………………………………………66
Figure 5.4.2: Comparing the various potential mosquito breeding containers………………………. ..67
Figure 5.4.3: Comparing the various potential mosquito harbouring areas…………………………….67
Figure 5.4.4: Comparing the different mosquito protective equipment in use…………………………68
Figure 5.4.5: Responses on behaviour if warned of a dengue epidemic within the next two weeks……………………………………………………………………………………………………70
Figure 5.4.6: Responses to why the residents selected the options…………………………………….71
vii
LIST OF PLATES
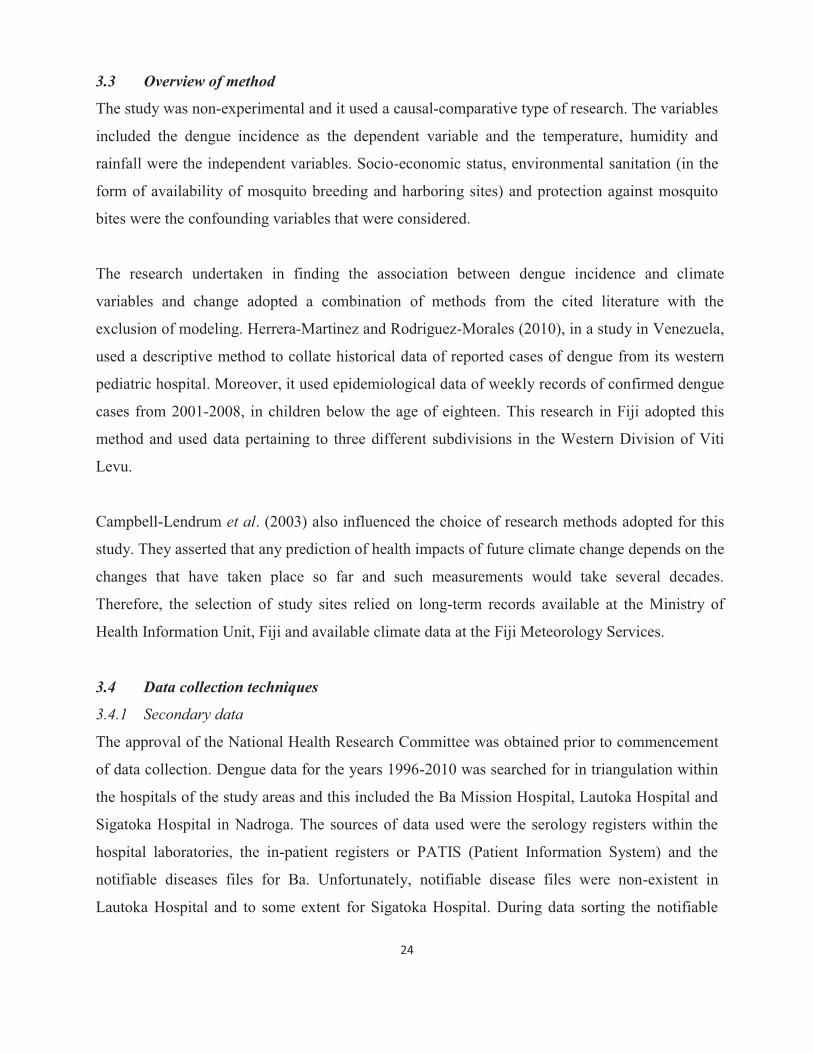
Plate 1: Location of some in-patient registers………………………………………………….……26
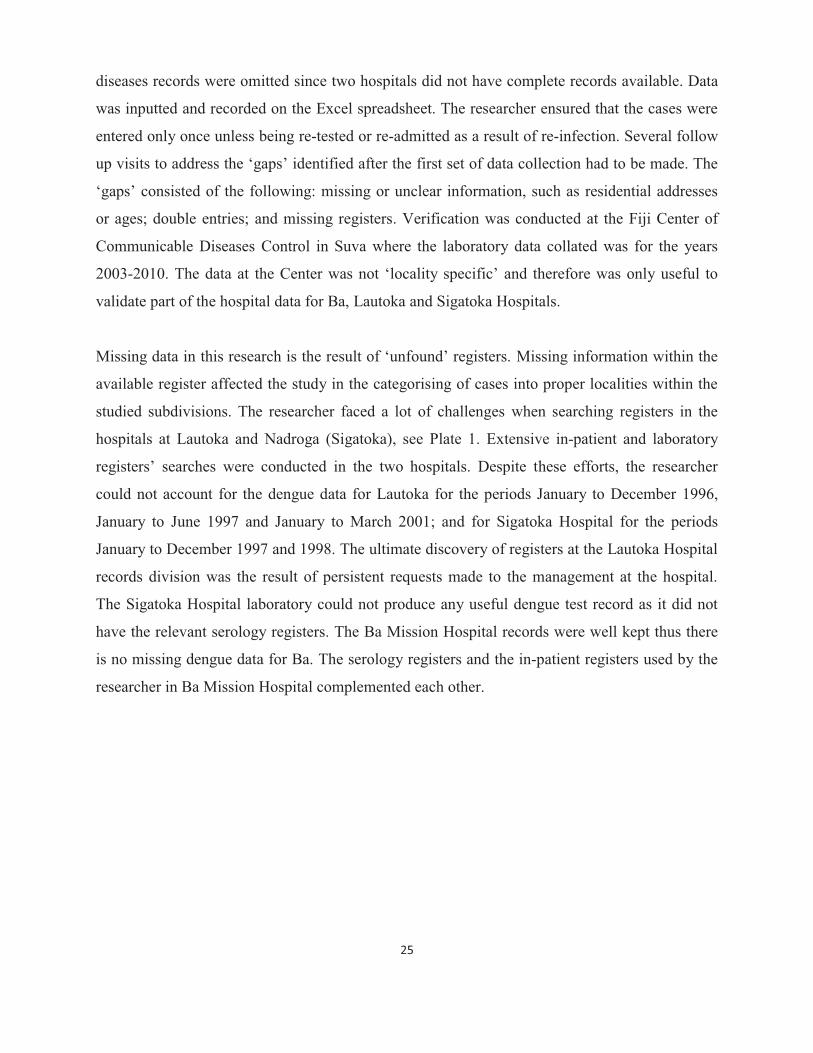
Plate 2: Mosquito breeding ground…………………………………………………………….……28
Plate 3: Backyard and roadside refuse heap ………………………………………………….…….69
Plate 4: Housing Authority at Natabua, Lautoka …..………………………………………….……70
LIST OF APPENDICES
APPENDIX 1: QUESTIONNAIRE ………………………………………………….…………89
APPENDIX 2: INFORMATION SHEET………………………………………………….……….91
APPENDIX 3: CONSENT FORM………………………………………………….………………92
APPENDIX 4: INTERVIEW SCHEDULE………………………………………………….……...93
viii
LIST OF ABBREVIATIONS
ABM & CSIRO Australian Bureau of Meteorology and Commonwealth Scientific and Industrial Research Organisation
AIC Akaike's Information Criterion
BoS Bureau of Statistics
DENV Dengue Viruses
FCCDC Fiji Centre for Communicable Disease Control
FMS Fiji Meteorology Services
GRF Government of the Republic of Fiji
IPCC Intergovernmental Panel for Climate Change
MoH Ministry of Health
OLS Ordinary Least Squares
PCCAPHH Piloting Climate Change Adaptation to Protect Human Health
SPCZ South Pacific Convergence Zone
WHO World Health Organization
1
CHAPTER ONE THESIS INTRODUCTION
1.1 Background
Global climate change is a significant health hazard faced by humankind. It is predicted that the
emission of greenhouse gases into the environment will lead to long-term climate change
(McMichael, 2003; WHO, 2003; Patz et al., 2005; WHO, 2009a). Since the earth’s climate
system is part of ‘life-supporting processes’, any change that causes instability to the system
would consequently affect the health of the human population (McMichael, 2003, 1). The
deliberate pollution of the environment through accelerated level of industrialisation for
economic gains and the pressure from the increasing population directly contribute to climate
change. There is growing concern about the health impacts of climate change, an impact that is
often neglected, especially for least developed countries such as the Pacific Islands, the
Caribbean and nations of the African continent.
The World Health Organization (WHO; 2009a) explained that the changing climate will
inevitably affect the basic requirements for maintaining health which includes clean air and
water, sufficient food, and adequate shelter. The present warming of the earth and climate
variability could increase levels of atmospheric pollutants and a growth in disease transmission
due to unclean water and contaminated food (WHO, 2009a). Furthermore, every year air
pollution problems contribute to about 1.2 million human deaths and another 2.2 million deaths
due to diarrhea caused by insufficient clean water supply and sanitation. About 3.5 million
people die from malnutrition each year, and there are approximately 60,000 deaths annually as a
result of natural disasters (WHO, 2009a). It is estimated that the health of millions of people will
be affected by the impacts of climate change (IPCC, 2007). Such health impacts include: more
cases of malnutrition; increased mortality, morbidity and injuries attributed to extreme weather
events; a higher burden of diarrheal diseases; advanced rate of cardio-respiratory ailments due to
pollution; and the emergence of infectious diseases in new localities. Many of these impacts of
climate change will be discussed in more detail below.
WHO (2003) indicated that weather, climate variability and climate change are the three
meteorological-based threats to health. The health impacts associated with changes in climatic
conditions are placed into three categories. The first category includes those direct impacts
2
caused by weather or climate extremes. These include injuries and illnesses during or after
floods, droughts, windstorms and heat waves (WHO, 2003). The second category encompasses
the impacts of environmental and ecological changes that occur in response to climate change
(WHO, 2003). Examples given by WHO (2003) of this second category are the alterations in the
geographical distribution and intensity of communicable diseases that are spread by vectors,
rodents, food and/or water. The capacity of climate change to alter ecological systems has been
observed to have the potential in favouring disease transmission and the emergence of diseases in
areas where they have been non-existent, for example, malaria in south and eastern Africa
(WHO, 2003). However, it is also observed that the same capacity can create unfavourable
conditions for certain disease vectors and their agents, such as high temperature in hot regions
(WHO, 2003). The third category relates to the diverse health impacts like trauma and stress
caused by social disruptions to communities, such as loss of homeland or important resources
(Ebi, 2011; de Wet & Hales, 2000; WHO, 2003).
The three health consequences mentioned in the preceding paragraph form a complex ‘cause and
effect’ chain from climate change to changing patterns of health determinants and outcomes
(Ebi, 2011, 684). Health determinants include wealth, status of the public health infrastructure,
access to health care, availability of sufficient and safe water supply and nutrition and sanitation
(Ebi, 2011). Thus, the vulnerability of communities to the health impacts of climate change is
determined by both climatic and non-climatic factors (Ebi, 2011).
It is evident that all the regions of the world will be affected by climate change; however, the
extent and intensity of health risks vary depending on where and how people live (WHO, 2009a).
This growing challenge has been highlighted by WHO (2009a) through the use of numerous
examples. The health of the Indigenous people of the Polar region – the Inuit people – is affected
by rising temperature that would lessen winter deaths and other cold related injuries. WHO
(2003) argued that some of the health impacts of changing climatic conditions could even be
beneficial to communities in some locales. However, with melting ice and snow, traditional
hunting activities of the Inuit people is affected as animals move and hunting is limited.
Alterations in the physical environment therefore changes the traditional way of life and
livelihoods, affecting community stability and psycho-social health which fall into the third class
of health impacts. Mountain people’s health is affected by water insecurity for domestic use and

3
agriculture, due to glaciers movement which in turn floods the lakes causing injury and death.
On the other hand the higher temperature increases the risks of vector borne disease
transmission. Urban populations of tropical megacities face risks from heatwaves. High
population densities coupled with health determinants such as poor sanitation, lack of clean
water and poor waste management increases levels of vulnerability to climate sensitive diseases
like dengue. The most vulnerable are the small island developing nations and low lying regions
like the Pacific Island states. Severe tropical cyclones and rising sea levels make their
populations vulnerable to the first order health impacts of climate change. Many island nations in
the Pacific lack basic necessities of health such as fresh water. These nations have increasingly
reported cases of diarrhea and nutrition related illnesses after droughts and floods (WHO,
2009a).
Guillemot (2011) undertook a study in Fiji to identify which health problems have a clear link
with climate change. Dengue fever, diarrheal diseases (food and water borne) and nutrition-
related illnesses were all identified to have a strong relationship with climate, and have the
potential to worsen with increasing climate variability and change (Guillemot, 2011). The study
concluded that dengue fever has the potential to affect an increasing population by each epidemic.
There is a chance that dengue will become endemic rather than occur in isolated epidemics
(Guillemot, 2011). It is imperative that further research is conducted at the community level in
Fiji to identify the ways in which these concerns might best be mitigated. Well designed
monitoring studies of climate change and human health are important as the climate change
process is slow and its health impacts would be gradual and complex to determine considering the
network of interacting factors and health determinants (Hales et al., 2003; Wilkinson et al., 2003).
de Wet and Hales (2000) revealed that while Fiji has made significant progress in improving the
status of public health, not all sectors of society in Fiji have benefitted. There are some sectors
that could be regressing as far as public health is concerned. These are the very sectors that would
be vulnerable to the effects of climate change resulting in significant adverse impacts on human
health (de Wet & Hales, 2000). Furthermore, the estimated cost to Fiji of ignoring the potential
impacts of climate change would be US$5-19 million by 2050 in terms of loss of public safety,
increased vector and water borne diseases and an increase in malnutrition due to food shortages
(Ebi et al., 2006). Therefore, these concerns should be considered as high priority research areas

4
because the health impacts of climate variability and change can be direct, indirect, multiple,
simultaneous and significant. A priority area is the conduct of basic entomologic research (Ebi et
al., 2006). The scientific and evidence based information gathered should be used in policy
making pertaining to risk management in climate change disaster scenarios (Wilkinson et al.,
2003). Therefore, this current study seeks to examine the vulnerable sectors of Fiji pertaining to
entomology and climate change. The findings of this study could then be used to assist leaders at
the community, district, provincial and national levels to make informed decisions that will
protect the public from the risk of dengue epidemics as a consequence of climate change.
1.2 Overview of the issues Climate variability and change in Fiji cause severe disasters as a result of droughts, floods or
tropical cyclones. A major impact from these disasters is seen in the health sector where there is
an observed increase in hospital admissions and treatments from injuries and infectious diseases
such as diarrhea, typhoid, dengue and leptospirosis. There is also an influx in malnutrition and
stress related ailments. Dengue is identified as one of the four important climate-sensitive
diseases in Fiji (PCCAPHH, 2012). The other three important climate sensitive diseases are;
diarrhea, typhoid and leptospirosis. Moreover, other studies and the Fiji Ministry of Health have
recommended that further research and responses to minimise the impacts of dengue need to be
improved. The National Dengue Strategic Plan (2010-2014), which aims to reduce the disease
burden due to major parasitic and vector borne diseases, recommends that research be conducted
on the effects of climate change on dengue (Component 6, Expected Result 36, Activity 36.7; pg
49). Previous studies pertaining to climate and dengue in Fiji had focused on the national situation
with a set of ‘top-down’ solutions. The morbidity and mortality rates of post disaster dengue
incidence is always a burden for the Ministry of Health as experienced in the floods in the
Western division of Fiji in January and March, 2012. Climate models for Fiji have shown that the
country's climate will continue to change. Because a changing climate could potentially
adversely affect human populations living in villages, there is an urgent need to consider
recommendations to address these impacts from research conducted at the district or village level.
Findings from local researches contribute to evidence on which national and even international
mitigation and adaptation policies pertaining to climate change and health are established
(Wilkinson et al., 2003). The findings from the proposed research will be used to adequately
address risk factors associated with climate variability and change in Fiji.

5
In order to reduce the impacts of climate change on dengue incidence in Fiji, it is vital to
understand the association of dengue and climate change at a district level and to comprehend the
level of knowledge, behaviour and attitudes of those in the community including the public health
workers. There are other factors which are discussed in Chapters 4 and 5, within a community that
synergistically contribute to dengue occurrences. These factors should also be considered in
formulating adaptation and mitigating measures pertaining to dengue fever in response to climate
change. This confirms the need for this study in Fiji to better understand the major public health
issues being encountered at the district level and its nation-wide implications.
1.3 Thesis aim and objectives The aim of this study is to describe the relationship of dengue incidence and climate variability
and change in three localities in Fiji. Underlying this aim are the following three inter-related
objectives:
1. To analyse existing data on dengue incidence and temperature, humidity and rainfall
from 1996-2010 for the three selected communities and the relevant subdivisions;
2. To explore the levels of community knowledge about, and attitudes and behaviours in
relation to dengue at the three sites; and
3. To formulate recommendations that might improve the adaptive capacity of the identified
communities to dengue incidence associated with climate variability and change.
To meet this aim and three underlying objectives, this study has utilised a novel data collection
approach. This approach has not only drawn on a combination of qualitative and quantitative
data, but has also utilised primary and secondary data sources, as outlined in more detail in
Chapter 3.
1.4 Thesis structure This thesis consists of six chapters. This current chapter has provided a brief overview of the
issue at hand, and the research aim and objectives. Chapter 2 provides a detailed review of the
relevant literature, drawing on numerous sources that describe the association between climate
and dengue at international, regional and local levels. Importantly, this study is positioned within
this growing body of literature. Chapter 3 provides details of the methodology adopted. Chapter
6
4, a results chapter, provides details on the findings of dengue incidence in relation to rainfall,
minimum temperature, maximum temperature and relative humidity. Chapter 5 is the final
results chapter that discusses the knowledge, attitude and behavior of the communities being
studied in relation to dengue and climate change. The final chapter for this thesis provides a
conclusion and a series of recommendations that can be adopted to address the issue and growing
concern about dengue and its relationship with climate variability and change, particularly in the
context of Fiji.
1.5 Chapter conclusion This chapter has presented an overview of this study, including the context, and research aim and
objectives. To date, there has been insufficient action to prevent the adverse consequences on the
health of Fiji’s population as a result of climate change. There needs to be greater support from
all levels of government and donor agencies to undertake further research into this important
area, and implement the recommendations flowing from these studies to safeguard communities
from these health impacts. This study seeks to build critical mass in this area of scholarship by
better understanding the relationship between dengue fever and climate change. More
specifically, this study will draw on research conducted in three Fijian communities to explore
levels of knowledge, attitudes and behaviours of households, which can impact on the adaptive
capacity of communities to respond to cases of dengue fever. As alluded to earlier in this chapter,
a number of studies on dengue fever and climate change have been undertaken globally, a
number of which will be discussed in more detail in the chapter to follow.
7
CHAPTER TWO LITERATURE REVIEW
2.1 Chapter introduction This chapter explores the intricacies of a number of studies conducted on the occurrence of dengue
as an impact of climate variability and change. The geographical and development diversification
of the dengue mosquito vector and global climate change provide the core discussion of this
chapter. This chapter provides a review of scientific literature concerning the impact of climate
variability and change on the incidence of dengue. The literature discussed in this chapter spans
topic areas including climate variability, climate change and dengue. Other important articles
reviewed in this chapter focus on the dengue mode of transmission and its epidemiology, dengue
vector biology and dynamics, and all other evidence from research on climate and dengue
incidences. This literature review chapter will be used as a guide in designing the method for this
study. This chapter begins with a discussion on global and local climate change, followed by an
analysis of literature on infectious diseases including vector borne diseases and dengue. Finally,
this chapter concludes with a discussion of dengue and climate change, and some modeling
mechanisms.
2.2 Global climate change Climate change is the change within the statistical distribution of the weather over certain
periods of time ranging from centuries, decades and even millions of years (WHO, 2003).
Climate is the weather that prevails in an area for long period (McMichael & Woodruff, 2008).
The IPCC (2007) referred to climate change as a change in the state of the climate that can be
identified by use of statistical tests. The observed change should persist for an extended period
and happens over time. It can be due to natural variability or as a result of the activities of
humans due largely to the emission of fossil fuels (IPCC, 2007). On the other hand, climate
variability involves seasonal and multiannual fluctuations in temperature, humidity and rainfall
(Thai & Anders, 2011; WHO, 2003).
It is widely documented that global climate is changing rapidly (WHO, 2003; WHO, 2009a;
McMichael, 2003). Climate change is attributed primarily to anthropogenic greenhouse gas
emissions (IPCC, 2007). Such greenhouse gas emissions due to humankind activities include
burning of fossil fuels (CO2 emission) forest burning, pollution and urbanisation (McMichael,
2003; WHO, 2003; Patz et al., 2005; WHO, 2009a; Banu et al., 2011). It is evident that human

8
actions are changing atmospheric composition, thereby causing global climate change (WHO,
2003; McMichael, 2003). Human activities result in the emission of four green houses gases -
carbon dioxide (CO2), methane (CH4), nitrous oxide (N2O) and halocarbons (fluorine, chlorine
and bromine) (IPCC, 2007). When these gases are emitted at a larger or faster rate than their
removal rate the atmospheric concentrations of greenhouse gases increase and is considered as a
driver of climate change (IPCC, 2007).
The IPCC (2007) used numerous datasets and data analyses, broader geographical coverage with
better understanding of uncertainties and a wider variety of measurements to conduct its
assessment and observations of climate change. Some of the observations made by the IPCC
(2007) are: eleven of the last twelve warmest years since 1850 fell between 1995 and 2006;
temperature is increasing worldwide; and this temperature increase is widespread over the globe
and is more at higher northern latitudes. Moreover, global average sea level rose at an average
rate of 1.8 mm per year over 1961 to 2003 and at an average rate of about 3.1mm per year from
1993 to 2003 (an observed faster rate for 1993 to 2003), and from 1900 to 2005 there was a
marked rise in precipitation in eastern parts of North and South America, northern Europe and
northern and central Asia while there was a decrease in precipitation in the Sahel, the
Mediterranean, southern Africa and parts of southern Asia. The IPCC (2007) has also observed
that the area affected by drought has likely increased since the 1970s and an observed increase in
intense tropical cyclones in areas of the North Atlantic since about 1970, and other regions where
concerns over data quality are greater.
The below list from the IPCC (2007) shows some weather events that have changed in frequency
and/ or intensity over the last 50 years:
� Cold days and cold nights have decreased while hot days and hot nights became more
frequent;
� Heat waves have increased;
� The frequency of heavy precipitation events has increased for most areas; and
� The occurrence of very high sea level has increased geographically worldwide since
1975.
9
The analyses by IPCC (2007) signals that the Pacific region needs to be prepared for the impacts
of climate change. Woodward et al. (2000) asserted that the Pacific is vulnerable to impacts of
climate change such as rising sea level because of its geographical location. Furthermore,
Woodward et al. (2000) concurred that those in the Pacific should define proper vulnerability
measures and identify communities in urgent need of proactive interventions to save their
populations from negative health impacts of global climate change. It is critically important that
the associations between climate variables (temperature, humidity and rainfall) and human health
are detected as soon as possible so that they can be effectively addressed by policy-makers,
leaders and health care professionals throughout the Pacific region.
2.3 Climate change in Fiji Fiji has an oceanic tropical marine climate which varies through different timescales (GRF,
2012). The major features steering the variability of Fiji’s climate include: the El Niño Southern
Oscillation (ENSO), which occurs at an average of every four years; the South Pacific
Convergence Zone (SPCZ) and the trade winds. There are two extreme phases of the ENSO
phenomenon: El Niño and La Niña. El Niño events tend to bring drier and cooler than normal
conditions in the cool and dry season (June-August) and drier and hotter conditions during the
wet and hot season (December-February) (GRF, 2012). El Niño can contribute to reduction in
rainfall and increased chance of drought. Conversely, La Niña tends to bring heavier rainfall in
the wet season with above normal precipitation in the dry season. The two La Niña conditions
can cause river flooding (GRF, 2012). The SPCZ is a zone that is associated with high rainfall
(GRF, 2012). This band of heavy rainfall is caused by air rising over warm water where winds
converge, resulting in thunderstorm activity (ABM & CSIRO, 2011). Fiji experiences very heavy
rainfall when the southern hemisphere experiences its wet season and when the heaviest rainfall
occurs in the SPCZ (GRF, 2012). The position of the SPCZ strongly affects Fiji’s seasonal cycle
(GRF, 2012). It was revealed that 70% of Fiji’s annual average rainfall from 1961 to 2010 was in
the wet season (GRF, 2012). Moderate to strong El Niño events reduce rainfall by about 20-50%
as experienced in 1982/83, 1986/87, 1992/93 and 1997/98 resulting in major droughts over most
part of Fiji (GRF, 2012).
Rainfall across Fiji can be highly variable (ABM & CSIRO, 2011). On Fiji’s two main islands,
Viti Levu and Vanua Levu, rainfall is strongly influenced by high mountain peaks and the

10
islands’ central mountain ranges (ABM & CSIRO, 2011). On the southeastern slopes of Viti
Levu, near Suva, the average annual rainfall is about 3,000mm (ABM & CSIRO, 2011). In
contrast, the lowlands on the western side of Viti Levu, near Nadi, are sheltered by the
mountains and have an annual average rainfall of 1,800mm with a well-defined dry season
favorable to crops such as sugar cane (ABM & CSIRO, 2011). GRF (2012) projected that Fiji’s
maximum daily rainfall of 200mm may be less frequent than presently seen.
While the average temperature consistently sits on 25°C annual variation shows an average
between 20-27°C (ABM & CSIRO, 2011). ABM & CSIRO (2011) noted that while the average
nighttime temperatures can be as low as 18°C around the coast, the average maximum daytime
temperatures can be as high as 32°C. In the central parts of the main islands, average nighttime
temperatures can be as low as 15°C. The country has two distinct seasons – a warm wet season
from November to April, which is also known as the tropical cyclone season, and a cooler dry
season from May to October (ABM & CSIRO, 2011). GRF (2012) predicted that the daily
minimum temperatures of 16°C, 18°C and 21°C in selected localities within Fiji may be more
frequent than presently noted.
The summary of climate predictions for Fiji shows that temperature will continue to rise and by
2030, under a high emissions scenario, this increase in temperature is projected to be in the range
of 0.4-1.0°C (annual mean temperature of 0.7°C) (ABM & CSIRO, 2011; GRF, 2012). The
projection for Fiji; is more very hot days and warm nights and a decline in cooler weather.
However, drought projections are inconsistent for Fiji (ABM & CSIRO, 2011). It is generally
suggested that there would be an increase in both the dry season and wet season rainfall and
model projections show that extreme rainfall days are likely to occur more often in Fiji (ABM &
CSIRO, 2011). On the contrary, GRF (2012) projected that there would be little change in
rainfall, as predicted by the models that were used for the GRF study. Finally, sea level in Fiji
will continue to rise and the acidity level of the sea-water will also follow a similar trend (ABM
& CSIRO, 2011). Guillemot (2011) explained that Fiji, a small island developing state, is
vulnerable to the impact of climate change and is exposed to extreme events like floods and
droughts.

11
2.4 Infectious diseases Different environmental conditions within locations determine seasonal as well as regional
variation in the incidence of diseases (Tolba, 1992; Ebi, 2011). Furthermore, there are some
communicable/infectious diseases that are transmitted more easily during the rainy season.
Climatic and weather conditions of temperature, humidity, rainfall, wind, extreme flooding or
drought and atmospheric conditions are all important factors and primary determinants in the
ecology of certain infectious diseases (Tolba, 1992; Ebi, 2011). These climatic conditions
control: the distribution and abundance of the disease vectors; the survival and reproduction of
pathogens; and the active season of the vector and the behaviour of the vulnerable population
(WHO, 2003; McMichael & Woodruff, 2008). Ultimately this influences the transmission
patterns of infectious diseases. An example of population behaviour given by Patz et al. (2003) is
the adaptation to the cold weather where people overcrowd indoors, thus increasing the
likelihood of infectious disease transmission. However, it should be noted that other
determinants of infectious diseases form an ‘interconnected web’ with disease transmission and
other factors (Ebi, 2011, 686). Hales et al. (2003, 80) described the connection as the ‘web of
interaction between ecosystems, climate and human societies’. The ‘other determinants’ may
include population dynamics, urbanisation, alterations to land use and agricultural activities,
deforestation, mobility and the status of public health (Hales et al., 2003, 80). As a whole,
infectious diseases transmission is influenced by social, economic, climatic and ecological
factors (McMichael & Woodruff, 2008). Poverty, a social and economic condition, can be a
driving factor as wealth enables the development of health infrastructure and provides housing
with screens, air conditioning and potable water. The use of bed nets, repellents and vector
control programmes require financing, and thus socioeconomic factors should be considered in
studies of infectious diseases especially vector borne diseases (McMichael & Woodruff, 2008).
There is sufficient evidence showing an association between some infectious diseases,
particularly for vector borne and water borne diseases and climate on temporal and spatial scales
(Hales et al., 2003). This association is obvious if there is a distinct climate difference with
vulnerable populations suffering from the effects of poverty (Hales et al., 2003). In Fiji, the four
assumed climate sensitive communicable infections include dengue fever, typhoid fever,
leptospirosis, and diarrhoeal ailments (GRF, 2012). Amongst climate sensitive infectious
12
diseases, vector borne diseases have the highest vulnerability for altered abundance and spatial
changes (McMichael & Woodruff, 2008).
2.5 Vector borne diseases Patz et al. (2008) suggested that vector borne diseases are highly climate sensitive. Vector borne
diseases are infectious diseases that are transmitted between hosts by an intermediate host
(vector) such as mosquitoes and ticks. Gubler et al. (2001) explained that the pathogens
transmitted by a vector include viruses, bacteria, parasitic worms, rickettsiae and protozoa. These
pathogens persist in cold-blooded arthropod vectors such as mosquitoes and ticks, thus
vulnerable to environmental changes. Therefore, further to the mention of transmission patterns
in Section 2.4, the diseases that involve a vector in their transmission cycles are more vulnerable
to external environmental influences such as temperature, rainfall and humidity (Patz et al.,
2003). Examples of vector borne diseases include malaria, dengue fever and Lyme disease
(McMichael et al., 2003). The vector borne disease of significance to this research is dengue,
which is transmitted by the Aedes mosquito.
The effectiveness of a vector depends on its survival and reproduction rate, the time of the year
and level of vector activity such as the rate of mosquito biting and the extrinsic incubation period
(Patz et al., 2003). Disease vectors, pathogens and hosts live and reproduce within a range of
favourable climatic conditions: temperature and precipitation are the most important, while sea
level elevation, wind, and sunlight are also important. Hales et al. (2003) explained that the
increasing temperature reduces the breeding time for vectors and shortens the extrinsic
incubation period which is the time-taken for the mosquitoes to become infective. Rainfall can
influence the transport and dissemination of infectious agents while temperature affects their
growth and survival (WHO, 2003; Patz et al., 2005). Therefore, disease vector’s dependence on
certain climatic conditions to survive and multiply confirms that an association between vector
borne diseases and climate variability and change exists.
2.6 Dengue vector The Aedes aegypti, a mosquito that breeds in stagnant freshwater is considered the principal
vector for dengue (Van Kleef et al., 2009; WHO, 2009b). Aedes aegypti is extensively found
throughout the world particularly between latitude 35°N and 35°S, corresponding to a winter
front of 10°C and the mosquito cannot survive in low temperatures and rarely found above 1,000
13
metres (WHO, 2009b). Aedes aegypti has a limited flight range of within 100 metres from where
it developed, in the absence of windy conditions and humans as transport. The dengue vector
depends on humans for its blood meals, which are usually taken during the day (WHO, 2009b).
Aedes albopictus mosquito is an effective secondary vector for dengue (Hales et al., 2003),
which is spreading into new geographical areas through the international trade of used tyres and
was introduced into Fiji in the mid-eighties through this mode (WHO, 2009b).
A modeling analysis, which focused on a global scale association between climate and the
population dynamics of Aedes aegypti, showed that climatic variables have an influence in the
abundance and distribution of the mosquito vector (Hopp & Foley, 2001). It is necessary to
identify the relationship between climate and mosquito vector biology and dynamics to better
understand how climate impacts human health, in particular the spread and incidence of dengue
(Hopp & Foley, 2001). The effective transmission of mosquito borne diseases such as dengue
depends on mosquito biology and population dynamics which rely particularly on favourable
climatic conditions (Degalier et al., 2009). Chen et al. (2010) used the Poisson regression
analysis to link meteorological factors and mosquito (Aedes aegypti) abundance and dengue
incidence in Southern Taiwan. The study suggested that warmer temperatures (with a three
month lag), elevated humidity and high mosquito density contributed to the increased rate of
dengue fever transmission in Southern Taiwan. The findings reported in Chowell et al. (2011)
confirmed that the highly persistent large outbreaks in Peru occurred most frequently during the
heavy rainy season, when favourable environmental conditions promoted vector development.
Ling Hii et al. (2009) described how studies have shown that ambient temperature could have
impact on population size, maturation period, feeding characteristics and survival rate of Aedes
mosquitoes. For instance, the Aedes mosquitoes experience lower mortality rates at temperatures
ranging from 15 to 30°C concurrently, experience shorter reproductive cycles at higher
temperatures (32°C) and double biting rate as compared to lower temperatures (24°C).
Moreover, pupae development may take four days at 22°C to less than a day at 32-34°C.
Ultimately, the mosquito population multiplies swiftly as temperature increases. On the other
hand, rainfall destroys mosquito larvae and kills female mosquitoes (important because females
need blood meals) in the short period while in the long-term more breeding grounds are created
provided potential containers are made available (Ling Hii et al., 2009). The mentioned studies

14
support WHO (2009b) that climate is a significant contributing factor of vector borne disease
epidemics in the world because of its direct influence on the biology of the vectors and so as the
vector density and vector distribution in an area.
Prakash et al. (2001) explained that dengue in Fiji is unique because it is the only country in the
world where four to six species of mosquitoes are potential vectors. However, the only effective
vector thus far in Fiji is Aedes aegypti (de Wet & Hales, 2000; Prakash et al., 2001). Other
known vectors are Aedes albopictus, Aedes polynesiensis, Aedes pseudoscutellaris, Aedes
horrescens and Aedes rotumae (in Rotuma only). Aedes aegypti thrives in domestic and human
environments and prefers to breed in containers such as water drums and tyres that contain clean
water found in and around households, construction sites and factories (de Wet & Hales, 2000;
Prakash et al., 2001). It is notable that climate does not only directly affect the biological
processes of the vector and its infectious agent but also influences their breeding habitats (Patz et
al., 2003). In Fiji, Aedes aegypti is found throughout the urban and rural areas of Viti Levu
particularly close to human settlements (de Wet & Hales, 2000).
2.7 Dengue epidemiology Dengue is an important arboviral disease that includes dengue fever, dengue hemorrhagic fever
and its subsequent dengue shock syndrome. It is an increasing problem globally. Dengue is a
disease caused by anyone of four closely related dengue viruses – DENV1, DENV2, DENV3
and DENV4 (WHO, 2003). The viruses are transmitted to humans by the bite of an infected
mosquito. Dengue is prevalent in urban settings but also observed in the rural areas of tropical
and subtropical regions (Hales et al., 1999; Githeko et al., 2000; Degallier et al., 2009). The
disease had increased thirtyfold in the last fifty years with an estimated 50 million cases
occurring annually (WHO, 2009b). WHO (2009b) also indicated that dengue was proven to be
the leading mosquito borne viral disease being transmitted in the world. In addition, WHO
(2009b) confirmed that the health, the economic and the social burdens of dengue on the
populations of the affected countries are significant. However, there is no effective vaccine or
drug to treat dengue but proper case management and good clinical outcomes save lives (Hales et
al., 2002; WHO, 2009b).
Recent research in Singapore has also established that dengue is currently a major
epidemiological threat for over 100 countries with about 70% of the 2.5 billion populations at

15
risk living in Asia Pacific region (Ling Hii et al., 2009; WHO 2009b). Dengue affects hundreds
of millions of people every year (Hales et al., 2002). Fagbami et al. (1995) noted that dengue
was the main cause of morbidity in the South Pacific region. Singh et al. (2005) implied that the
Pacific Islands are at risk from dengue virus that is transmitted through trade and travel activities.
The vulnerability of these islands to dengue virus is increased for those receiving travelers and
are trading with South East Asia, which is one of the regions recording the highest global dengue
burden (Singh et al., 2005). Furthermore, inadequate vector control and surveillance at the ports
of entries and the ideal climatic situations amplify risks for dengue epidemics in the Pacific
(Singh et al., 2005). There were repeated epidemics caused by the four dengue viruses in some
Pacific Islands since 1971. There were two large epidemics in Fiji with clinical evidence of
dengue occurrence every year for the past twenty years (Fagbami et al., 1995). There were more
than 24,000 reported cases of dengue in the 1997/98 epidemic including 13 deaths (Prakash et
al., 2001). Singh et al. (2005) estimated the cost of the 1997/98 outbreak to be FJD12 million.
The cumulative dengue cases from January to June 2011 were 37, as compared to two cases for
the same period in 2010 (Dawainavesi 2011, pers. com).
A dengue virus infection may be asymptomatic or it may lead to undifferentiated viral fever
syndrome, dengue fever, dengue hemorrhagic fever or dengue shock syndrome. The clinical case
definition for these stages of dengue described here is adopted from the Fiji Center of
Communicable Diseases Control and other cited literature. The case definition for dengue fever
includes the presence of fever (more than 38°C) and two or more of the following, retro-orbital
pain, headache, rash, myalgia, arthralgia and hemorrhagic manifestations. Dengue hemorrhagic
fever is characterised by fever lasting from two to seven days, evidence of hemorrhagic
manifestation or a positive tourniquet test, thrombocytopenia, evidence of plasma leakage or
pleural effusion. Dengue shock syndrome is defined as having all criteria for dengue
hemorrhagic fever plus circulatory failure shown by rapid and weak pulse and narrow pulse
pressure, or age-specific hypotension and cold, clammy skin and restlessness. Dr. Sheetal, an
epidemiologist with the Ministry of Health explained that in Fiji, the case definition for dengue
varies depending on the commonly presented symptoms during an epidemic (Sheetal 2012, pers.
com). WHO (2009b) implied that the changes in the epidemiology of dengue has made it
impossible to follow WHO’s guideline in dengue diagnosis and classification. Conclusive
16
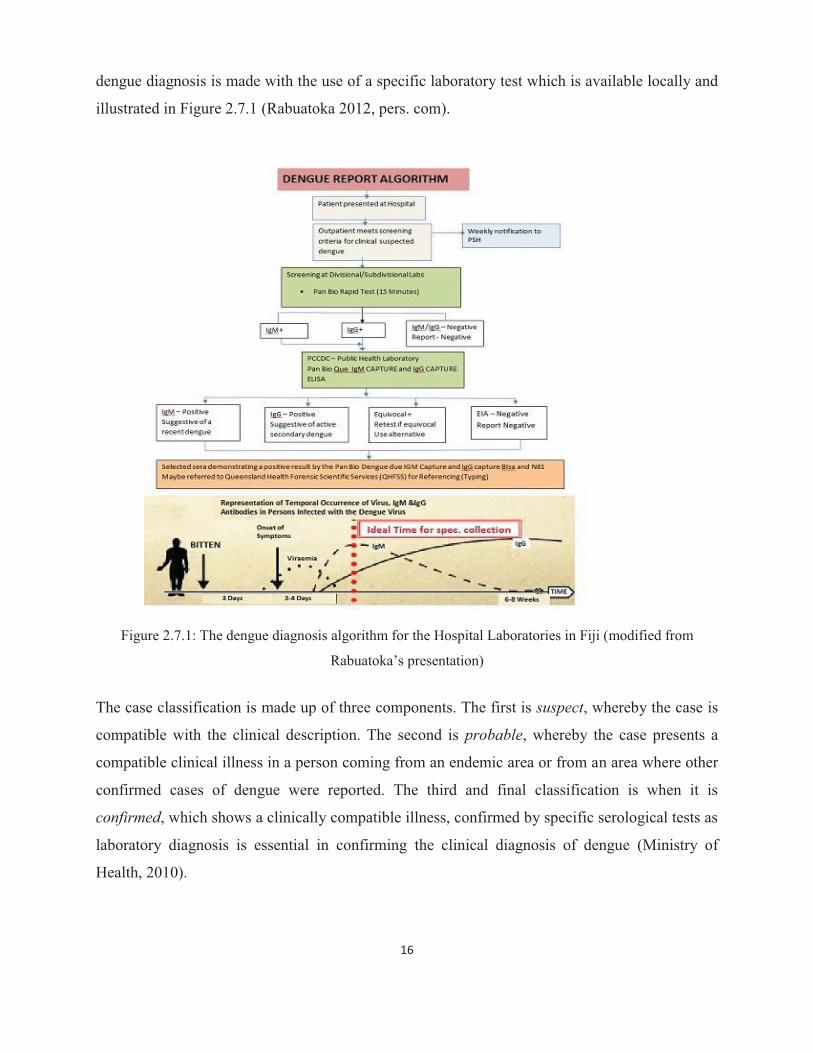
dengue diagnosis is made with the use of a specific laboratory test which is available locally and
illustrated in Figure 2.7.1 (Rabuatoka 2012, pers. com).
Figure 2.7.1: The dengue diagnosis algorithm for the Hospital Laboratories in Fiji (modified from
Rabuatoka’s presentation)
The case classification is made up of three components. The first is suspect, whereby the case is
compatible with the clinical description. The second is probable, whereby the case presents a
compatible clinical illness in a person coming from an endemic area or from an area where other
confirmed cases of dengue were reported. The third and final classification is when it is
confirmed, which shows a clinically compatible illness, confirmed by specific serological tests as
laboratory diagnosis is essential in confirming the clinical diagnosis of dengue (Ministry of
Health, 2010).
17
2.8 Dengue and climate change The 1997/98 epidemic was the worst in Fiji with about 24,000 cases, 17,000 hospital admissions
and 13 deaths occurred during a severe drought period relating to the El Niño event (de Wet &
Hales, 2000). Local climate changes associated with ENSO affects dengue occurrence by
causing changes in household water storage practices and surface water pooling (Hales et al.,
2003). It is further confirmed that between 1970 and 1995, the annual number of dengue
epidemics in the South Pacific was positively correlated with La Niña conditions (i.e. warmer
and wetter) (WHO, 2003; Hales et al., 1999; Degalier et al., 2009). This is significant in terms of
water storage practices in affected areas that create favourable breeding grounds for the Aedes
aegypti vector. Therefore, whilst the mosquito vector is traditionally associated with rainfall and
unprotected tins, tyres and discarded containers, the 1997/98 epidemic provides evidence that
very dry conditions and water scarce areas have the ability to produce the dengue vector which
may ultimately lead to an epidemic. Degalier et al. (2009, 582) referred to the availability and
nature of the water holding containers in exerting a primary control on the vector population as
‘environmental controls’, while temperature, humidity and rainfall were classified as ‘climatic
controls’.
Rainfall and temperature (ambient) are the key climate components contributing to dengue
epidemic risk in Fiji (de Wet & Hales, 2000). In the Asia-Pacific region, temperature, rainfall and
relative humidity are seen as important climatic factors contributing to the growth and dispersion
of the mosquito vector and dengue outbreaks (de Wet & Hales, 2000; Patz et al., 2005). The study
by Pham et al. (2011) recommended that mosquito surveillance and control should be intensified
during the hot and rainy seasons. It is observed that the environmental health team in Fiji has a
similar program that is intensified during the rainy seasons, showing that the association of
dengue outbreaks and climatic factors is recognised in the country. However, it is notable that
rainfall, by itself, is not a useful predictor of epidemic risk, but the abundance of breeding sites
which is important in terms of adaptation to climate change (de Wet & Hales, 2000). This
highlights that mosquito population increases due to the availability of the stagnant water that was
collected during the rainy period. In addition the humid conditions are suitable for adult mosquito
viability. On the other hand, very hot and dry conditions can reduce mosquito survival (de Wet &
Hales, 2000; Githeko et al., 2000).

18
A descriptive study in Venezuela confirmed that climate variability has a strong influence on
dengue (Harrera-Martinez & Rodriguez-Morales, 2010). Studies have shown that dengue
occurrence is affected by the climatic conditions of temperature, humidity and rainfall (Shope,
1991; Hales et al., 1999; de Wet & Hales, 2000; Githeko et al., 2000; WHO, 2003; Degallier et
al., 2009; Banu et al., 2011). Pham et al. (2011) reported that mosquito indices and climatic
factors are the principal determinants of dengue fever in Vietnam as dengue is a leading cause of
severe illness and hospitalisation in the country. The study used monthly data of dengue and
ecological factors of temperature, sunshine, rainfall and humidity between 2004 and 2008 in a
province of Vietnam (Pham et al., 2011). A similar study which focused on El Niño event and
vector borne disease transmission by Hales et al. (1999) in the Pacific, showed that there was not
only a positive correlation between the southern oscillation index and dengue fever in some
Pacific Islands but there was also a positive correlation between the southern oscillation index
and estimates of local temperature and rainfall. Moreover, the local climate changes associated
with ENSO tend to trigger an increase in the transmission of the dengue virus in the larger, more
populated islands such as Fiji, where dengue fever is endemic (Hales et al., 1999). The two aims
for verifying the association between dengue and climate is to forecast dengue outbreaks, and
understand and be receptive to changing processes such as global climate change (Hales et al.,
1999).
Another study was conducted using empirical model to confirm the global association between
climate change and vector borne disease transmission. The study concluded that climate change
may increase spatial suitability for dengue fever transmission exposing a large proportion of the
human population to dengue risk (Hales et al., 2002). It is considered crude to assume that the
current and future dengue incidence and distributions are dependent on climate only. Moreover,
it is important to consider the relations between humans, the vector and environment, which are
all important for disease transmission (Hales et al., 2002; WHO, 2003; Degallier et al., 2009).
The details pertaining to ‘web of interactions’ and ‘other determinants’ is covered in Section 2.4.
These other factors also have the capacity to mediate the direct impacts of climate change on
dengue. Theoretical models which use retrospective data as predictive models are important tools
for public health interventions and policy makers. It is recommended that such models be refined
for micro-units such as districts, villages and communities showing the relationships between the
unit’s microclimate and non-climatic factors and dengue risk (Thai & Anders, 2011).

19
2.9 Modeling dengue and climate change The use of models can be a powerful tool to predict future scenarios, for instance, to assist in
preparing for disasters or disease outbreaks (Githeko, 2000). Models are useful in climate change
and dengue research to create an understanding of the relationship between the biology of
vectors, pathogens, their ecosystems and the socio-economic status of the affected populations.
Models predispose the capacity to predict future disease impacts using short and long-term
climate data forecasts (Githeko, 2000). Scientific researchers have highlighted the use of models
that explore climate variability with respect to dengue transmission (Thai & Anders, 2011; Otero
et al., 2011). The effects of climate change are used as required input parameter and variable
endpoints for models of dengue and climate (Thai & Anders, 2011; Otero et al., 2011).
Scientific literature, as highlighted in this review, suggests that long-term changes in global
climate have significant effects on the incidence of dengue. Therefore, it is necessary to use the
existing knowledge and data of the relationship between climate change and variability and
dengue incidence to explore and describe the exposure of the communities in Fiji to this
relationship. Since various methodologies and tools are available to forecast and prevent
epidemics, not one tool should be used in isolation, thus the combination of statistical and
mathematical methods and models should be considered (Degallier et al., 2009; Van Kleef et al.,
2009).
There is a need to learn more about the underlying causal-effect relationship (climate and
dengue) with the use of integrated models which can predict the future impacts of climate change
on infectious diseases (WHO, 2003). Models may predict the ‘when’ and ‘where’ the event
(disease/epidemic) could occur but it cannot be confirmed as other factors of vaccine, vector
control, public health surveillance, and changes in economy and public awareness may positively
alter the future pattern of infectious disease transmission (McMichael & Woodruff, 2008).
2.9.1 Mathematical models Mathematical modeling of infectious diseases aims to provide knowledge on the biological and
ecological factors that drive the historical and current trends, and make predictions of future
patterns and intensities of disease transmission (Thai & Anders, 2011). Mathematical models
have an integrated set of equations that expresses the climate-disease relationship mathematically
(McMichael & Woodruff, 2008). The use of mathematical models have predicted significant
20
growth in the spread of vector borne diseases, however, criticisms show that vital contributing
risk factors and conditions, such as socio-economic issues, were not adequately considered as
recommended by Thai & Anders (2011) (see also Hales et al., 1999). Thai and Anders (2011)
stated that the relative contribution of the dengue virus, the human host and the mosquito vector
and ecological factors are measured in the use of mathematical models of dengue transmission.
However, the measurement may be more qualitative than quantitative (Thai & Anders, 2011).
Blanco and Hernandez (2008) stated that the use of mathematical modeling (biological model) in
dengue and climate change is limited to a transmission cycle of a few weeks. It is therefore,
suitable for predicting short termed epidemics in specified sites contrary to the long termed
regional nature of climate change process.
2.9.2 Empirical models Empirical modeling is a statistical approach of expressing the currently observed association of
the geographical distribution of the disease and climatic conditions and the same equation is used
to model the required future climate development (McMichael & Woodruff, 2008). The
statistical-empirical approach is used in global modeling studies; for instance, see Hales et al.
(2002) and Blanco and Hernandez (2008). Blanco and Hernandez (2008) used this empirical
model to predict how climate change may influence the incidence of dengue fever outbreaks in
Colombia. The study combined database for the reported dengue cases (2000-2005) and
temperature and precipitation from 1995 to 2005 with demographic information included. The
two statistical models used were cross sectional analysis, which explained the level of epidemics
with climate and socioeconomic variables, and inter-temporal analysis to prove that the changes
in the reported cases of dengue are influenced by the variation of temperature and precipitation.
The study found that while temperature is significantly related to the incidence of dengue, it
cannot be proved that climate change is causing a rise in dengue cases for the years 2000-2005 in
Colombia. With the use of IPCC (2007) future scenarios for temperature and precipitation
additional cases of dengue for a six-year period were calculated to show the increase of dengue
for a 50 and 100 year future scenario. The present study used statistical analysis to ascertain the
association between dengue incidence and climate variability and change and made explored
some regression analysis using SPSS and STATA. However, this did not expand into predictive
modeling.
21
2.10 Chapter conclusion From the papers that were reviewed, some expressed concern at the lack of evidence or unclear
findings which prompted them to recommend further research in certain areas of climate change
and human health, particularly in relation to dengue (Thai & Anders, 2011). This chapter
presented some studies that were conducted to examine the impacts of climate change on human
health, specifically in relation to how it influences dengue occurence. The review in this chapter
signifies that global climate change has the potential to influence dengue incidence. The
methodologies used in the studies reviewed gave insight to the researcher in conducting the
current study. In addition, this literature review was used in some of the results and discussion
areas. The next chapter details the study approach utilised for this study in Fiji.
22
CHAPTER THREE STUDY SITES AND METHODOLOGY
3.1 Chapter introduction This chapter begins by outlining the study sites for this research. The research methods that were
used in this research are then described in detail. This chapter then provides details on the data
collection techniques that were utilised. These techniques allowed for a diverse mixture of data
to be collected, including local climatic data, health data and primary data from household
questionnaires and interviews with key informants at each of the study sites. Finally, details are
provided on how this data was analysed, as well as a discussion on some of the key challenges
and limitations of this research.
3.2 Study sites The study sites were selected through multistage sampling. The sites were identified after a
descriptive analysis of the set of data from the Health Information Unit of the Ministry of Health
in Suva. The districts of Ba, Lautoka and Nadroga were selected because of the consistent and
high number of dengue cases reported particularly during epidemics. The Health Information
Unit data is sourced from the National Notifiable Diseases Surveillance System (NNDSS) that
records cases of dengue reported monthly from health facilities in Fiji. The Public Health Act of
Fiji specifies in Part VII, Section 71 (1), (2) with reference to the First Schedule, that dengue is a
notifiable disease requiring to be reported weekly to the Permanent Secretary for Health.
Therefore, the NNDSS data was used as reference to identify the study sites that would indicate
the presence of dengue within the studied period. However, it needs to be understood at this
stage that these cases reported to NNDSS are not necessarily confirmed dengue cases. This study
recorded dengue incidence as ‘positive’ cases at the district laboratories, divisional laboratory of
Lautoka and the national reference laboratory in Tamavua, Suva (Figure 2.7.1). In addition, ‘in-
patients’ at the three hospitals diagnosed with dengue were accounted for dengue incidence as
well.
At the district health offices in Ba, Lautoka and Nadroga, the ‘line list’ (of reported cases from
medical officers) of the 2003 and 2008 dengue outbreaks was used to identify clusters to be case-
studied. The definition of cluster was used by Loh and Song (2001, 1) in a study in Singapore: ‘a
dengue cluster is defined as at least two cases located within 200 meters of each other and whose
dates of the onset of symptoms are within three weeks of each other’. Thus, Tauvegavega in Ba,
23
Natabua Housing in Lautoka and Nayawa residential area in Nadroga are the case study
communities selected after the process of cluster identification and convenience factor was
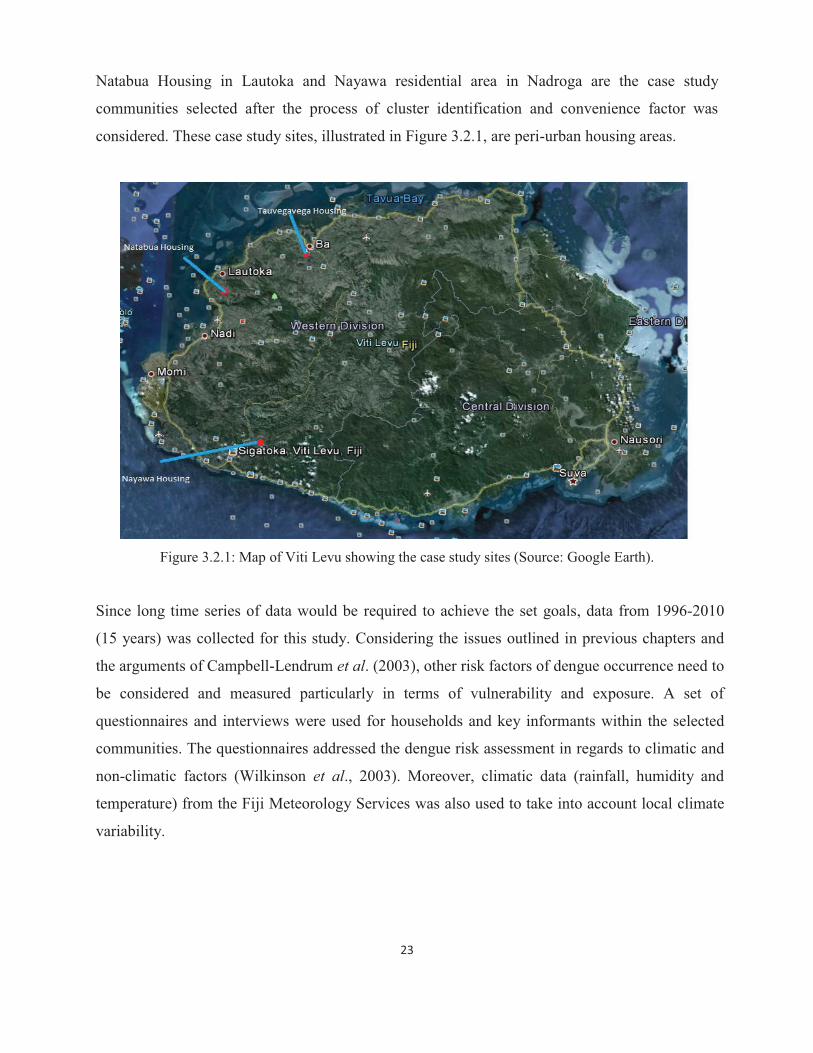
considered. These case study sites, illustrated in Figure 3.2.1, are peri-urban housing areas.
Figure 3.2.1: Map of Viti Levu showing the case study sites (Source: Google Earth).
Since long time series of data would be required to achieve the set goals, data from 1996-2010
(15 years) was collected for this study. Considering the issues outlined in previous chapters and
the arguments of Campbell-Lendrum et al. (2003), other risk factors of dengue occurrence need to
be considered and measured particularly in terms of vulnerability and exposure. A set of
questionnaires and interviews were used for households and key informants within the selected
communities. The questionnaires addressed the dengue risk assessment in regards to climatic and
non-climatic factors (Wilkinson et al., 2003). Moreover, climatic data (rainfall, humidity and
temperature) from the Fiji Meteorology Services was also used to take into account local climate
variability.
24
3.3 Overview of method
The study was non-experimental and it used a causal-comparative type of research. The variables
included the dengue incidence as the dependent variable and the temperature, humidity and
rainfall were the independent variables. Socio-economic status, environmental sanitation (in the
form of availability of mosquito breeding and harboring sites) and protection against mosquito
bites were the confounding variables that were considered.
The research undertaken in finding the association between dengue incidence and climate
variables and change adopted a combination of methods from the cited literature with the
exclusion of modeling. Herrera-Martinez and Rodriguez-Morales (2010), in a study in Venezuela,
used a descriptive method to collate historical data of reported cases of dengue from its western
pediatric hospital. Moreover, it used epidemiological data of weekly records of confirmed dengue
cases from 2001-2008, in children below the age of eighteen. This research in Fiji adopted this
method and used data pertaining to three different subdivisions in the Western Division of Viti
Levu.
Campbell-Lendrum et al. (2003) also influenced the choice of research methods adopted for this
study. They asserted that any prediction of health impacts of future climate change depends on the
changes that have taken place so far and such measurements would take several decades.
Therefore, the selection of study sites relied on long-term records available at the Ministry of
Health Information Unit, Fiji and available climate data at the Fiji Meteorology Services.
3.4 Data collection techniques
3.4.1 Secondary data
The approval of the National Health Research Committee was obtained prior to commencement
of data collection. Dengue data for the years 1996-2010 was searched for in triangulation within
the hospitals of the study areas and this included the Ba Mission Hospital, Lautoka Hospital and
Sigatoka Hospital in Nadroga. The sources of data used were the serology registers within the
hospital laboratories, the in-patient registers or PATIS (Patient Information System) and the
notifiable diseases files for Ba. Unfortunately, notifiable disease files were non-existent in
Lautoka Hospital and to some extent for Sigatoka Hospital. During data sorting the notifiable
25
diseases records were omitted since two hospitals did not have complete records available. Data
was inputted and recorded on the Excel spreadsheet. The researcher ensured that the cases were
entered only once unless being re-tested or re-admitted as a result of re-infection. Several follow
up visits to address the ‘gaps’ identified after the first set of data collection had to be made. The
‘gaps’ consisted of the following: missing or unclear information, such as residential addresses
or ages; double entries; and missing registers. Verification was conducted at the Fiji Center of
Communicable Diseases Control in Suva where the laboratory data collated was for the years
2003-2010. The data at the Center was not ‘locality specific’ and therefore was only useful to
validate part of the hospital data for Ba, Lautoka and Sigatoka Hospitals.
Missing data in this research is the result of ‘unfound’ registers. Missing information within the
available register affected the study in the categorising of cases into proper localities within the
studied subdivisions. The researcher faced a lot of challenges when searching registers in the
hospitals at Lautoka and Nadroga (Sigatoka), see Plate 1. Extensive in-patient and laboratory
registers’ searches were conducted in the two hospitals. Despite these efforts, the researcher
could not account for the dengue data for Lautoka for the periods January to December 1996,
January to June 1997 and January to March 2001; and for Sigatoka Hospital for the periods
January to December 1997 and 1998. The ultimate discovery of registers at the Lautoka Hospital
records division was the result of persistent requests made to the management at the hospital.
The Sigatoka Hospital laboratory could not produce any useful dengue test record as it did not
have the relevant serology registers. The Ba Mission Hospital records were well kept thus there
is no missing dengue data for Ba. The serology registers and the in-patient registers used by the
researcher in Ba Mission Hospital complemented each other.
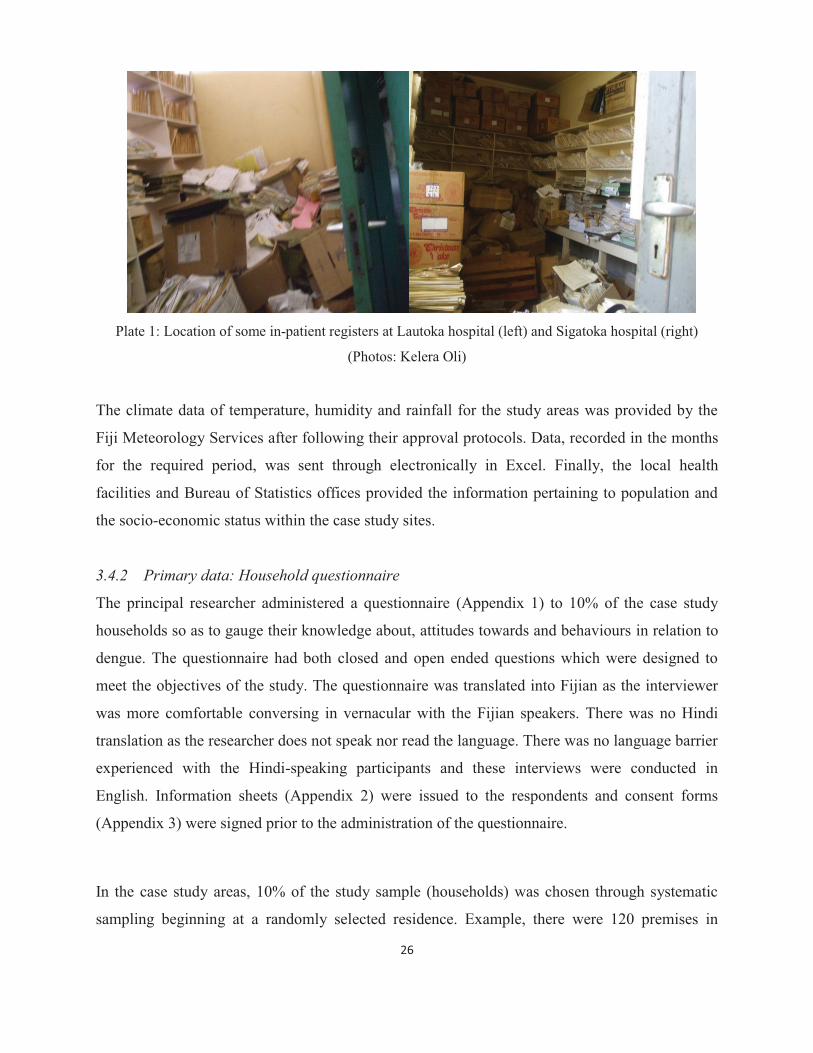
26
Plate 1: Location of some in-patient registers at Lautoka hospital (left) and Sigatoka hospital (right)
(Photos: Kelera Oli)
The climate data of temperature, humidity and rainfall for the study areas was provided by the
Fiji Meteorology Services after following their approval protocols. Data, recorded in the months
for the required period, was sent through electronically in Excel. Finally, the local health
facilities and Bureau of Statistics offices provided the information pertaining to population and
the socio-economic status within the case study sites.
3.4.2 Primary data: Household questionnaire
The principal researcher administered a questionnaire (Appendix 1) to 10% of the case study
households so as to gauge their knowledge about, attitudes towards and behaviours in relation to
dengue. The questionnaire had both closed and open ended questions which were designed to
meet the objectives of the study. The questionnaire was translated into Fijian as the interviewer
was more comfortable conversing in vernacular with the Fijian speakers. There was no Hindi
translation as the researcher does not speak nor read the language. There was no language barrier
experienced with the Hindi-speaking participants and these interviews were conducted in
English. Information sheets (Appendix 2) were issued to the respondents and consent forms
(Appendix 3) were signed prior to the administration of the questionnaire.
In the case study areas, 10% of the study sample (households) was chosen through systematic
sampling beginning at a randomly selected residence. Example, there were 120 premises in

27
Tauvegavega, the sample size was 12 premises; and the sampling fraction was 12/120 (1/10).
Thus, every 10th house after the 1st house was asked to complete a questionnaire. In total, twelve
households were surveyed in Tauvegavega (Ba), 22 in Natabua (Lautoka) and 10 in Nayawa
(Nadroga). In Nayawa, 10 houses were visited because there were only 40 premises in total and
the sample size should be at least 10. In cases where the premises were vacant, a return visit was
made and neighbouring premises were surveyed in places where the researcher could not get
responses. This included those that did not permit the researcher to conduct the questionnaire
survey in their premises, because certain people in authority were not at home or the premises
were closed as well as those who chose not to be part of the research.
3.4.3 Primary data: In-depth interviews
Key informants were asked to partake in an in-depth interview with the use of a semi-structured
interview guide (Appendix 4). Those interviewed included the Health Inspectors of the
municipalities and local authorities within the study sites. Eight key informants were interviewed
to assist in an assessment of the knowledge and behaviours of the main stakeholders during
dengue incidences. During the preliminary data collection phase, it was noted that the health
inspectors were the health professionals actively used in dengue prevention and control.
Referrals to the health inspectors by the medical officers in questions pertaining to dengue
confirmed these initial perceptions.
Other interviews conducted at the national level included the Quality Manager at the Fiji Center
for Communicable Disease Control laboratory; the Ministry of Health’s Senior Health Inspector
(Vector Control); and the Communicable Diseases Surveillance Officer (Epidemiologist) based
at the Ministry of Health Headquarters. The purpose of these interviews was to better understand
the following: the algorithm of the dengue confirmatory tests; the dengue diagnostic and
reporting protocols; the role of the vector control unit in dengue control, which contributes
towards recommending realistic preventative and control measures.
3.4.4 Observational survey
An observational survey was undertaken by the researcher to assess mosquito breeding and
harbouring, and subsequent protection against mosquito bites within the case study areas (see
28
Appendix 1). In addition to this survey, some notes were taken based on the researcher’s
participant observation of people within the case study area. This observation was limited to the
population present at the case study sites during the survey. The housing authority and Public
Rental Board units were assessed holistically as a building of three to four units where individual
assessment could not be conducted. Particular attention was given to the refuse, which included
containers capable of holding water, along with the storage of tyres, water drums, and the
overgrowth of grass and shrubs within the compounds (see Plate 2).
Plate 2: Mosquito breeding ground in Tauvegavega, Ba (Photos: Kelera Oli)
3.5 Data processing and analysis
The dengue raw data collected from the field was sorted, cleaned and prepared for analysis. The
Fiji Meteorology Services climate data was ready to use in Excel for analysis. The data was used
in Excel for time series analysis and then copied to the Statistical Package for the Social Sciences
(SPSS, version 16.0) for analysis pertaining to ‘correlations’ with the dengue incidence data. The
questionnaires and interviews were checked and verifications were made if necessary. The
relevant questions and answers were coded for the purposes of statistical analysis. Data input
into SPSS was conducted and relevant analyses were undertaken and recorded (Chapter 4). A
summary of the questionnaires and interviews was tabulated for simple descriptive analysis.
29
The two analysis programs used in this study were Excel and SPSS. Specifically, frequency,
cross tabulation, correlation and regression were all utilised. First, the time series analysis
pertaining to dengue and climate variables was done for the three sub divisions using the cleaned
data in Excel. Then the data was transferred into SPSS for further statistical analysis. Significant
outcomes from the statistical analysis are included in the results and analysis sections. The
STATA program was also explored for trial modeling with the assistance of the University’s
Research Statistician. Further analysis of the dengue data for the three case study areas was
conducted to show dengue incidence comparatively to other localities within the studied
subdivision. The researcher also attempted to show the local infection or transmission pattern
within the study sites for the epidemic years of 2003 and 2008 with the use of mapping availed
from Google earth. Data coded from the questionnaire into SPSS was statistically analysed to
describe correlations of non-climatic factors and dengue incidence. Missing data was handled as
missing values and imputed according to the replacing methods used in SPSS for the fair and
complete distribution of data in analysis.
3.6 Challenges and limitations
The researcher encountered a number of challenges and subsequent limitations while
undertaking this research. The main limitation was the time taken for approval of the research by
the National Health Research Committee. The process took six months before the Ministry of
Health approved the study. In terms of the registers, two aspects posed limitations to the study-
missing registers and incomplete entries within the available registers. For the missing registers,
the hospital laboratory registers and in-patient registers were used to complement each other;
however, there was a shortfall in register storage in Lautoka and Sigatoka hospitals that resulted
in some missing values. For the incomplete entries, the registers had missing information that
had to be cross-checked in the Patient Information System (PATIS) or interview with the
laboratory technicians and the hospital recorders. As for the questionnaires and key informants
interviews, the effective use of these techniques in this research required the researcher to make
return trips to the study sites as the people were not all available on the first two visits.
30
3.7 Chapter conclusion
This chapter has described the details of the research conducted and the literatures that
influenced the adopted methodology. The challenges faced by the researcher are not new as
mentioned in Chapter 1. One of the difficulties in studying the health impacts of climate
variability and change is the unavailability or limited access to climatic and health data at the
same temporal and geographical scale (Ebi et al., 2003). Therefore, care must be exercised in
analysing and interpreting this data, which will be explored in-detail in the chapters to follow. It
is vital to keep these difficulties in mind and appreciate how the researcher used previous studies
to accommodate the challenges.
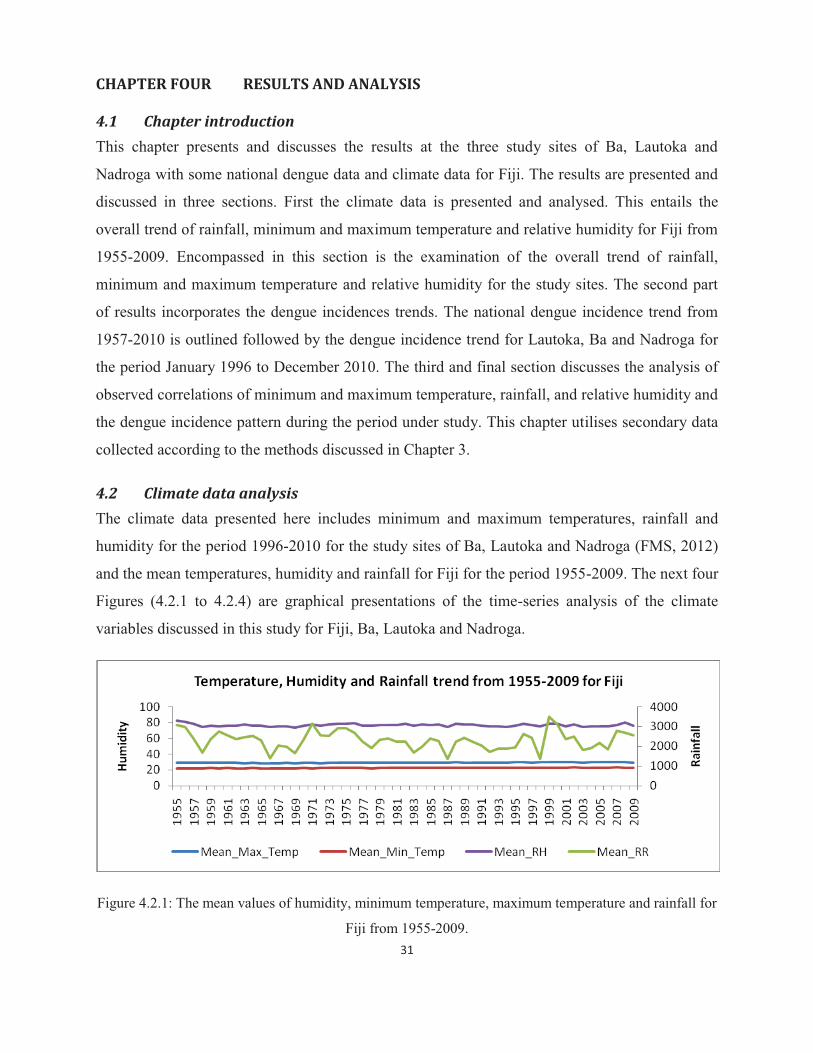
31
CHAPTER FOUR RESULTS AND ANALYSIS
4.1 Chapter introduction This chapter presents and discusses the results at the three study sites of Ba, Lautoka and
Nadroga with some national dengue data and climate data for Fiji. The results are presented and
discussed in three sections. First the climate data is presented and analysed. This entails the
overall trend of rainfall, minimum and maximum temperature and relative humidity for Fiji from
1955-2009. Encompassed in this section is the examination of the overall trend of rainfall,
minimum and maximum temperature and relative humidity for the study sites. The second part
of results incorporates the dengue incidences trends. The national dengue incidence trend from
1957-2010 is outlined followed by the dengue incidence trend for Lautoka, Ba and Nadroga for
the period January 1996 to December 2010. The third and final section discusses the analysis of
observed correlations of minimum and maximum temperature, rainfall, and relative humidity and
the dengue incidence pattern during the period under study. This chapter utilises secondary data
collected according to the methods discussed in Chapter 3.
4.2 Climate data analysis The climate data presented here includes minimum and maximum temperatures, rainfall and
humidity for the period 1996-2010 for the study sites of Ba, Lautoka and Nadroga (FMS, 2012)
and the mean temperatures, humidity and rainfall for Fiji for the period 1955-2009. The next four
Figures (4.2.1 to 4.2.4) are graphical presentations of the time-series analysis of the climate
variables discussed in this study for Fiji, Ba, Lautoka and Nadroga.
Figure 4.2.1: The mean values of humidity, minimum temperature, maximum temperature and rainfall for
Fiji from 1955-2009.
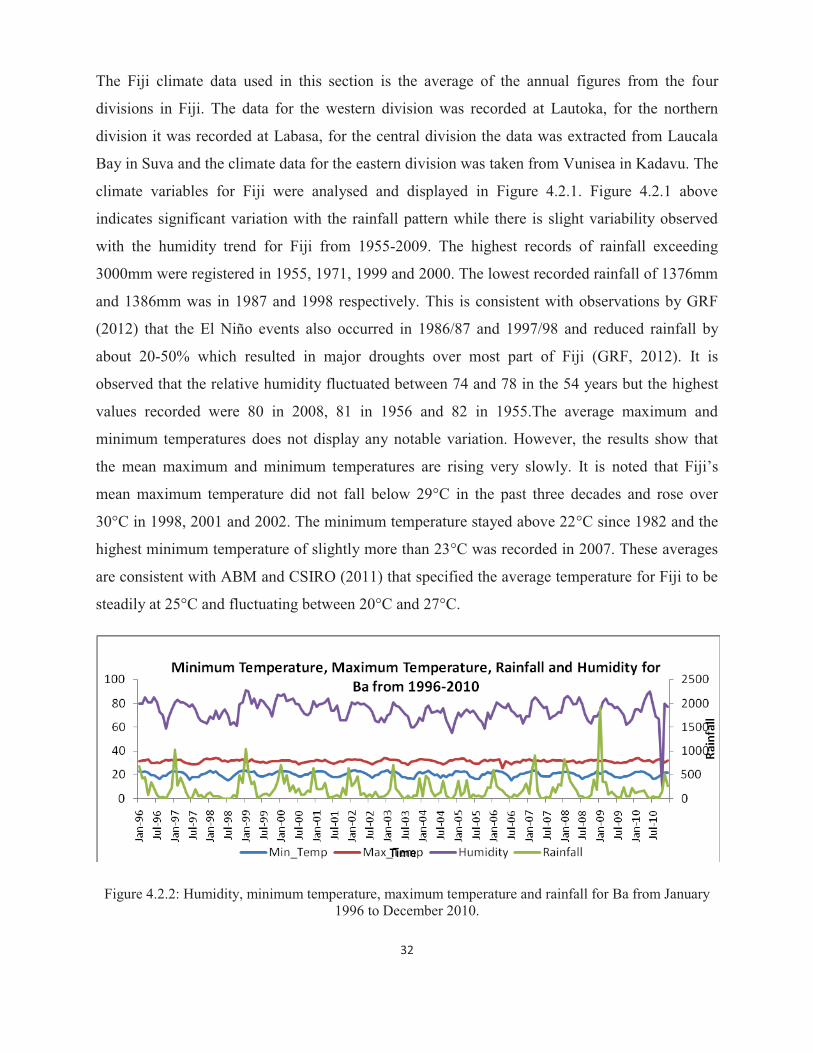
32
The Fiji climate data used in this section is the average of the annual figures from the four
divisions in Fiji. The data for the western division was recorded at Lautoka, for the northern
division it was recorded at Labasa, for the central division the data was extracted from Laucala
Bay in Suva and the climate data for the eastern division was taken from Vunisea in Kadavu. The
climate variables for Fiji were analysed and displayed in Figure 4.2.1. Figure 4.2.1 above
indicates significant variation with the rainfall pattern while there is slight variability observed
with the humidity trend for Fiji from 1955-2009. The highest records of rainfall exceeding
3000mm were registered in 1955, 1971, 1999 and 2000. The lowest recorded rainfall of 1376mm
and 1386mm was in 1987 and 1998 respectively. This is consistent with observations by GRF
(2012) that the El Niño events also occurred in 1986/87 and 1997/98 and reduced rainfall by
about 20-50% which resulted in major droughts over most part of Fiji (GRF, 2012). It is
observed that the relative humidity fluctuated between 74 and 78 in the 54 years but the highest
values recorded were 80 in 2008, 81 in 1956 and 82 in 1955.The average maximum and
minimum temperatures does not display any notable variation. However, the results show that
the mean maximum and minimum temperatures are rising very slowly. It is noted that Fiji’s
mean maximum temperature did not fall below 29°C in the past three decades and rose over
30°C in 1998, 2001 and 2002. The minimum temperature stayed above 22°C since 1982 and the
highest minimum temperature of slightly more than 23°C was recorded in 2007. These averages
are consistent with ABM and CSIRO (2011) that specified the average temperature for Fiji to be
steadily at 25°C and fluctuating between 20°C and 27°C.
Figure 4.2.2: Humidity, minimum temperature, maximum temperature and rainfall for Ba from January 1996 to December 2010.

33
Figure 4.2.3: Humidity, minimum temperature, maximum temperature and rainfall for Lautoka from January 1996 to December 2010.
Figure 4.2.4: Humidity, minimum temperature, maximum temperature and rainfall for Nadroga from January 1996 to December 2010.
The monthly weather pattern for the three districts of Ba, Lautoka and Nadroga are similar as
illustrated in figures 4.2.3-4.2.5. This is attributable to their locations on the drier side of Viti-
Levu as explained by ABM and CSIRO (2011) that the lowlands of the western side are
sheltered by the mountains and have an annual average rainfall of 1,800mm with a well-defined
dry season favourable to crops such as sugar cane. It is observed that November to March
recorded the highest rainfall with January being the wettest month for the three sites. The peak in
rainfall for January 2009 caused heavy flooding in the western division, including the three study
sites. Ba district records the highest monthly mean rainfall as compared to the other two sites.
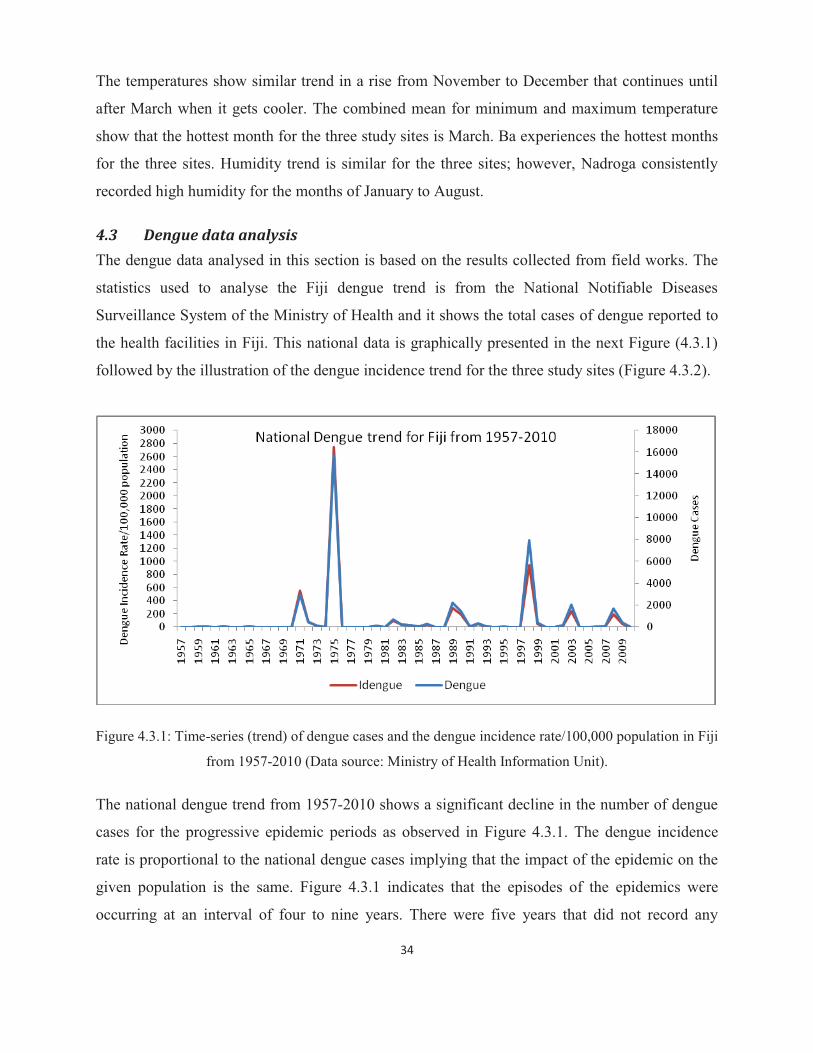
34
The temperatures show similar trend in a rise from November to December that continues until
after March when it gets cooler. The combined mean for minimum and maximum temperature
show that the hottest month for the three study sites is March. Ba experiences the hottest months
for the three sites. Humidity trend is similar for the three sites; however, Nadroga consistently
recorded high humidity for the months of January to August.
4.3 Dengue data analysis The dengue data analysed in this section is based on the results collected from field works. The
statistics used to analyse the Fiji dengue trend is from the National Notifiable Diseases
Surveillance System of the Ministry of Health and it shows the total cases of dengue reported to
the health facilities in Fiji. This national data is graphically presented in the next Figure (4.3.1)
followed by the illustration of the dengue incidence trend for the three study sites (Figure 4.3.2).
Figure 4.3.1: Time-series (trend) of dengue cases and the dengue incidence rate/100,000 population in Fiji
from 1957-2010 (Data source: Ministry of Health Information Unit).
The national dengue trend from 1957-2010 shows a significant decline in the number of dengue
cases for the progressive epidemic periods as observed in Figure 4.3.1. The dengue incidence
rate is proportional to the national dengue cases implying that the impact of the epidemic on the
given population is the same. Figure 4.3.1 indicates that the episodes of the epidemics were
occurring at an interval of four to nine years. There were five years that did not record any

35
incidence of dengue from 1957-2010. It was not specified if the recorded ‘0’ for those five years
were missing data and unreported cases or there was not any dengue occurrence. However, all
other years had records of dengue cases, indicating that clinical dengue continued to be present
even in non-epidemic years. The epidemic in 1975 recorded the highest number of dengue cases
followed by the 1997/98 outbreak which registered almost 50% less cases than the 1975
epidemic. It is worthy to note that one of the high annual rainfall (2918mm) years for Fiji was
recorded in 1975 and on the contrary 1997/98 was a dry period as the result of El Niño (Figure
4.2.1). This result suggests that even though dengue infection is not directly affected by rainfall,
it is enhanced by the vector density which is favoured by both conditions experienced in 1975
and 1997/98. The rainy condition of 1975 and the dry spell of 1997/98 may have occurred at a
time of inconsistent vector control and surveillance in Fiji resulting in an increase in mosquito
breeding containers. Ensuing sections in this chapter explain these occurrences. In addition,
Fagbami et al. (1995) and Andre et al. (1992) explained that the 1989 epidemic peaked in
October and November 1989 recording about 900 incidences of dengue. It is noted that this is at
the end of the cooler dry season from May to October for Fiji and the prolonged impacts of the
1986/87 drought could have exacerbated the dengue epidemic (ABM & CSIRO, 2011). The
climatic condition for this period is conducive for the development of the aedes mosquito
(WHO, 2003; Patz et al., 2005). Unlike the national dengue presentation, the dengue incidence
(cases) results of the study sites (Figure 4.3.2) and discussion will be restricted to the period
under review (1996-1020).
Figure 4.3.2: Dengue Incidence Trend for Lautoka, Ba and Nadroga for the period January 1996 to
December 2010.
36
Figure 4.3.2 shows that the three peaks of dengue epidemics are similar in 1998, 2002/03 and
2008/09 for the three study sites except for Nadroga, 1998 (missing data). The time series graphs
of dengue incidence in Figures 4.3.1 and 4.3.2 show similar epidemic ‘spikes’ indicating that the
epidemics affected the whole of Fiji and not only the study sites. Figure 4.3.1 displays National
Notifiable Diseases Surveillance System data, which includes all reported cases. In Figure 4.3.2,
Lautoka records the highest number of dengue cases as compared to Ba and Nadroga. It is
noteworthy to consider that there were missing data for the one and a half year preceding the
1997/98 epidemic. However, it is still observed that there is an earlier peak for Lautoka as
compared to Ba and Nadroga. Lautoka starts registering dengue cases two to three months earlier
than the other two study sites. This may indicate that the epidemic started in Lautoka before it
expanded to the other nearby districts in the western division. Lautoka is the central business
district for the western division and also accommodates the divisional hospital, which could
explain the reason Lautoka recorded the highest number of dengue cases which quickly peaked
for the three epidemics. The 1998 epidemic shows that the first individual cases were reported in
1997, in the months of November and December respectively, for Ba and Lautoka. It peaked in
the months of January to March with the last cases reported in May for Ba and June for Lautoka.
In 2002, Ba recorded dengue incidence sporadically in six months as compared to Lautoka and
Nadroga recording cases only towards the end of the year. Lautoka records its highest number of
cases in November 2002; Ba and Nadroga dengue cases peaked in the months of March and
April 2003, three months after it peaked for Lautoka. All three sites recorded their last cases in
the month of July with Lautoka and Ba recording another one to two cases at the end of the year.
In 2008, Lautoka started recording cases from as early as January with no cases reported between
March and May before it slowly picked up again and peaked in August to September. The last
cases were reported in September 2009. Nadroga recorded its highest number of dengue cases in
September and this continued until January of 2009. On the other hand, Ba’s dengue cases in this
epidemic did not surpass nine for any of the seven months from August 2008 to March 2009.
The highest number of cases was recorded for Lautoka in September 2008 and it is the highest
number of dengue for the period under study. The three study sites contributed 18% of Fiji’s
dengue cases in the 2008/09 epidemic as compared to the two percent (2%) contribution in the
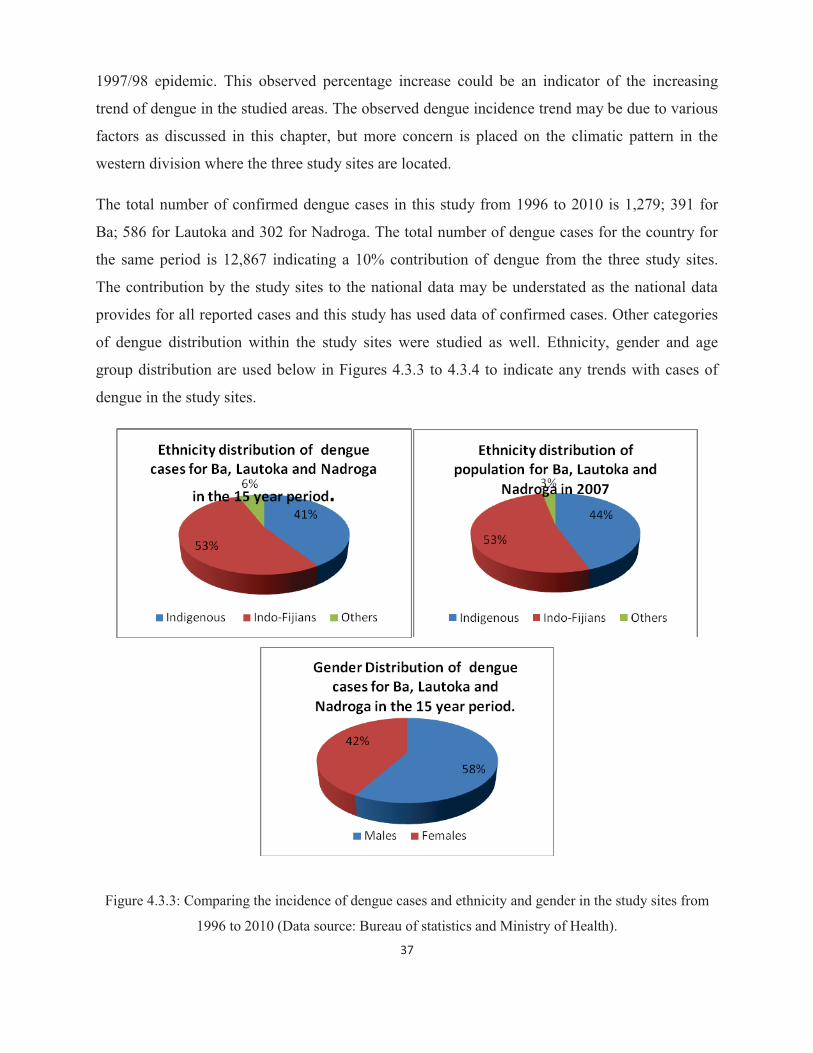
37
1997/98 epidemic. This observed percentage increase could be an indicator of the increasing
trend of dengue in the studied areas. The observed dengue incidence trend may be due to various
factors as discussed in this chapter, but more concern is placed on the climatic pattern in the
western division where the three study sites are located.
The total number of confirmed dengue cases in this study from 1996 to 2010 is 1,279; 391 for
Ba; 586 for Lautoka and 302 for Nadroga. The total number of dengue cases for the country for
the same period is 12,867 indicating a 10% contribution of dengue from the three study sites.
The contribution by the study sites to the national data may be understated as the national data
provides for all reported cases and this study has used data of confirmed cases. Other categories
of dengue distribution within the study sites were studied as well. Ethnicity, gender and age
group distribution are used below in Figures 4.3.3 to 4.3.4 to indicate any trends with cases of
dengue in the study sites.
Figure 4.3.3: Comparing the incidence of dengue cases and ethnicity and gender in the study sites from
1996 to 2010 (Data source: Bureau of statistics and Ministry of Health).

38
Figure 4.3.4: Comparing the age-group distribution and dengue incidence in the study sites from 1996 to
2010 (Data source: Bureau of statistics and Ministry of Health).
The study revealed that 53% of those who had dengue in the fifteen-year study period from the
three study sites were Indo-Fijians; 41% were indigenous Fijians and 6% belonged to other
ethnicities. In comparison to the 1989 epidemic, the national surveillance data revealed that there
were more indigenous Fijians (64%) than Indo-Fijians (31%) and the rest were from other
minority ethnic groups (Andre et al., 1992). There were more males than females affected and
the highest number of dengue patients was from the age of eleven to twenty closely followed by
those aged twenty one to forty years. The trend shows that the very active and younger age-
groups are more vulnerable than those in the older age demographics. Results of this study
indicate that the population below the age of forty has a higher risk of contracting dengue
particularly during an epidemic. The specific number of cases during the three epidemics
encompassed in the study period is shown in Table 4.3.1 below.
Table 4.3.1: Dengue Epidemic Incidence Table, demonstrating the dengue cases during the epidemic
years of the period under study.
Epidemic Years Ba Lautoka Nadroga Total
1997/98 94 77 Missing value 171
2002/03 222 280 146 648
2008/09 33 202 150 385
Total 349 559 296 1204
39
There were three epidemics of dengue during the study period (Table 4.3.1). Figure 4.3.1
illustrates the national dengue trend for Fiji while Figure 4.3.2 gives the pattern of dengue
incidence within the three study sites. The two graphs have the same epidemic periods but
opposite patterns in intensities. The national pattern (Figure 4.3.1) shows that the 1998 epidemic
was most severe with the highest number of reported cases, it decreased in 2002/03 and the least
numbers were reported in 2008/09 (reported cases). On the contrary, two of the study sites show
an increasing trend of dengue incidence for the three epidemics from 1998 to 2002/03 and
decreased in the 2008/09 epidemic. Table 4.3.1 shows that the 2002/03 epidemic was most
intense for the study sites with 648 cases. Considering that the study sites are in the hotter side of
Viti Levu and according to a review by Banu et al. (2011), climate change can affect the spatial
distribution of dengue as increasing temperatures could increase dengue transmission.
Furthermore, other factors to be considered in the different intensity patterns for Figures 4.3.1
and 4.3.2 include; population growth and urbanization in the western division of Viti Levu,
improved dengue vector control programs for other parts of Fiji and improvement in housing
conditions especially in the Suva area. Moreover, the enhanced border control activities
pertaining to disease vector surveillance is another activity that could have positive impacts in
addressing dengue virus transmission into the main centers with the ports of entry. The next
sections will explicitly look at the dengue incidence and its association with climate variables in
the study sites.
4.4 Time-series analysis of climate variables with dengue incidence The climate data used in this section is the same for Section 4.2 and the dengue data is collected
from the different study areas’ main health facility (as discussed in Section 4.3). The study sites
are individually analysed for correlations between dengue incidence and the climate variables.
Then time series and correlation analysis is conducted two-folds with dengue, minimum and
maximum temperatures first before dengue, rainfall and humidity as the second-fold for each
site. The next four Figures (4.4.1-4.4.4) are illustrations of the dengue incidence time-series as
compared with the minimum and maximum temperatures for the three study sites of Ba, Lautoka
and Nadroga.
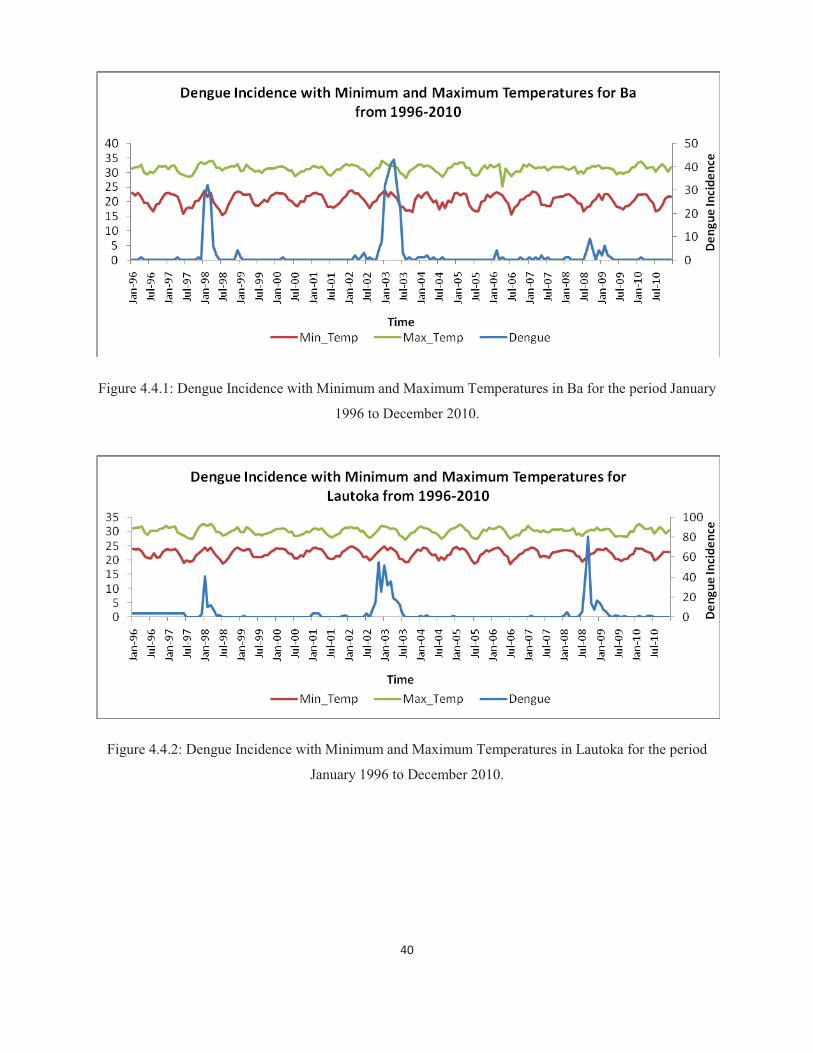
40
Figure 4.4.1: Dengue Incidence with Minimum and Maximum Temperatures in Ba for the period January
1996 to December 2010.
Figure 4.4.2: Dengue Incidence with Minimum and Maximum Temperatures in Lautoka for the period
January 1996 to December 2010.
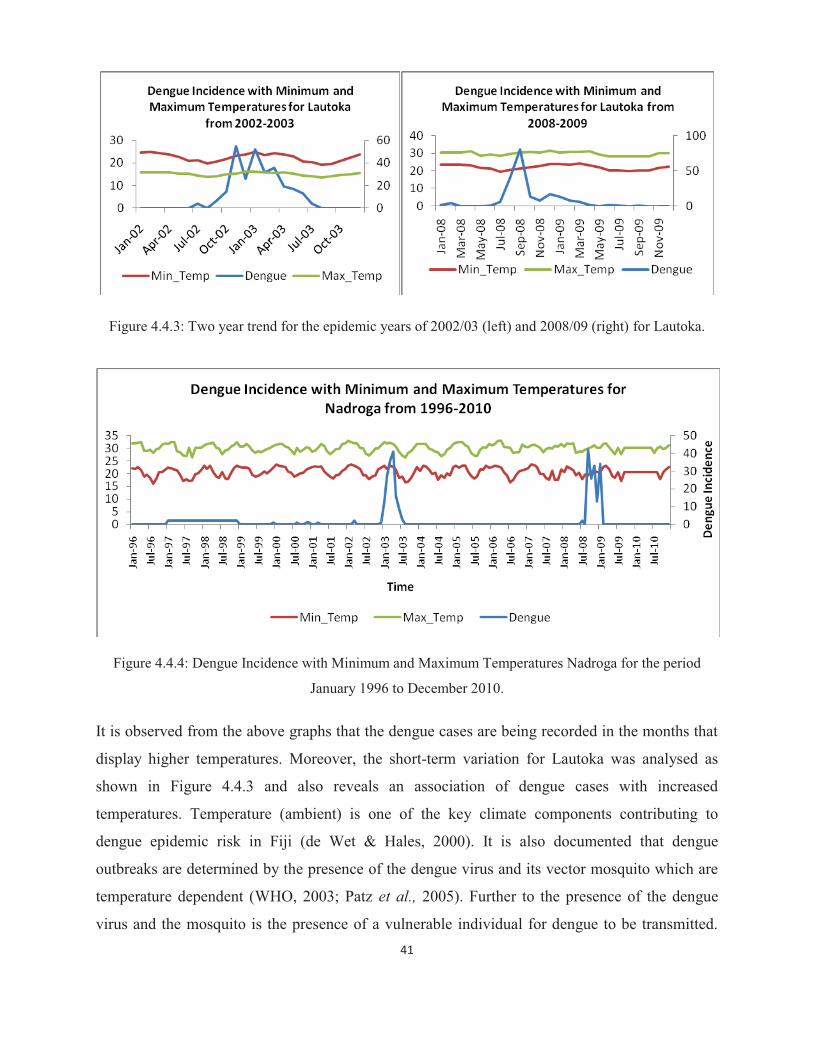
41
Figure 4.4.3: Two year trend for the epidemic years of 2002/03 (left) and 2008/09 (right) for Lautoka.
Figure 4.4.4: Dengue Incidence with Minimum and Maximum Temperatures Nadroga for the period
January 1996 to December 2010.
It is observed from the above graphs that the dengue cases are being recorded in the months that
display higher temperatures. Moreover, the short-term variation for Lautoka was analysed as
shown in Figure 4.4.3 and also reveals an association of dengue cases with increased
temperatures. Temperature (ambient) is one of the key climate components contributing to
dengue epidemic risk in Fiji (de Wet & Hales, 2000). It is also documented that dengue
outbreaks are determined by the presence of the dengue virus and its vector mosquito which are
temperature dependent (WHO, 2003; Patz et al., 2005). Further to the presence of the dengue
virus and the mosquito is the presence of a vulnerable individual for dengue to be transmitted.
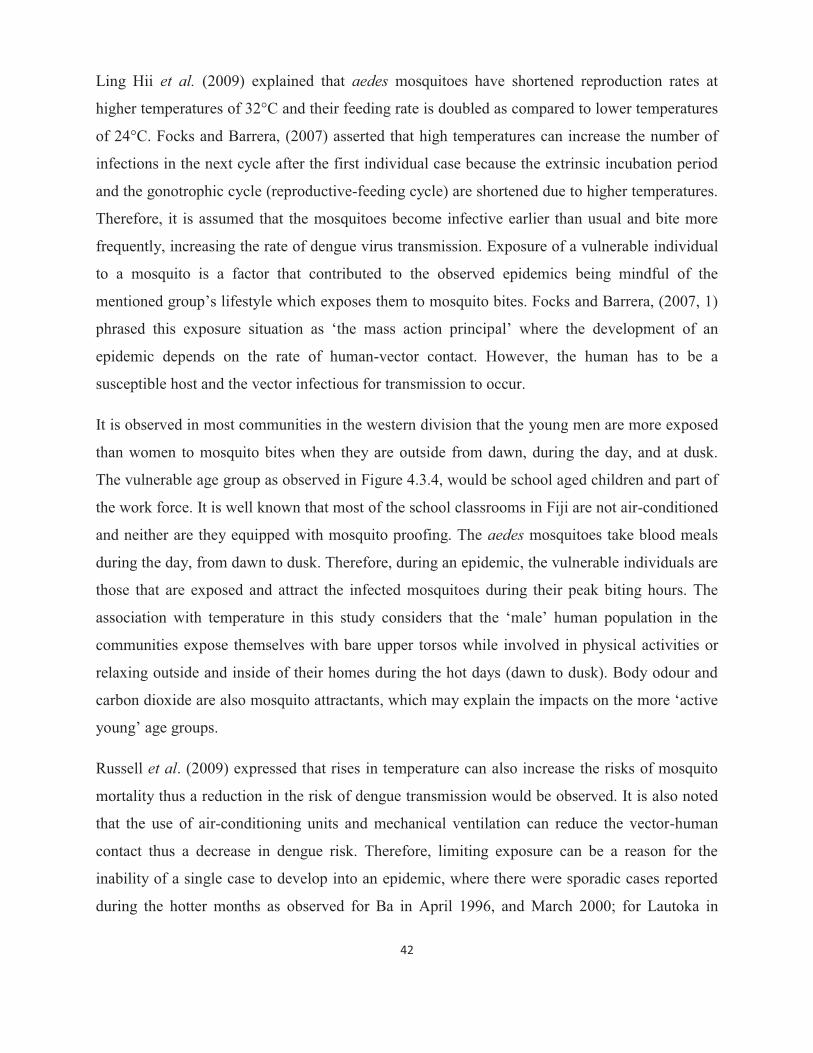
42
Ling Hii et al. (2009) explained that aedes mosquitoes have shortened reproduction rates at
higher temperatures of 32°C and their feeding rate is doubled as compared to lower temperatures
of 24°C. Focks and Barrera, (2007) asserted that high temperatures can increase the number of
infections in the next cycle after the first individual case because the extrinsic incubation period
and the gonotrophic cycle (reproductive-feeding cycle) are shortened due to higher temperatures.
Therefore, it is assumed that the mosquitoes become infective earlier than usual and bite more
frequently, increasing the rate of dengue virus transmission. Exposure of a vulnerable individual
to a mosquito is a factor that contributed to the observed epidemics being mindful of the
mentioned group’s lifestyle which exposes them to mosquito bites. Focks and Barrera, (2007, 1)
phrased this exposure situation as ‘the mass action principal’ where the development of an
epidemic depends on the rate of human-vector contact. However, the human has to be a
susceptible host and the vector infectious for transmission to occur.
It is observed in most communities in the western division that the young men are more exposed
than women to mosquito bites when they are outside from dawn, during the day, and at dusk.
The vulnerable age group as observed in Figure 4.3.4, would be school aged children and part of
the work force. It is well known that most of the school classrooms in Fiji are not air-conditioned
and neither are they equipped with mosquito proofing. The aedes mosquitoes take blood meals
during the day, from dawn to dusk. Therefore, during an epidemic, the vulnerable individuals are
those that are exposed and attract the infected mosquitoes during their peak biting hours. The
association with temperature in this study considers that the ‘male’ human population in the
communities expose themselves with bare upper torsos while involved in physical activities or
relaxing outside and inside of their homes during the hot days (dawn to dusk). Body odour and
carbon dioxide are also mosquito attractants, which may explain the impacts on the more ‘active
young’ age groups.
Russell et al. (2009) expressed that rises in temperature can also increase the risks of mosquito
mortality thus a reduction in the risk of dengue transmission would be observed. It is also noted
that the use of air-conditioning units and mechanical ventilation can reduce the vector-human
contact thus a decrease in dengue risk. Therefore, limiting exposure can be a reason for the
inability of a single case to develop into an epidemic, where there were sporadic cases reported
during the hotter months as observed for Ba in April 1996, and March 2000; for Lautoka in
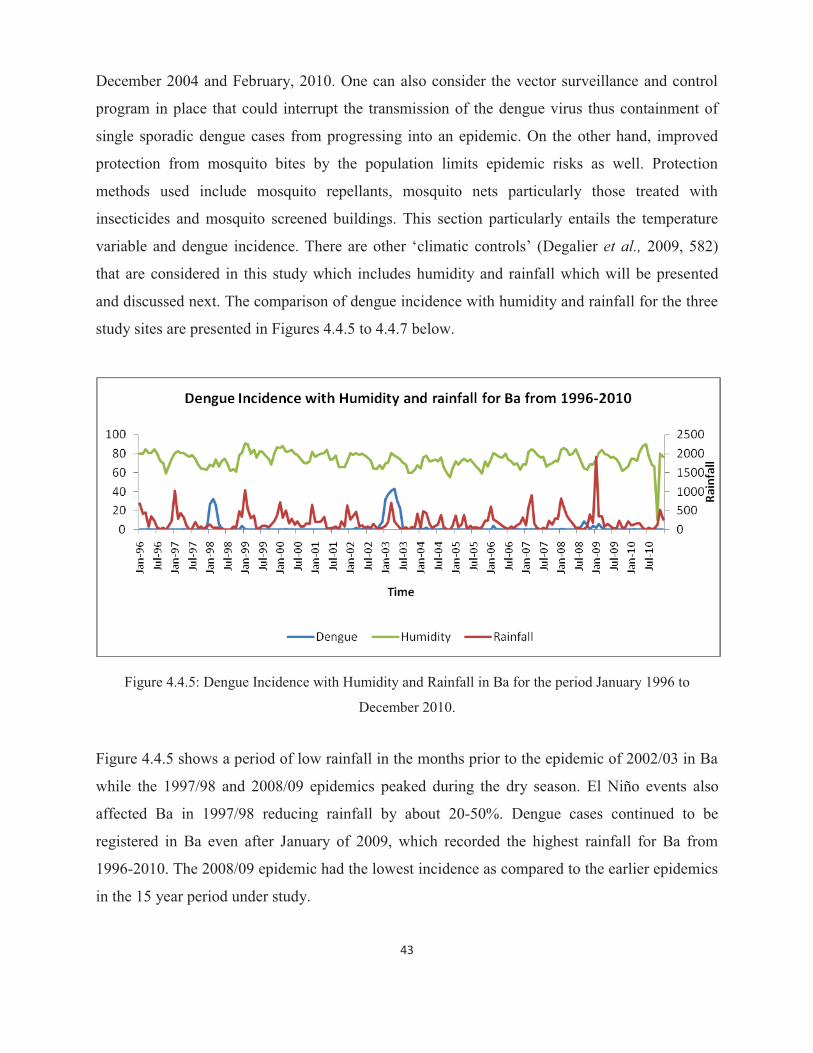
43
December 2004 and February, 2010. One can also consider the vector surveillance and control
program in place that could interrupt the transmission of the dengue virus thus containment of
single sporadic dengue cases from progressing into an epidemic. On the other hand, improved
protection from mosquito bites by the population limits epidemic risks as well. Protection
methods used include mosquito repellants, mosquito nets particularly those treated with
insecticides and mosquito screened buildings. This section particularly entails the temperature
variable and dengue incidence. There are other ‘climatic controls’ (Degalier et al., 2009, 582)
that are considered in this study which includes humidity and rainfall which will be presented
and discussed next. The comparison of dengue incidence with humidity and rainfall for the three
study sites are presented in Figures 4.4.5 to 4.4.7 below.
Figure 4.4.5: Dengue Incidence with Humidity and Rainfall in Ba for the period January 1996 to
December 2010.
Figure 4.4.5 shows a period of low rainfall in the months prior to the epidemic of 2002/03 in Ba
while the 1997/98 and 2008/09 epidemics peaked during the dry season. El Niño events also
affected Ba in 1997/98 reducing rainfall by about 20-50%. Dengue cases continued to be
registered in Ba even after January of 2009, which recorded the highest rainfall for Ba from
1996-2010. The 2008/09 epidemic had the lowest incidence as compared to the earlier epidemics
in the 15 year period under study.
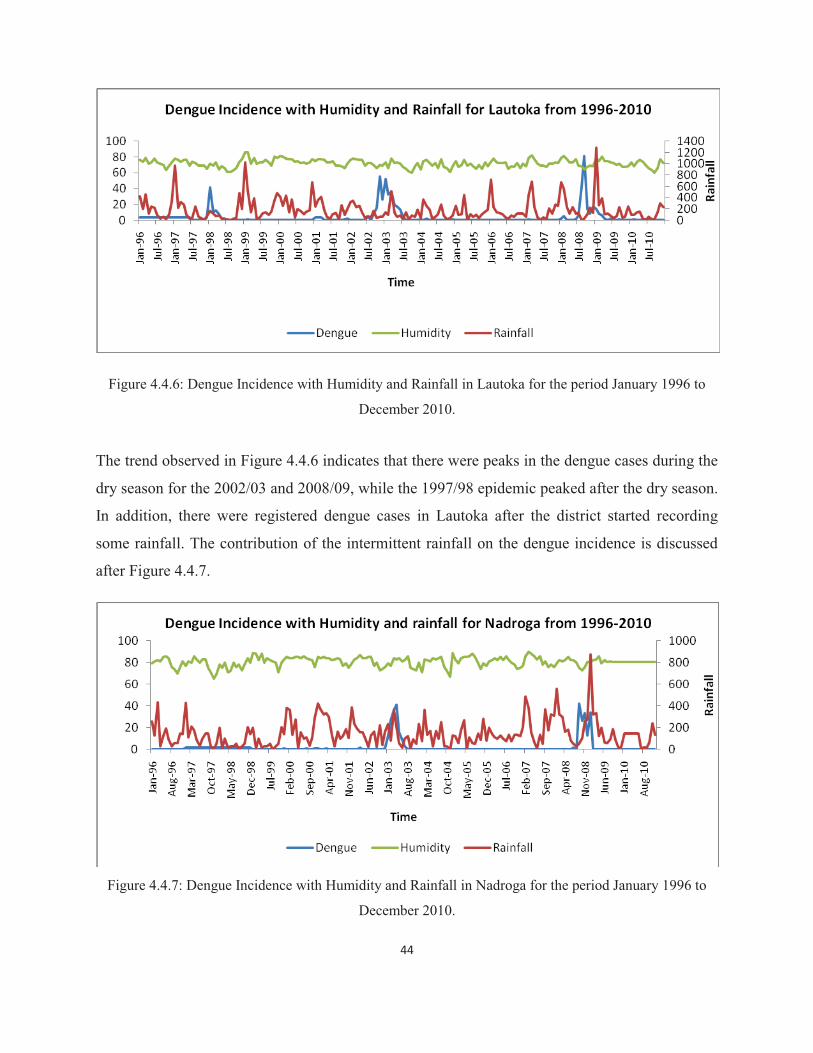
44
Figure 4.4.6: Dengue Incidence with Humidity and Rainfall in Lautoka for the period January 1996 to
December 2010.
The trend observed in Figure 4.4.6 indicates that there were peaks in the dengue cases during the
dry season for the 2002/03 and 2008/09, while the 1997/98 epidemic peaked after the dry season.
In addition, there were registered dengue cases in Lautoka after the district started recording
some rainfall. The contribution of the intermittent rainfall on the dengue incidence is discussed
after Figure 4.4.7.
Figure 4.4.7: Dengue Incidence with Humidity and Rainfall in Nadroga for the period January 1996 to
December 2010.

45
The relationship between dengue and the climate variables of rainfall and humidity show
different patterns for the three epidemics and the sporadically reported dengue cases. The 1998
epidemic generally followed a period of dryness in the three districts. January of 1998 recorded
normal rainfall for Ba and similarly for Lautoka receiving normal rainfall for January and
February. However, it was dry again during the epidemic period in the months of January to
June, 1998. GRF (2012) stated that moderate to strong El Niño events reduce rainfall by about
20-50% as experienced in 1997/98 resulting in major droughts over most part of Fiji. This
impacted dengue incidence as described by de Wet & Hales, (2000) when they said that the
1997/98 epidemic was the worst in Fiji with about 24,000 cases, 17,000 hospital admissions and
13 deaths occurred during a severe drought period relating to the El Niño event . Local climate
changes associated with ENSO affects dengue occurrence by causing changes in household
water storage practices and surface water pooling (Hales et al., 2003). The Fiji Meteorology
Services reported in 2003 that the 1997/98 drought was the worst to affect Fiji in the twentieth
century. It eventually warranted the declaration of a national emergency for the country. The
report added that the drought contributed to a dengue outbreak in Fiji (FMS Report, 2003). The
western side of Viti Levu where the three sites are located is known for its dry weather condition,
however, coupled with the drought, the need for water was critical thus an increase in water
storage in containers including drums. These water storages are potential mosquito breeding
zones when not properly protected with lids and covers. In addition, the transportation of stored
waters to new areas is also a means of disseminating the vector and its infectious agents, thus
increasing the risk of dengue transmission to other localities.
Rainfall, by itself, is not a useful predictor of epidemic risk, but the abundance of breeding sites,
which is important in terms of adaptation to climate change (de Wet & Hales, 2000). This
highlights the need for stagnant water for mosquito breeding and humid conditions for adult
viability. The 2002/03 and 2008/09 epidemics show similar rainfall trends for the three sites
which is very low rainfall between two to three months before the dengue outbreaks. However,
Figures 4.4.5 to 4.4.7 show that the ensuing epidemics occurred during the months of very high
rainfall in the study sites. This observation is consistent with other findings (Pham et al., 2011;
Chowell et al., 2011) noting that more rainfall increases breeding of mosquitoes in the available
potential breeding containers which contributes to more mosquitoes and thus a greater chance of
46
having more female mosquitoes that are capable of carrying the dengue virus. Projections by
ABM and CSIRO (2011) which shows that extreme rainfall days are likely to occur more often
in Fiji indicates that elimination of mosquito breeding grounds is paramount in adaptation
initiatives focused on reducing dengue incidence due to rainfall. This factor was termed by
Degalier et al. (2009, 582) as ‘environmental controls’. It is concluded from this that despite the
presence or absence of rainfall, controlling the mosquitoes’ breeding and harbouring
environment will reduce dengue transmission risk.
This study found humidity to be showing very little variation and similarly for its impact on the
studied dengue incidences. There was variability in humidity before and during the three
epidemics in the study period. However, researchers and dengue control agencies should be
mindful that studies have shown relative humidity to be an important climatic factor contributing
to the growth and dispersion of the mosquito vector and dengue outbreaks (de Wet & Hales,
2000; Patz et al., 2005). The relationships found in this study and described in this section were statistically tested for its
significance and are shown in the next section.
4.5 Correlation analysis of climate variables with dengue incidence The correlation analysis described in this section uses Pearson correlation to demonstrate the
status of significance of the association between dengue incidence which is the independent
variable and the climate variables, which are the dependent variables in this study. The results
are tabulated and discussed in districts of study. The non-climatic factors are not included in this
chapter as it will be discussed in Chapter 5. The next three tables (4.5.1-4.5.3) summarise the
statistical analysis outcome for dengue and the climate variables under review in this study.

47
Table 4.5.1: Correlation summary of dengue cases and climate variables for Ba.
Climate variables Correlation P- Value Significance Status
Maximum Temperature .248 .001 Correlation is significant at the 0.01 level (2-tailed)
Minimum Temperature .198 .008 Correlation is significant at the 0.01 level (2-tailed)
Rainfall .007 .927 Not significant
Humidity -.018 .811 Not significant
According to Pearson correlation analysis, dengue incidence in Ba is statistically significant with
a weak correlation to the temperatures (minimum and maximum) and the association of dengue
incidence with rainfall and humidity is not significant. Ba recorded the highest means of
maximum temperature and according to explanations in section 4.4 above, high temperatures can
increase the number of dengue infections.
Table 4.5.2: Correlation summary of dengue cases and climate variables for Lautoka.
Climate variables Correlation P- Value Significance Status
Maximum Temperature .189 .011 Correlation is significant at the 0.05 level (2-tailed)
Minimum Temperature .129 .084 Not significant
Rainfall -.027 .719 Not significant
Humidity -.088 .240 Not significant
According to Pearson correlation analysis, dengue incidence in Lautoka is significantly
correlated to the maximum temperature and the association of dengue incidence with minimum
temperature, rainfall and humidity is not significant.

48
Table 4.5.3: Correlation summary of dengue cases and climate variables for Nadroga.
Climate variables Correlation P-Value Significance Status
Maximum Temperature
.129 .084 Not significant
Minimum Temperature
.070 .349 Not significant
Rainfall .199 .008 Correlation is significant at the 0.01 level (2-tailed)
Humidity -.018 .179 Not significant
According to Pearson correlation analysis, dengue incidence in Nadroga is significantly
correlated to the rainfall while the association of dengue incidence with temperatures (minimum
and maximum) and humidity is not significant. Despite recording the lowest average rainfall in
the study period, results for Nadroga indicate that dengue incidence is associated with rainfall.
The epidemics of 2002/03 and 2008/09 in Nadroga were accompanied with high rainfall (Figure
4.4.6) which is consistent with previous studies that found more dengue cases occurring during
high rainfall (Pham et al., 2011, Chowell et al., 2011).
Pearson correlation analysis has interestingly found significance in some of the results presented
in this chapter which confirms that these results were not simply due to chance. In Ba, dengue
incidence is significantly correlated to temperatures (minimum and maximum) whereas in
Lautoka the correlation of dengue and maximum temperature alone is statistically significant and
in Nadroga the correlation of dengue incidence and rainfall is statistically significant. Van Kleef
et al. (2009) and Ebi (2011) verified that the geographic boundary of dengue cannot be
determined by the effects of climate variability and change alone in a given locality. Other
factors such as mosquito control and surveillance, available breeding sites for mosquitoes,
individual and communal lifestyle that contribute to exposure to infected mosquitoes and poverty
also contribute in varying degrees to dengue incidence in different localities. This means that the
different findings for the three sites are also influenced by the various non-climatic factors
mentioned earlier, which are not constant in the three study sites, as will be discussed in the next
chapter.
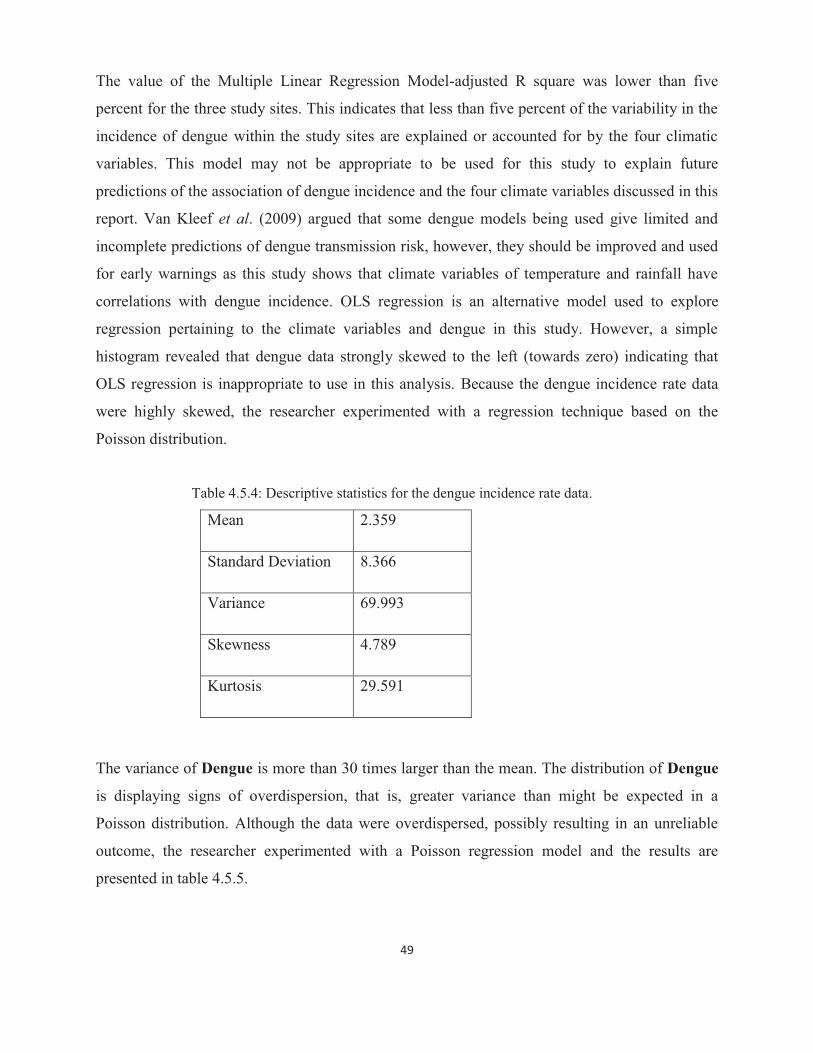
49
The value of the Multiple Linear Regression Model-adjusted R square was lower than five
percent for the three study sites. This indicates that less than five percent of the variability in the
incidence of dengue within the study sites are explained or accounted for by the four climatic
variables. This model may not be appropriate to be used for this study to explain future
predictions of the association of dengue incidence and the four climate variables discussed in this
report. Van Kleef et al. (2009) argued that some dengue models being used give limited and
incomplete predictions of dengue transmission risk, however, they should be improved and used
for early warnings as this study shows that climate variables of temperature and rainfall have
correlations with dengue incidence. OLS regression is an alternative model used to explore
regression pertaining to the climate variables and dengue in this study. However, a simple
histogram revealed that dengue data strongly skewed to the left (towards zero) indicating that
OLS regression is inappropriate to use in this analysis. Because the dengue incidence rate data
were highly skewed, the researcher experimented with a regression technique based on the
Poisson distribution.
Table 4.5.4: Descriptive statistics for the dengue incidence rate data.
Mean 2.359
Standard Deviation 8.366
Variance 69.993
Skewness 4.789
Kurtosis 29.591
The variance of Dengue is more than 30 times larger than the mean. The distribution of Dengue
is displaying signs of overdispersion, that is, greater variance than might be expected in a
Poisson distribution. Although the data were overdispersed, possibly resulting in an unreliable
outcome, the researcher experimented with a Poisson regression model and the results are
presented in table 4.5.5.

50
Table 4.5.5: Summarised Poisson regression values.
Dengue Coef. Std. Err.
Rainfall -.0002198 .0001707
Minimum Temperature .2545306 .0210692
Maximum Temperature .2795736 .0258223
Humidity -.0330986 .0029002
_cons -10.865825 .7847352
LR Chi Square (4) – 665.55
Noted from table 4.5.5 the large chi-square value suggested that the Poisson regression model is
unreliable, so the research experimented with a negative binomial regression model, which is
often more appropriate in cases of over-dispersion.
Table 4.5.6: Negative binomial regression result.
Dengue Coef. Std. Err.
Rainfall .0004552 .0008265
Minimum Temperature .184436 .1208501
Maximum Temperature .3286289 .1507398
Humidity -.08159 .0299105
_cons -7.389626 4.277689
LR Chi Square (4) – 24.89

51
The negative binomial model was compared with the zero inflated Poisson distribution model
and the result is tabled in Table 4.5.7.
Table 4.5.7: The zero inflated Poisson model result.
Dengue Coef. Std. Err.
Dengue
Rainfall -0.00034 0.000147
Minimum Temperature 0.126682 0.020029
Maximum Temperature 0.091278 0.022844
Humidity -0.0227 0.005322
_cons -1.50111 0.800452
Inflate
Rainfall -0.00109 0.000578
Minimum Temperature -0.13935 0.074312
Maximum Temperature -0.17093 0.093981
Humidity 0.037262 0.016064
_cons 6.976109 2.886049
Akaike's Information Criterion (AIC) is a method to evaluate different statistical models based
on parsimony and goodness of fit. The researcher computed AIC, defined as AIC = -2logL + 2p,
where p is the number of parameters in the model, for both the Negative Binomial model and the
Zero Inflated Poisson model, with AIC results suggesting the Negative Binomial model is the
better of the two. The computed values are given in Table 4.5.8.
Table 4.5.8: Compared AIC values of models.
Negative Binomial 1246.495
Zero Inflated Poisson (ZIP) 2705.412
52
The predictive equation therefore is:
• Log (# Dengue) = Bo + β1x1 + β2x2 + … + βnxn. + σ * e, where e are the errors.
Where Bo = -7.389626, B1= .0004552, B2= .184436, B3= .3286289 and B4= -.08159.
This study does not intend to venture into the details of modeling dengue and climate variables
but tries to explore the options for future research.
4.6 Chapter conclusion
This chapter presented and discussed the main results of the study. This entailed the analysis of
the dengue and climate variables secondary data. The dependent and independent variables were
analysed separately in this chapter and correlation results were given to show significance of the
findings. The results showed that the relationship between dengue incidence, temperature and
rainfall is statistically significant for the three different sites. Despite showing weak correlations,
the existence of a certain extent of correlation cannot be ignored by researchers in the field of
public health.
The next chapter also forms part of the results and analysis that discusses the findings in
communities within the three study sites. Three of these communities were used as case study
areas to collect primary data for the study. The next chapter deliberates on the non-climatic
factors affecting dengue incidence.

53
CHAPTER FIVE RESULTS AND ANALYSIS – CASE STUDY AREAS
5.1 Chapter introduction This chapter presents and discusses the dengue data for the three case study areas comparatively
to other localities within the study areas. This chapter is also a response to recommendations in
Chapter 2 suggesting that non-climatic factors have to be accounted for in demonstrating any
climate-dengue association especially in dengue outbreak early warning systems and models of
climate change impacts pertaining to dengue incidence.
This chapter shows the local infection or transmission pattern within the study sites for the first
ten confirmed cases of dengue in the epidemic years of 2002/03 and 2008/09 and the
geographical distribution of the dengue cases with the use of mapping. Case study areas within
the study sites were selected for survey of non-climatic factors that influence dengue incidence.
There is an absence of separate microclimatic data for the case study sites as meteorology
measurements are limited to district levels. Therefore, the results presented and discussed in this
chapter consider the district climate data as that of the case study sites as well. The case study
sites include Tauvegavega in Ba, Natabua in Lautoka and Nayawa in Nadroga. Non-climatic
factors considered in this study include socio-economic and environmental factors that; promote
mosquito breeding or increase exposure to dengue infection risks.
5.2 Dengue transmission analysis This section uses the dengue data from Chapter 4 to chart the transmission pattern and
geographical distribution (epidemiology) of the disease in the study sites. The dates used for
charting are a combination of admission dates, discharge dates and laboratory test dates.
Adjustments to discharge dates were made from the average three days observed for hospital
admissions. The locality of cases was a challenge that resulted in the omission of the Lautoka
2002/03 data for this section’s analysis. The unknown addresses and those addresses from out of
the studied site are omitted. Figures 5.2.1-5.2.3 show mapped dengue cases from the epidemic
period of 2002/03 for Ba. Figures 5.2.4-5.2.9 display mapped dengue cases from the epidemic
period of 2008/09 for Lautoka and Nadroga.
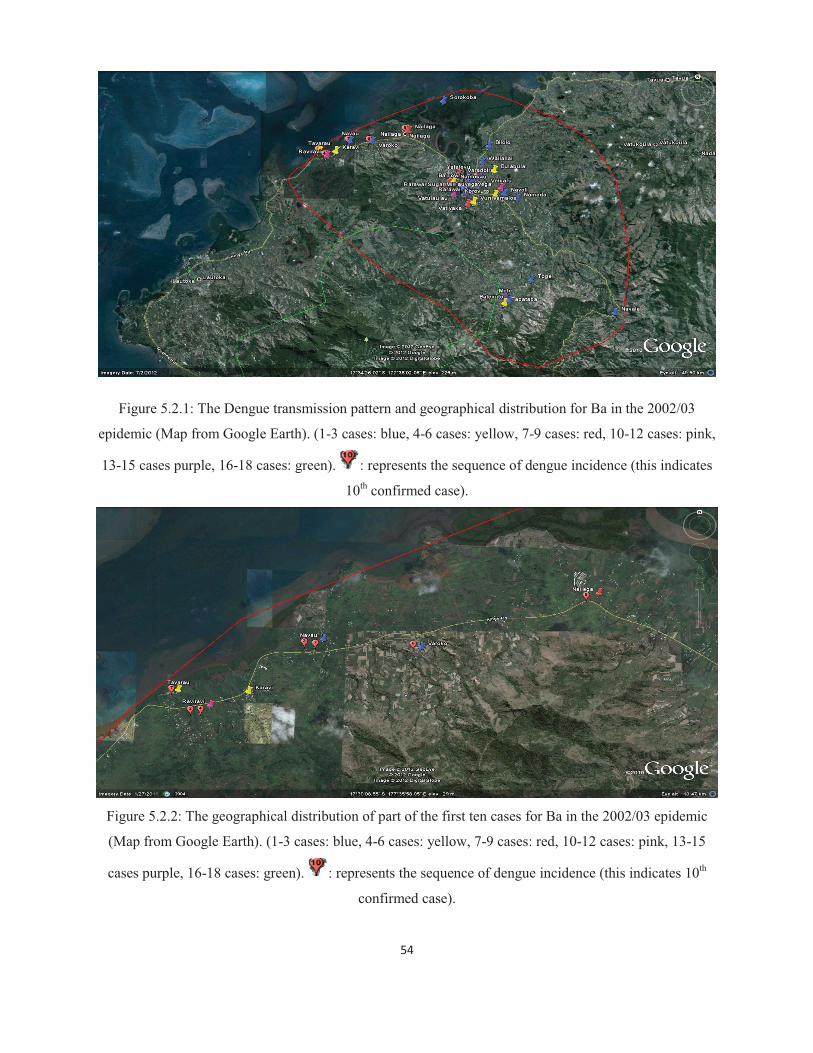
54
Figure 5.2.1: The Dengue transmission pattern and geographical distribution for Ba in the 2002/03
epidemic (Map from Google Earth). (1-3 cases: blue, 4-6 cases: yellow, 7-9 cases: red, 10-12 cases: pink,
13-15 cases purple, 16-18 cases: green). : represents the sequence of dengue incidence (this indicates
10th confirmed case).
Figure 5.2.2: The geographical distribution of part of the first ten cases for Ba in the 2002/03 epidemic
(Map from Google Earth). (1-3 cases: blue, 4-6 cases: yellow, 7-9 cases: red, 10-12 cases: pink, 13-15
cases purple, 16-18 cases: green). : represents the sequence of dengue incidence (this indicates 10th
confirmed case).

55
Figure 5.2.3: The geographical distribution of part of the first ten cases for Ba in the 2002/03 epidemic
(Map from Google Earth). (1-3 cases: blue, 4-6 cases: yellow, 7-9 cases: red, 10-12 cases: pink, 13-15
cases purple, 16-18 cases: green). : represents the sequence of dengue incidence (this indicates 10th
confirmed case).
While the first dengue case in the 2002/03 epidemic in Ba did not have a confirmed address the
second and fourth cases were reported from Raviravi - an integrated residential and agricultural
area that is dominated by sugar cane farming. The residents are mostly Indo-Fijians who are also
fishermen living near the coast. The two cases were reported within ten days of each other but
there was no certainty on their exact locations to assume ‘clustering’ as defined in Section 3.2.
There were three cases recorded on the same day and they were all logged in as three different
thirds on the list. These cases were from Namosau, Navau and an unknown address. Areas such
as Moto, Nailaga, Rarawai, Raviravi, Vatulaulau and Varadoli recorded more than ten cases in a
single eight to nine month duration epidemic. These areas are highly populated and are not
spatially connected to each other. It is observed that there are more cases within the urban area
and the immediate peri-urban areas such as Vatulaulau, Namosau, Rarawai and Tauvegavega.
However, the spread into the rural areas is noted in Ba for the 2002/03 epidemic.
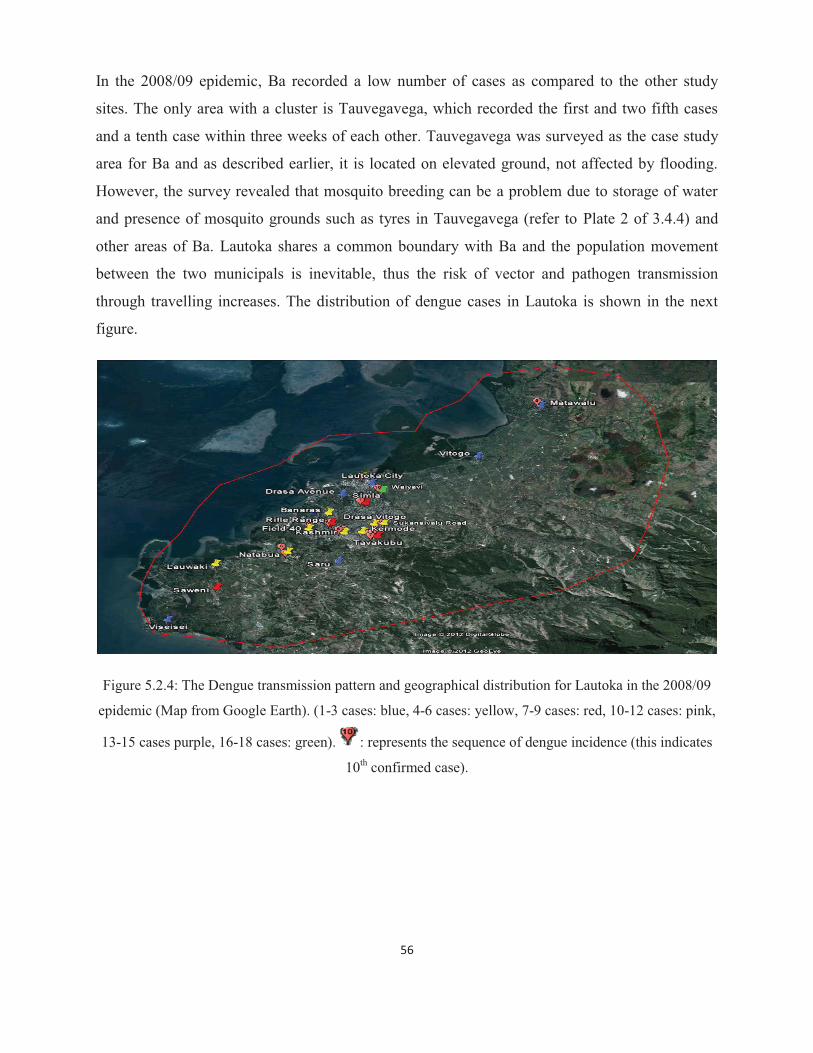
56
In the 2008/09 epidemic, Ba recorded a low number of cases as compared to the other study
sites. The only area with a cluster is Tauvegavega, which recorded the first and two fifth cases
and a tenth case within three weeks of each other. Tauvegavega was surveyed as the case study
area for Ba and as described earlier, it is located on elevated ground, not affected by flooding.
However, the survey revealed that mosquito breeding can be a problem due to storage of water
and presence of mosquito grounds such as tyres in Tauvegavega (refer to Plate 2 of 3.4.4) and
other areas of Ba. Lautoka shares a common boundary with Ba and the population movement
between the two municipals is inevitable, thus the risk of vector and pathogen transmission
through travelling increases. The distribution of dengue cases in Lautoka is shown in the next
figure.
Figure 5.2.4: The Dengue transmission pattern and geographical distribution for Lautoka in the 2008/09
epidemic (Map from Google Earth). (1-3 cases: blue, 4-6 cases: yellow, 7-9 cases: red, 10-12 cases: pink,
13-15 cases purple, 16-18 cases: green). : represents the sequence of dengue incidence (this indicates
10th confirmed case).
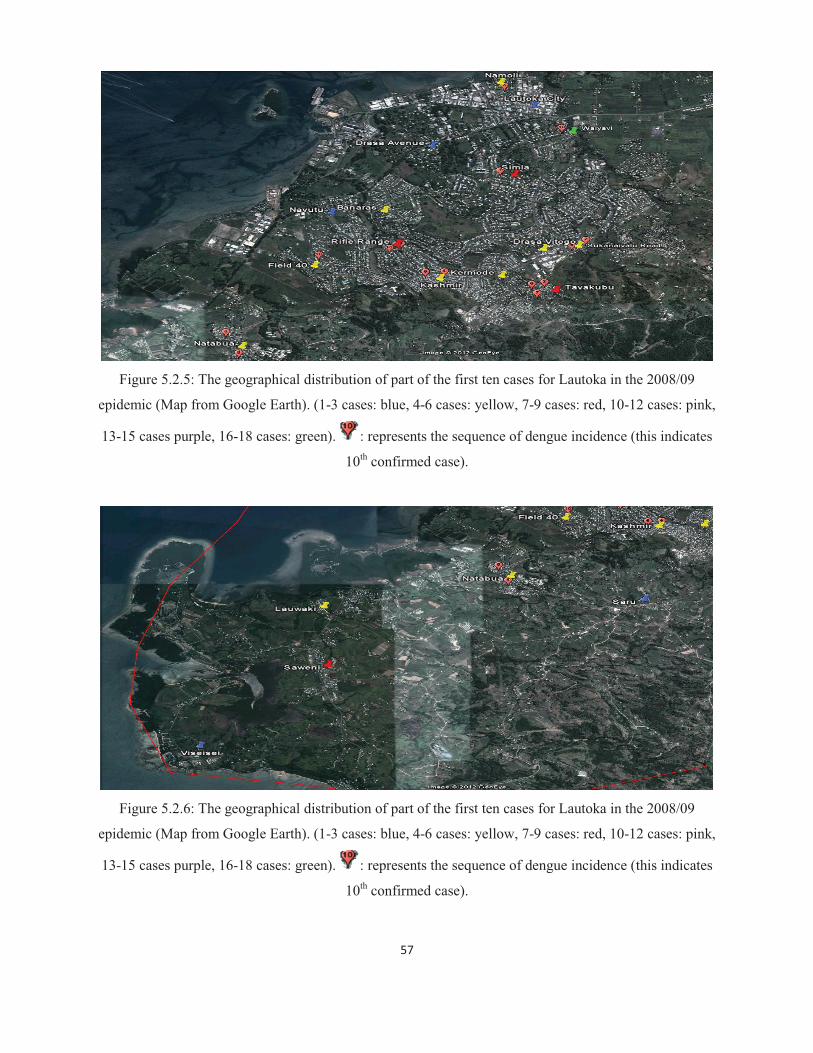
57
Figure 5.2.5: The geographical distribution of part of the first ten cases for Lautoka in the 2008/09
epidemic (Map from Google Earth). (1-3 cases: blue, 4-6 cases: yellow, 7-9 cases: red, 10-12 cases: pink,
13-15 cases purple, 16-18 cases: green). : represents the sequence of dengue incidence (this indicates
10th confirmed case).
Figure 5.2.6: The geographical distribution of part of the first ten cases for Lautoka in the 2008/09
epidemic (Map from Google Earth). (1-3 cases: blue, 4-6 cases: yellow, 7-9 cases: red, 10-12 cases: pink,
13-15 cases purple, 16-18 cases: green). : represents the sequence of dengue incidence (this indicates
10th confirmed case).
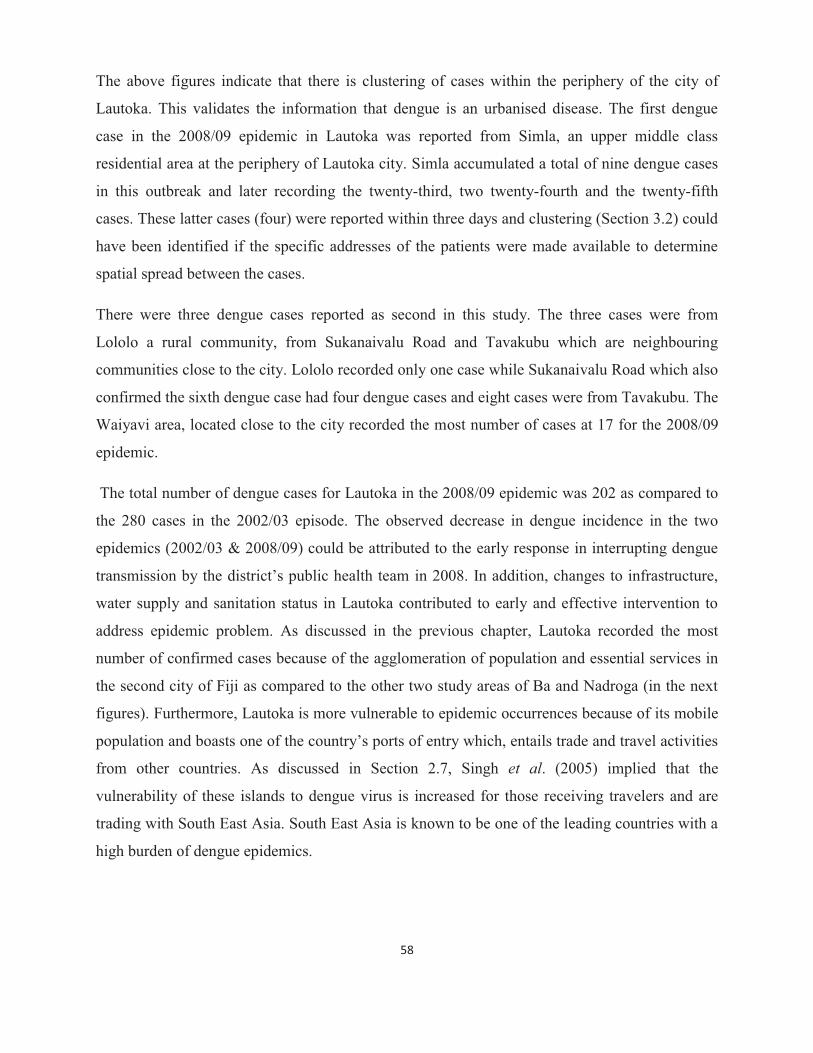
58
The above figures indicate that there is clustering of cases within the periphery of the city of
Lautoka. This validates the information that dengue is an urbanised disease. The first dengue
case in the 2008/09 epidemic in Lautoka was reported from Simla, an upper middle class
residential area at the periphery of Lautoka city. Simla accumulated a total of nine dengue cases
in this outbreak and later recording the twenty-third, two twenty-fourth and the twenty-fifth
cases. These latter cases (four) were reported within three days and clustering (Section 3.2) could
have been identified if the specific addresses of the patients were made available to determine
spatial spread between the cases.
There were three dengue cases reported as second in this study. The three cases were from
Lololo a rural community, from Sukanaivalu Road and Tavakubu which are neighbouring
communities close to the city. Lololo recorded only one case while Sukanaivalu Road which also
confirmed the sixth dengue case had four dengue cases and eight cases were from Tavakubu. The
Waiyavi area, located close to the city recorded the most number of cases at 17 for the 2008/09
epidemic.
The total number of dengue cases for Lautoka in the 2008/09 epidemic was 202 as compared to
the 280 cases in the 2002/03 episode. The observed decrease in dengue incidence in the two
epidemics (2002/03 & 2008/09) could be attributed to the early response in interrupting dengue
transmission by the district’s public health team in 2008. In addition, changes to infrastructure,
water supply and sanitation status in Lautoka contributed to early and effective intervention to
address epidemic problem. As discussed in the previous chapter, Lautoka recorded the most
number of confirmed cases because of the agglomeration of population and essential services in
the second city of Fiji as compared to the other two study areas of Ba and Nadroga (in the next
figures). Furthermore, Lautoka is more vulnerable to epidemic occurrences because of its mobile
population and boasts one of the country’s ports of entry which, entails trade and travel activities
from other countries. As discussed in Section 2.7, Singh et al. (2005) implied that the
vulnerability of these islands to dengue virus is increased for those receiving travelers and are
trading with South East Asia. South East Asia is known to be one of the leading countries with a
high burden of dengue epidemics.

59
Figure 5.2.7: The Dengue transmission pattern and geographical distribution for Nadroga in the 2008/09
epidemic (Map from Google Earth). (1-3 cases: blue, 4-6 cases: yellow, 7-9 cases: red, 10-12 cases: pink,
13-15 cases purple, 16-18 cases: green). : represents the sequence of dengue incidence (this indicates
10th confirmed case).
Figure 5.2.8: The geographical distribution of part of the first ten cases for Nadroga in the 2008/09
epidemic (Map from Google Earth). (1-3 cases: blue, 4-6 cases: yellow, 7-9 cases: red, 10-12 cases: pink,

60
13-15 cases purple, 16-18 cases: green). : represents the sequence of dengue incidence (this indicates
10th confirmed case).
Figure 5.2.9: The geographical distribution of part of the first ten cases for Nadroga in the 2008/09
epidemic (Map from Google Earth). (1-3 cases: blue, 4-6 cases: yellow, 7-9 cases: red, 10-12 cases: pink,
13-15 cases purple, 16-18 cases: green). : represents the sequence of dengue incidence (this indicates
10th confirmed case).
Nadroga recorded an increase in its number of confirmed dengue cases in the 2008/09 epidemic
as compared to the 146 in 2002/03. It is notable that Nadroga’s dengue cases in the 2008/09
epidemic are predominantly close to the main highway and the coast. This could be due to the
location of villages along the stretch from Sigatoka town to Nadi and the adjoining tourism sites.
The cases were also distributed in almost fifty communities thus its limitation to mostly one to
three cases within an area or community as compared to Lautoka. The cases for Lautoka were
distributed in about forty areas (communities) with almost half containing five or more cases of
dengue in the 2008/09 epidemic. The distribution of cases in Nadroga is sporadic covering about
fifty communities. While it shows an urbanized trend, there is also an observed move into the
rural areas. This could be an indication that the daily mobility of people in Nadroga is associated
with the spread of the dengue virus as the working population and students’ transit through the
town and the tourism sites where there are employment opportunities and schools.

61
5.3 Demographics and socio economic factors The demographic information used in this section was sourced from the Bureau of Statistics
Census 2007. Table 5.3.1 summarises the demography of the study sites and the case study areas.
Figure 5.3.1 shows the proportion of the population within each site.
Table 5.3.1: Population and household distribution in the study and case study sites. Lautoka Rural is
considered as Vuda Tikina Rural and its population is 37161- not in the table (Bureau of Statistics-2007
Census).
The population of Tauvegavega and Natabua in Table 5.3.1 includes other settlements outside
the housing areas which were the focus of this study. According to the key informants in Ba and
Lautoka the approximate population of the case study areas are about one third (600) of the
tabled data for Tauvegavega and one half (1000) for Natabua.
Figure 5.3.1: Proportion of the population within each study site (left) and proportion of dengue
distribution within each study site (right).
Figure 5.3.1 shows that almost half (47%) of the population of the three sites live in Lautoka
with the least number living (23%) in Ba. The chart also indicates that about half (46%) of the
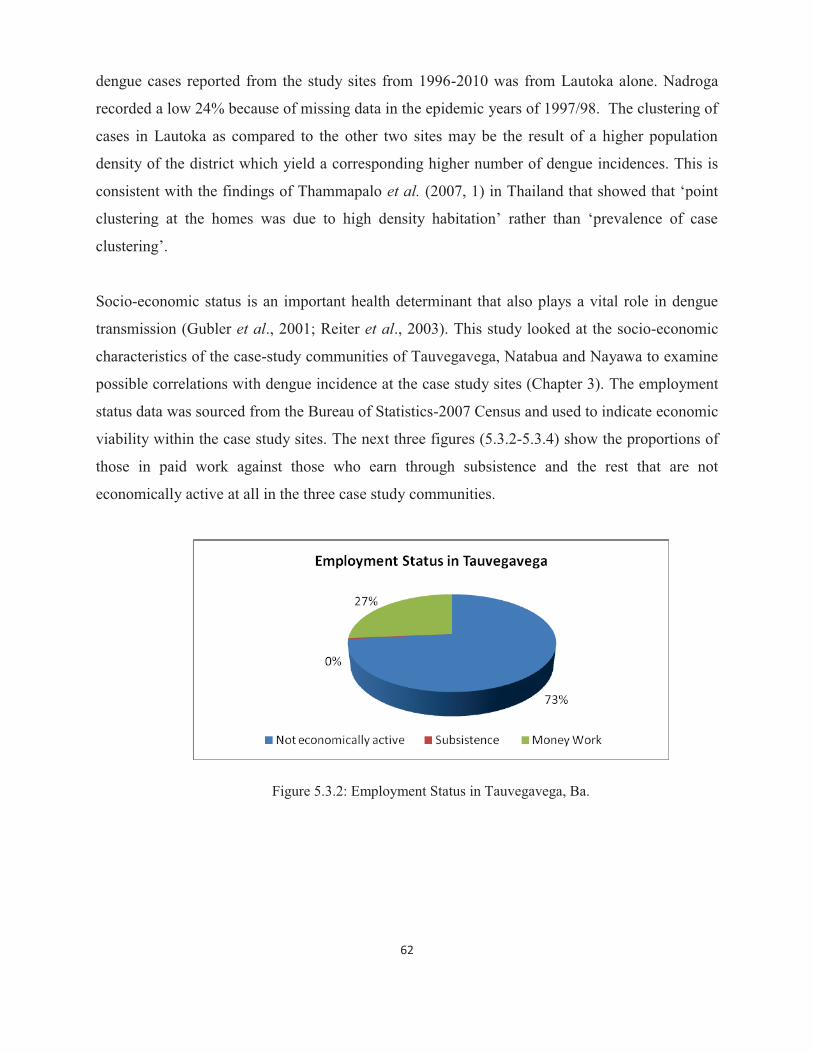
62
dengue cases reported from the study sites from 1996-2010 was from Lautoka alone. Nadroga
recorded a low 24% because of missing data in the epidemic years of 1997/98. The clustering of
cases in Lautoka as compared to the other two sites may be the result of a higher population
density of the district which yield a corresponding higher number of dengue incidences. This is
consistent with the findings of Thammapalo et al. (2007, 1) in Thailand that showed that ‘point
clustering at the homes was due to high density habitation’ rather than ‘prevalence of case
clustering’.
Socio-economic status is an important health determinant that also plays a vital role in dengue
transmission (Gubler et al., 2001; Reiter et al., 2003). This study looked at the socio-economic
characteristics of the case-study communities of Tauvegavega, Natabua and Nayawa to examine
possible correlations with dengue incidence at the case study sites (Chapter 3). The employment
status data was sourced from the Bureau of Statistics-2007 Census and used to indicate economic
viability within the case study sites. The next three figures (5.3.2-5.3.4) show the proportions of
those in paid work against those who earn through subsistence and the rest that are not
economically active at all in the three case study communities.
Figure 5.3.2: Employment Status in Tauvegavega, Ba.

63
Figure 5.3.3: Employment Status in Natabua, Lautoka.
The employment status data obtained from the Bureau of Statistics includes the settlements
outside of the housing areas of two of the case-study communities, namely Tauvegavega and
Natabua. Therefore, the ‘not economically active’ proportion is much greater than anticipated for
the two communities. However, it should be noted that the ‘not economically active’proportion
is still higher than those who are in the ‘money work’category for the two communities.
Figure 5.3.4: Employment Status in Nayawa, Nadroga.
In the three case study communities, those who are ‘not economically active’ outnumber the
‘subsistence’ and ‘money work’ categories within the age group of those who should be working
excluding those who are in education or training institutions. The economic level of communites
determines their choices of housing types and their general living standards. Consequently, cited
literature in this study confirms that the socio-economic status of communities impacts on their
way of life encompassing knowledge, attitude and behavior of the population, thus their
vulnerability to dengue infection (Gubler et al., 2001; Reiter et al., 2003). Furthermore, a study

64
by Ma et al. (2008) in Singapore indicated that dengue incidence was associated with some
socioeconomic and demographic characteristics of the studied communities. Ma et al. (2008, 17)
also showed that higher dengue incidence was observed amongst ‘socioeconomically
disadvantaged residents’.
5.4 Knowledge, attitude and behaviour This section presents and analyses the results of the questionnaire survey, key informant
interview and the observation conducted by the researcher. The first part includes the
questionnaire results and the researcher’s observations which are presented and discussed for the
three case study sites. Then the key informants’ interview result is jointly presented as one for
the three sub divisions. The final section presents and discusses the analysis of observed
correlations/relationships of these findings and dengue incidence as collated from the
questionnaire survey. Data coded from the questionnaire into SPSS was statistically analysed to
describe correlations of some non-climatic factors and dengue incidence of the results for the
case study areas.
The data presented here is based on the questionnaire results, the researcher’s observations
during the field visit for this research and the key informants’ interview results. The first table
provides a summary of the questionnaire survey results and Table 5.4.2 presents the summary of
the results of the key informants’ interviews.

65
Table 5.4.1: Summary of Questionnaire Results
Title Number (n) Percentage (%) � DEMOGRAPHIC Districts Tauvegavega 12 27.3% Nayawa 10 22.7% Natabua 22 50% Household Population Adults 149 72% Children 58 28% Length of stay in the area <1year 2 4.5% 1 – 5 years 12 27.3% 6 – 10 years 7 15.9% 11 – 15 years 8 18.2% >15 years 15 34.1% � BEHAVIOUR/PRACTICES Dengue at home Yes 2 4.5% Mosquito Problem Yes 26 59.1% No 2 4.5% Sometimes 16 36.4% Water supply problem No 41 93.2% Yes 3 6.8% Garbage Disposal System Municipal collection 44 100%
The summary from the questionnaire survey is portrayed in Figures 5.4.1-5.4.5 below. First,
there is a description of the water storage facilities as these can be sources of domesticated
mosquito breeding within the premises and the communities. This is followed by a description of
other potential breeding and harbouring grounds for mosquitoes and how the communities
reduce contact with the mosquitoes. The observational survey by the researcher was within the
areas suitable for aedes aegypti and albopictus.
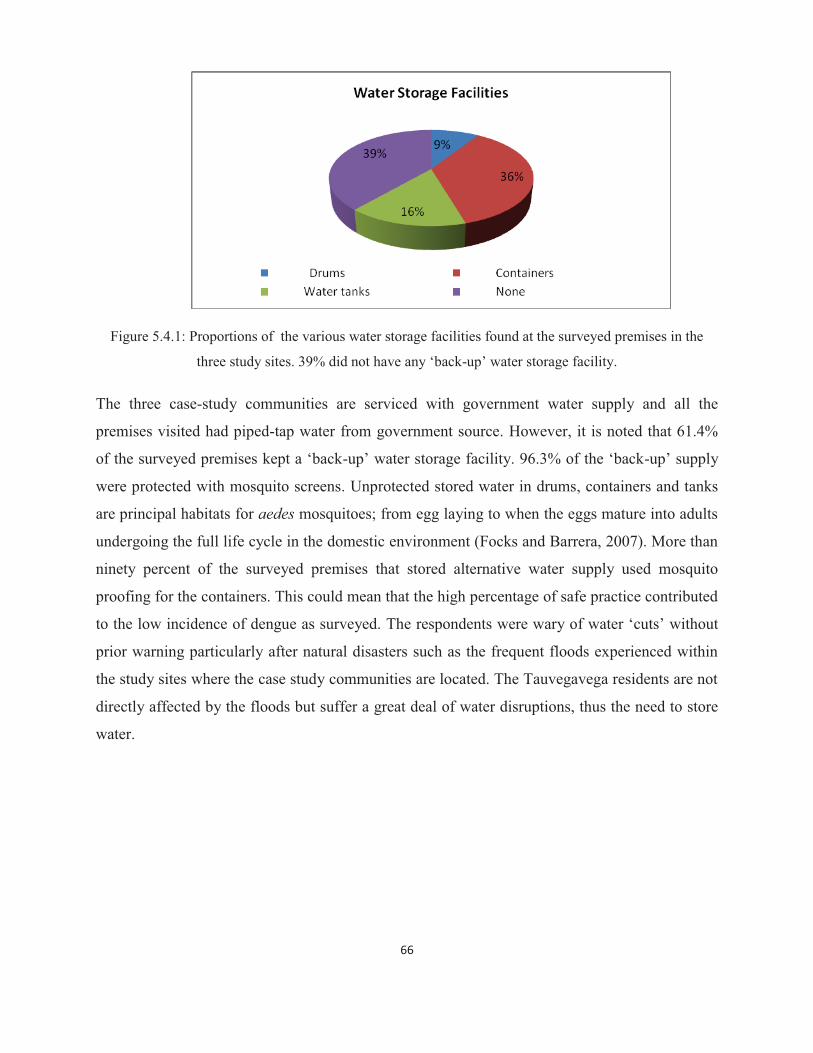
66
Figure 5.4.1: Proportions of the various water storage facilities found at the surveyed premises in the
three study sites. 39% did not have any ‘back-up’ water storage facility.
The three case-study communities are serviced with government water supply and all the
premises visited had piped-tap water from government source. However, it is noted that 61.4%
of the surveyed premises kept a ‘back-up’ water storage facility. 96.3% of the ‘back-up’ supply
were protected with mosquito screens. Unprotected stored water in drums, containers and tanks
are principal habitats for aedes mosquitoes; from egg laying to when the eggs mature into adults
undergoing the full life cycle in the domestic environment (Focks and Barrera, 2007). More than
ninety percent of the surveyed premises that stored alternative water supply used mosquito
proofing for the containers. This could mean that the high percentage of safe practice contributed
to the low incidence of dengue as surveyed. The respondents were wary of water ‘cuts’ without
prior warning particularly after natural disasters such as the frequent floods experienced within
the study sites where the case study communities are located. The Tauvegavega residents are not
directly affected by the floods but suffer a great deal of water disruptions, thus the need to store
water.
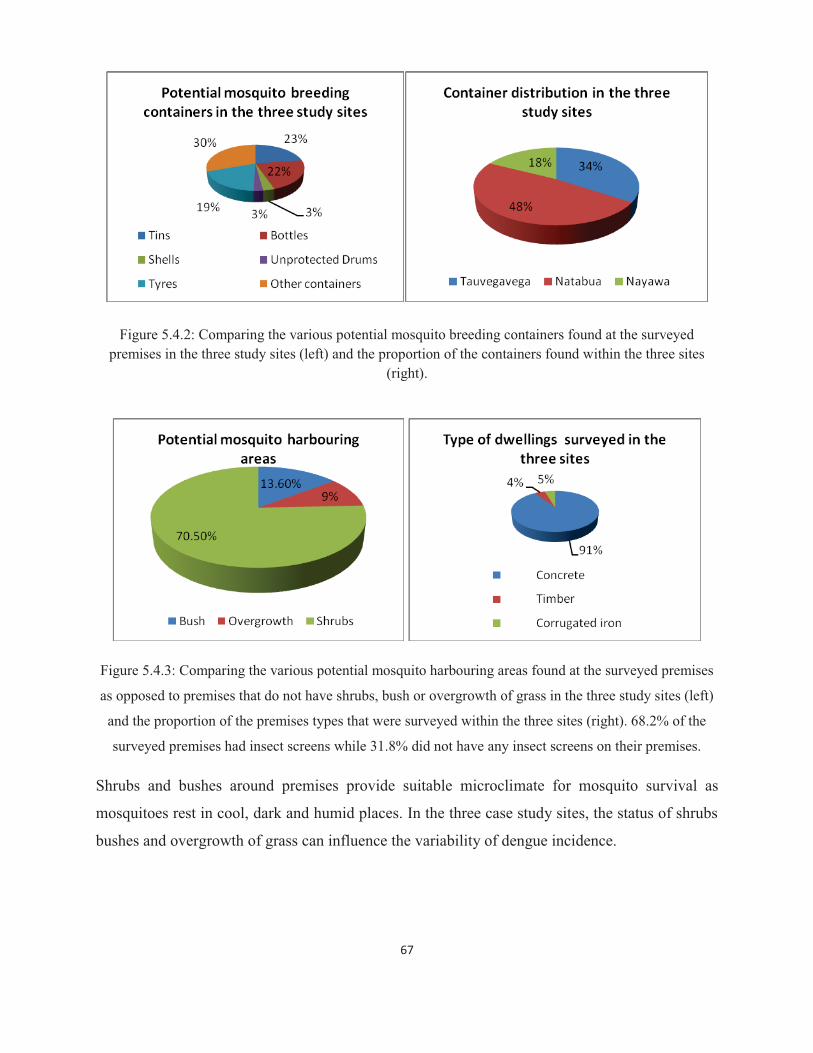
67
Figure 5.4.2: Comparing the various potential mosquito breeding containers found at the surveyed premises in the three study sites (left) and the proportion of the containers found within the three sites
(right).
Figure 5.4.3: Comparing the various potential mosquito harbouring areas found at the surveyed premises
as opposed to premises that do not have shrubs, bush or overgrowth of grass in the three study sites (left)
and the proportion of the premises types that were surveyed within the three sites (right). 68.2% of the
surveyed premises had insect screens while 31.8% did not have any insect screens on their premises.
Shrubs and bushes around premises provide suitable microclimate for mosquito survival as
mosquitoes rest in cool, dark and humid places. In the three case study sites, the status of shrubs
bushes and overgrowth of grass can influence the variability of dengue incidence.

68
Figure 5.4.4: Comparing the different mosquito protective equipment in use for the surveyed premises in
the three study sites (left) and the different times the protective equipments are used within the three sites
(right).
Most of the households surveyed use mosquito repellant to protect themselves from mosquito
bites. Only one family uses mosquito net while two families do not use any protection from
mosquito bites. However, it is noted that for those who use these protections, a majority of them
only use it at night while the ten families that use protection both day and night are doing it
because of the small children in the families. This is an observed practice in our local
communities where protection against mosquito bites during the day is used as a safety
precaution for small children. Therefore it can be deduced that the use of protection is targeted at
eliminating contact with mosquitoes due to mosquitoes’ irritating effects on humans rather than
the diseases it transmits. There is insufficient awareness that dengue mosquitoes specifically take
their bloodmeals during the day from dawn to dusk.
Gubler et al. (2001) and Reiter et al. (2003) implied that the living facilities in developing
countries do not effectively reduce their contacts with the dengue vector mosquitoes particularly
the lack of insect screens and air-conditioning. The Fijian lifestyle as described in Chapter 4,
particularly social gatherings which occur in outdoor open yards or temporary sheds facilitate
contact with the dengue vector (Gubler et al., 2001; Reiter 2001). Similar to the findings in the
United States by Gubler et al. (2001), the different dengue incidences between the localities
within the study sites could be attributed to the differences in their living standards and the
residents’ behavior. Likewise in Thailand, Thammapalo et al. (2007) associated the risk of

69
dengue with housing types and poor garbage disposal. Ma et al. (2008) also alluded to this as
discussed in section 5.3. WHO (2009b) stated that though dengue affects all level of societies,
the disease burden is usually greater in poorer communities where there is insufficient water
supply and solid waste disposal. WHO (2009b) is implying that those conditions in the
disadvantaged communities are conducive for the development of the aedes aegypti. Figure 5.4.1
indicates that water storage is common in the three sites despite their being serviced with the
government piped water supply. Furthermore, the three case study areas are serviced by the
municipals’ garbage collection system, however, refuse heaping in compounds and roadsides
was observed by the researcher (see Plate 3 below).
Plate 3: Backyard and roadside refuse heap at Tauvegavega, Ba (left) and Natabua, Lautoka (right).
(Photos: Kelera Oli).
Further to the observation pertaining to the possible areas contributing to mosquito abundance,
the behaviours that protect the populations from mosquito contact were observed as well. Ninety
one percent of the surveyed premises in the case study areas were of standard concrete structure
and about thirty one percent did not have any mosquito screens thus increasing their risk of
dengue infection during an epidemic. It was noted in Natabua that because the Public Rental
Flats and Housing Authority Flats (Plate 4 below) did not have sufficient open spaces there were
less discarded containers to be filled up with rain water, which ultimately reduces dengue
mosquito population in these areas in Natabua. This finding is consistent with Thammapalo et al.
(2007) in Thailand. Further analysis is given after Figures 5.4.5 and 5.4.6.
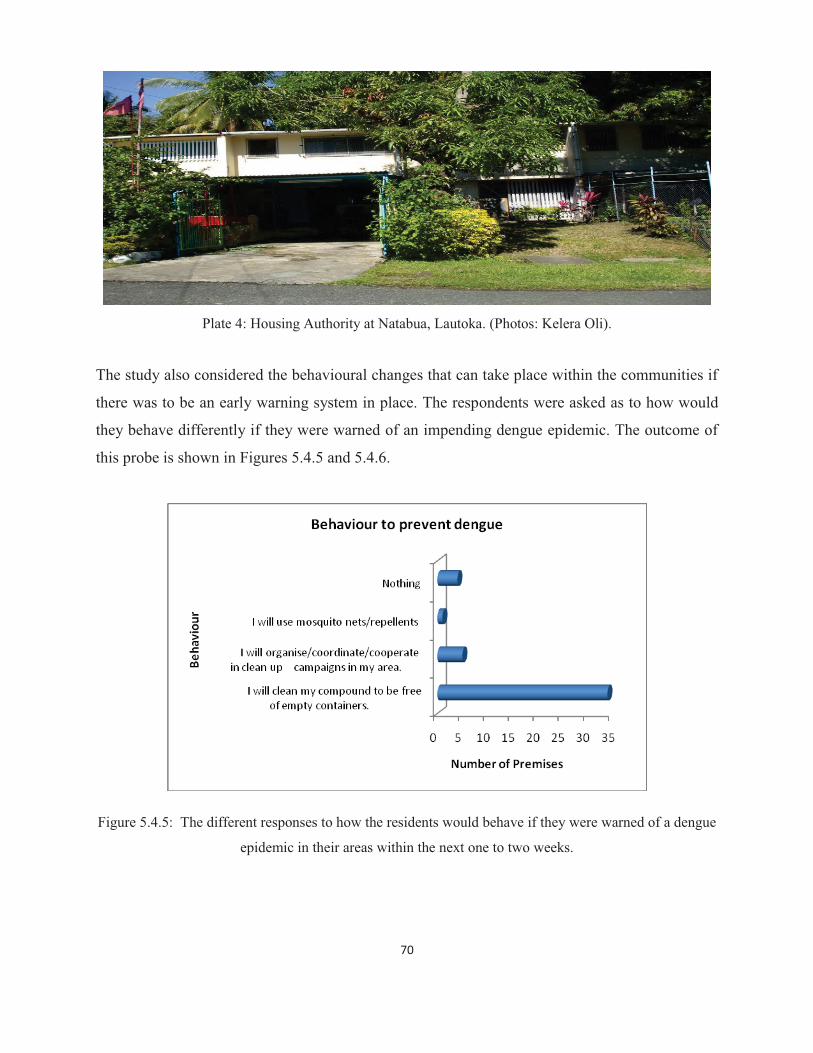
70
Plate 4: Housing Authority at Natabua, Lautoka. (Photos: Kelera Oli).
The study also considered the behavioural changes that can take place within the communities if
there was to be an early warning system in place. The respondents were asked as to how would
they behave differently if they were warned of an impending dengue epidemic. The outcome of
this probe is shown in Figures 5.4.5 and 5.4.6.
Figure 5.4.5: The different responses to how the residents would behave if they were warned of a dengue
epidemic in their areas within the next one to two weeks.
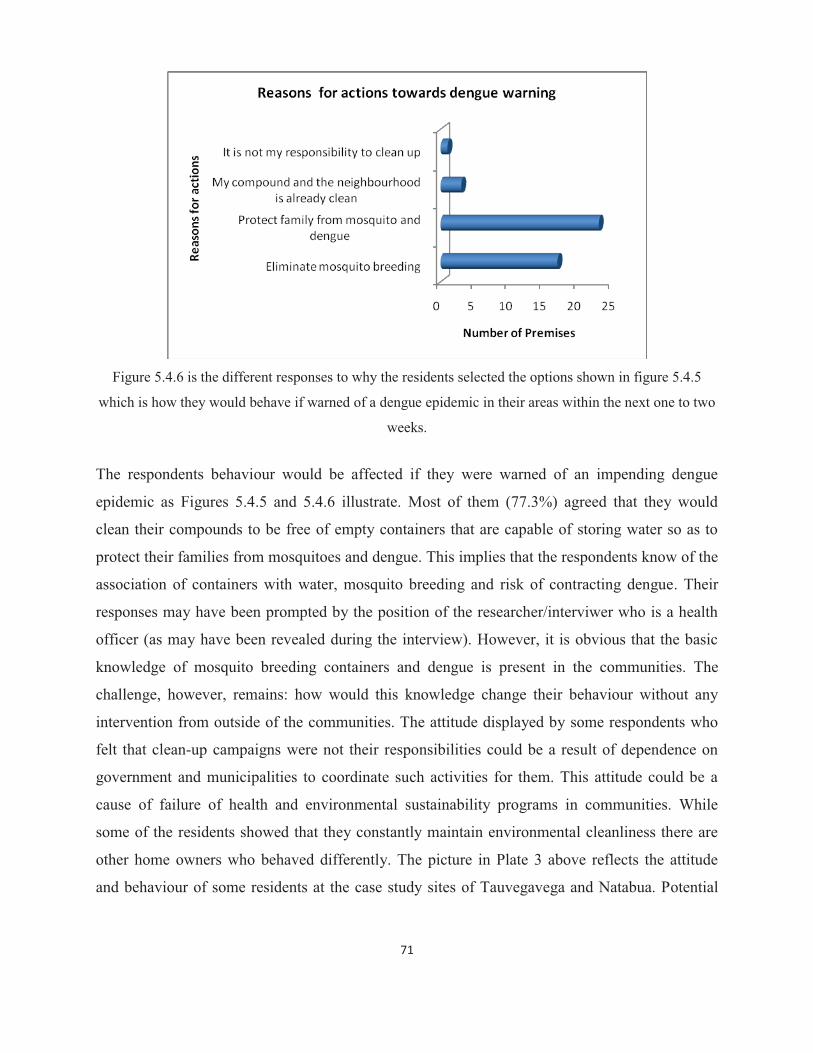
71
Figure 5.4.6 is the different responses to why the residents selected the options shown in figure 5.4.5
which is how they would behave if warned of a dengue epidemic in their areas within the next one to two
weeks.
The respondents behaviour would be affected if they were warned of an impending dengue
epidemic as Figures 5.4.5 and 5.4.6 illustrate. Most of them (77.3%) agreed that they would
clean their compounds to be free of empty containers that are capable of storing water so as to
protect their families from mosquitoes and dengue. This implies that the respondents know of the
association of containers with water, mosquito breeding and risk of contracting dengue. Their
responses may have been prompted by the position of the researcher/interviwer who is a health
officer (as may have been revealed during the interview). However, it is obvious that the basic
knowledge of mosquito breeding containers and dengue is present in the communities. The
challenge, however, remains: how would this knowledge change their behaviour without any
intervention from outside of the communities. The attitude displayed by some respondents who
felt that clean-up campaigns were not their responsibilities could be a result of dependence on
government and municipalities to coordinate such activities for them. This attitude could be a
cause of failure of health and environmental sustainability programs in communities. While
some of the residents showed that they constantly maintain environmental cleanliness there are
other home owners who behaved differently. The picture in Plate 3 above reflects the attitude
and behaviour of some residents at the case study sites of Tauvegavega and Natabua. Potential
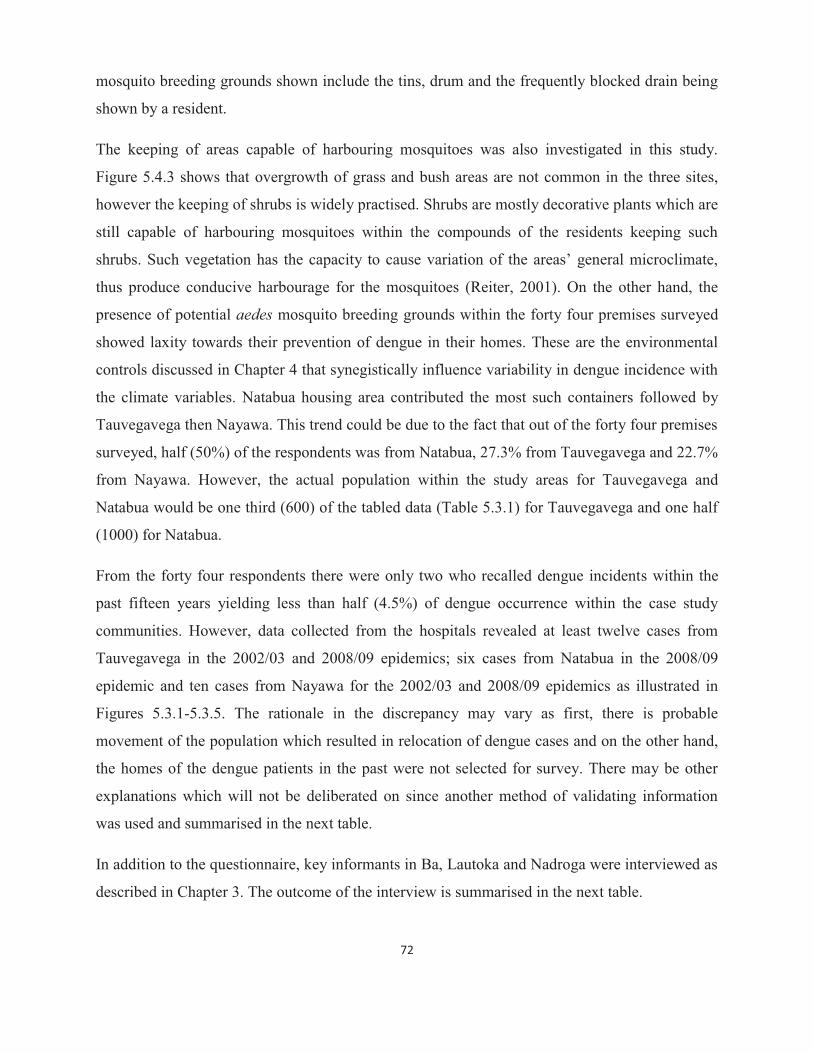
72
mosquito breeding grounds shown include the tins, drum and the frequently blocked drain being
shown by a resident.
The keeping of areas capable of harbouring mosquitoes was also investigated in this study.
Figure 5.4.3 shows that overgrowth of grass and bush areas are not common in the three sites,
however the keeping of shrubs is widely practised. Shrubs are mostly decorative plants which are
still capable of harbouring mosquitoes within the compounds of the residents keeping such
shrubs. Such vegetation has the capacity to cause variation of the areas’ general microclimate,
thus produce conducive harbourage for the mosquitoes (Reiter, 2001). On the other hand, the
presence of potential aedes mosquito breeding grounds within the forty four premises surveyed
showed laxity towards their prevention of dengue in their homes. These are the environmental
controls discussed in Chapter 4 that synegistically influence variability in dengue incidence with
the climate variables. Natabua housing area contributed the most such containers followed by
Tauvegavega then Nayawa. This trend could be due to the fact that out of the forty four premises
surveyed, half (50%) of the respondents was from Natabua, 27.3% from Tauvegavega and 22.7%
from Nayawa. However, the actual population within the study areas for Tauvegavega and
Natabua would be one third (600) of the tabled data (Table 5.3.1) for Tauvegavega and one half
(1000) for Natabua.
From the forty four respondents there were only two who recalled dengue incidents within the
past fifteen years yielding less than half (4.5%) of dengue occurrence within the case study
communities. However, data collected from the hospitals revealed at least twelve cases from
Tauvegavega in the 2002/03 and 2008/09 epidemics; six cases from Natabua in the 2008/09
epidemic and ten cases from Nayawa for the 2002/03 and 2008/09 epidemics as illustrated in
Figures 5.3.1-5.3.5. The rationale in the discrepancy may vary as first, there is probable
movement of the population which resulted in relocation of dengue cases and on the other hand,
the homes of the dengue patients in the past were not selected for survey. There may be other
explanations which will not be deliberated on since another method of validating information
was used and summarised in the next table.
In addition to the questionnaire, key informants in Ba, Lautoka and Nadroga were interviewed as
described in Chapter 3. The outcome of the interview is summarised in the next table.
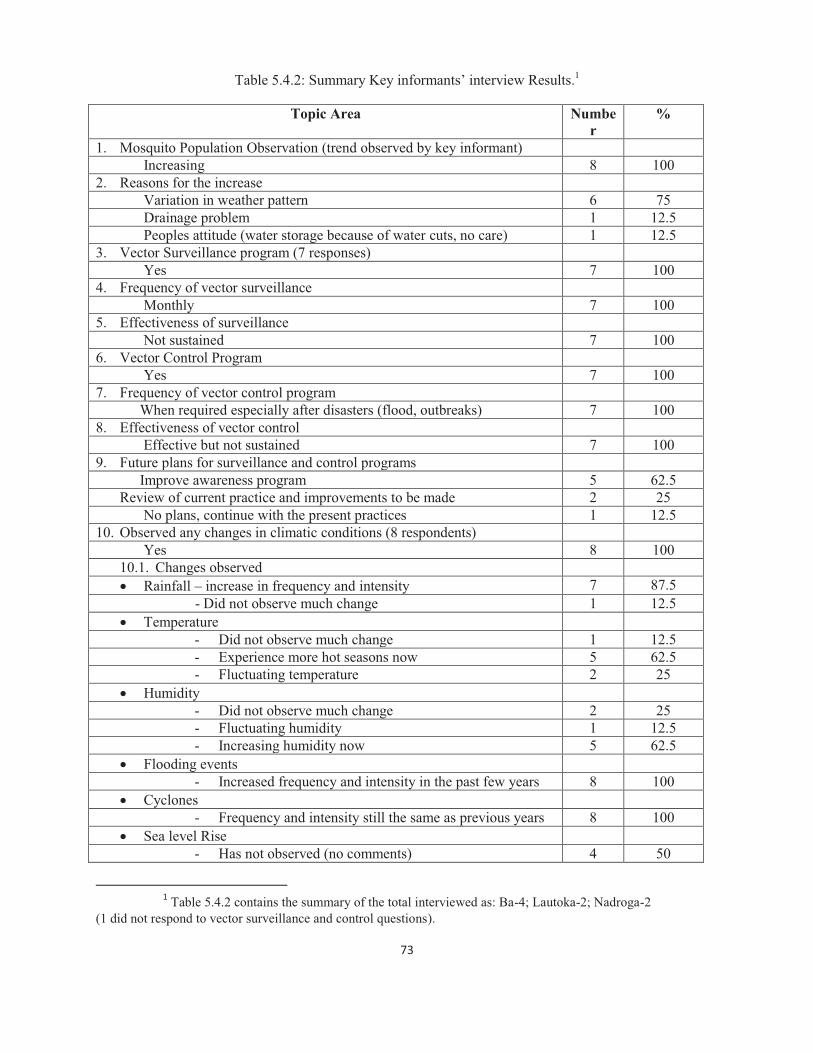
73
Table 5.4.2: Summary Key informants’ interview Results.1
Topic Area Number
%
1. Mosquito Population Observation (trend observed by key informant) Increasing 8 100
2. Reasons for the increase Variation in weather pattern 6 75 Drainage problem 1 12.5 Peoples attitude (water storage because of water cuts, no care) 1 12.5
3. Vector Surveillance program (7 responses) Yes 7 100
4. Frequency of vector surveillance Monthly 7 100
5. Effectiveness of surveillance Not sustained 7 100
6. Vector Control Program Yes 7 100
7. Frequency of vector control program When required especially after disasters (flood, outbreaks) 7 100 8. Effectiveness of vector control Effective but not sustained 7 100 9. Future plans for surveillance and control programs Improve awareness program 5 62.5
Review of current practice and improvements to be made 2 25 No plans, continue with the present practices 1 12.5
10. Observed any changes in climatic conditions (8 respondents) Yes 8 100
10.1. Changes observed � Rainfall – increase in frequency and intensity 7 87.5
- Did not observe much change 1 12.5 � Temperature
- Did not observe much change 1 12.5 - Experience more hot seasons now 5 62.5 - Fluctuating temperature 2 25
� Humidity - Did not observe much change 2 25 - Fluctuating humidity 1 12.5 - Increasing humidity now 5 62.5
� Flooding events - Increased frequency and intensity in the past few years 8 100
� Cyclones - Frequency and intensity still the same as previous years 8 100
� Sea level Rise - Has not observed (no comments) 4 50
1 Table 5.4.2 contains the summary of the total interviewed as: Ba-4; Lautoka-2; Nadroga-2
(1 did not respond to vector surveillance and control questions).
74
- Observed that the sea level has risen 4 50 � Drought events
- Did not observe much change 4 50 - Increase in droughts in some areas 4 50
� Inundation - Has not observed (no comments) 7 87.5 - It is happening in some areas 1 12.5
� Timing of wet and dry season - Interchanged with prolonged wet seasons 8 100
11. The changes in climatic conditions affects the mosquito population Yes 8 100
12. How is the mosquito population affected by the changing climatic conditions that were observed
Increases the mosquito population 8 100 13. Reason for the increase in mosquito population (as impact of C/C)
More mosquito breeding grounds as water fill up pools and containers 8 100 14. What can be done to address mosquito problem
More clean up campaigns with community involvement and awareness programs of climate change and mosquito breeding to the communities until change in behaviour is observed
5 62.5
Improve water supply to communities 2 25 Improve mosquito monitoring, surveillance and control 2 25 Increase health education and mosquito works budget 2 25
15. What should be done to address dengue better : Improve health facility response 1 12.5 Improve reporting procedure 3 37.5 Ensure collaboration 7 87.5
16. Explanation for above choices There is collaboration only after disasters and during outbreaks. This practice should change to one where the stakeholders are always working together to reduce dengue outbreak risk factors
8
Continued collaboration to see positive changes in behaviour towards cleaning drains and their rubbish storage. Tyres and containers are left carelessly in compounds to collect water and breed mosquitoes.
1
For resource sharing especially transport. 1 Reporting system from the hospitals need improvement especially in locating the contacts or patients. Line listing poorly done. Most cases in town/city areas are not reported to them or reported very late for intervention.
1
Focus on Prevention rather than after outbreaks. 1 The key informants had sufficient knowledge of climate variability and change and its effects on
dengue incidence. Seventy five percent of them agreed that the increasing mosquito predicament
in the study sites was due to localised climatic factors. However, twenty five percent believed
that the mosquito infestation problem was influenced by environmental conditions of poor drains
and water storage containers. The views of the key informants are substantiated from the fact that

75
these are the operational groups at the district level, who monitor the density of mosquitoes to
forecast dengue outbreak risk. The ‘blend’ in opinions indicates that climatic and environmental
determinants are both significant in influencing dengue incidence in the study sites. The vector
surveillance and control programs at the study sites are well coordinated and systematic as
expected by the Senior Health Inspector, Vector Control (Narayan 2012, pers. com). There is
climate change knowledge amongst the key informants particularly for the temperature and
rainfall variability, but humidity information is vague from the informants. All the key
informants concurred that the changing climatic features they have observed would increase the
population of mosquitoes because ground pools and containers would fill up with water thus
provide suitable mosquito breeding grounds. Further information collated from the key
informants interviews are incorporated in the recommendations of Chapter 6. However, the
questionnaire survey had interesting outcomes that were statistically analysed in SPSS and
summarised in the next section.
5.5 Observed correlations of knowledge, attitude and behaviours with dengue incidence as collated from the questionnaire
The observed correlations computed in this section used the data from the questionnaire and the
researcher’s observations. The dengue incidence recalled by the respondents in the household
questionnaire was two for the three case study communities. The next table summarises the
statistical analysis outcome for dengue and the socio-environmental variables under review in
this study.

76
Table 5.5.1: Correlation summary of dengue incidence and socio-environmental factors in the three case
study communities.
Confounding variables P-Value Significance Status
Community .345 Correlation is not significant
Length of stay .804 Correlation is not significant
Adults .518 Correlation is not significant
Children .201 Correlation is not significant
Mosquito Problem .484 Correlation is not significant
Use of protection equipment .924 Correlation is not significant
Time protection equipment is used .643 Correlation is not significant
Alternative water supply (storages) .300 Correlation is not significant
Mosquito proofing of alternative water supply (storages)
.251 Correlation is not significant
Shrubs .349 Correlation is not significant
Bush .125 Correlation is not significant
Type of dwelling (premises) .901 Correlation is not significant
Insect screening of houses (premises)
.323 Correlation is not significant
According to the Pearson Chi-square test, there is no significant statistical correlation between
the occurrence of dengue within the case study communities and all the confounding variables
explored in the study. The absence of statistical significance in this area could be due to reasons
such as sampling method and sample size of the survey. Despite the lack of significance in the
findings of this section, the discussions in Chapter 4 and in Sections 5.2 and 5.4, that the
variability of dengue incidence is also dependant on non-climatic factors such as socio-economic
and environmental features is widely supported. Studies (see Thammapalo et al., 2007) have
shown that the type of housing and their ways of life particularly for solid and liquid waste

77
management, social gathering practices in open yards and sheds, influence the dengue incidence
within the communities studied. Furthermore, Reiter (2001) explained that the physical
environment has the potential to modify the local climate. He implied that the vegetation as
found in the study sites can have lower mean temperatures as compared to nearby open spaces
and lawns. Likewise in dwellings, the different building materials used as well as building design
can alter the internal temperature. In turn, mosquitoes make use of these microclimate
adjustments to their advantage particularly for the domesticated aedes aegypti. Therefore, the
influence that the discussed non-climatic conditions have on dengue incidence should not be
ignored because of the absence of statistical significance in this study.
5.6 Chapter conclusion
This chapter comprised two main sections. First it presented and discussed the mapped dengue
cases in Ba, Lautoka and Nadroga for the epidemic years of 2002/03 and 2008/09 respectively. It
also entails the results of the research on the non-climatic variables in this study. The mapped
dengue cases for the three districts proved that dengue is still more of an urban disease but has
shown an outward infection into the rural areas particularly for Ba and Nadroga. The dengue
cases reflected on the maps also indicated that affected areas are mostly where the population
agglomerates for work and to commute. The non-climatic variables were at an average, well
controlled in the case study sites of Tauvegavega, Natabua and Nayawa. The questionnaire result
showed only two cases of dengue occurrence within the past fifteen years in the three case study
sites. This questionnaire data contradicted the dengue data collected from the district hospitals.
However, such discrepancies are attributed to reasons explained in 5.4 above. The association
between this dengue incidence and the non-climatic variables was not statistically significant.
However, this study cannot overlook the influence that the studied non-climatic variables have
on the incidence of dengue as cited literature supports that dengue incidence are related to the
latter variables.
78
CHAPTER SIX CONCLUSION AND RECOMMENDATIONS
6.1 Chapter introduction The overriding aim of this research was to explore the relationship between the climate variables
of humidity, temperature and rainfall, and the incidence of dengue in the three localities of Ba,
Lautoka and Nadroga. The research endeavored to answer the following question: what is the
relationship between dengue incidence and climate variability and change in the three localities
in Fiji? This concluding chapter evaluates how the researcher has achieved this aim and
answered the research question. A series of recommendations are also provided in this final
chapter that outline some key interventions that might improve the adaptive capacity of the
identified communities to dengue incidence associated with climate variability and change.
6.2 Summary of major findings This section presents the major findings that have answered the research question and meeting
the objectives. Statistical correlation analysis used in this study indicates that dengue incidence
in the three study sites is related to climate. In Ba, dengue incidence is significantly correlated to
the temperatures (minimum and maximum). This implies that for the study area of Ba, it can be
concluded that the minimum and maximum temperatures of the area influence the variability of
dengue incidence in Ba. The results showed that there was increased dengue incidence during the
months with higher temperature in Ba, particularly during the epidemics. Lautoka’s dengue
incidence is related to the maximum temperature implying that as the maximum temperature
increased in Lautoka there was also an increase in dengue cases. In Nadroga, the association was
observed for dengue incidence and rainfall concluding that there were more cases of dengue
during the period of high rainfall. These relationships are also displayed in Figures 4.4.1, 4.4.2
and 4.4.6. This finding mirrors that of other studies including Chen et al. (2010) who concluded
that warmer temperatures (with a three month lag) contribute to increased rates of dengue fever
transmission in Southern Taiwan. Moreover, Chowell et al. (2011) confirmed that the highly
persistent and large outbreaks in Peru occurred most frequently during the heavy rainy season,
when favourable environmental conditions promoted vector development. Similar to the findings
in Chowell et al. (2011), the 2002/03 and 2008/09 epidemics in the study sites occurred over the
heavy rainy season. However, the synergistic effects from other health determinants within the
communities were investigated as well. Health determinants include wealth, status of the public
health infrastructure, availability of sufficient water supply and sanitation. Thus, the vulnerability
79
of communities to the health impacts of climate change is determined by both climatic and non-
climatic factors (Ebi, 2011).
Climatic factors do not influence the occurrence of dengue in isolation. Localised environmental
factors and socio-economic conditions of the study communities influence this incidence of
dengue. The three case-study sites’ survey revealed that non-climatic variables did not have
statistically significant influence on the variability of dengue incidence in the communities.
However, this lack of significance was attributed to a variety of factors including the sampling
method and sample size of the survey. It is envisaged that with improved sampling methods this
study would have been consistent with the cited literatures showing statistical significance in the
association of dengue incidence and non-climatic factors.
In conclusion, the study reveals that the risk of dengue transmission increases with climate
variability and change if the non-climatic factor of mosquito control and surveillance is poor.
Climate projections for Fiji have shown that the country’s climate will continue to change. The
temperature in Fiji will continue to rise by at least an estimated range of 0.4-1.0°C by 2030
(ABM & CSIRO, 2011; GRF, 2012). There would be more very hot days and warm nights and a
decline in cooler weather. It is predicted that extreme rainfall days are likely to occur more often
in Fiji. This study has shown how climate influenced the dengue incidence in Ba, Lautoka and
Nadroga citing literature of mosquitoes’ dependence on climate in the crucial periods of
reproduction, maturation and survival. Therefore, it is essential that public health infrastructure is
strengthened to combat the threat of climate change and its impact on dengue incidence. The
recommendations that follow this conclusion are important so as to improve the adaptation and
resilience strategies in coping with dengue incidence induced by climate variability and change.
6.3 Recommendations The third objective of this study was to formulate recommendations that might improve the
adaptive capacity of the identified communities to dengue incidence associated with climate
variability and change. Hence, this section proposes recommendations from the outcome of this
study that may influence policy makers at the national level within the government, as well as
critical non-governmental organisations and others in civil society. Adaptive capacity in this
context is related to the ability of individuals, households and communities to shift their
behaviours in order to adjust to changing conditions. This study concurs with Gubler et al.
80
(2001), based on research conducted in the United States, that understanding people’s
vulnerability to the rates of change in relation to dengue is the basis for addressing adaptive
capacity. This is similar to a general suggestion from Woodward et al. (2000) that a measure of
vulnerability should be developed and exercised.
A time series analysis for dengue in the period 1996-2010 was described for the three study areas
of Ba, Lautoka and Nadroga. This dengue data was used with the climate data as the baseline for
the recommendations in this chapter. The ability to persuade key stakeholders in the public
health system to address behavioural changes within the system and the communities is a
strategic adaptive measure in reducing potential negative impacts of climate change on dengue
incidence. Integrated actions by the individuals in the communities, government and non-
governmental organisations are important to employ and sustain acquired adaptive capacity. The
ensuing recommendations are mindful of success stories of other intervention programs in
particular the rural Cambodia report as described by Khun and Manderson (2008). Khun and
Manderson (2008) asserted that public health systems need the active involvement of the
communities for dengue prevention and control strategies to be successful. However, according
to Ma et al. (2008), even though community participation is critical, the identification of specific
‘at-risk’ groups is cost effective and keeps the disease prevention effort focused. Therefore,
activities involving identification and mapping of dengue ‘hot-spots’ or high risk areas should be
prioritised accordingly. Ultimately, focused outreach activities to the ‘socioeconomically
disadvantaged residents’ would benefit dengue prevention and control programs.
The relationship of dengue incidence and climate variability and change has been elucidated in
this study warranting a proactive, well-resourced dengue surveillance and control system to be
established within the Ministry of Health. The study noted that there is an existing National
Dengue Strategic Plan (for the period 2010-2014), which has never been reviewed since its
inception in 2009 (Narayan 2012, pers. com). This plan, an excerpt of the Asia-Pacific Dengue
Strategic Plan (2008-2015) was prepared in response to the recognised risk from dengue. The
implementation of the same plan has not been strictly monitored. There is a dire need for the
review and consequent implementation of the National Dengue Strategic Plan because it
encompasses all the components that are needed to capacitate the Ministry of Health in building
resilience to dengue incidence particularly for epidemics. Core components of the plan

81
encompass dengue surveillance, integrated vector management, social mobilisation and
communication for dengue, dengue case management, dengue outbreak response, dengue
research (including climate change impacts), and health protection. The Ministry of Health
(2008) declared that dengue epidemics reflect the failure of the public health coordination in
early response. Building capacity and resilience of core personnel to be prepared for epidemics is
paramount for prevention or timely control of dengue epidemics. However, capacity building
should be broadly holistic considering all core components of the National Dengue Strategic
Plan when addressing dengue incidence and variability. Therefore, commitment from the upper
hierarchy of the public health system towards the review and implementation of the National
Dengue Strategic Plan should be mandatory. The plan should be used as a national operational
plan in the surveillance, prevention, control and management of dengue. The result of this study
recognises climate variability and change as factors influencing dengue incidence; however,
other important non-climatic factors, as addressed in the National Dengue Strategic Plan, are
fundamental in building resilience and capacity towards preventing dengue induced by climate
variables.
A core component of the National Dengue Strategic Plan which needs to be strengthened locally
is dengue research. Research studies should focus on aspects of the local dengue components as
outlined in the NDSP, which include: study on the epidemiology of dengue in Fiji; the clinical
diagnosis and treatment of dengue and the prevention and control of dengue in Fiji. This study
focused on dengue incidence, climate variables and environmental factors but not on the ecology
of the dengue vector. A key lesson from this study, building on the work of other researchers
(Herrera-Martinez & Rodriguez-Morales, 2010; Pham et al., 2011), is that the density or
abundance of the mosquito vector is of prime importance in dengue occurrence since the risk of
dengue viral transmission is higher. In addition to the non-climatic factors discussed in Chapter
5, climate influences the ecology of the dengue vector, including reproduction-feeding cycle,
maturation and its ultimate survival chances. Consequently, there is an increase in the population
that is capable of transmitting the dengue virus. Climatic factors have impacts on both the
vectors and the pathogens they transmit. Therefore, considering the host (vulnerable population)-
vector (mosquito)-pathogen (virus) relationship, further local research should deliberate on the
vector attribute of the transmission cycle. Ma et al. (2008, 17) stated that ‘the only effective
strategy to control a dengue epidemic, in the absence of a vaccine, is to eliminate aedes

82
mosquitoes and its larval breeding habitats.’ Therefore, recognising the need of the custodians of
vector control and the communities they serve pertaining to adaptive capacity means improving
the internal and external systems with evidence based information and technical knowledge.
Consequently, these are opportunities such as the one that enabled the researcher to conduct this
study. Furthermore, the prospect of pursuing dengue modeling with climatic and non-climatic
factors in Fiji should be encouraged. As a result, the effectiveness of dengue prevention and
control will be enhanced since an ultimate early warning system has potential to predict
impending dengue epidemics. Some regression models were explored in this study
demonstrating that local research is capable of ensuring that prediction models are improved and
used locally for early warnings of dengue transmission risks. This study shows that climate
variables of temperature and rainfall have correlations with dengue incidence that are statistically
significant, therefore, public health authorities should be prepared to endeavor into dengue and
climate modeling.
An important element of adaptive capacity is community behavioural change, which is set out in
the social mobilisation and communication section of the National Dengue Strategic Plan.
Behavioural change is a long termed process warranting committed set of resources. It is
common knowledge that the resources available within the public health sector are shared by a
variety of programs and other public health crises including disasters such as extreme weather
events and disease outbreaks. At a district level, like the study sites of Ba, Lautoka and Nadroga,
strengthening their public health infrastructure through financial upgrades and technical
knowledge is paramount. Subsequently, the socio-environmental factors can be efficiently
addressed through active and integrated vector control and surveillance. This assures that non-
climatic dengue risk factors are controlled as climate variability and change persist. On the other
hand, dengue management in the health facilities requires reinforcement. It was observed during
the study that the dengue algorithm outlined by Rabuatoka (2012, pers. com) was not broadly
practiced. In addition, dengue classification and reporting guideline was not in place in the health
facilities visited by the researcher. Therefore, policies should be established within the dengue
surveillance network to ensure that guidelines are comprehended and adhered to. The flexibility
observed within these systems need to be rectified. Under dengue surveillance, the researcher
faced challenges in retrieval of dengue data at the major hospitals visited. The responsibility of
data storing and archiving should be well comprehended by relevant authorities within the
83
Ministry of Health and appointment to such positions be guided by principles and
accountabilities from Fiji’s Archives Department. Capacity building within the health facilities
that collaborate with public health in dengue management is correspondingly essential. In
addition, improvement and wider coverage of PATIS should be considered so that specific
disease databases can be reliably and easily accessed.
The ultimate goal of forecasting dengue outbreaks and adapting to the impacts of global climate
change will be simultaneously achieved if the set of recommendations above are implemented.
Literature cited in this study give evidence to the importance of forecasting dengue outbreaks. In
proposing this recommendation, it corresponds to earlier assertions by Woodward et al. (2000)
that vulnerable nations need social policies that are capable of transferring economic
developments into human capacity building. The responsibility is positioned upon the leaders of
agencies that can make the required changes, particularly those in the public health hierarchy.
The implementation of the preceding recommendations has the capacity to address other climate-
related health issues in Fiji and other Pacific island countries.
84
REFERENCES
Andre RG, Kay BH, Kikau E and Waterman SH. 1992. Assessment of the Epidemiology of
Dengue and its Past, Present and Future Control in Fiji. VBC Report No. 81269. Fiji.
Australian Bureau of Meteorology and CSIRO. 2011. Climate Change in the Pacific: Scientific
Assessment and New Research. Volume 1: Regional Overview. Volume 2: Country
Reports.
Banu S, Hu W, Hurst C and Tong. 2011. Dengue transmission in the Asia Pacific region: impact
of climate change and socio environmental factors. Tropical Medicine & International
Health 16(5): 598-607.
Blanco JT and Hernandez D. 2008. The potential costs of climate change in tropical vector
borne diseases - a case study of malaria and dengue in Colombia. 67 LCR Sustainable
Development Working Paper No. 32, Ecoversa, Colombia.
Campbell-Lendrum DH, Corvalan CF and Pruss-Ustun A. 2003. How much disease could
climate change cause? In: McMichael, AJ, Campbell-Lendrum DH, Corvalan CF, Ebi KL,
Githeko A, Scheraga JD and Woodward A. (eds) Climate change and human health: Risks
and responses. World Health Organization, Geneva, pp. 133-155.
Chen SC, Liao CM and Chio CP et al. 2010. Lagged temperature effect with mosquito
transmission potential explains dengue variability in southern Taiwan: Insights from a
statistical analysis. Science of the Total Environment 408: 4069- 4075.
Chowell G, Cazelles B, Broutin H, Munayco CV. 2011. The influence of geographic and
climatic factors on the timing of dengue epidemics in Peru, 1994-2008. BMC Infectious
Diseases, 11. USA.
de Wet N and Hales S. 2000. Human Health. Technical Report (2000). Climate Change
Vulnerability and Adaptation Assessment for Fiji; Hamilton.
Degallier N, Favier C, Menkes C et al. 2009. Toward an early warning system for dengue
prevention: modeling climate impacts on dengue transmission; Springer 98: 581-592.
Ebi KL, Lewis ND, and Corvalan C. 2006. Climate variability and change and their potential
health effects in small island states: Information for adaptation planning in the health sector.
Environmental Health Perspectives 114: 1957.

85
Ebi KL. 2011. Climate Change and Health. In Encyclopedia of Environmental Health, edited by
O. N. Editor-in-Chief: Jerome, pp. 680-89. Burlington, Elsevier.
Fagbami AH, Mataika PJU, Shrestha M and Gubler DJ. 1995. Dengue type 1 epidemic with
haemorrhagic manifestations in Fiji; 1989 -90, Bulletin of the World Health Organization, 1995,
73 (3): 291-297.
Fiji Legislation. 1936. Public Health Act Cap 111. Fiji.
Fiji Meteorology Services. 2003. List of droughts that have occurred in Fiji from 1965 to 2000;
Information Sheet Number 126.
Focks AF and Barrera R. 2006. Dengue Transmission Dynamics: assessment and implications
for control. Scientific Working Group, report on Dengue. Geneva.
Githeko AK, Lindsay SW, Confalonieri UE and Patz JA. 2000. Climate change and vector borne
diseases: a regional analysis. Bull World Health Org 78(9): 1136-1147.
Githeko A. 2000. Health, climate change and climate variability – Exploring the future. KEMRI, Kisumu, Kenya.
Government of the Republic of Fiji. 2012. National climate change policy (Handbook).
Secretariat of the South Pacific Community, Suva, Fiji.
Gubler DJ, Reiter P, Ebi KL, Yap W, Nasci R and Patz JA. 2001. Climate variability and change
in the United States: Potential Impacts on Vector and Rodent-Borne Diseases.
Environmental Health Perspect 109: 223-233, USA.
Guillemot J. 2011. Summary report from Fiji' Piloting Climate Change Adaptation to Protect
Human Health (PCCAPHH) project. Suva.
Hales S, Weinstein P, Souares Y and Alistair Woodward. 1999. El Nino and the Dynamics of
Vectorborne Disease Transmission. Environmental Health Perspectives 107 (2): 99-102.
Hales S, Neil de Wet, Maindonald Y and Alistair Woodward. 2002. Potential effects of
population and climate changes on global distribution of dengue fever: an empirical model.
The Lancet 360: 830-34.
Hales S, Edwards SJ and Kovats RS. 2003. Impacts on Health of climate extremes. In:
McMichael, AJ, Campbell-Lendrum DH, Corvalan CF, Ebi KL, Githeko A, Scheraga JD
and Woodward A. (eds) Climate change and human health: Risks and responses. World
Health Organization, Geneva, pp. 79-96.

86
Herrera-Martinez AD and Rodriguez-Morales AJ. 2010. Potential influence of climate
variability on dengue incidence registered in a western pediatric Hospital of Venezuela.
Tropical Biomedicine 27(2): 280-286.
Hopp MJ and Foley JA. 2001 Global-Scale relationship between Climate and the Dengue Fever
vector, Aedes Aegypti. Climatic Change 48: 441-463.
Intergovernmental Panel on Climate Change (IPCC). 2007. Climate Change 2007: Synthesis
Report, Valencia, Spain, 12-17 November 2007.
Khun S and Manderson L. 2008. Community participation and social engagement in the
prevention and control of dengue fever in rural Cambodia. In Prasittisuk, C. (ed) Dengue
Bulletin, Volume 32, 2008. New Delhi, India, pp. 145-155.
Ling HY, Joacim R, Nawi Ng, Choon ST, Fung YP and Rainer S. 2009. Climate variability and
increase in intensity and magnitude of dengue incidence in Singapore. Global Health Action.
2. PubMed.
Loh B and Song RJ. 2001. Modeling dengue cluster size as a function of Aedes aegypti
population and control in Singapore. Dengue Bulletin 25:74-78.
Ma S, Ooi E and Goh K. 2008. Socioeconomic determinants of dengue incidence in Singapore.
In Prasittisuk, C. (ed) Dengue Bulletin, Volume 32, 2008. New Delhi, India, pp. 17-28.
Ministry of Health. 2010. Fiji National CD Surveillance and Outbreak Guidelines. Government
of the Republic of Fiji, Suva.
Ministry of Health. 2008. National Dengue Strategic Plan, 2010-2014. Suva, Fiji.
McMichael AJ. 2003. Global climate change and health: An old story writ large. In: McMichael,
AJ, Campbell-Lendrum DH, Corvalan CF, Ebi KL, Githeko A, Scheraga JD and Woodward
A. (eds) Climate change and human health: Risks and responses. World Health
Organization, Geneva, pp. 1-15.
McMichael AJ and Woodruff RE. 2008. Chapter 14. Climate change and infectious diseases. In:
Kenneth, HA and Pizer HF. (eds) The social ecology of infectious diseases. Elsevier, USA.
Otero M, Barmak DH, Dorso CO, Solari HG and Natiello MA. 2011. Modeling dengue
outbreaks. Mathematical Biosciences 232(2): 87-95.
Patz JA, Lendrum DC, Holloway T, Foley JA. 2005. Impact of regional climate change on
human health; Nature 438: 310-317.

87
Patz, JA, Olson SH, Uejio SK, and Gibbs HK. 2008. Disease Emergence from Global Climate
and Land Use Change. Medical Clinics of North America 92(6): 1473-91.
Patz JA, Githeko AK, McCarty JP, Hussein S, Confalonieri U and de Wet N. 2003. Climate
change and infectious diseases. In: McMichael, AJ, Campbell-Lendrum DH, Corvalan CF,
Ebi KL, Githeko A, Scheraga JD and Woodward A. (eds) Climate change and human
health: Risks and responses. World Health Organization, Geneva, pp. 103-127.
PCCAPHH. 2012. Working Paper- Climate-Sensitive Infectious Diseases in Fiji. 2011 Summary
report from Fiji’s Piloting Climate Change Adaptation to Protect Human Health
(PCCAPHH) project. PCCAPHH, Suva.
Pham HV, Doan HTM, Phan TTT and Minh NNT. 2011. Ecological factors associated with
dengue fever in a central highlands Province, Vietnam. BiomedCentral 11:172.
Prakash G, Raju A K and Koroivueta J. 2001. DF/DHF and Its Control in Fiji; Dengue Bulletin
25:21-27.
Reiter P. 2001. Climate Change and Mosquito-Borne Disease. Environmental Health
Perspectives 109 (suppl 1):141–161.
Shope R. 1991. Global Climate Change and Infectious Diseases. Environmental Health
Perspectives 96: 171-174.
Singh N, Kiedrzynski T, Lepers C and Benyon EK. 2005. Dengue in the Pacific-an update of the
current situation. Pacific Health Surveillance and Response 12 (2): 111-119.
Thai KT and Anders KL. 2011. The role of climate variability and change in the transmission
dynamics and geographic distribution of dengue. Society for Experimental Biology and
Medicine 236: 944-954.
Thammapalo S, Chongsuvivatong V, Geater A and Dueravee M. 2007. Environmental factors
and incidence of dengue fever and dengue haemorrhagic fever in an urban area, Southern
Thailand. Epidemiology and Infection 136: 135–143.
Tolba MK. 1992. Saving our Planet. Challenges and Hope. Chapman & Hall, London.
Van Kleef E, Bambrick H and Hales S. 2010. The geographic distribution of dengue fever and
the potential influence of global climate change. TropIKA. net. AHEAD: 0-0.

88
Wilkinson P, Campbell-Lendrum DH and Bartlett CL. 2003. Monitoring the health effects of
climate change. In: McMichael, AJ, Campbell-Lendrum DH, Corvalan CF, Ebi KL, Githeko
A, Scheraga JD and Woodward A. (eds) Climate change and human health: Risks and
responses. World Health Organization, Geneva, pp. 204-218.
Woodward A, Hales S, Litidamu N, Philips D and Martin J. 2000. Protecting human health in a
changing world: the role of social and economic development. Bulletin of the World Health
Organisation 78: 9: 1148-1153.
World Health Organization. 2003. Climate Change and Human Health- Risk and Responses.
WHO Library Cataloguing- in-Publication Data; France.
World Health Organization. 2009a. Protecting Health from Climate Change. WHO Library
Cataloguing-in-Publication Data; Denmark.
World Health Organization. 2009b. Dengue: guidelines for diagnosis, treatment, prevention and
control. WHO Library Cataloguing-in-Publication Data; Geneva.

89
APPENDIX 1: QUESTIONNAIRE Household survey: Dengue risk factors - ________________
Socio-economic characteristics
1. House Number (#1 being first house visited): ________________________ 2. How long have you lived in this area? _______________________________ 3. Has any family member or visitor to your home suffered from dengue in the past
15 years? (if yes, please fill in the table):
Number Age Sex Month/Year infected
What steps did you take to cure the patient?
Who else was involved in the process and what were their roles?
If one of the named was re-infected with dengue specify month/ year
4. How many people live in your house? Adults: _____ Children (15years and under): _______
5. Do you have a mosquito infestation problem (in the past years and present time)? □Yes □No □Sometimes
6. What year did you experience as the most severe mosquito problem period? ____________________________________________________________________
7. What mosquito protection equipment does your family use? □ Mosquito net □ Mosquito repellents □ Traditional □ Nothing
8. When do you use the protective equipment mentioned above? □Night time only □ Day time only □Day and night time
INFRASTRUCTURE/SERVICES
1.0 Do you have consistent water supply? □ Yes □ No 1.1 If No, what adaptive measures are taken by your family?
□ Store water in drums □ store water in containers □ collect water from other areas
1.2 Are the drums and/or containers mosquito proofed? □ Yes □ No
2.0 What garbage disposal system does your family use? ________________________
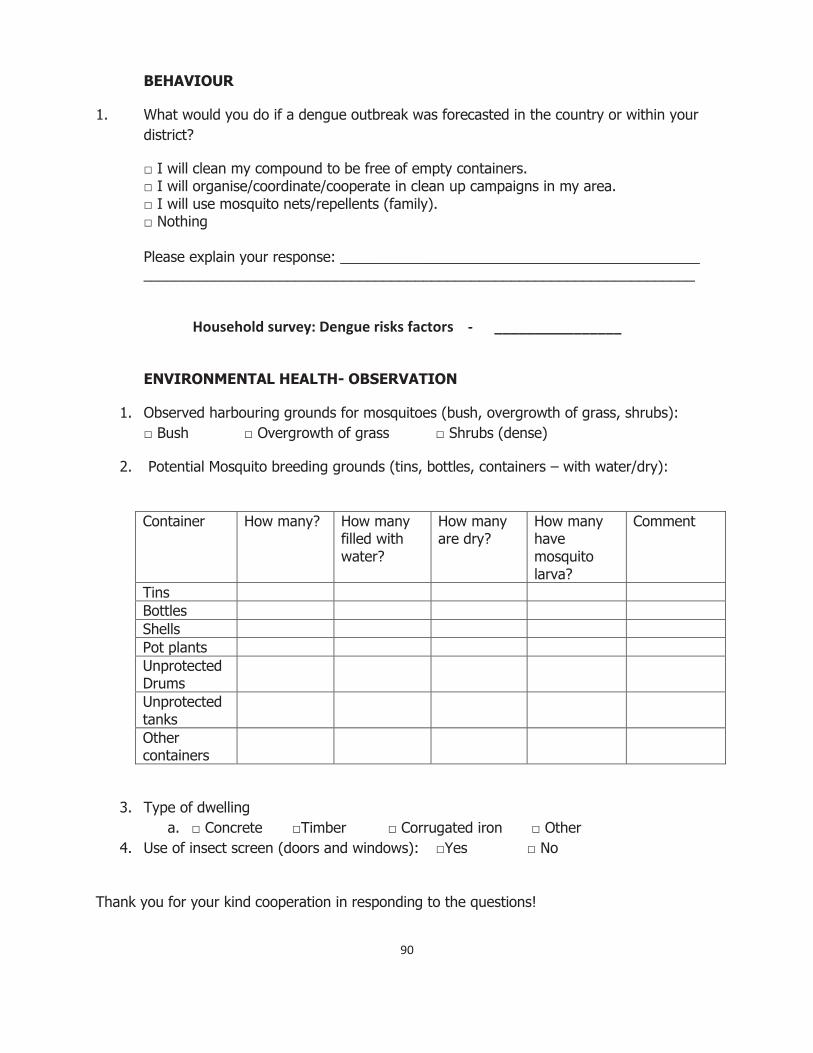
90
BEHAVIOUR
1. What would you do if a dengue outbreak was forecasted in the country or within your district?
□ I will clean my compound to be free of empty containers. □ I will organise/coordinate/cooperate in clean up campaigns in my area. □ I will use mosquito nets/repellents (family). □ Nothing
Please explain your response: _____________________________________________ _____________________________________________________________________
Household survey: Dengue risks factors - ________________
ENVIRONMENTAL HEALTH- OBSERVATION
1. Observed harbouring grounds for mosquitoes (bush, overgrowth of grass, shrubs): □ Bush □ Overgrowth of grass □ Shrubs (dense)
2. Potential Mosquito breeding grounds (tins, bottles, containers – with water/dry):
Container How many? How many filled with water?
How many are dry?
How many have mosquito larva?
Comment
Tins Bottles Shells Pot plants Unprotected Drums
Unprotected tanks
Other containers
3. Type of dwelling a. □ Concrete □Timber □ Corrugated iron □ Other
4. Use of insect screen (doors and windows): □Yes □ No
Thank you for your kind cooperation in responding to the questions!

91
APPENDIX 2: INFORMATION SHEET Participants Information Sheet
Project Title: The variability of dengue incidence in three localities in Fiji in relation to climate variability and change
Researchers: Principal researcher - Kelera Oli; Principal supervisor – Dr. Karen McNamara
Dear Sir/ Madam,
You are invited to participate in a climate change and dengue association survey that is being conducted in Tauvegavega, Ba; Natabua, Lautoka and Nayawa in Nadroga. The survey is part of a research that is investigating the relationship of climate variability and change and dengue incidence in your community. The aim of the survey is to obtain qualitative information on knowledge, attitudes and practices relevant to climate change and dengue. You may make a decision after reading this information sheet. Your decision will be respected.
What is your role as a participant?
The researcher will administer a questionnaire to you on issues pertaining to climate variability and change and dengue. Your identity will not be collected but you are requested to honestly answer the questions that the researcher will be asking from the prepared questionnaire. It is expected that at the end of the research, a set of recommendations that would improve resilience of your community to dengue incidence associated with climate variability and change would be prepared.
What procedures and data management protocols are involved?
Your household is one of the 10% systematically selected according to the total number of households in your community. The interview with the researcher will take about 30 minutes including time for the researcher to observe presence of potential mosquito breeding grounds and use of mosquito screens. All information gathered from the survey will be coded where appropriate and analyzed to contribute to qualitative information for the thesis. All the raw data from the survey will be destroyed after the conduct of the analysis. Your responding to the questions implies consent. You have the right to decline to answer any particular question.
If you have any questions about the survey, you may ask at any time during the interview or contact the researcher later at the below address:
Ms Kelera Oli PACE-SD (USP Student) Phone: 3232189 or 9361629
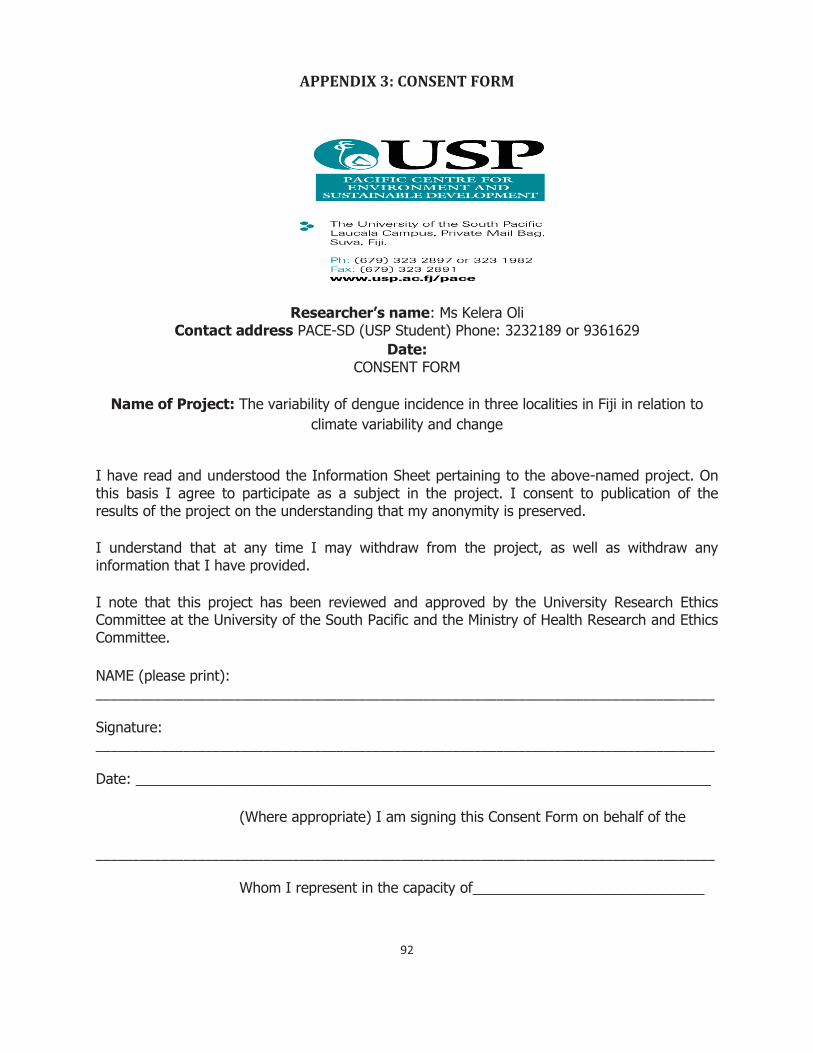
92
APPENDIX 3: CONSENT FORM
Researcher’s name: Ms Kelera Oli Contact address PACE-SD (USP Student) Phone: 3232189 or 9361629
Date: CONSENT FORM
Name of Project: The variability of dengue incidence in three localities in Fiji in relation to climate variability and change
I have read and understood the Information Sheet pertaining to the above-named project. On this basis I agree to participate as a subject in the project. I consent to publication of the results of the project on the understanding that my anonymity is preserved.
I understand that at any time I may withdraw from the project, as well as withdraw any information that I have provided.
I note that this project has been reviewed and approved by the University Research Ethics Committee at the University of the South Pacific and the Ministry of Health Research and Ethics Committee.
NAME (please print): _____________________________________________________________________________________
Signature: _____________________________________________________________________________________
Date: ________________________________________________________________________
(Where appropriate) I am signing this Consent Form on behalf of the
_____________________________________________________________________________________
Whom I represent in the capacity of_____________________________
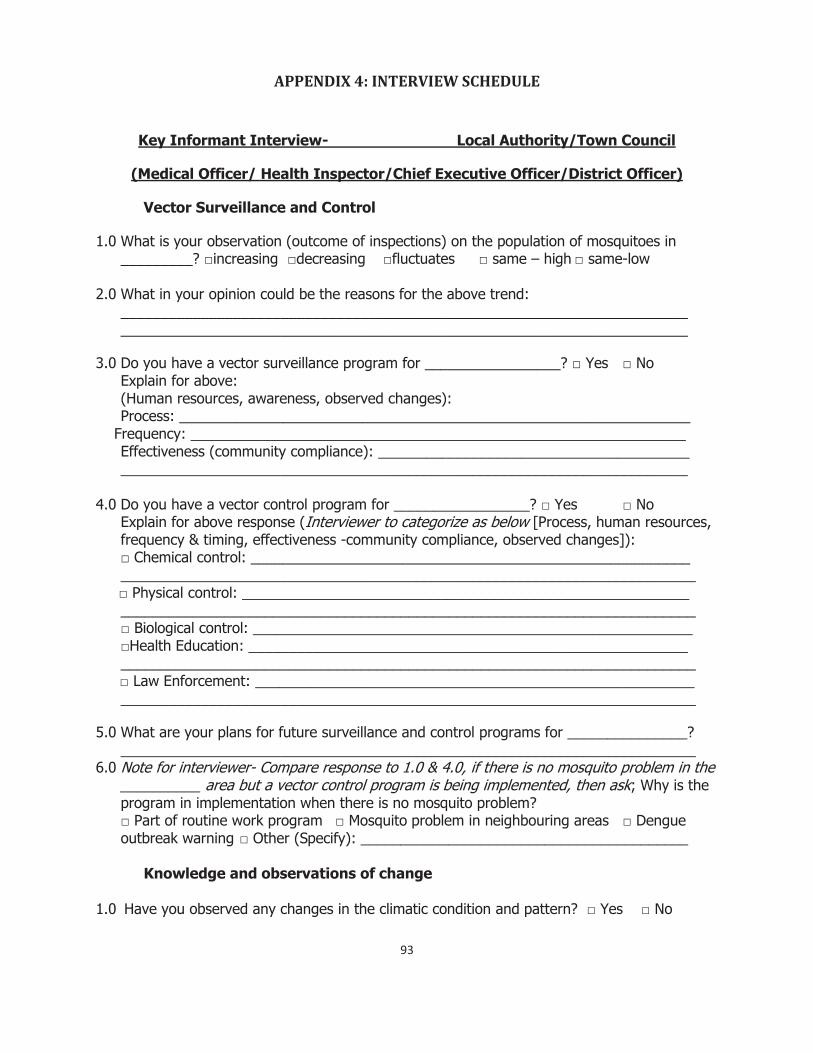
93
APPENDIX 4: INTERVIEW SCHEDULE
Key Informant Interview- Local Authority/Town Council
(Medical Officer/ Health Inspector/Chief Executive Officer/District Officer)
Vector Surveillance and Control
1.0 What is your observation (outcome of inspections) on the population of mosquitoes in _________? □increasing □decreasing □fluctuates □ same – high □ same-low
2.0 What in your opinion could be the reasons for the above trend: _______________________________________________________________________ _______________________________________________________________________
3.0 Do you have a vector surveillance program for _________________? □ Yes □ No Explain for above: (Human resources, awareness, observed changes): Process: ________________________________________________________________
Frequency: ______________________________________________________________ Effectiveness (community compliance): _______________________________________ _______________________________________________________________________
4.0 Do you have a vector control program for _________________? □ Yes □ No
Explain for above response (Interviewer to categorize as below [Process, human resources, frequency & timing, effectiveness -community compliance, observed changes]): □ Chemical control: _______________________________________________________ ________________________________________________________________________ □ Physical control: ________________________________________________________ ________________________________________________________________________ □ Biological control: _______________________________________________________ □Health Education: _______________________________________________________ ________________________________________________________________________ □ Law Enforcement: _______________________________________________________ ________________________________________________________________________
5.0 What are your plans for future surveillance and control programs for _______________? ________________________________________________________________________
6.0 Note for interviewer- Compare response to 1.0 & 4.0, if there is no mosquito problem in the __________ area but a vector control program is being implemented, then ask; Why is the program in implementation when there is no mosquito problem? □ Part of routine work program □ Mosquito problem in neighbouring areas □ Dengue outbreak warning □ Other (Specify): _________________________________________
Knowledge and observations of change 1.0 Have you observed any changes in the climatic condition and pattern? □ Yes □ No

94
2.0 Briefly describe the changes that you’ve observed: � Rainfall ______________________________________________________________ � Temperature __________________________________________________________ � Humidity _____________________________________________________________ � Flooding events _______________________________________________________ � Cyclones _____________________________________________________________ � Sea level rise _________________________________________________________ � Drought events ________________________________________________________ � Inundation ___________________________________________________________ � Timing of wet and dry Season ____________________________________________
3.0 Interviewer note; If there is an observed change (by the interviewee) in the above
variables, then ask- will climate change affect mosquito population? □ Yes □ No 3.1 If yes to above: How will the mosquito population be affected?
□Increase □ Decrease □ Remain the same 3.2 Explain your reasons for 3.1: ____________________________________________ _______________________________________________________________________ 4.0 What else can be done to address the situation in 3.0 above (if problem is observed)?
______________________________________________________________________________________________________________________________________________
5.0 What should be done to control dengue better in the ________________ community? □ Improve health facility (hospital & H/C) response- Explain: ______________________ _____________________________________________________________________ □ Improve reporting procedure (curative – preventive) – Explain: __________________ _____________________________________________________________________ □ Ensure collaboration/integration with stakeholders – Explain (specify stakeholders and
roles): _______________________________________________________________ _____________________________________________________________________ _____________________________________________________________________ _____________________________________________________________________ _____________________________________________________________________
Thank you for your kind cooperation in responding to the questions!