The van Hiele Analysis of Curricular Materials: A ...
156
University of Arkansas, Fayetteville University of Arkansas, Fayetteville ScholarWorks@UARK ScholarWorks@UARK Theses and Dissertations 12-2019 The van Hiele Analysis of Curricular Materials: A Comparative The van Hiele Analysis of Curricular Materials: A Comparative Study Study Vinay Kumar Kalyankar University of Arkansas, Fayetteville Follow this and additional works at: https://scholarworks.uark.edu/etd Part of the Curriculum and Instruction Commons, Educational Assessment, Evaluation, and Research Commons, Instructional Media Design Commons, Science and Mathematics Education Commons, and the Secondary Education Commons Citation Citation Kalyankar, V. K. (2019). The van Hiele Analysis of Curricular Materials: A Comparative Study. Theses and Dissertations Retrieved from https://scholarworks.uark.edu/etd/3511 This Dissertation is brought to you for free and open access by ScholarWorks@UARK. It has been accepted for inclusion in Theses and Dissertations by an authorized administrator of ScholarWorks@UARK. For more information, please contact [email protected].
Transcript of The van Hiele Analysis of Curricular Materials: A ...

University of Arkansas, Fayetteville University of Arkansas, Fayetteville
ScholarWorks@UARK ScholarWorks@UARK
Theses and Dissertations
12-2019
The van Hiele Analysis of Curricular Materials: A Comparative The van Hiele Analysis of Curricular Materials: A Comparative
Study Study
Vinay Kumar Kalyankar University of Arkansas, Fayetteville
Follow this and additional works at: https://scholarworks.uark.edu/etd
Part of the Curriculum and Instruction Commons, Educational Assessment, Evaluation, and Research
Commons, Instructional Media Design Commons, Science and Mathematics Education Commons, and
the Secondary Education Commons
Citation Citation Kalyankar, V. K. (2019). The van Hiele Analysis of Curricular Materials: A Comparative Study. Theses and Dissertations Retrieved from https://scholarworks.uark.edu/etd/3511
This Dissertation is brought to you for free and open access by ScholarWorks@UARK. It has been accepted for inclusion in Theses and Dissertations by an authorized administrator of ScholarWorks@UARK. For more information, please contact [email protected].

The van Hiele Analysis of Curricular Materials:
A Comparative Study
A dissertation submitted in partial fulfillment
of the requirements for the degree of
Doctor of Philosophy in Mathematics
by
Vinay Kumar Kalyankar
Osmania University
Bachelor of Mechanical Engineering, 1998
Wichita State University
Master of Science in Electrical and Computer Engineering, 2002
Wichita State University
Master of Science in Mathematics, 2004
University of Kansas
Master of Arts in Mathematics, 2010
December 2019
University of Arkansas
This dissertation is approved for recommendation to the Graduate Council.
Shannon Dingman, PhD
Dissertation Director
Laura Kent, PhD
Committee Member
Edmund Harriss, PhD
Committee Member
Bernard Madison, PhD
Committee Member

ABSTRACT
The goal of this study is to investigate K-8 geometry curriculum standards and textbooks
for their effectiveness in preparing students for high school geometry. The basis for the study is
van Hiele theory pioneered by the Dutch educators and researchers of geometric understanding
in adolescents, Dina van Hiele Geldof and Pierre van Hiele. Another driving force for this
dissertation is research into mathematics textbooks and curriculum standards of school
mathematics as seen in CCSSM and state specific standards documents, both of which influence
the mathematics students have the opportunity to learn.
The K-8 geometry curriculum standards and textbook instructional segments suitable for
van Hiele analysis were isolated and compared by their van Hiele levels. There were differences
in CCSSM and non-CCSSM standards documents, with the overall trend indicating lower van
Hiele levels as asserted by van Hiele researchers. However, a few textbooks had some higher
levels interspersed in their instructional segments. Examples of level 4 activities in middle grade
textbooks are provided in Chapter 3, while van Hiele level 4 tasks are not emphasized in any
standards documents. The results of this study indicate that if standards and textbooks can
consider young minds as they develop knowledge of the space around them then there could be
more effective ways to develop geometrical understanding, and consequently raise the success
rate of students in high school geometry.
The curricular materials were separated into two groups: K-5 and 6-8. The various
percentages of van Hiele levels were noted in all the materials analyzed as a guide to investigate
the rigor and opportunity students are provided with in grades K-8. South Carolina and Texas
standards’ documents have higher percentages of level 3 tasks (31% and 22% respectively) than
CCSSM (15%) in K-5 grades. Among K-5 textbooks Ready Math with 21% van Hiele level 3

content fared better than other K-5 textbooks and also better than CCSSM. For grades 6-8 neither
CCSSM nor any state specific standards’ documents contain van Hiele level 4 tasks, while all the
6-8 mathematics textbooks analyzed have level 4 content. Eureka Math has 49% tasks consisting
of levels 3 and 4 and this makes it better than CCSSM document (40% level 3, 0% level 4). The
other textbooks analyzed have lower level 3 + level 4 content (13% for Math in focus and 20%
for Open up Resources).

© 2019 by Vinay Kumar Kalyankar
All Rights Reserved
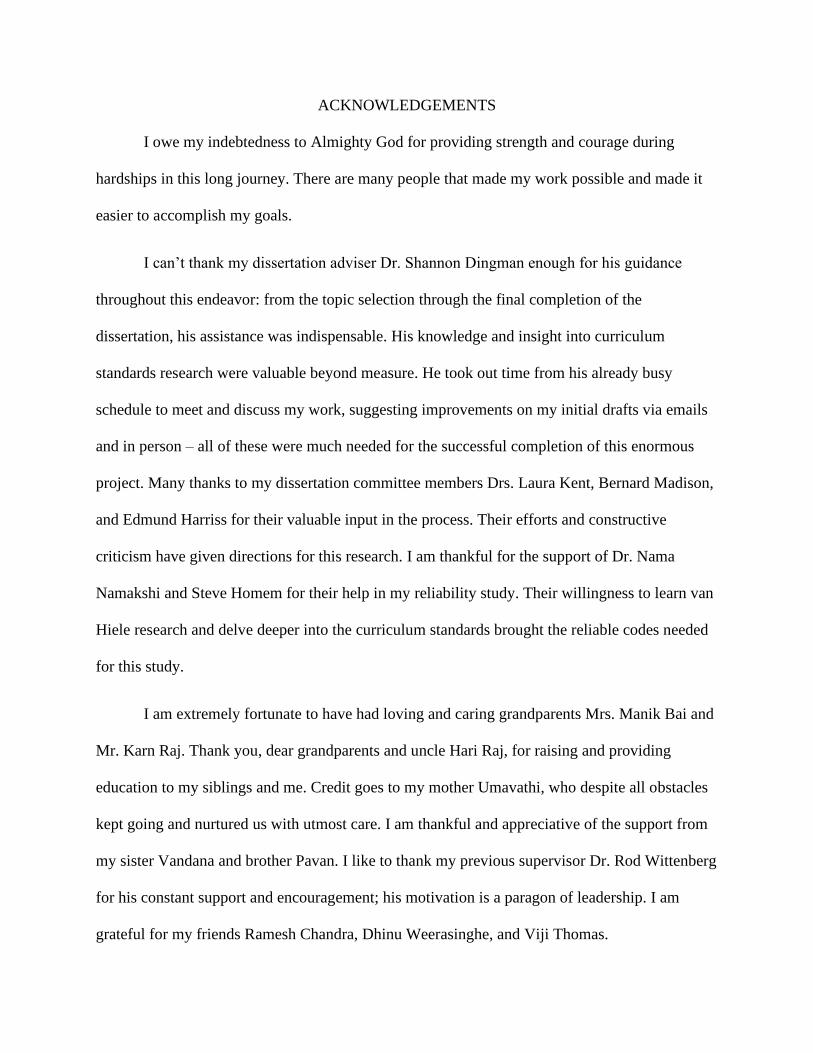
ACKNOWLEDGEMENTS
I owe my indebtedness to Almighty God for providing strength and courage during
hardships in this long journey. There are many people that made my work possible and made it
easier to accomplish my goals.
I can’t thank my dissertation adviser Dr. Shannon Dingman enough for his guidance
throughout this endeavor: from the topic selection through the final completion of the
dissertation, his assistance was indispensable. His knowledge and insight into curriculum
standards research were valuable beyond measure. He took out time from his already busy
schedule to meet and discuss my work, suggesting improvements on my initial drafts via emails
and in person – all of these were much needed for the successful completion of this enormous
project. Many thanks to my dissertation committee members Drs. Laura Kent, Bernard Madison,
and Edmund Harriss for their valuable input in the process. Their efforts and constructive
criticism have given directions for this research. I am thankful for the support of Dr. Nama
Namakshi and Steve Homem for their help in my reliability study. Their willingness to learn van
Hiele research and delve deeper into the curriculum standards brought the reliable codes needed
for this study.
I am extremely fortunate to have had loving and caring grandparents Mrs. Manik Bai and
Mr. Karn Raj. Thank you, dear grandparents and uncle Hari Raj, for raising and providing
education to my siblings and me. Credit goes to my mother Umavathi, who despite all obstacles
kept going and nurtured us with utmost care. I am thankful and appreciative of the support from
my sister Vandana and brother Pavan. I like to thank my previous supervisor Dr. Rod Wittenberg
for his constant support and encouragement; his motivation is a paragon of leadership. I am
grateful for my friends Ramesh Chandra, Dhinu Weerasinghe, and Viji Thomas.

Finally, I cannot say enough about the contribution of my wife Mamta and my boys
Sumedh and Vivek whose love and support in this project was priceless. Not only did they have
to suffer my negligence, they whole-heartedly pushed me to bring the best of me in this task.
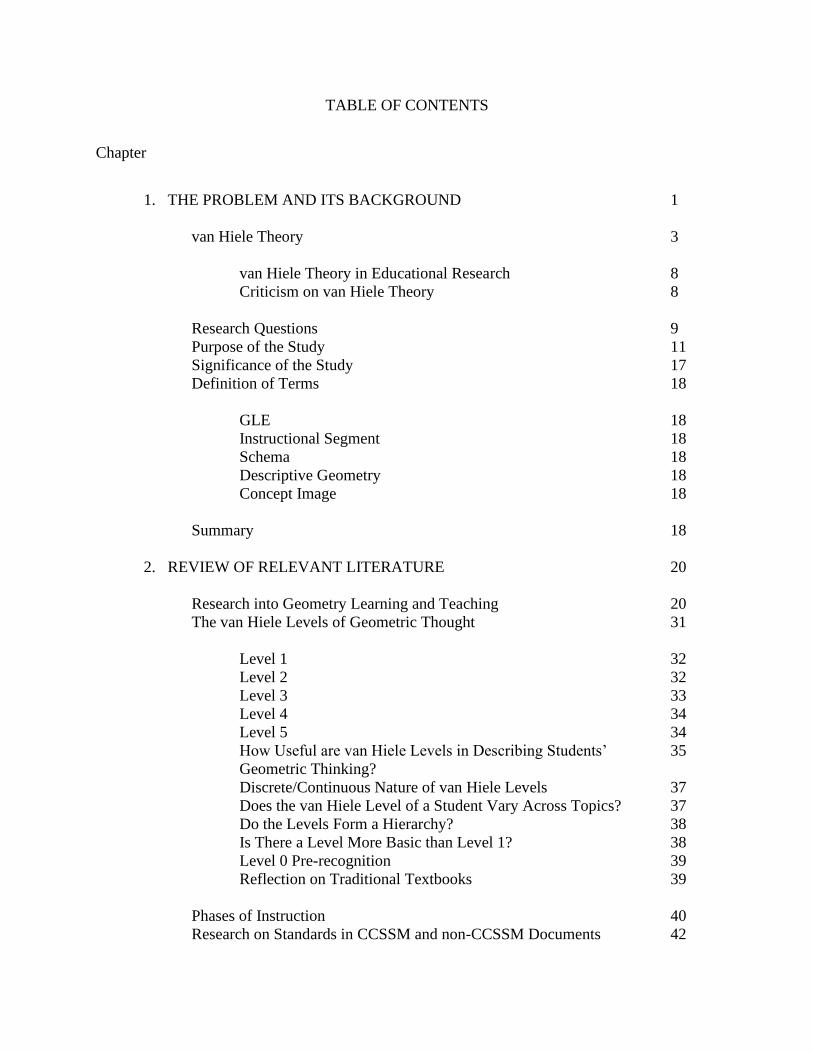
TABLE OF CONTENTS
Chapter
1. THE PROBLEM AND ITS BACKGROUND 1
van Hiele Theory 3
van Hiele Theory in Educational Research 8
Criticism on van Hiele Theory 8
Research Questions 9
Purpose of the Study 11
Significance of the Study 17
Definition of Terms 18
GLE 18
Instructional Segment 18
Schema 18
Descriptive Geometry 18
Concept Image 18
Summary 18
2. REVIEW OF RELEVANT LITERATURE 20
Research into Geometry Learning and Teaching 20
The van Hiele Levels of Geometric Thought 31
Level 1 32
Level 2 32
Level 3 33
Level 4 34
Level 5 34
How Useful are van Hiele Levels in Describing Students’ 35
Geometric Thinking?
Discrete/Continuous Nature of van Hiele Levels 37
Does the van Hiele Level of a Student Vary Across Topics? 37
Do the Levels Form a Hierarchy? 38
Is There a Level More Basic than Level 1? 38
Level 0 Pre-recognition 39
Reflection on Traditional Textbooks 39
Phases of Instruction 40
Research on Standards in CCSSM and non-CCSSM Documents 42

Research on Textbook Use in Mathematics Classrooms 44
Textbook Analyses 46
Research on van Hiele Levels in Curriculum Standards 47
Summary 48
3. METHODS 49
Selection of GLEs from CCSSM and Multiple State Standards 49
Documents
Selection of Instructional Segments and Descriptive Geometry 55
Problems
Analysis of Textbooks 57
Ready Math 57
Eureka Math 57
Go Math 58
Math in Focus 58
Open Up Resources 58
Reliability Analysis 65
4. DATA ANALYSIS AND RESULTS 68
Analysis of Curriculum Standards 69
Do more than one van Hiele level occur in the same grade in a 81
given curriculum document?
Analysis of Mathematics Textbooks 87
van Hiele Analysis of K-5 Mathematics Textbooks 90
van Hiele Analysis of 6-8 Mathematics Textbooks 93
Do more than one van Hiele level occur in the same 96
textbook for the same grade?
Comparison of CCSSM K-5 and K-5 Mathematics Textbooks 96
Comparison of CCSSM 6-8 and Grades 6-8 Mathematics Textbooks 97
Summary 102
5. SUMMARY, DISCUSSION, AND RECOMMENDATIONS 104
Summary of Results and Key Findings 105
Summary of van Hiele Levels in K-5 Standards 107
Summary of van Hiele Levels in 6-8 Standards 108
Agreement Between CCSSM and Mathematics Textbooks 108
for Grades K-5
Agreement Between CCSSM and Mathematics Textbooks 109
for Grades 6-8
Implications of the Study 109
Limitations of the Study 110
Directions for Further Research 112
Conclusion 114
REFERENCES 115
APPENDICES 127
Appendix A: van Hiele Levels in Standards Documents 127
Appendix B: van Hiele Levels in Mathematics Textbooks 130

LIST OF TABLES AND FIGURES
Figure 1. Squaring a binomial 14
Figure 2. Picture leading to the understanding of the relationship between 14
arithmetic and geometric means
Figure 3. Maximum area of a rectangle with a given perimeter occurs 15
in a square
Figure 4. Area of a circle from polygons 16
Figure 5. A geometric series with common ratio 0 < r < 1 converges 16
Table 1. Percentage of Grades 4 Students in each NAEP Achievement Level by 28
Year
Table 2. Percentage of Grade 8 Students in each NAEP Achievement Level by 29
Year
Figure 6. Quadrilaterals to be identified (Burger & Shaughnessy, 1986) 36
Table 3. List of non-CCSSM State Standards with Publication Dates 51
Table 4. List of Textbooks Analyzed and Their Publication Dates 56
Figure 7. A page showing descriptive geometry segment in Eureka Math 60
Figure 8. A page showing van Hiele level 1 task from Eureka Math. Reprinted 61
with permission from Eureka Math
Figure 9. A page showing van Hiele level 2 task. Reprinted with permission 62
from Open Up Resources
Figure 10. A page showing van Hiele level 3 task (Definition). Reprinted with 63
permission from Open Up Resources
Figure 11. A page showing van Hiele level 3 task (Experiences with Proof). 64
Reprinted with permission from Open Up Resources
Figure 12. A van Hiele level 4 task from grade 7. Reprinted with permission 65
from Open Up Resources
Table 5. Percentage of van Hiele Levels 1, 2, 3, and 4 GLEs in Standards 70
Documents
Table 6. Numbers of Descriptive Geometry GLEs in Standards Documents 71
Table 7. Numbers of Different van Hiele Levels by Grade in the Standards 72
Documents
Figure 13. Distribution of GLEs at three van Hiele levels by grades in CCSSM 74
Figure 14. Distribution of GLEs at three van Hiele levels by grade in Alaska 75

Mathematics Standards
Figure 15. Distribution of GLEs of three van Hiele levels by grades in Indiana 75
Academic Mathematics Standards
Figure 16. Distribution of GLEs of three van Hiele levels by grade in Minnesota 76
K-12 Academic Standards in Mathematics
Figure 17. Distribution of GLEs of three van Hiele levels by grade in Oklahoma 77
Academic Standards for Mathematics
Figure 18. Distribution of GLEs of three van Hiele levels by grade in Nebraska 78
College and Career Ready Standards in Mathematics
Figure 19. Distribution of GLEs of three van Hiele levels by grade in South 78
Carolina College and Career Ready Standards for Mathematics
Figure 20. Distribution of GLEs of three van Hiele levels by grade in Texas 79
Essential Knowledge and Skills for Mathematics
Figure 21. Distribution of GLEs of three van Hiele levels by grade in Virginia 80
Mathematics Standards of Learning
Table 8. Different van Hiele Level GLEs at the Same Grade Level 82
Table 9. Different Types of van Hiele Level 3 GLEs in Curriculum Standards 84
Documents
Table 10. Percentage of van Hiele Levels 1, 2, 3, and 4 in K-12 Standards 86
Documents
Table 11. Percentage of van Hiele Levels 1, 2, 3, and 4 in Grades 6-8 Curriculum 87
Standards Documents
Table 12. Percentage of van Hiele Levels 1, 2, 3, and 4 Tasks in K-5 Mathematics 89
Textbooks
Table 13. Percentage of van Hiele Levels 1, 2, 3, and 4 in Grades 6-8 Mathematics 89
Textbooks
Table 14. Numbers of Descriptive Geometry Instructional Segments in K-5 90
Textbooks
Table 15. Numbers of Different van Hiele Level Instructional Segments by 91
Grade in Eureka Math (K-5)

Table 16. Numbers of Different van Hiele Level Instructional Segments by 92
Grade in Go Math
Table 17. Number of Different van Hiele Level Instructional Segments by 93
Grade in Ready Math
Table 18. Number of Descriptive Geometry Instructional Segments in 6-8 94
Textbooks
Table 19. Number of Different van Hiele Level Instructional Segments by 94
Grade in Eureka Math (6-8)
Table 20. Number of Different van Hiele Level Instructional Segments by 95
Grade in Math in Focus
Table 21. Number of Different van Hiele Level Instructional Segments by 95
Grade in Open Up Resources
Figure 22. Distribution of descriptive geometry instructional segments at three 98
van Hiele levels in Eureka Math K-5
Figure 23. Distribution of descriptive geometry instructional segments at three 98
van Hiele levels in Go Math K-5
Figure 24. Distribution of descriptive geometry instructional segments at three van 99
Hiele levels in Ready Math K-5
Figure 25. Distribution of descriptive geometry instructional segments at four 100
van Hiele levels in Eureka Math (6-8)
Figure 26. Distribution of descriptive geometry instructional segments at four 101
van Hiele levels in Math in Focus (6-8)
Figure 27. Distribution of descriptive geometry instructional segments at four 101
van Hiele levels in Open Up Resources (6-8)
1
CHAPTER 1
THE PROBLEM AND ITS BACKGROUND
Children whose geometric thinking you nurture carefully will be better able to successfully study
the kind of mathematics that Euclid created.
Pierre van Hiele
Historically the debate about what mathematics is important in the K-12 curriculum and
the question as to how that body of knowledge should be disseminated and assessed has been a
recurring theme in mathematics education for more than a century. The evolution of content
standards as a guide for states to mandate the mathematical topics in schools can be traced back
to the end of the nineteenth century. The 1894 report of The Committee of Ten (National
Education Association, 1894) laid out curricular recommendations for school mathematics at
different grade levels, as the committee described mathematical topics germane at the different
grade levels of secondary schools. In the post-Sputnik period, with support from the National
Science Foundation (NSF) a new approach for mathematics and science was developed and used.
Topics such as set theory, symbolic logic, and modular arithmetic were introduced into the
school curriculum during this era of New Math from the late 1950s to early 1970s. The theme of
the 1970s was “back-to-basics” – the curriculum returned to its pre-New Math state with an
enhanced emphasis on developing skills and procedures. The 1980s was considered to be an era
where problem solving was emphasized in curriculum recommendations, although experts
question whether students became good problem solvers under these approaches (Schoenfeld,
2004).
In the 1970s and 1980s, research in cognitive science led to new ways of understanding
how knowledge, thinking, and learning in mathematics are developed. Informed by cognitive

2
science research, NCTM published Curriculum and Evaluation Standards for School
Mathematics in the fall of 1989 to guide the revision of school mathematics curriculum. Thus,
the standards era began and continues to this day. The federal legislation No Child Left Behind
Act of 2001 called for states to develop content standards and yearly assessments for grades 3-8
(Linn, Baker & Betebenner, 2002). In June 2010 the Council of Chief State School Officers and
the National Governor’s Association released The Common Core State Standards for
Mathematics (CCSSM). The principles of the CCSSM are engrained in deeper understanding of
mathematical concepts. The standards are driven by the mathematical practices which are based
upon the NCTM process standards of problem solving, reasoning and proof, communication,
representation, and communications; and also, by the strands of mathematical proficiency as
outlined in the publication Adding It Up (National Research Council, 2001):
Adaptive reasoning, strategic competence, conceptual understanding (comprehension of
mathematical concepts, operations and relations), procedural fluency (skill in carrying out
procedures flexibly, accurately, efficiently, and appropriately), and productive disposition
(habitual inclination to see mathematics as sensible, useful, and worthwhile, coupled with
a belief in diligence and one’s own efficacy). (CCSSM, 2010, p. 6)
The Standards for Mathematical Practice are as follows:
1. Make sense of problems and persevere in solving them.
2. Reason abstractly and quantitatively.
3. Construct viable arguments and critique the reasoning of others.
4. Model with mathematics.
5. Use appropriate tools strategically.
6. Attend to precision.
7. Look for and make use of structure.
8. Look for and express regularity in repeated reasoning.
At its height, CCSSM was adopted by 45 states, the District of Columbia, Guam, the American
Samoan Islands, the US Virgin Islands, the Northern Mariana Islands, and the Department of
Defense Education Activity (Reys, Thomas, Tran, Dingman, Kasmer, Newton, & Teuscher,
2013); the only states to never adopt CCSSM are Texas, Alaska, Nebraska, Virginia, and

3
Minnesota. Later, due to criticism and political considerations, three more states (Oklahoma,
Indiana, and South Carolina) de-adopted CCSSM in favor of standards written by teams of
educators in their own states. These standards outline the grade-level learning expectations
(GLEs) that are the focus of mathematical instruction at specific grade levels. The other 42 states
and U.S. territories adopted CCSSM as their primary guidance in establishing the mathematics in
K-12 schools, serving as one of the largest efforts to standardize the mathematics curriculum in
the U.S.
van Hiele Theory
While the debate was going on in the United States about the mathematics curriculum in
K-12, during the late 1950s in The Netherlands the van Hieles (Pierre M. van Hiele and Dina van
Hiele-Geldof) were developing a model for learning and teaching geometry to adolescents. The
van Hieles were high school geometry teachers who realized their students had difficulty
understanding their teachers when they were communicating geometry concepts. They
recognized that the students and teachers were viewing geometry differently. They concluded
that a student has to progress through different levels (0-4) in order to develop understanding of
geometry. These levels have their own characteristics: they are discrete, and what is intrinsic at
the lower level becomes extrinsic at the higher level. This means at the lower level a student
focuses on certain aspects of geometry and the same objects become the tools at the higher level
with which the student goes further in the subject. Two people who are at different van Hiele
levels will have difficulty understanding each other. Dina van Hiele-Geldof worked on the
didactics of raising the levels of students. The description of teaching phases is provided later in
this chapter. In the United States the original levels are numbered 1-5 and level 0 is reserved for
students who have not yet reached the first level. The need for this level is justified in the

4
research literature on van Hiele model (Clements & Battista, 1992b; Clements, Swaminathan,
Hannibal, & Sarama, 1999). Level 5 is difficult to measure and is not found in the research on
van Hiele literature. A brief summary of the five-original van Hiele levels are as follows:
Level 1 (Recognition): The students can only recognize basic geometric shapes because
an appearance of a particular geometric shape such as a rectangle triggers their visual memories.
A student must have seen a rectangle earlier and had the knowledge of that particular shape
being a rectangle. Beyond this, the student would not be able to provide any justification. This
student would refuse to accept the fact that a square is a rectangle. For a student at this level, the
visual appearance of a square is a conclusion that the shape they are looking at is a square and
only a square; they have mentally associated a rectangle with something that has two parallel
long sides and two parallel short sides, and four right angles.
Level 2 (Analysis): A student at this level has some experience with not only geometric
shapes but also their properties. A student here knows that geometric shapes have properties and
if a shape shown has properties of a parallelogram then they will accept a prototype that is
generally regarded as a square or a rectangle. This level is ahead of level 1 but still a student at
this level cannot deduce geometric facts.
Level 3 (Informal Deduction): These students are not only aware of the properties of
geometric figures and their inclusion relations but can also try to describe geometric shapes with
minimal properties, i.e., using definitions. For example, they can deduce the fact that the
diagonals of a rectangle bisect each other; or, although a parallelogram has several properties
(opposite sides are equal and parallel, adjacent angles are supplementary, etc.) a student at this
level knows that if he/she is given a quadrilateral with opposite sides parallel then that
quadrilateral has to be a parallelogram since the other properties of parallelogram are forced by

5
those conditions. However, students at this level do not appreciate formal deduction and do not
yet perceive the significance of axioms, propositions, and theorems.
Level 4 (Formal Deduction): These students can appreciate the role of axioms,
propositions, and theorems and try to use deductive arguments to extend their knowledge of
geometry. They understand the significance of proofs and they are convinced that logic is the
foundation on which mathematics is built. Students at this level can write meaningful proofs of
theorems in geometry.
Level 5 (Rigor): A student at this level can see the role of geometry in understanding the
nature of space and can compare different geometries such as non-Euclidean or spherical
geometry. At this level students try to understand what properties of plane geometry could be
very well extended to a certain space and which ones need to be qualified for the newer space.
For example, a student at this level realizes that the curriculum discusses plane geometry but the
earth we all live on is more or less spherical. In plane geometry, the sum of all angles of a
triangle is 180 degrees; a student at this level wonders if there was a triangle on a sphere, would
the sum of all its angles still be 180 degrees?
A detailed description of the van Hiele levels is provided in Chapter 2.
Crowley (1987), as mentioned in Newton (2011, p. 75), described student behavior at different
levels via examples. In the case of a question of why a given shape is a rectangle a student
response depends on their levels. The following are the typical responses.
Level 1 “It looks like one.”
“Because it looks like a door.”
Level 2 “Four sides, closed, two long sides, two shorter sides, opposite sides
parallel, four right angles.”
Level 3 “It is a parallelogram with right angles.”
Level 4 “This can be proved if I know this figure is a parallelogram and that one
angle is a right angle.”
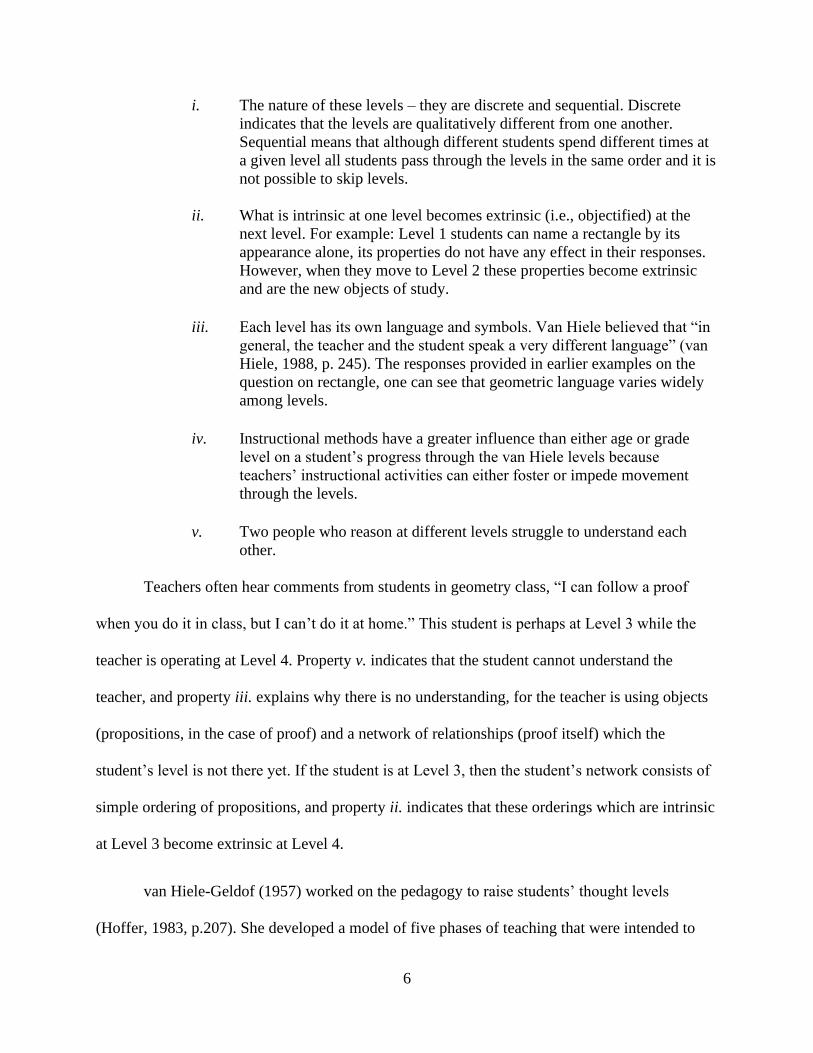
van Hiele also emphasized several important properties of the levels.
6
i. The nature of these levels – they are discrete and sequential. Discrete
indicates that the levels are qualitatively different from one another.
Sequential means that although different students spend different times at
a given level all students pass through the levels in the same order and it is
not possible to skip levels.
ii. What is intrinsic at one level becomes extrinsic (i.e., objectified) at the
next level. For example: Level 1 students can name a rectangle by its
appearance alone, its properties do not have any effect in their responses.
However, when they move to Level 2 these properties become extrinsic
and are the new objects of study.
iii. Each level has its own language and symbols. Van Hiele believed that “in
general, the teacher and the student speak a very different language” (van
Hiele, 1988, p. 245). The responses provided in earlier examples on the
question on rectangle, one can see that geometric language varies widely
among levels.
iv. Instructional methods have a greater influence than either age or grade
level on a student’s progress through the van Hiele levels because
teachers’ instructional activities can either foster or impede movement
through the levels.
v. Two people who reason at different levels struggle to understand each
other.
Teachers often hear comments from students in geometry class, “I can follow a proof
when you do it in class, but I can’t do it at home.” This student is perhaps at Level 3 while the
teacher is operating at Level 4. Property v. indicates that the student cannot understand the
teacher, and property iii. explains why there is no understanding, for the teacher is using objects
(propositions, in the case of proof) and a network of relationships (proof itself) which the
student’s level is not there yet. If the student is at Level 3, then the student’s network consists of
simple ordering of propositions, and property ii. indicates that these orderings which are intrinsic
at Level 3 become extrinsic at Level 4.
van Hiele-Geldof (1957) worked on the pedagogy to raise students’ thought levels
(Hoffer, 1983, p.207). She developed a model of five phases of teaching that were intended to
7
move students through the levels of geometric thinking (Fuys, Geddes, & Tischler, 1988, p.7).
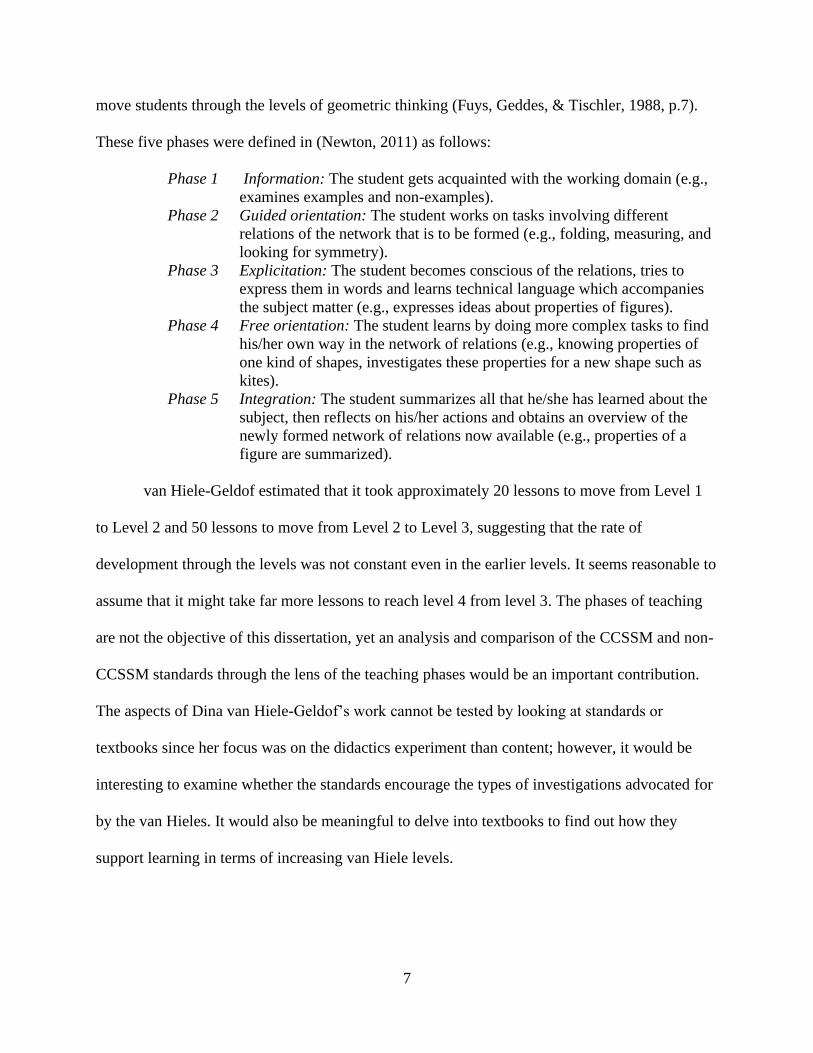
These five phases were defined in (Newton, 2011) as follows:
Phase 1 Information: The student gets acquainted with the working domain (e.g.,
examines examples and non-examples).
Phase 2 Guided orientation: The student works on tasks involving different
relations of the network that is to be formed (e.g., folding, measuring, and
looking for symmetry).
Phase 3 Explicitation: The student becomes conscious of the relations, tries to
express them in words and learns technical language which accompanies
the subject matter (e.g., expresses ideas about properties of figures).
Phase 4 Free orientation: The student learns by doing more complex tasks to find
his/her own way in the network of relations (e.g., knowing properties of
one kind of shapes, investigates these properties for a new shape such as
kites).
Phase 5 Integration: The student summarizes all that he/she has learned about the
subject, then reflects on his/her actions and obtains an overview of the
newly formed network of relations now available (e.g., properties of a
figure are summarized).
van Hiele-Geldof estimated that it took approximately 20 lessons to move from Level 1
to Level 2 and 50 lessons to move from Level 2 to Level 3, suggesting that the rate of
development through the levels was not constant even in the earlier levels. It seems reasonable to
assume that it might take far more lessons to reach level 4 from level 3. The phases of teaching
are not the objective of this dissertation, yet an analysis and comparison of the CCSSM and non-
CCSSM standards through the lens of the teaching phases would be an important contribution.
The aspects of Dina van Hiele-Geldof’s work cannot be tested by looking at standards or
textbooks since her focus was on the didactics experiment than content; however, it would be
interesting to examine whether the standards encourage the types of investigations advocated for
by the van Hieles. It would also be meaningful to delve into textbooks to find out how they
support learning in terms of increasing van Hiele levels.

8
van Hiele Theory in Educational Research
The soviet academician Pyshkalo applied this theory in Russian curriculum development
in 1968. Freudenthal, the van Hieles’ mentor, publicized the theory in his book Mathematics as
an Educational Task (1973). Through the Soviets and Freudenthal, the work of the van Hieles
came to the attention of Wirszup who introduced it in the United States. During 1980-83, the
National Science Foundation funded three major investigations of the theory in the United States
directed by William Burger at Oregon State University, Dorothy Geddes at Brooklyn College,
and Zalman Usiskin at the University of Chicago. Burger’s research involved the determination
of the model’s usefulness in describing children’s geometric thinking in elementary, middle, and
high school. Geddes focused on sixth- and ninth-graders geometric thinking. Usiskin assessed
the geometric reasoning of students enrolled in high school geometry courses by utilizing the
levels. After the three big studies, further research using the work of van Hieles continued in the
United States (Clements et al., 1999; Mason, 1989; Mistretta, 2000; Senk, 1989). The work of
the van Hieles was studied outside the United States as well, including in Spain (Gutierrez, 1996;
Gutierrez, Jamie, and Fortuny, 1991; Llorens, Fuster & Perez Carreras, 1997), South Africa
(Govender & deVilliers, 2002; Nixon, 2005), England (Monaghan, 2000), and Australia (Pegg,
1997).
Criticism on van Hiele Theory
The biggest drawback of the theory is its limited scope: van Hiele theory best applies to
descriptive geometry of simple two-dimensional shapes. However, the aim of geometry
education should be to develop an understanding of the space around us and hence should
include three-dimensional objects and non-Euclidean spaces like that of a sphere or a doughnut

9
in the real world. Intuition about real world and 3-d space in parallel might in fact aid in learning
2-d geometry as well (Sinclair, 2008).
The other criticism on van Hiele theory is the argument about the nature of levels.
Researchers have questioned and modified certain aspects of the levels such as
discrete/continuous nature as discussed in chapter 2.
Research Questions
Given the established nature of van Hiele theory in research on the teaching and learning
of geometry, and the role of curriculum standards and mathematics textbooks in teacher
instructional planning and student learning, it is natural to consider how standards and textbooks
adhere to van Hiele theory with respect to the treatment of geometry. With these considerations,
the research questions for this study are:
• How are the descriptive geometry GLEs distributed in K-8 standards documents?
• Do more than one van Hiele level occur in the same grade in standards documents?
• How are the descriptive geometry instructional segments distributed in K-5 mathematics
textbooks?
• How are the descriptive geometry instructional segments distributed in 6-8 mathematics
textbooks?
• Do more than one van Hiele level occur in the same textbook for the same grade?
Among the broad and diverse topics of mathematics this study focuses on geometry.
Although all areas of mathematics need attention, it is highly practical to pick a manageable
subset of the subject area and the choice of geometry for this study is motivated by the van
10
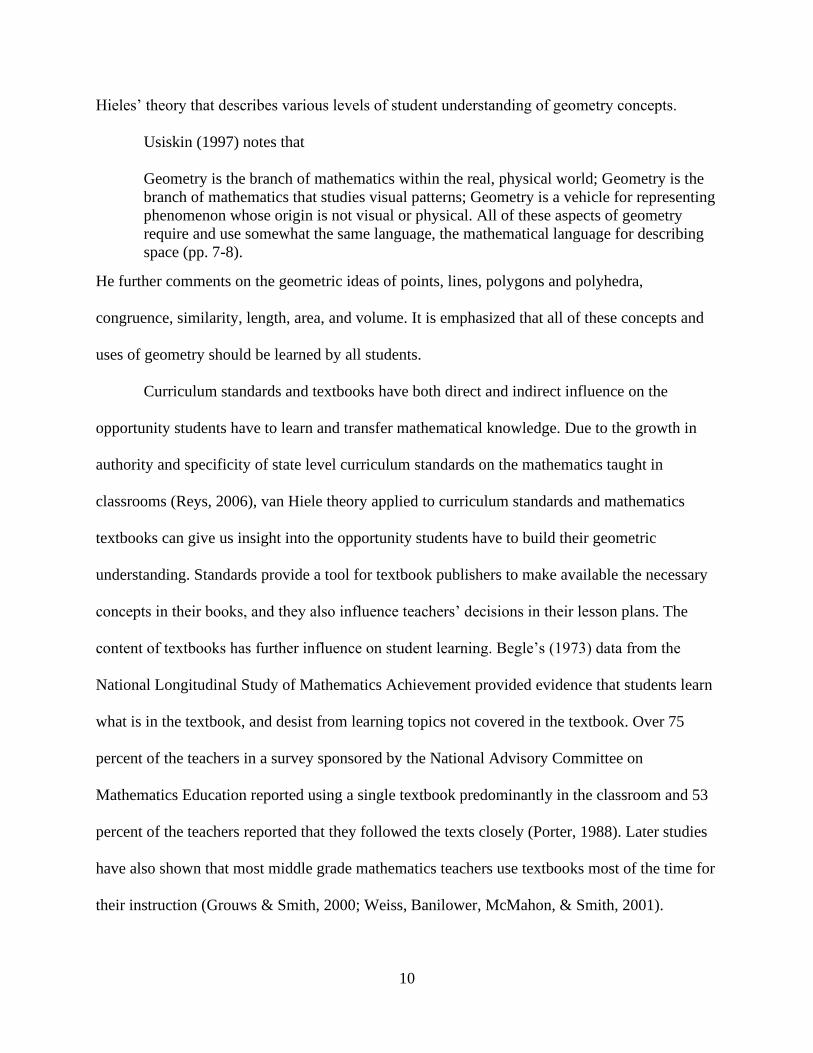
Hieles’ theory that describes various levels of student understanding of geometry concepts.
Usiskin (1997) notes that
Geometry is the branch of mathematics within the real, physical world; Geometry is the
branch of mathematics that studies visual patterns; Geometry is a vehicle for representing
phenomenon whose origin is not visual or physical. All of these aspects of geometry
require and use somewhat the same language, the mathematical language for describing
space (pp. 7-8).
He further comments on the geometric ideas of points, lines, polygons and polyhedra,
congruence, similarity, length, area, and volume. It is emphasized that all of these concepts and
uses of geometry should be learned by all students.
Curriculum standards and textbooks have both direct and indirect influence on the
opportunity students have to learn and transfer mathematical knowledge. Due to the growth in
authority and specificity of state level curriculum standards on the mathematics taught in
classrooms (Reys, 2006), van Hiele theory applied to curriculum standards and mathematics
textbooks can give us insight into the opportunity students have to build their geometric
understanding. Standards provide a tool for textbook publishers to make available the necessary
concepts in their books, and they also influence teachers’ decisions in their lesson plans. The
content of textbooks has further influence on student learning. Begle’s (1973) data from the
National Longitudinal Study of Mathematics Achievement provided evidence that students learn
what is in the textbook, and desist from learning topics not covered in the textbook. Over 75
percent of the teachers in a survey sponsored by the National Advisory Committee on
Mathematics Education reported using a single textbook predominantly in the classroom and 53
percent of the teachers reported that they followed the texts closely (Porter, 1988). Later studies
have also shown that most middle grade mathematics teachers use textbooks most of the time for
their instruction (Grouws & Smith, 2000; Weiss, Banilower, McMahon, & Smith, 2001).

11
This indicates that investigating standards documents and textbooks is a good starting
point to gain insight into the development of students’ knowledge of geometry. Among the
various standards in the CCSSM document and other state-specific standards documents, this
study focuses on GLEs that correspond to descriptive geometry in K-8. This refers to those topics
of geometry that deal with geometric figures and their relationships to each other. Aspects of
measurements and coordinates are not considered in this study; the van Hiele theory best applies
to descriptive geometry (Newton, 2011).
Purpose of the Study
High school geometry is a course not just substantial for its own sake but an essential tool
for success in calculus and other higher-level mathematics. A good understanding of geometry
aids in better assimilation of algebra; a combination of algebra and geometry is needed by all
students for success in college. And even in mathematics where geometry is not a requirement, a
sound knowledge of geometry provides an upper hand in grasping higher-level concepts.
Geometry taught in the K-12 curriculum affects a great many students. In the 1992 NAEP
examination, 77% of 17-year olds reported having taken a geometry course. Two years earlier
this percentage was 71%, and 14 years earlier it was only 53%. This 77% of students is greater
than the percent of students who graduate from high school on time, so it seems that virtually all
students who stay in school are taking geometry; the percentages are even higher today. In more
recent times US students performed better in mathematics in general, but poorly in geometry in
particular (Dossey, McCrone, and Halvorsen, 2016). Although there are many factors which lead
to the learning opportunity an individual is exposed to, there are universal curriculum standards

12
that bind a vast majority of students; investigating these standards might hold a key to
understanding the knowledge they gain while they are in schools.
The phenomenal work done by the van Hieles in the area of geometric understanding has
attracted the attention of several researchers. In this undertaking the curriculum standards and
textbooks are studied through the lens of van Hiele theory. The CCSSM gained popularity as
soon as they were released in 2010 and within its first year 45 out of the 50 states adopted the
standards. The adoption of CCSSM set off a flurry of activity in producing textbook and
supplementary materials aligned to the standards in order to support teachers in their
implementation of CCSSM. There is no major study that tracked the van Hiele theory in
curriculum standards and K-8 mathematics textbooks. By focusing our attention on descriptive
geometry standards, we can make inquiries into a manageable part of the K-8 geometry;
moreover, there is a body of knowledge that has undertaken a similar study prior to the CCSSM
(Newton, 2011). The van Hiele theory was specifically developed for use in geometry; it has
strong research support from both qualitative (Burger & Shaughnessy, 1986; Monaghan, 2000)
and quantitative (Clements, et al., 1999; Senk 1989) studies; and it has “elegance,
comprehensiveness, and wide applicability” (Usiskin, 1982, p.6).
The significance of geometry as a discipline cannot be overemphasized. Its value as a
tool in solving practical problems – travel and navigation, measurement of land, buildings of
monuments and structures – has always been felt throughout most of the known history of
mankind. The earliest documented record of geometric thinking dates back to Thales of Miletus
around 600 B.C. After this period, Greek mathematicians’ theoretical point of view towards
geometry culminated in the 13-book treatise by Euclid of Alexandria known as Elements.

13
The Elements is the basis of most of high school geometry; other geometries such as
finite geometry and non-Euclidean geometry can be derived by denying or modifying certain
postulates. The Elements was a basic resource in all of Europe for over 2000 years to study
mathematics. It encompasses all of the known geometry at that time into a large axiomatic
system; it uses geometry to develop significant results in other areas of mathematics – theory of
divisibility, infinitude of primes, and the quadratic formula are some of the topics discussed in
the Elements. Usiskin et al. (2003) provide three perspectives to study Euclidean geometry:
traditional, transformation, and vector methods. The oldest and most prevalent approach in K-12
geometry is traditional, which stems from the axioms and postulates of Euclid.
Some of the reasons researchers believe for the teaching of geometry are
• Geometry uniquely connects mathematics with the real, physical world
• Geometry uniquely enables ideas from other areas of mathematics to be pictured
• Geometry nonuniquely provides an example of a mathematical system. (Usiskin,
1980).
It is the author’s belief that a rigorous understanding of high school geometry aids in the
mastery of other areas in the mathematical discipline. The following are some examples where
geometry helps in better understanding other areas of mathematics:
• In algebra, a common mistake made by many students, in some cases in calculus, and
differential equations too, is to think that the square of a binomial could be obtained
simply by squaring individual terms; what they fail to realize is that
(a + b) 2 ≠ a2 + b2.
To present an argument using geometry, see Figure 1.

14
Figure 1. Squaring a binomial
The picture makes it clear that (a + b) 2 is the area of the biggest square and a2 + b2 is just
the sum of the two squares on the corners. Furthermore, the picture also helps to realize
the correct formula: (a + b) 2 = a2 + 2ab + b2.
• Some students in algebra come to learn that the geometric mean of two numbers x and y
is bounded above by their arithmetic mean. Geometry provides a picture that
demonstrates this relationship.
Figure 2. Picture leading to the understanding of the relationship between arithmetic and
geometric means
B
C
A D
15
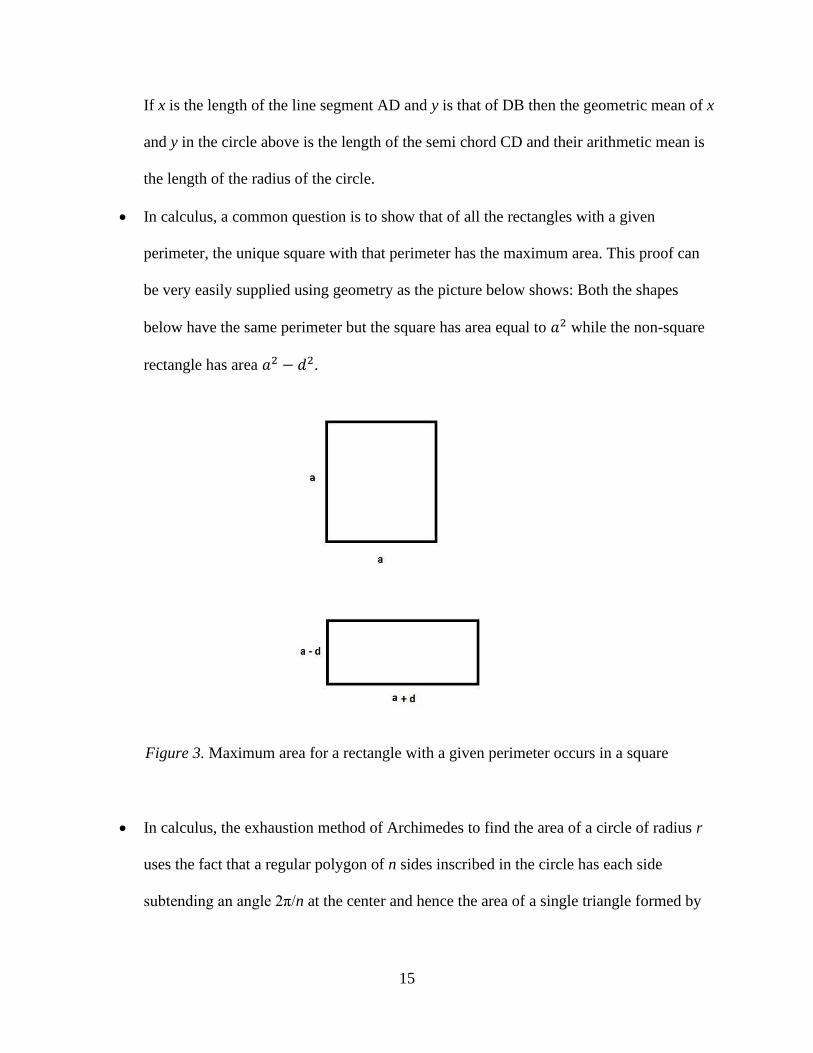
If x is the length of the line segment AD and y is that of DB then the geometric mean of x
and y in the circle above is the length of the semi chord CD and their arithmetic mean is
the length of the radius of the circle.
• In calculus, a common question is to show that of all the rectangles with a given
perimeter, the unique square with that perimeter has the maximum area. This proof can
be very easily supplied using geometry as the picture below shows: Both the shapes
below have the same perimeter but the square has area equal to 𝑎2 while the non-square
rectangle has area 𝑎2 − 𝑑2.
Figure 3. Maximum area for a rectangle with a given perimeter occurs in a square
• In calculus, the exhaustion method of Archimedes to find the area of a circle of radius r
uses the fact that a regular polygon of n sides inscribed in the circle has each side
subtending an angle 2π/n at the center and hence the area of a single triangle formed by

16
two radii and one side of the regular polygon is r2sin(2π/n)/2. As n → ∞ the area of the
polygon tends to the area of the circle. So, area of the circle can be shown to be 𝜋𝑟2.
Figure 4. Area of a circle from polygons
The picture also exemplifies the notion of a limit.
• Beginning calculus students have trouble with convergence of a positive series. The
picture below clarifies that the following geometric series converges to 1.
Figure 5. A geometric series with common ratio 0<r<1 converges
This example also introduces the notion of a limit in a visual form.
17
Significance of the Study
The intended curriculum, as laid out in the standards documents, as well as the enacted
curriculum, as seen in popular textbooks, provide an insight into the opportunity students will
have to learn mathematics. The existing literature informs us that students and teachers make
extensive use of textbooks at their disposal, and that the instructional approaches suggested by
the textbooks often influence teachers’ pedagogical strategies (Grouws & Smith, 2000; NRC,
2004; Reys et al., 2003; Weiss, Banilower, McMahon, & Smith, 2001). Consequently, it is
imperative that the textbooks intended for use in the classroom be appropriate for both students
and teachers. Thus, the importance of examining textbooks for the extent to which they develop
van Hiele levels in descriptive geometry cannot be overemphasized, especially, when higher van
Hiele levels are essential for success in high school geometry.
In this respect, it is expected that the findings from this study will inform curriculum
developers and evaluators of curriculum in their future efforts to improve classroom materials on
geometric concepts for teachers’ and students’ use. Specifically, if the results show, for example,
that the content related to descriptive geometry in K-8 mathematics textbooks depicts a
dominance of students’ engagement at lower van Hiele levels than called for by curriculum
standards, then a call could be made for changes in future editions of these mathematics
textbooks to increase students’ meaningful engagement in descriptive geometry that will meet
their grade level expectations. Similarly, if the results indicate that some textbooks offer
appropriate opportunity for students’ engagement with higher van Hiele tasks, then such
curricula could serve as a model for future editions, with an eye to improve what is already
supportive of students’ learning (Stein, Cover, & Henningsen, 1996). Thus, it is anticipated that
the results of the present study will offer relevant information for K-8 mathematics curriculum

18
developers and for writers of K-8 mathematics textbooks in their future efforts to revise and
improve curriculum materials targeting higher van Hiele levels.
Definition of Terms
The following terms are used throughout the study. Here are the definitions for how these
terms are applied.
GLE: A statement in standards’ documents that describes a particular skill the document
is aiming for in a specific grade.
Instructional Segment: A part of a chapter in a mathematics textbook at a specific grade
that aims to develop a particular skill or concept.
Schema: A network of relationships connecting geometric concepts and processes in
specific patterns.
Descriptive geometry: The geometry concerned with figures and their relationships. It
excludes topics that deal with coordinates or exact quantities. It also does not deal with
measurement.
Concept image: Description of the total cognitive structure that is associated with the
concept, which includes all the mental pictures and associated properties and processes. It is built
up over the years through experiences of all kinds, changing as the individual meets new stimuli
and matures. (Tall & Vinner, 1981).
Summary
With such a powerful theory as the van Hiele levels of geometric thinking, and such
widely spread sources of curriculum such as the CCSSM standards and popular mathematics

19
textbooks, it is natural to consider how the standards and textbooks develop students’ van Hiele
levels as they make their journey of geometry in K-8 curriculum. This chapter introduced the
well-regarded van Hiele theory of geometric understanding and learning among young students.
Based on this theory, students’ progress through levels in their mastery of geometry. The
CCSSM is a predominant standards document, (accepted by forty-two states and District of
Columbia) and some states follow other documents in their standards implementation. This
dissertation is a comparative study between CCSSM and other standards documents with regards
to their agreement with van Hiele theory. This study also focuses on K-8 mathematics textbooks
for their support in raising van Hiele levels.
In the subsequent chapters, additional background, details and results of this study are
provided. Chapter 2 reviews the relevant research on teaching and learning geometry, van Hiele
theory, curriculum documents, and mathematics textbooks. The relevant research informs and
guides the research of present study. Chapter 3 details the methods used for selecting portions of
standards’ documents and mathematics textbooks. This chapter also discusses the reliability of
chosen methods. Chapter 4 contains the data obtained and the analysis of the results of the study.
Finally, Chapter 5 summarizes the findings of the study and discusses the implications for
authors of standards’ documents, textbook publishers, and classroom teachers. This chapter
concludes with the limitations of the study and provides directions for further research on the
topics.

20
CHAPTER 2
REVIEW OF RELEVANT LITERATURE
The universe … is written in the language of mathematics, and its characters are
triangles, circles, and other geometrical figures without which it is humanly impossible to
understand a single word of it; without these, one wanders about in a dark labyrinth.
--Galileo Galilei1
Meaning is important in mathematics and geometry is an important source of that
meaning.
--David Hilbert2
S. Cohn-Vossen
In this chapter the literature relevant to research on van Hiele theory, textbook analysis,
and descriptive geometry standards in CCSSM and non-CCSSM documents is reviewed.
Research into Geometry Learning and Teaching
There seems to be a pattern in how children acquire geometric understanding. Research
into geometry learning has found that young children initially form schemas on the basis of
feature analysis of visual forms (Clements et al., 1999). Historically, U.S. students have learned
geometric concepts by rote; they frequently do not recognize components, properties, and
relationships between properties (Clements & Battista, 1992b). There are three predominant lines
of inquiry concerning children’s geometric concepts – those based on theories of Piaget, the van
1 Galileo, The Assayer, 1623. 2 David Hilbert and S. Cohn-Vossen, Geometry and the Imagination, 1934.

21
Hiele’s, and of cognitive psychologists (Clements et al., 1999). Piaget and Inhelder’s (1967)
theory describe children construct the representation of space through the progressive
organization of the motor and internalized actions. Thus, representation of space is governed by
the prior active manipulation of the environment, and so manipulatives might facilitate the
construction of sound representatives. However, many U.S. textbooks do not encourage the use
of manipulatives in geometry, and even when they do, the recommended uses are not typically
aimed at developing higher levels of thinking (Fuys et al., 1988; Stigler, Lee & Stevenson,
1990). In contrast, the Japanese model of instruction and instructional materials feature greater
use of manipulatives (Clements, 2003).
This pattern might support the use of manipulatives. However, though manipulatives,
pictures, and diagrams can support geometric reasoning, there are certain dangers of relying too
much on them. Many students cannot differentiate between essential aspects and irrelevant
features of a picture (Clements & Battista, 1992a). As a supplement to manipulatives,
instructional attention to diagrams, such as using multiple drawings for a proof problem and
discussing diagrams explicitly, may be helpful (Clements, 2003).
Some concepts in geometry are more difficult due to the incorrect initial schemas
children develop. Students develop many wrong notions about geometric concepts. One such
idea is that of angles. Many students believe that angle must have one horizontal ray; that a right
angle is an angle that points to the right; that the angle sum of a quadrilateral is the same as its
area; and that two right angles in different orientations are not equal in measure (Clements &
Battista, 1992a). Students do not find angles to be salient properties of figures (Clements et al.,
1996; Mitchelmore, 1989). Both the angle concept and angle size are misinterpreted by many
students. Further common misconceptions about angles is that the size of an angle is related to

22
the length of the line segments that form its sides, the tilt of the top line segment, or the area
enclosed by the triangular region defined by the drawn sides. By the fifth grade, children reliably
distinguish several angles, but only 9% can reliably distinguish and coordinate relationships
among the four angles 300, 600, 900, and 1200 (Clements, 2003). When people think, they do not
use definitions of concepts, but rather concept images – a combination of all the mental pictures
and properties that have been associated with concept (Vinner & Hershkowitz, 1980). Such
images can be adversely affected by inappropriate instruction. For example, instructing that a
rectangle must have two long and two short sides in its definition obstructs the development of
the understanding of the hierarchical nature of geometric figures. Students who not only know a
correct verbal description of a concept but also have strongly associated a specific visual image,
or concept image, with the concept may have difficulty applying the verbal description correctly.
The notion of proof is typically first introduced in a high school geometry course. The
three functions of proof in mathematics are:
• Verification – concerned with establishing the truth of a proposition;
• Illumination – concerned with conveying insight into why a proposition is true;
and
• Systematization – concerned with organizing propositions into a deductive
system. (Bell, 1976)
Too many U.S. students do not appreciate or experience these aspects of proof. More
than 70% of students begin high school geometry at van Hiele Levels 0 and 1, and only those
students who enter at Level 2 (or higher) have a good chance of becoming competent with proof
by the end of the course (Shaughnessy & Burger, 1985). A primary cause of students’ poor
performance in geometry is the curriculum, both in what topics are treated and how they are
treated (Jaime, Chapa, & Gutiérrez, 1992). So, it behooves to focus on both the curriculum
standards of K-8 geometry that have a significant impact on what students learn in their

23
preparation for a high school geometry course as well as elementary and middle grades
mathematics textbooks that structure learning opportunity for K-8 students. K-8 geometry should
focus on developing intuitive understandings of the natures of geometric figures before they can
be dealt with meaningfully with the formal aspects of geometry. (Schoenfeld, 1985 p.18). That
is, students should be steered towards van Hiele level 3 thinking in grades K-8 as much as
possible.
Researchers of geometry learning have some consensus: the teaching of geometry should
aim at presenting and developing the ideas of geometry in a way that is accessible to students.
According to Suydam (1985) there is a general perspective on the layout of geometry instruction.
It should be to
• develop logical thinking abilities;
• develop spatial intuitions about the real world;
• impart the knowledge needed to study more mathematics; and
• teach the reading and interpretation of mathematical arguments. (p. 481)
Before the standards era and at the onset of van Hiele research in the U.S. the
mathematics learning of elementary and middle school students had been evaluated extensively.
Researchers have shown that students were failing to learn basic geometric concepts and
geometric problem solving, and were woefully underprepared for the study of more sophisticated
geometric concepts and proof, especially when compared to students from other nations
(Carpenter, Corbitt, Kepner, Lindquist & Reys, 1980; Fey, Atchison, Good, Heid, Johnson,
Kantowski & Rosen, 1984; Kouba, Brown, Carpenter, Lindquist, Silver & Swafford, 1988;
Stevenson, Lee & Stigler, 1986; Stigler et al., 1990). For instance, fifth graders from Japan and
Taiwan scored more than twice as high as US students on a test of geometry (Stigler et al.,
1990). Japanese students in both first and fifth grades also scored much higher (and Taiwanese
students only slightly higher) than US students on tests of visualization and paper folding. Data

24
from the Second International Mathematics Study (SIMS) showed that in geometry, US 8th and
12th graders scored at the 25th international percentile or below (McKnight, Travers & Dossey,
1985). Usiskin (1987) citing data from the 1982 US National Assessment of Educational
Progress (NAEP), reported that fewer than 10% of 13-year-olds could find the measure of the
third angle for a triangle given the measure of the other two angles, and only 20% could find the
length of the hypotenuse of a right triangle given lengths of its legs. On the 1986 NAEP, Kouba
et al. (1988) reported students’ performance as acceptable in identifying common geometric
figures, such as parallel lines and the diameter of a circle, but students’ performance as deficient
with respect to figures not frequently encountered in everyday life, such as perpendicular lines
and the radius of a circle. Performance dealing with properties of figures, visualization, and
applications was poor. For example, only 60% of 7th grade students could identify the image of
an object reflected through a line; only about 10% of 7th graders could find the area of a square
given the length of one of its sides (56% found the area of a rectangle, given its dimensions); and
less than 10% of 7th graders could identify which set of numbers could be the lengths of the sides
of a triangle (even though 66% could do it if segments were given). Apparently, students could
handle some problems much better if the problem is presented visually rather than verbally
(Carpenter et al., 1980; Driscoll 1983; Kouba et al., 1988). This makes the case even stronger for
teaching geometry in general, and raising van Hiele levels in particular.
The situation was even worse at the high school level. Only 63% of the students enrolled
in a geometry course were able to correctly identify triangles that were presented along with
distractors (Usiskin, 1987). According to the 1978 NAEP in mathematics, only 64% of the 17-
year-olds knew that a rectangle is a parallelogram, only 16% could find the area of a region made
up of two rectangles, and just 9% could solve “How many cubic feet of concrete would be

25
needed to pave an area 30 feet long and 20 feet wide with a layer 4 inches thick?” Of 17-year
olds that had a full year of high school geometry, only 57% could calculate the volume of a
rectangular solid, 54% could find the hypotenuse of right triangle whose legs were multiples of 3
and 4, and 34% could find the area of a right triangle. Only 52% of entering secondary students
could state the area of a square when its sides were given (Usiskin, 1982). On the 1986
assessment, 11th grade students who had not taken high school geometry scored at about the
same level as 7th graders (Lindquist, 1989). Students who had taken geometry did little better in
visualization than students who had not, although there were large differences on items requiring
knowledge of geometric properties and on applications. Less than 25% of 11th grade students
correctly identified which figures had lines of symmetry, whether they had taken geometry or not
(even though symmetry is studied throughout elementary and middle school). Greater irony of
the curriculum was that only about 30% of high school geometry students enrolled in a course
for which proof was a goal were able to write proofs or exhibit any understanding of the meaning
of proof (Senk, 1985; Suydam, 1985). It was no wonder that doing proofs was the least liked
mathematics topic by 17-year-olds on the 1982 NAEP and that less than 50% of the students
rated the topic as important.
This picture of students’ knowledge of geometry is elaborated through a consideration of
students’ misconceptions. Here are some examples (Clements, 1989; Fuys, 1988; Hoffer, 1983):
• an angle must have one horizontal ray
• a right angle is an angle that points to the right
• to be a side of a figure a segment must be vertical
• a segment is not a diagonal if it is vertical or horizontal
• a square is not a square if its base is not horizontal
• the only way a figure can be a triangle is if it is equilateral
• the height of a triangle or parallelogram is a side adjacent to the base
• the angle sum of a quadrilateral is the same as its area
• the Pythagorean theorem can be used to calculate the area of a rectangle
• if a shape has four sides, then it is a square

26
• the area of a quadrilateral can be obtained by transforming it into a rectangle with
the same perimeter
These findings point to the idea that much learning of geometric concepts has been by
rote. Properties, class inclusions, relationships, and implications are frequently not perceived
(Mayberry, 1983). A primary cause of this poor performance may be the curriculum, both in
what topics are treated and how they are treated. The topics consist of a hodgepodge of unrelated
concepts with no systematic progression to higher levels of thought, levels requisite for
sophisticated concept development and substantive geometric problem solving. The standard
elementary and middle school curricula do not offer many connections to build a solid
framework to go further in the subject. The major focus is on recognizing and naming geometric
shapes, writing the proper symbolism for simple geometric concepts, and developing skills with
measurement tools like compass and ruler. In addition, teachers often do not even teach the
impoverished geometry curriculum that is available to them. Porter (1989), for instance, reported
whole districts in which fourth- and fifth- grade teachers spent “virtually no time teaching
geometry” (p.11). Even when taught, geometry was the topic most frequently identified as being
taught for merely “exposure”; that is, given only brief, cursory coverage. The SIMS data for the
8th grade level indicate that teachers rated the “opportunity to learn” geometry much lower than
any other topic (McKnight, 1985). At the secondary level, the traditional emphasis has been on
formal proof, despite the fact that students are unprepared to deal with it (Clements et al.,
1992b).
Usiskin (1987) summarizes:
There is no geometry curriculum at the elementary school level. As a result, students
enter high school not knowing enough geometry to succeed. There is a geometry
curriculum at the secondary level, but only about half of the students encounter it, and
only about a third of these students understand it. (p. 29)

27
In more recent times, the International Association for the Evaluation of Educational
Achievement (IEA) released the results of the Third International Mathematics Study in 2000.
The examination of the U.S. curriculum in this study was less than positive (Mullis, et al., 1998).
Later, the U.S. curriculum was described as being “mile wide and an inch deep” (Schmidt,
2000). Thus, most of the first decade of the 2000s was committed to improving curricula and
developing grade-level suggestions for content for portions of the curriculum. This period of
reform ended in 2009.
There are two major international comparative studies of mathematics and science:
Trends in Mathematics and Science Study (TIMSS) launched by the International Association
for the Evaluation of Educational Assessment (IEA), and Programme in International Student
Assessment (PISA) launched by the Organization for Economic Cooperation and Development
(OECD). Along with the domestic National Assessment of Educational Progress (NAEP)
administered by the U.S. National Center for Educational Statistics (NCES), these three
programs supply huge data on the mathematics achievements of selected grades of K-12
students.
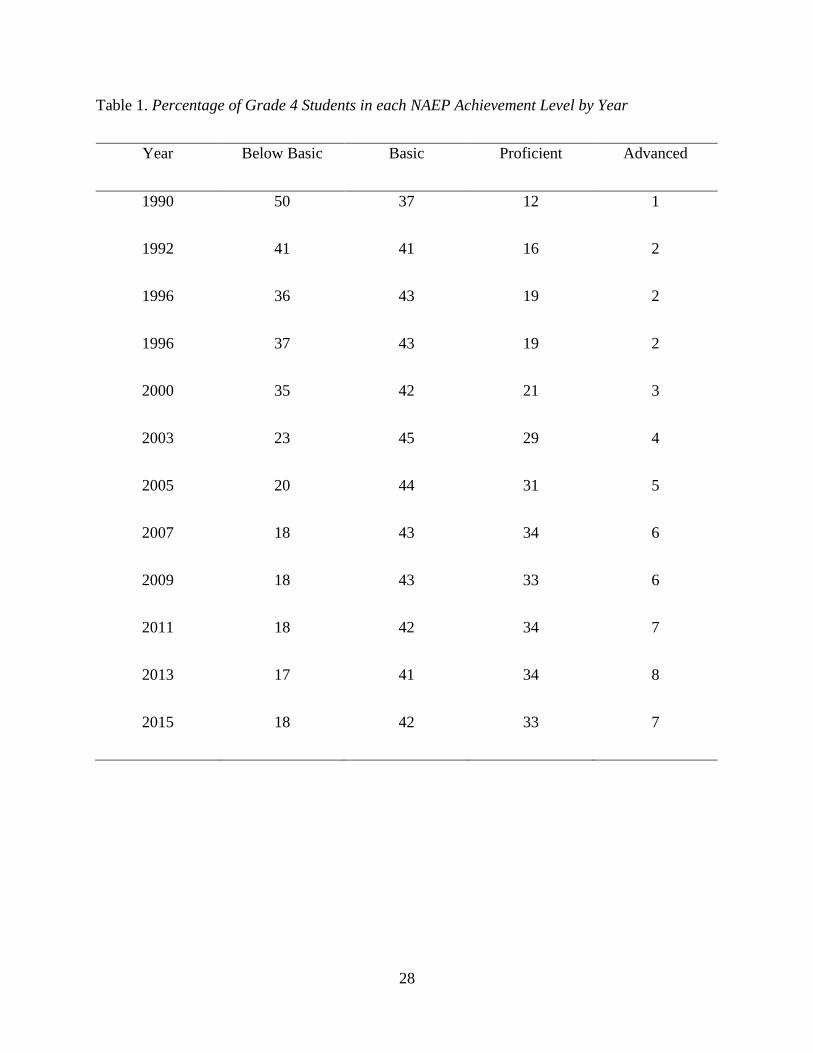
Results for NAEP grade 4 have been improving since 1990. NAEP achievement level is
classified as one of “below Basic”, “Basic”, “Proficient”, “Advanced”. Table 1 lists the
percentages of students in each category between 1990 and 2015. It must be noted that 50% of
grade 4 students’ achievements in 1990 were below Basic and that percentage dropped to 18% in
2015, and 7% were Advanced in 2015 compared to a mere 1% in 1990. Similarly, the
achievements of grade 8 students have improved between 1990 and 2015 as suggested by Table
2.
28
Table 1. Percentage of Grade 4 Students in each NAEP Achievement Level by Year
Year Below Basic Basic Proficient Advanced
1990 50 37 12 1
1992 41 41 16 2
1996 36 43 19 2
1996 37 43 19 2
2000 35 42 21 3
2003 23 45 29 4
2005 20 44 31 5
2007 18 43 34 6
2009 18 43 33 6
2011 18 42 34 7
2013 17 41 34 8
2015 18 42 33 7

29
Table 2. Percentage of Grade 8 Students in each NAEP Achievement Level by Year
Year Below Basic Basic Proficient Advanced
1990 48 37 13 2
1992 42 37 18 3
1996 38 39 20 4
1996 39 38 20 4
2000 37 38 21 5
2003 32 39 23 5
2005 31 39 24 6
2007 29 39 25 7
2009 27 39 26 8
2011 27 39 26 8
2013 26 38 27 9
2015 29 38 25 8
Before the standards era it was already mentioned that US students’ performances in
international assessments were not commendable. However, in TIMSS 2011, US fourth graders
scored higher in mathematics, on average, than their counterparts in 37 countries and lower than
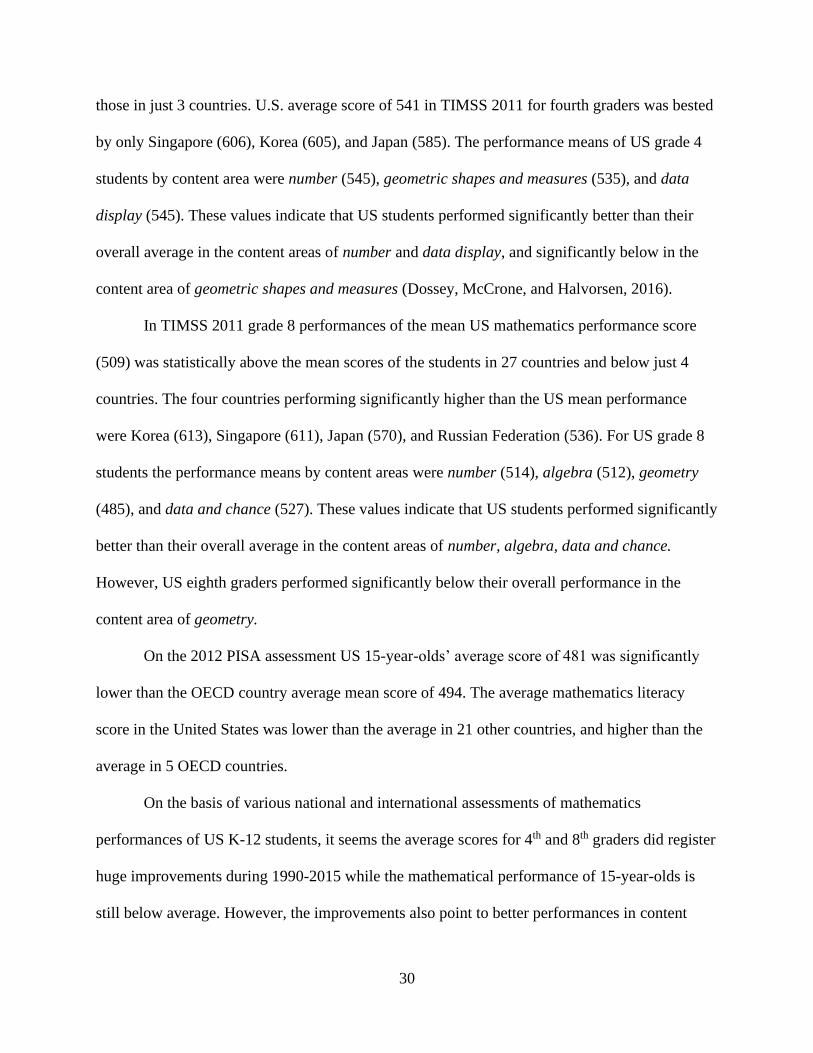
30
those in just 3 countries. U.S. average score of 541 in TIMSS 2011 for fourth graders was bested
by only Singapore (606), Korea (605), and Japan (585). The performance means of US grade 4
students by content area were number (545), geometric shapes and measures (535), and data
display (545). These values indicate that US students performed significantly better than their
overall average in the content areas of number and data display, and significantly below in the
content area of geometric shapes and measures (Dossey, McCrone, and Halvorsen, 2016).
In TIMSS 2011 grade 8 performances of the mean US mathematics performance score
(509) was statistically above the mean scores of the students in 27 countries and below just 4
countries. The four countries performing significantly higher than the US mean performance
were Korea (613), Singapore (611), Japan (570), and Russian Federation (536). For US grade 8
students the performance means by content areas were number (514), algebra (512), geometry
(485), and data and chance (527). These values indicate that US students performed significantly
better than their overall average in the content areas of number, algebra, data and chance.
However, US eighth graders performed significantly below their overall performance in the
content area of geometry.
On the 2012 PISA assessment US 15-year-olds’ average score of 481 was significantly
lower than the OECD country average mean score of 494. The average mathematics literacy
score in the United States was lower than the average in 21 other countries, and higher than the
average in 5 OECD countries.
On the basis of various national and international assessments of mathematics
performances of US K-12 students, it seems the average scores for 4th and 8th graders did register
huge improvements during 1990-2015 while the mathematical performance of 15-year-olds is
still below average. However, the improvements also point to better performances in content

31
areas of mathematics other than in geometry. This might indicate a need for raising van Hiele
levels through proper instruction of geometry in K-8 grades.
The van Hiele Levels of Geometric Thought
According to the theory of Pierre and Dina van Hiele, students progress through levels of
thought in geometry (van Hiele, 1959; van Hiele, 1986; van Hiele-Geldof, 1984). Thinking
develops from a Gestalt-like visual level through increasingly sophisticated levels of description,
analysis, abstraction, and proof. The theory has the following defining characteristics:
• Learning is a discontinuous process. That is, there are “jumps” in the learning curve
which reveal the presence of discrete, qualitatively different levels of thinking.
• The levels are sequential and hierarchical. For students to function adequately at
one of the advanced levels in the van Hiele hierarchy, they must have mastered
large portions of the lower levels (Hoffer, 1981). Progress from one level to
the next is more dependent upon instruction than on age or biological
maturation. Teachers can “reduce” subject matter to a lower level, leading to rote
memorization, but students cannot bypass levels and achieve understanding
(memorization is not an important feature of any level). The latter requires working
through certain “phases” of instruction.
• Concepts implicitly understood at one level become explicitly understood at the
next level. “At each level there appears in an extrinsic way that which was intrinsic
at the preceding level. At the base level, figures were in fact also determined by their
properties, but someone thinking at this level is not aware of these properties”
(van Hiele, 1984, p. 246)
• Each level has its own language.
“Each level has its own linguistic symbols and its own system of relations connecting
these symbols. A relation which is ‘correct’ at one level can reveal itself to be incorrect
at another. Think, for example, of a relation between a square and a rectangle. Two
people who reason at different levels cannot understand each other. Neither can manage
to follow the thought processes of the other.” (van Hiele, 1984, p. 246).
Language structure is a critical factor in the movement through the levels.
As described by Clements & Battista (1992b) the five van Hiele levels have the following
characteristics.

32
Level 1
The motivating factor for students at this level is the appearance of shapes. They use the looks to
identify and operate on shapes and other geometric configurations. They recognize familiar
figures such as squares and triangles as visual gestalts, and thus they are able to mentally
represent these figures as visual images. They often use visual prototypes in identifying
geometric shapes, saying that a given figure is a rectangle, for instance, because "it looks like
a door." However, they do not attend to the properties or characteristics of shapes while they
attempt to identify them. That is, although figures are determined by their properties, students
at this level are not conscious of them. At this level, students' reasoning is dominated by
perception. For example, they might distinguish one figure from another without being able
to name a single property of either figure, or they might judge that two figures are congruent
because they look the same: "There is no why, one just sees it" (van Hiele, 1986, p. 83).
During the transition from the visual to the descriptive level, classes of visual objects begin to
be associated with their characteristic properties.
At this level, the objects about which students reason are classes of figures recognized
visually as “the same shape.” For example, when a student says "This figure is a rhombus," the
student means "This figure has the shape I have learned to call 'rhombus'" (van Hiele, 1986, p.
109). Consequently, this reasoning entails the creation of conceptualizations of figures that are
based on the explicit recognition of their properties.
Level 2
Students recognize and can characterize shapes by their properties. They often try to
spell out the shape’s name along with all of its properties. For instance, a student might think of a
rhombus as a figure that has four equal sides: so, the term "rhombus" refers to a collection of

33
“properties that he has learned to call 'rhombus'" (van Hiele, 1986, p. 109). Students see figures
as wholes, but now as collections of properties rather than as visual gestalts; the image begins to
fall into the background. Properties are established experimentally by observing, measuring,
drawing, and model-making and students try to reason with all the properties without eliminating
redundancies. Students discover that some combinations of properties signal a class of figures
and some do not; thus, they grow towards learning in geometric implication. Students at this
level do not, however, see relationships between classes of figures (e.g., a student might contend
that a figure is not a rectangle because it is a square). At this level, the objects about which
students reason are classes of figures, thought about in terms of the sets of properties that the
students associate with those figures. The product of this reasoning is the establishment of
relationships between, and the ordering of, properties and classes of figures.
Level 3
Students can form abstract definitions, distinguish between necessary and sufficient sets of
conditions for a concept, and understand and sometimes even provide logical arguments in the
geometric domain. Students can informally deduce unknown geometric properties from other
known properties. They can classify figures hierarchically (by ordering their properties) and give
informal arguments to justify their classifications (e.g., a square is identified as a rhombus
because it can be thought of as a "rhombus with some extra properties"). They can discover
properties of classes of figures by informal deduction. For example, they might infer that in any
polygon the sum of the angles can be obtained by decomposing it into disjoint triangles.
As students discover properties of various shapes, they feel a need to organize the
properties. One property can signal other properties, so definitions can be seen not merely as
descriptions but as a way of logically organizing properties. So students can understand why a

34
rectangle or a rhombus is a parallelogram or why a square is a rectangle. This logical
organization of ideas leads to true deduction. The students still, however, do not grasp that
logical deduction is the method for establishing geometric truths.
At this level, the objects about which students reason are properties of classes of figures.
Thus, for instance, the "properties are ordered, and the person will know that the figure is a
rhombus if it satisfies the definition of quadrangle with four equal sides" (van Hiele, 1986, p.
109). This reasoning develops into the reorganization of ideas achieved by interrelating
properties of figures and classes of figures.
Level 4
Students reason logically as they establish theorems within an axiomatic system. They
recognize the difference among undefined terms, definitions, axioms, and theorems. They are
capable of constructing original proofs. That is, they can produce a sequence of statements that
logically justifies a conclusion as a consequence of the "givens."
At this level, students can reason formally by logically interpreting geometric statements
such as axioms, definitions, and theorems. The objects of their reasoning are relationships
between properties of classes of figures. The product of their reasoning is the establishment of
second–order relationships (i.e., relationships between relationships) expressed in terms of
logical chains within a geometric system.
Level 5
Students reason formally about mathematical systems. They can study geometry in the
absence of reference models. They can reason by formally manipulating geometric statements
such as axioms, definitions, and theorems. The objects of this reasoning are relationships
between formal constructs. The product of their reasoning is the establishment, elaboration, and
comparison of axiomatic systems of geometry.

35
Clements & Battista (1992b) shed light on the significance of van Hiele levels in a
multistep process. They use a series of questions investigating the utility of van Hiele levels in
describing students’ geometric thinking, the discrete/continuous nature of these levels, the
variability of a student’s level across topics, the hierarchical nature of levels, and finally they
extrapolate the levels and argue for a level more basic than level 1. They comment on the
traditional textbooks of the time with regards to their levels of thought: most textbooks those
days required students to work almost exclusively at level 1.
How Useful are van Hiele Levels in Describing Students’ Geometric Thinking?
Based on empirical research in the U.S. and overseas they confirmed that van Hiele levels
are useful in describing students’ geometric concept development from elementary school to
college. Usiskin (1982) found that about 75% of secondary students fit the van Hiele model. This
means 75% of the students’ scores were consistent with van Hiele theory. A student would not fit
van Hiele model if (s)he performs poorly on a lower van Hiele level task and better on a higher-
level task (it should be noted that the percentage classifiable at a level varies with the instrument
and scoring scheme). Burger and Shaughnessy (1986) administered clinical interviews to
students from kindergarten to college. They reported that students’ behaviors were generally
consistent with the van Hieles’ original general description of the levels. One task will be
described as an example. Students were to identify and describe all the squares, rectangles,
parallelograms, and rhombuses in a set of quadrilaterals similar to those in Fig 6. Students who
included imprecise visual qualities and irrelevant attributes (e.g., orientation) in describing the
shapes while omitting relevant attributes were assigned to level 1. References to visual
prototypes (“a rectangle looks like a door”) were frequent among students assigned to this level.
Students who contrasted shapes and identified them by means of their properties were assigned
level 2. One girl, for example, said that rectangles have “two sides equal and parallel to each

36
other. Two longer sides are equal and parallel to each other, and they connect at 90 degrees”.
Squares were not included. Students who gave minimal characterization of shapes by using
other types were assigned level 3 (e.g., a square is a parallelogram that has all the properties of a
rhombus and a rectangle). One student frequently made conjectures and attempted to verify
these conjectures by means of formal proof, indicating level 4 thinking.
Figure 6. Quadrilaterals to be identified (Burger & Shaughnessy, 1986)
The existence of unique linguistic structures at each level has been supported in that, for
example, “rectangle” means different things to students at different levels (e.g., a visual gestalt
vs. a “bearer of properties”) (Burger, 1986; Fuys, 1988; Mayberry, 1983). In sum, the levels
appear to exist and describe students’ geometric development. They have been validated through
both interviews and written assessments.
7
1
2
3
4 5
6
8
9
10
11
12
13
14
15

37
Discrete/Continuous Nature of van Hiele Levels
Some researchers have questioned the discrete nature of van Hiele levels. They reported
that it is difficult to reliably classify students who are moving to the next level (Fuys, 1988;
Usiskin, 1982, especially for levels 2 and 3 (Burger, 1986). The research of Fuys et al. (1988)
sixth and ninth graders where the students were involved in a 6-8 45- minute instructional-
assessment interviews. These interviews allowed the researchers to chart students’ ability to
make progress within and between levels as a result of instruction. It thus indicated an entry
level and a potential level that could be attained after instruction. There was a mixture of
outcomes after the interviews: some students did not see any growth but some moved flexibly to
different levels during the teaching episodes. These experiments confirm van Hieles’ beliefs that
proper instruction can help raise the levels of students. Similar results were observed in a
teaching experiment on polyhedra (Lunkenbein, 1980). It seems there are strong evidences
demonstrating the continuous nature of van Hiele levels putting in doubt the discrete nature of
levels.
Does the van Hiele Level of a Student Vary Across Topics?
Certain topics might be easier to arrive at higher van Hiele levels than others. There is
some empirical support for the dynamic rather than static characterization of levels reinforcing
the earlier claim about continuous rather than discrete nature of these levels. Gutiérrez and Jamie
(1988) compared the level of reasoning of preservice teachers on three geometric topics: plane
geometry, spatial geometry (polyhedra), and measurement. The levels reached by an individual
across topics were different for different topics. A similar study by Burger and Shaughnessy
(1986) reported that students exhibited different preferred levels on different tasks, with some
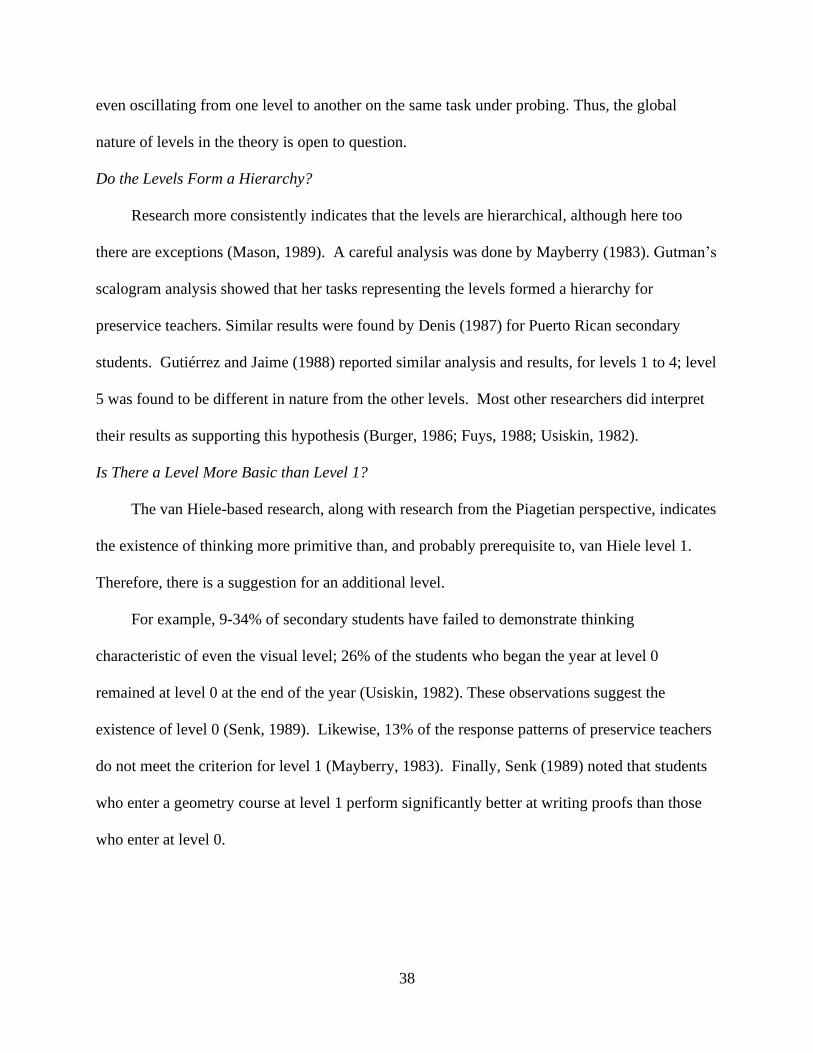
38
even oscillating from one level to another on the same task under probing. Thus, the global
nature of levels in the theory is open to question.
Do the Levels Form a Hierarchy?
Research more consistently indicates that the levels are hierarchical, although here too
there are exceptions (Mason, 1989). A careful analysis was done by Mayberry (1983). Gutman’s
scalogram analysis showed that her tasks representing the levels formed a hierarchy for
preservice teachers. Similar results were found by Denis (1987) for Puerto Rican secondary
students. Gutiérrez and Jaime (1988) reported similar analysis and results, for levels 1 to 4; level
5 was found to be different in nature from the other levels. Most other researchers did interpret
their results as supporting this hypothesis (Burger, 1986; Fuys, 1988; Usiskin, 1982).
Is There a Level More Basic than Level 1?
The van Hiele-based research, along with research from the Piagetian perspective, indicates
the existence of thinking more primitive than, and probably prerequisite to, van Hiele level 1.
Therefore, there is a suggestion for an additional level.
For example, 9-34% of secondary students have failed to demonstrate thinking
characteristic of even the visual level; 26% of the students who began the year at level 0
remained at level 0 at the end of the year (Usiskin, 1982). These observations suggest the
existence of level 0 (Senk, 1989). Likewise, 13% of the response patterns of preservice teachers
do not meet the criterion for level 1 (Mayberry, 1983). Finally, Senk (1989) noted that students
who enter a geometry course at level 1 perform significantly better at writing proofs than those
who enter at level 0.

39
Level 0 Pre–recognition
A child at this level is unable to identify many common shapes. Children at this level may
attend to forms of shapes but might not understand the significance of their characteristics. For
example, they might think that an oval is a circle. They perceive geometric shapes, but perhaps
because of a deficiency in perceptual activity, may attend to only a subset of a shape's visual
characteristics. They may distinguish between figures that are curvilinear and those that are
rectilinear but not among figures in the same class. That is, they may differentiate between a
square and a circle, but not between a square and a triangle.
At this level, the "objects" about which students reason are specific visual or tactile stimuli
(i.e., figures or objects); the product of this reasoning is a group of figures recognized visually as
"the same shape."
Reflection on Traditional Textbooks
Fuys et al. (1988) analyzed several geometry curricula as evidenced by American text
series (grades K-8) of the time in light of the van Hiele model. They found most work involved
naming shapes and relations like parallelism. Students were rarely asked to reason with the
figures.
Most questions were answerable at level 1. There was little level 2 or above thinking
required in the lessons or tests, starting only slightly in grades 7-8. Average students would not
need to think above level 1 for almost all of their geometry experiences through grade 8. Topics
were repeated across grades at the same level; the researchers termed this a “circular” rather than
a “spiral” curriculum. Properties and relationships among polygons were sometimes not taught
clearly and sometimes taught incorrectly.

40
Wirszup (1976) similarly found absence of any systematic choice of geometric material in
the analysis of older Russian textbooks. Only about 1% of all problems dealt with geometry.
This left grade 6 students, from the very first lessons, doing work corresponding to the first three
levels of geometric development simultaneously.
Phases of Instruction
Dina van-Hiele Geldof worked on the didactics of increasing the levels of geometric
understanding in several phases that will be described below. The van Hiele model is not just
descriptive but it is also prescriptive in the sense it reinforces the significance of teaching for
understanding of geometric thinking. According to the van Hieles, progress from one level to
the next depends little on biological maturation or development; instead, it proceeds under the
influence of a teaching/learning process. The teacher plays a special role in facilitating this
progress, especially in providing guidance about expectations (Fuys, 1988). Given that van
Hiele level and achievement account for 40% to 60% of the variance in proof writing, much of a
student’s achievement in this area is within the direct control of the teacher and the curriculum
(Senk, 1989).
The van Hiele theory does not support an “absorption theory” model of learning and
teaching, however. The van Hieles claim that higher levels are achieved not via direct teacher
telling, but through a suitable choice of exercises. In addition, “children themselves will
determine when the moment to go to the higher level has come” (Clements and Battista, 1992b).
Nevertheless, the teacher is an essential part of the child’s progress. For each phase, the goal for
students’ learning is described, followed by a description of the teacher’s role in providing

41
instruction that enables this learning. The next section discusses Dina van Hiele-Geldof’s phases
of instruction to raise van Hiele levels as seen in Clements and Battista (1992b).
Phase 1: Information
The students begin to learn the content domain. The teacher facilitates and discusses
materials clarifying this content. This provides an opportunity for the teacher to learn how
students interpret the language and then (s)he provides information to bring students to
purposeful action and perception.
Phase 2: Guided Orientation
In this phase, students become aware of and get acquainted with the objects from
which geometric ideas are abstracted. The goal of instruction during this phase is for
students to be actively engaged in exploring objects (e.g., folding, measuring) so as to
encounter the principal connections of the network of relations that is to be formed. The
teacher’s role is to direct students' activity by guiding them in appropriate explorations—
carefully structured and sequenced tasks (often one-step that elicit specific responses) in
which students manipulate objects so as to encounter specific concepts and procedures of
geometry. Teachers should choose materials and tasks in which the targeted concepts and
procedures are salient.
Phase 3: Explicitation
Students become conscious of the relations; they begin to elaborate their intuitive
knowledge. Thus, in this phase, children become explicitly aware of their geometric
conceptualizations, describe these conceptualizations in their own language, and learn some
of the traditional mathematical language for the subject matter. The teacher's role is to
bring the objects of study (geometric objects and ideas, relationships, patterns, etc.) to an
explicit level of awareness by leading students’ discussion of them in their own language.
Once students have demonstrated their awareness of an object of study and have discussed
it in their own words, the teacher introduces the relevant mathematical terminology.
Phase 4: Free Orientation
Children solve problems whose solution requires the synthesis and utilization of
those concepts and relations previously elaborated. They learn to orient themselves within
the “network of relations” and to apply the relationships to the solving of problems. The
teacher's role is to select appropriate materials and geometric problems (with multiple
solution paths), to give instructions to permit various performances and to encourage
students to reflect and elaborate on these problems and their solutions, and to introduce
terms, concepts, and relevant problem–solving processes as needed.
Phase 5: Integration
Students build a summary of all they have learned about the objects of study,
integrating their knowledge into a coherent network that can be easily described and
applied. The language and conceptualizations of mathematics are used to describe this
network. The teacher's role is to encourage students to reflect on and consolidate their
geometric knowledge, with an increasing emphasis on the use of mathematical structures as
a framework for consolidation. Finally, the consolidated ideas are summarized by
42
embedding them in the structural organization of formal mathematics. At the completion
of phase 5, a new level of thought is attained for the topic studied.
Research on Standards in CCSSM and non-CCSSM Documents
In the last three decades state level curriculum documents have received a lot of attention
by school administrators and teachers given that these standards outlined the content that
students should know and be able to do at each grade level and that the textbooks purchased to
support curriculum implementation were aligned with the curriculum standards. In a survey of
state-level curriculum leaders, most teachers and school administrators pay close attention to the
curriculum standards. In fact, over two thirds of the respondents perceived that the standards are
significantly influencing classroom instruction, textbook selection, and professional development
for teachers (Reys, Dingman, Sutter, & Teuscher, 2005).
As standards became more prevalent after the 2001 No Child Left Behind Act, states spent
considerable effort in writing and revising mathematics standards. The National Science
Foundation funded Center for the Study of Mathematics Curriculum (CSMC) described the level
of consistency in learning goals across state standards documents (Reys, 2006; Smith, 2011).
These reports found a general lack of consensus across states. It was confirmed that the
mathematical learning expectations vary along several dimensions: grain size (e.g., level of
specificity), language used to communicate learning goals (e.g., understand, explore, memorize,
etc.,), and the grade placement of specific learning expectations. The most dramatic of these
dimensions was in the trajectory of development of mathematical topics across grades and the
grade at which students are expected to be fluent.
The movement to standardize curriculum goals culminated in the 2010 release of the
Common Core State Standards for Mathematics (CCSSM). At its height, these standards were

43
adopted by 45 states, though three states – Indiana, Oklahoma, and South Carolina – eventually
moved to de-adopt CCSSM in favor of state-written standards. Researchers have concluded that
CCSSM and pre-CCSSM state standards differ in a variety of ways: in the nature of content
emphasized, grade placement of content, and expected level of cognitive demand. CCSSM raised
the bar in terms of what students were expected to learn and these standards compare well
enough with the curriculum of high-performing countries (Tran, Reys, Teuscher, Dingman &
Kasmer, 2016). The changes that are noticeable in CCSSM in comparison to pre-CCSSM
standards suggest four primary shifts: (i) change in grade level(s) at which some mathematical
content is taught, (ii) changes in the number of grade levels in which particular mathematical
topics appear, (iii) changes in emphasis (increased/decreased) on particular mathematical topics,
and (iv) changes in the nature and level of reasoning expectations (Dingman, Teuscher, Newton
& Kasmer, 2013). Their research analyzed descriptive geometry standards of 42 states using the
van Hiele levels of geometric thinking. They found there were 1667 state standards and 20
CCSSM descriptive geometry standards. The distribution of Level 1, Level 2, and Level 3
standards in pre-CCSSM state standards document was 47%, 49%, and 4% respectively while
that for CCSSM document was 20%, 50%, and 30% respectively (Dingman, et al., 2013). This
provides strong evidence of CCSSM aiming for higher van Hiele levels which are needed for
success in high school geometry as suggested by the research on van Hiele theory.

44
Research on Textbook Use in Mathematics Classrooms
The existing literature informs us that students and teachers make extensive use of the
textbooks at their disposal, and that the instructional approaches suggested by the textbooks often
influence teachers’ pedagogical strategies (Grouws & Smith, 2000; NRC, 2004; Reys et al.,
2003; Weiss, Banilower, McMahon, & Smith, 2001). Hence textbooks that are intended for
classroom use must be appropriate for both teachers and students. Thus, the significance of
textbook investigation for the purposes of raising children’s van Hiele levels cannot be
overemphasized. Textbooks are necessary and effective elements for teaching and learning in
every classroom in the world. Down (1988) stated that textbooks for better or worse dominate
what students learn. They set the curriculum, and often the facts learned in most subjects. For
many students, textbooks are their first and sometimes the only early exposure to books and
reading. The public regards textbooks as authoritative, accurate, and necessary; and teachers rely
on them to organize lessons and structure subject matter. Grouws and Smith (2000) reported that
most middle-grades mathematics teachers use most of the textbook most of the time. These
researchers observed that the mathematics teachers of 75% of the eighth-grade students involved
in the 1996 National Assessment of Educational Progress (NAEP) reported using their textbooks
on a daily basis. Research on students’ use of mathematics textbooks in the 2000 NAEP
indicated that more than 60% of middle-grade mathematics teachers “cover” at least three-
fourths of their textbook each year. Specifically, Braswell, Lutkas, Grigg, Santapau, Tay-Lim, &
Johnson (2001) documented that 72% of participating eighth-grade students in the 2000 NAEP
reported doing mathematics problems from a textbook every day. Robitaille and Travers (1992)
found that textbooks are present not only in classrooms, but also frequently used by teachers and
45
students, and influence the instructional decisions teachers make on a daily basis (Tyson-
Bernstein & Woodward, 1991; Robitaille & Travers, 1992).
Horizon Research, Inc., conducted studies researching the extent to which mathematics
teachers use their textbook (Weiss, Banilower, McMahon, & Smith, 2001; Weiss, Pasley, Smith,
Banilower, & Heck, 2003). These studies agreed with Grouws and Smith (2000). Weiss et al.
(2001) conducted a national survey of science and mathematics teachers on textbook and
curricular programs, eliciting responses to questions like which textbook or program they used,
how much of the textbook they covered, and their perceptions of their textbook quality. The
results from the survey were compelling, as 92% of teachers in grades 5-8 and 87% of teachers
in grades K-4 reported using a commercially published textbook or curricular program in their
classrooms. Furthermore, about 80% of the teachers in both grades K-4 and 5-8 reported that the
quality of their textbook or curricular program is excellent, very good, or good. These findings
indicate that elementary and middle grades teachers rely a great deal on their mathematics
textbook in planning and implementing mathematics instruction in their classroom. All these
reports seem to support the notion that textbooks had a marked influence on what was taught and
learned in many mathematics classrooms in the pre-standards era.
In recent years three modes of operation compete for the role of major source for
instructional guidance in the classroom. First, a single textbook for each grade level as the base
resource. This was true, as was noted above, before the standards era when technology was not
an integral part of classroom discussions. Second, two textbooks for a grade or a textbook plus
replacement chapters from another source for a couple of major curriculum topics. An alternative
source could be a school-system sponsored, teacher-written materials produced by the staff of a
school system itself. Third, is a full-blown digital curriculum, where students learn at a computer

46
terminal in the presence or absence of instructors. Publishers have also developed digital guided
software to go with the textbooks to supplement the print material (Dossey, McCrone, and
Halvorsen, 2016). The first mode of solely depending on a single textbook for classroom needs is
experiencing a downward trend with the availability of several options. During recent times there
is some evidence that teachers are moving away from using textbooks in preference for online
and open resource materials (Webel, Krupa, and McManus., 2015). Nevertheless, it would be a
worthwhile endeavor to investigate textbooks many mathematics teachers and students use to
determine the prospects of such resources in impacting students’ opportunity to learn and acquire
facility with geometrical ideas.
Textbook Analyses
Dingman (2007) studied the alignment between state mathematics grade-level learning
expectations and popular elementary and middle school mathematics textbooks with respect to
the topic of fraction concepts and computation in pre-CCSSM era. He chose a sample of five
textbook adoption states – states where the department of education determines which textbooks
are eligible to be purchased by school districts with state funds – and five non-adoption states for
his standards study, and two series of textbooks each for elementary (K-6) and middle (6-8)
grades for his textbook study. Each documented instructional segment was documented as one of
Lesson, Pre-lesson, End-of-lesson extra feature, End-of-chapter feature, and Game. Dingman
found out that GLEs from highly populated states particularly textbook adoption states have a
large influence on the content and grade placement of mathematics textbooks more so in
publisher-developed textbooks than for the NSF-supported curricula. He cautioned that the
higher degree of alignment can be partially attributed to the greater amount of repetition of topics
across grade levels.
47
Prior to CCSSM, Jones (2004) studied probability in middle grade textbooks over nearly
half a century. He selected one popular and one alternative textbook series from each of the four
“mathematical eras”: New Math (1957-1972), Back to Basics (1973-1983), Problem solving
(1984-1993), and the Standards era (1994 and beyond). For each textbook, the number of pages
and lessons that contained tasks related to probability were counted if it covered at least one
fourth of a page. At the end of his study, Jones concluded that the Standards era saw the most
attention paid to probability in terms of number of pages, lessons, and tasks devoted to the topic
of probability. He also noted that a wide range of probability topics and learning expectations
were focused on in the Standards era than at other times.
Research on van Hiele Levels in Curriculum Standards
Newton (2011) studied the consistency of K-8 geometry state standards with the van
Hiele levels of geometric thinking. Prior to CCSSM, Newton found 5,710 GLEs in the K-8
Geometry and Measurement strands of 42 states’ curriculum documents, of which 1,667 GLEs
(approximately 29%) were labeled as descriptive geometry. She concluded states lacked in
consensus on the total number of descriptive geometry GLEs. For the most part, there was a peak
in the proportion of descriptive geometry GLEs around grades 3-5 with lower van Hiele levels
(1-2) dominating the elementary grades while higher van Hiele levels were mostly found in
upper middle grades. She also found that different van Hiele levels appeared in the same grade
and various flavors of level 3 were found in the standards documents. She also studied when
Level 2 and Level 3 GLEs were first introduced. Level 2 GLEs were introduced as early as
Kindergarten in 19 of the 42 states and in 1st grade in 10 states’ documents. Level 3 GLEs were
introduced in diverse years with one state introducing in 3rd grade and 4 states waited till grade 8.

48
She found that Level 3 GLEs were absent in 40% of the states’ documents and nearly absent in
the other 60% of the documents. Newton also studied 18 states documents that had high school
geometry standards and found that 14 of them explicitly require formal deduction (level 4) in
their expectations.
Summary
This chapter reviewed the literature on research on geometry learning, van Hiele theory,
standards’ documents, and mathematics textbooks. The relevant literature provides support and
direction for the current study on van Hiele theory in standards’ documents and mathematics
textbooks. The existing literature supports van Hiele theory and recommends ample opportunity
for higher levels in elementary and middle grades for success in the formal high school geometry
course. In the next chapter the methods used to identify sections of standards’ documents and
mathematics textbooks will be discussed. Aspects of reliability in the coding process on both
standards’ documents and mathematics textbooks will be explained.

49
CHAPTER 3
METHODS
In this chapter, the methods and design of the study will be presented. More specifically,
the choice of standards documents and K-8 mathematics textbooks will be discussed. Examples
of grade level expectations (GLEs) and the instructional segments that were considered and the
criteria used to select these will be explained. The fundamental guides for this study are the
following research questions:
• How are the descriptive geometry GLEs distributed in K-8 standards documents?
• Do more than one van Hiele Level occur in the same grade in standards documents?
• How are the descriptive geometry instructional segments distributed in K-5 mathematics
textbooks?
• How are the descriptive geometry instructional segments distributed in 6-8 mathematics
textbooks?
• Do more than one van Hiele level occur in the same textbook for the same grade?
In this chapter, the procedures utilized to select a sample of learning expectations as well
as a sample of elementary and middle school mathematics textbooks’ instructional segments are
outlined, the procedures used to describe and document the agreement between these two forms
of curricular components are explained, and the methods used to test the reliability of the
procedures used in this study are discussed.
Selection of GLEs from CCSSM and Multiple State Standards Documents
The questions for this study are related to differences in the curriculum standards for K-8
geometry that are suitable for van Hiele Analysis. With this goal in mind standards documents

50
such as CCSSM as well as standards from the eight states that either did not adopt CCSSM (AK,
MN, NE, TX, VA) or that have de-adopted CCSSM in favor of state-specific mathematics
standards (IN, OK, SC), were used as the sample for this study. Table 3 below lists the standards
documents from the eight non-CCSSM states used in this study.
In addition to the author, the GLEs were coded by two other researchers: a professor in
the mathematics education department who had prior experiences with standards documents, and
a graduate student in the mathematics department who learned about curriculum standards in his
graduate classes and who also hopes to work with them in his own PhD dissertation in the future.
The two researchers were given a discourse on van Hiele theory and were showed examples
from the works of van Hieles and other van Hiele researchers of thinking and responses that
would correspond to each of the levels. There would be discussions about hypothetical tasks and
student responses and each researcher in this study would assign a level to each thought or
response. If there were any discrepancies then the theory would be revisited and examples from
original research would be examined until there was consensus among the researchers in the
study. This procedure ensured that both the curriculum standards and van Hiele levels were
appropriately understood before the coding of GLEs began.
The addition of two researchers added reliability to the coding process in this study.
Reliability is further discussed later in this chapter. The K-8 descriptive geometry mathematics
standards from CCSSM and these eight non-CCSSM states were

51
Table 3. List of non-CCSSM State Standards with Publication Dates
State Title of Document Year Published
Alaska Alaska Mathematics Standards 2012
Indiana Indiana Academic Standards for
Mathematics
2014
Minnesota Minnesota K-12 Academic
Standards in Mathematics
2007
Nebraska Nebraska’s College and Career
Ready Standards for Mathematics
2015
Oklahoma Oklahoma Academic Standards for
Mathematics
2016
South Carolina South Carolina College- and
Career-Ready Standards for
Mathematics
2015
Texas Texas Essential Knowledge and
Skills for Mathematics
2012
Virginia Mathematics Standards of
Learning for Virginia Public
Schools
2016
analyzed, with each standard being carefully isolated and, if appropriate, coded to a van Hiele
level. The standards documents were carefully analyzed by three researchers for descriptive
geometry standards at the K-8 level and each researcher would opine on a standard for its
suitability for van Hiele analysis. If there was a disagreement between any two scholars then the
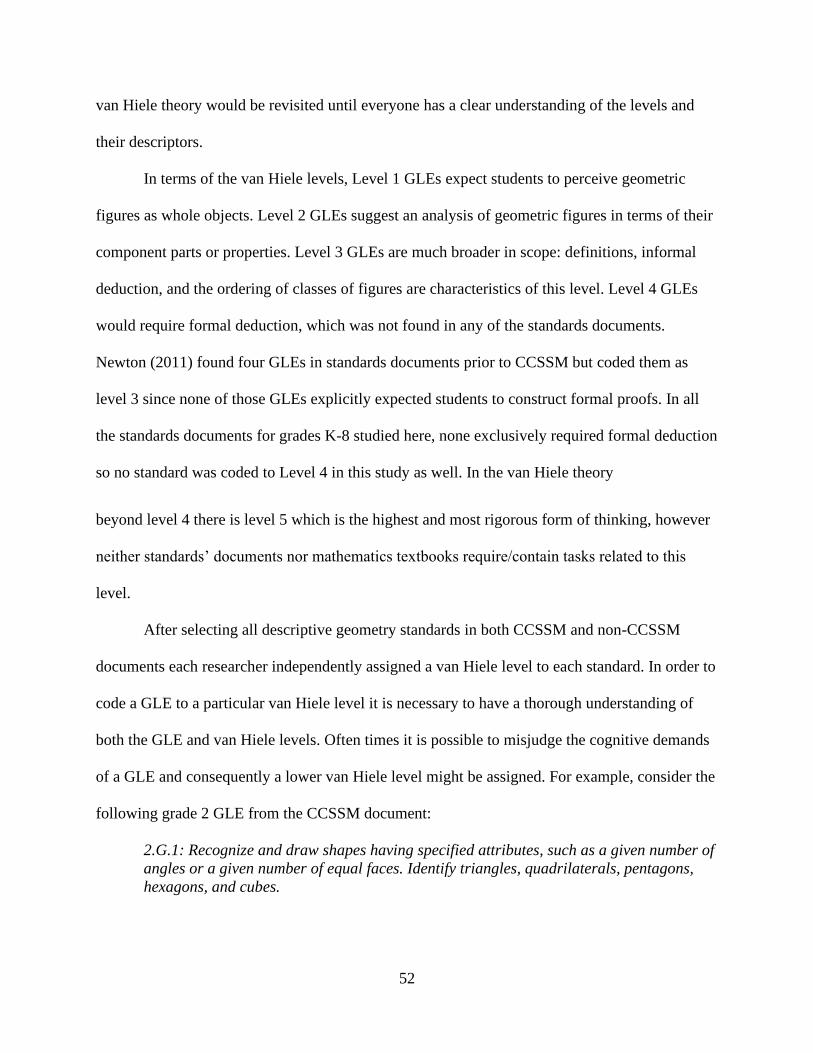
52
van Hiele theory would be revisited until everyone has a clear understanding of the levels and
their descriptors.
In terms of the van Hiele levels, Level 1 GLEs expect students to perceive geometric
figures as whole objects. Level 2 GLEs suggest an analysis of geometric figures in terms of their
component parts or properties. Level 3 GLEs are much broader in scope: definitions, informal
deduction, and the ordering of classes of figures are characteristics of this level. Level 4 GLEs
would require formal deduction, which was not found in any of the standards documents.
Newton (2011) found four GLEs in standards documents prior to CCSSM but coded them as
level 3 since none of those GLEs explicitly expected students to construct formal proofs. In all
the standards documents for grades K-8 studied here, none exclusively required formal deduction
so no standard was coded to Level 4 in this study as well. In the van Hiele theory
beyond level 4 there is level 5 which is the highest and most rigorous form of thinking, however
neither standards’ documents nor mathematics textbooks require/contain tasks related to this
level.
After selecting all descriptive geometry standards in both CCSSM and non-CCSSM
documents each researcher independently assigned a van Hiele level to each standard. In order to
code a GLE to a particular van Hiele level it is necessary to have a thorough understanding of
both the GLE and van Hiele levels. Often times it is possible to misjudge the cognitive demands
of a GLE and consequently a lower van Hiele level might be assigned. For example, consider the
following grade 2 GLE from the CCSSM document:
2.G.1: Recognize and draw shapes having specified attributes, such as a given number of
angles or a given number of equal faces. Identify triangles, quadrilaterals, pentagons,
hexagons, and cubes.

53
At first, it might appear that van Hiele level 1 is all that’s needed for this GLE. But a
careful analysis suggests that level 1 provides just an acquaintance with the standard. A student
at level 1 will be able to recognize and may even draw some familiar shapes such as triangles
and rectangles but a total mastery would require level 2 thinking. A problem that asks students to
draw a quadrilateral whose opposite sides are parallel is well within the purview of the above
GLE but would need more than level 1 thinking. Hence the above GLE must be coded as level 2.
If a particular standard required a lower van Hiele level for getting acquainted but
requires a higher van Hiele level for its mastery then the standard is assigned that higher van
Hiele level. After isolating the standards, two other researchers were asked to independently
assign van Hiele levels according to the same rubric. In case of discrepancy with either or both
researchers a careful study of the van Hiele theory was conducted and the level was reassigned in
the light of this newly acquired knowledge. Although van Hiele levels are used for assessing an
individual student’s thinking, we are attempting to classify standards that were written for all
students in a particular grade level. Van Hiele (1986) expressed this dilemma: “The levels are
situated not in the subject matter but in the thinking of man” (p.41). Gutierrez et al. (1991) argue
that tasks interact with students by eliciting their thoughts. Thus, standards and tasks prescribe
required reasoning determine the exposure and availability students will have for the levels. So,
it might appropriately be argued for the assignment of levels to standards since standards would
indicate the reasoning required and consequently demand students to think. In order to fully
master a GLE, a certain minimum van Hiele level of thought will be needed. The GLE would
then be coded with that van Hiele level.
Also, a standard was categorized only on the basis of its content and not grade level; it’s
possible that a standard appearing at a higher grade with nearly the same words as it would in a

54
lower grade might target a higher van Hiele level, but this would be difficult to tell without
knowing the intentions of the authors of the standards documents. For example, Newton (2011)
assigned the same Level 2, Analysis code to the following grade 1 standard from Mississippi and
the grade 7 standard from Missouri:
Example. Classify two and three-dimensional figures according to characteristics (e.g.,
square, rectangle, circle, cube, prism, sphere, cone, and cylinder). (MS, gr. 1)
Example. Classify 2- and 3- dimensional shapes based on their properties. (MO, gr. 7)
The only distinction between the statements of these two standards are the words
“characteristics” used in one state standard, and “properties” in the other state standard (p. 81).
Due to the authority of state level curriculum standards on the mathematics taught in
classrooms (Reys, 2006), van Hiele theory applied to curriculum standards can give us insight
into the opportunity students have to broaden their geometric understanding. For this study,
standards related to descriptive geometry were only considered since van Hiele analysis is most
suitable for those kinds of standards. Standards that involve measurement were not considered,
as were the standards where a clear van Hiele level could not be assigned by all three
researchers. For example, in the following Texas Grade 1 standard
“Compose two-dimensional shapes by joining two, three, or four figures to produce a
target shape in more than one way if possible”
While two of the three researchers maintained that it should be coded as level 1 GLE, the third
researcher was convinced that it takes level 2 thinking to attain a complete mastery in the above
standard. An agreement between the researchers as to the lowest van Hiele level needed for
mastery was not achieved. So, this standard was not considered for the study even though it falls
under descriptive geometry.
The following are some examples of GLEs that were included. These GLEs emphasize
identification, properties, and definitions of geometric objects.
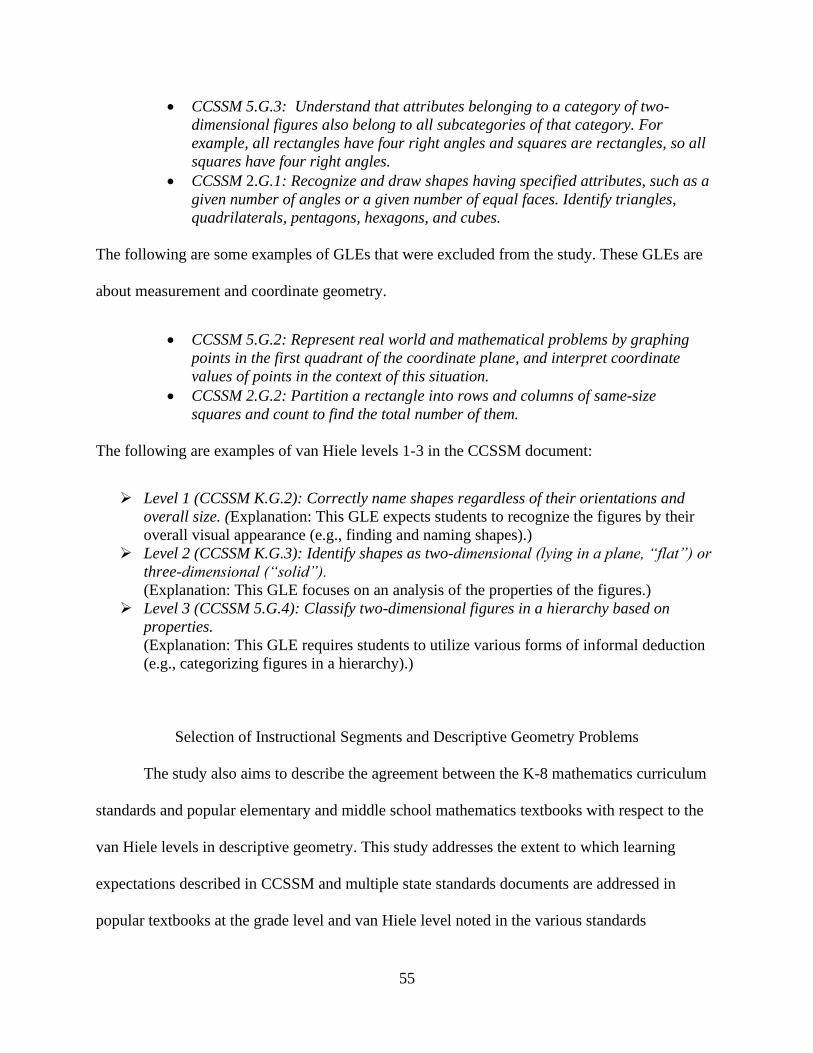
55
• CCSSM 5.G.3: Understand that attributes belonging to a category of two-
dimensional figures also belong to all subcategories of that category. For
example, all rectangles have four right angles and squares are rectangles, so all
squares have four right angles.
• CCSSM 2.G.1: Recognize and draw shapes having specified attributes, such as a
given number of angles or a given number of equal faces. Identify triangles,
quadrilaterals, pentagons, hexagons, and cubes.
The following are some examples of GLEs that were excluded from the study. These GLEs are
about measurement and coordinate geometry.
• CCSSM 5.G.2: Represent real world and mathematical problems by graphing
points in the first quadrant of the coordinate plane, and interpret coordinate
values of points in the context of this situation.
• CCSSM 2.G.2: Partition a rectangle into rows and columns of same-size
squares and count to find the total number of them.
The following are examples of van Hiele levels 1-3 in the CCSSM document:
➢ Level 1 (CCSSM K.G.2): Correctly name shapes regardless of their orientations and
overall size. (Explanation: This GLE expects students to recognize the figures by their
overall visual appearance (e.g., finding and naming shapes).)
➢ Level 2 (CCSSM K.G.3): Identify shapes as two-dimensional (lying in a plane, “flat”) or
three-dimensional (“solid”).
(Explanation: This GLE focuses on an analysis of the properties of the figures.)
➢ Level 3 (CCSSM 5.G.4): Classify two-dimensional figures in a hierarchy based on
properties.
(Explanation: This GLE requires students to utilize various forms of informal deduction
(e.g., categorizing figures in a hierarchy).)
Selection of Instructional Segments and Descriptive Geometry Problems
The study also aims to describe the agreement between the K-8 mathematics curriculum
standards and popular elementary and middle school mathematics textbooks with respect to the
van Hiele levels in descriptive geometry. This study addresses the extent to which learning
expectations described in CCSSM and multiple state standards documents are addressed in
popular textbooks at the grade level and van Hiele level noted in the various standards

56
documents. This study also examines the differences in agreement between learning expectations
in standards documents and mathematics textbooks across different textbook series selected for
analysis for their van Hiele levels in their descriptive geometry tasks. Table 4 lists the textbook
sample for this study, which included three elementary (K-5) series and three middle grades (6-
8) series. It should be noted that Eureka Math spans grades K-8 and thus was used in both the
elementary and middle grades sample.
Table 4. List of Textbooks Analyzed and Their Publication Dates
Textbook
Publisher
Grade Levels
Publication date
Go Math
Houghton Mifflin
Harcourt
K-5
2012
Ready Math
Curriculum Associates
K-5
2016
Eureka Math
Great Minds
K-8
2015
Open up Resources
Open up Resources
6-8
2018
Math in Focus
Marshall Cavendish
Education
6-8
2012

57
A page or a set of pages containing topics targeted for a particular goal is classified as an
instructional segment. All the curricular materials were investigated page by page to sort out
descriptive geometry instructional segments: hands-on activity, description of a concept, or
problems and exercises. Each instructional segment was analyzed carefully to isolate topics on
geometrical shapes and their relationships. Similar to the study of selection of standards in
curriculum standards documents, instructional segments were assigned van Hiele levels needed
for mastery of the topic or efforts needed for the successful solution of the problem(s).
Analysis of Textbooks
Each textbook series contained slightly different organizational structures as well as
formats (i.e., print editions, online formats). In this section the layout of textbooks and other
curricular materials analyzed are described. I will provide examples and non-examples of
descriptive geometry instructional segments, as well as examples of different van Hiele tasks for
each curricular material.
Ready Math
These curricular materials are developed for K-5. Each grade level has two books:
Instruction, and Practice and Problem Solving. The Instruction book is divided into several units
and each unit is divided into several lessons.
Eureka Math
These curricular materials span entire K-12 but only K-8 materials are used in this study.
Each grade level curriculum is divided into several modules, each module is divided into several
topics, and each topic is divided into several lessons. Each module begins with an overview and
58
describes the various topics and suggests a distribution of instructional minutes based on the
emphasis of particular lesson components in different lessons throughout the module.
Go Math
These textbooks are developed for grades K-5. They are more like workbooks; the books
provide spaces for most problems and the students are encouraged to write out their solutions.
Each chapter begins with a “Show What You Know” section which tests students’ prerequisite
knowledge for the chapter and then follows instructional segments followed by Mid-Chapter
Checkpoint. Then there are more instructional segments followed by exercises.
Math in Focus
These books are popularly called Singapore Math since they are aligned to match the shifts
in Singapore’s curriculum. This series of textbooks are named Course 1, Course 2, and Course 3
and are used for grades 6, 7, and 8 respectively. Each course is divided into chapters and a
typical chapter begins with a Chapter Opener that introduces chapter concepts and big ideas
through a story or example.
Open-Up Resources
These curricular materials are developed for K-8 but only 6-8 are used for this study.
Each grade level has teacher guide as well as student guide; only teacher guides for grades 6-8
are used in this analysis. Each grade level teacher guide is made of 9 units and each unit is
written in a different book. Each unit begins with a unit Overview, Pre-Unit Diagnostic
Assessment, Mid-Unit Assessment, End-of-Unit Assessment, followed by several Lessons. Each
lesson begins with Agreements which mention the prior standards the lesson is building on, and
also the CCSSM standard it is building towards. There is a Classroom activity in each section of
the lesson where the teacher poses a question related to the activity. After this the guide lists

59
Possible Responses and Anticipated Misconceptions. Finally, there is Lesson Synthesis followed
by Practice Problems to conclude the lesson.
Since the majority of the textbooks studied were meant for either grades K-5 or 6-8, the
GLEs in curriculum documents are separated into two classes: K-5 and 6-8. This will allow the
study of agreement between mathematics textbooks and curriculum standards documents.
Figures 7-12 provide parts of textbooks showing descriptive geometry content. As
mentioned previously, this refers to the properties of geometric figures without regards to the
measurement or coordinates. Level 1 tasks require students to know the name of a figure from its
overall visual appearance, level 2 requires analysis of the properties of figures, level 3 needs to
perform informal deduction by either classifying figures into hierarchies, or know defining
properties, or have experiences with proof. Level 4 tasks require formal deduction from
previously learned geometric facts to prove unknown facts in geometry. Figure 12 shows an
example of level 4 task found in grade 7 Open Up Resources curriculum.

60
Figure 7. A page showing descriptive geometry segment in Eureka Math. Reprinted with
permission from Eureka Math

61
Figure 8. A page showing van Hiele level 1 task from Eureka Math. Reprinted with permission
from Open Up Resources
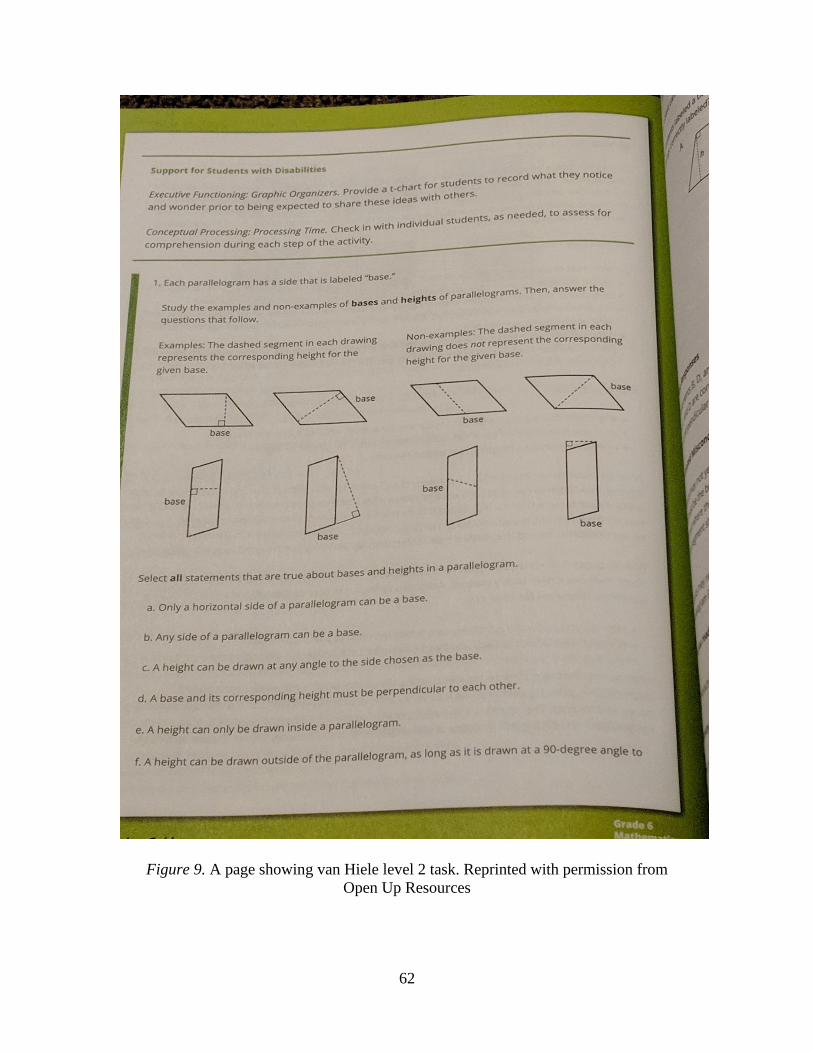
62
Figure 9. A page showing van Hiele level 2 task. Reprinted with permission from
Open Up Resources

63
Figure 10. A page showing van Hiele level 3 task (Definition). Reprinted with permission from
Open Up Resources

64
Figure 11. A page showing van Hiele level 3 task (Experiences with proof).
Reprinted with Permission from Open Up Resources
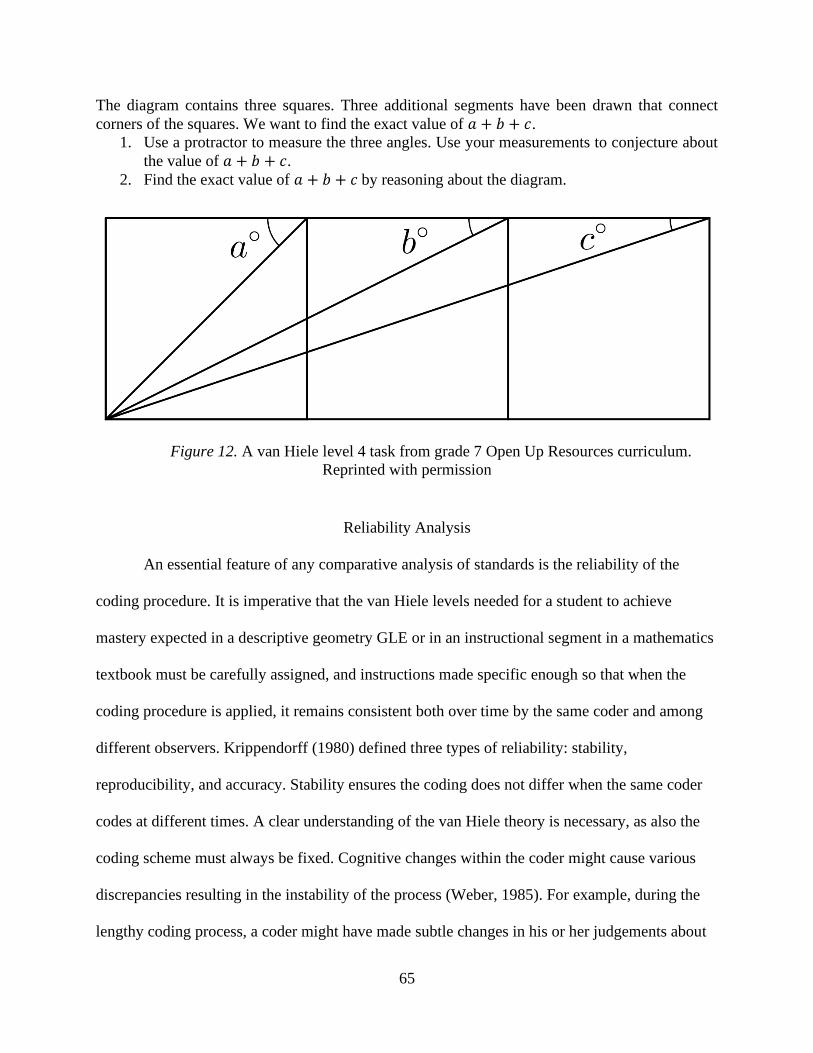
65
The diagram contains three squares. Three additional segments have been drawn that connect
corners of the squares. We want to find the exact value of 𝑎 + 𝑏 + 𝑐.
1. Use a protractor to measure the three angles. Use your measurements to conjecture about
the value of 𝑎 + 𝑏 + 𝑐.
2. Find the exact value of 𝑎 + 𝑏 + 𝑐 by reasoning about the diagram.
Figure 12. A van Hiele level 4 task from grade 7 Open Up Resources curriculum.
Reprinted with permission
Reliability Analysis
An essential feature of any comparative analysis of standards is the reliability of the
coding procedure. It is imperative that the van Hiele levels needed for a student to achieve
mastery expected in a descriptive geometry GLE or in an instructional segment in a mathematics
textbook must be carefully assigned, and instructions made specific enough so that when the
coding procedure is applied, it remains consistent both over time by the same coder and among
different observers. Krippendorff (1980) defined three types of reliability: stability,
reproducibility, and accuracy. Stability ensures the coding does not differ when the same coder
codes at different times. A clear understanding of the van Hiele theory is necessary, as also the
coding scheme must always be fixed. Cognitive changes within the coder might cause various
discrepancies resulting in the instability of the process (Weber, 1985). For example, during the
lengthy coding process, a coder might have made subtle changes in his or her judgements about

66
the van Hiele levels demanded for one or more GLEs. In order to guard against this, the
standards were coded at the beginning of the study and then coded again after learning more
about the levels of van Hiele theory. This helped determine consistency in the coding, and/or if
there had been any changes. Coder fatigue might contribute to the problems in getting a stable
procedure. To avoid this situation, fewer standards were coded in one sitting and the process was
repeated more frequently.
The second type of reliability is reproducibility or inter-coder reliability. It deals with
consistency in coding by two or more coders. This is a sure measure of the clarity in coding
categories (Krippendorff, 1980). For this, the author is grateful for the help received from a
professor in the math department, and a fellow graduate student. The two coders were made
aware of the work of van Hieles and subsequent development of the theory in the US and
elsewhere. For the first few weeks the three researchers spent time trying to understand the
theory, the properties of van Hiele levels, their nature, and the meaning of mastering at a
particular level. Then the coding process began to ensure that chosen standards could be assigned
van Hiele levels that would be agreeable to experts in the area.
The third type of reliability is accuracy. This reliability measures the extent to which a
process conforms to a known standard (Krippendorff, 1980). Accuracy is usually established by
comparing the performance of one coder with what is known to be a correct performance
(Krippendorff, 1980). This is the strongest measure of reliability, but generally difficult to
achieve since a known coding of van Hiele standard might not exist. The correct coding might be
decided by the van Hieles themselves, if they were to code GLEs and instructional segments.
However, the nature of van Hiele levels were questioned and modified during the lifetime of
Pierre van Hiele (Usiskin, 1982).

67
The reliability achieved in coding curriculum standards documents in the CCSSM and
other state specific curriculum documents was used as the basis for coding instructional
segments in the textbooks analyzed. Each page of the textbook was carefully read to see if there
are any descriptive geometry portions in any part. If found, the parts of the chapters which aimed
at the understanding of a single concept was called an instructional segment, and each
instructional segment was then coded to a van Hiele Level. When all of the standards and
instructional segments were assigned a level the results were researched based on the prevalence
of standards at a particular level. The results about what levels are predominant at a grade was
then analyzed.
68
CHAPTER 4
DATA ANALYSIS AND RESULTS
In this chapter, the collected data on van Hiele levels will be examined. Data analysis will
include discussion of the results from the van Hiele levels in both curriculum standards
documents as well as mathematics textbooks. The framework for this chapter is provided by a
series of questions aimed at systematically addressing the main research question: How well do
K-8 curriculum standards and mathematics textbooks prepare students for high school geometry
by providing increasing van Hiele level opportunity with the progression of the grades? The
specific research questions addressed by this study are:
• How are the descriptive geometry GLEs distributed in K-8 standards documents?
• Do more than one van Hiele Level occur in the same grade in standards documents?
• How the descriptive geometry instructional segments are distributed in K-5 mathematics
textbooks?
• How the descriptive geometry instructional segments are distributed in 6-8 mathematics
textbooks?
• Do more than one van Hiele level occur in the same textbook for the same grade?
In this chapter the analysis of curriculum standards documents and mathematics
textbooks is discussed. In particular, the research questions related to the curriculum documents
and mathematics textbooks are addressed. The study focusses on descriptive geometry GLEs in
standards documents and instructional segments in mathematics textbooks. The study begins
with the compilation of data on the van Hiele levels at each grade in each of the standards
documents analyzed. It then moves on to compare CCSSM and non-CCSSM documents for the
similarities or differences in van Hiele levels for each grade. Then the discussion begins with the

69
spread of descriptive geometry GLEs in K-5 standards documents with respect to the different
van Hiele levels followed by the same for grades 6-8 standards documents. It is then followed by
a discussion on overlapping of van Hiele levels in the same grade in standards documents. An
affirmative answer would provide an argument for the nature of level acquisition that the levels
do not depend on age or grade but can be raised with proper instruction. The study then shifts
towards the analysis of K-5 mathematics textbooks for similar answers about the spread of
descriptive geometry instructional segments with respect to van Hiele levels followed by the
same for grades 6-8 instructional segments, and the overlapping of van Hiele levels in the same
grade. The analysis of standards documents would reveal any difference in CCSSM document
and the non-CCSSM documents. The study also aims to check the agreement between standards
documents and mathematics textbooks with respect to the van Hiele levels for descriptive
geometry content. Comparison is done between CCSSM document and mathematics textbooks
for van Hiele level at each grade, and then the comparison is repeated between non-CCSSM
documents and mathematics textbooks at each grade.
Analysis of Curriculum Standards
A total of 20 descriptive geometry GLEs were found in CCSSM and 180 were found in
the non-CCSSM state standards’ documents. Table 5 below lists the percentages of level 1, 2, 3
and 4 GLEs in CCSSM and non-CCSSM documents. The distributions point the fact that
CCSSM has less proportion of level 1 (20%) standards than the non-CCSSM states offer (31%).
There are 30% level 3 GLEs in CCSSM whereas non-CCSSM documents have 17% level 3
GLEs. The proportions of level 2 GLEs is similar (50% and 53% for CCSSM and non-CCSSM
respectively). The drop in level 3 GLEs in the non-CCSSM documents could be dominated by

70
the fact that Minnesota K-12 Academic Standards in Mathematics, and Oklahoma Academic
Standards for Mathematics have only one level 3 descriptive geometry GLE each. None of the
standards documents has a level 4 standard.
Table 5. Percentage of van Hiele Levels 1, 2, 3, and 4 GLEs in Standards Documents
van Hiele levels CCSSM Non-CCSSM
Level 1
4(20%)
54(31%)
Level 2 10(50%) 93(53%)
Level 3
Level 4
6(30%)
0(0%)
30(17%)
0(0%)
Total 20 180

71
Table 6 lists the number of descriptive geometry GLEs in all the standards documents
analyzed at each grade level. Table 7 list the number of van Hiele levels 1, 2, 3, and 4 standards
in each of the standards documents in the study.
Table 6. Number of Descriptive Geometry GLEs in Standards Documents
Grade CCSSM AK IN MN OK NE SC TX VA
K 6 6 4 2 5 5 4 6 3
1 2 2 3 2 4 2 3 5 2
2 1 1 3 2 4 1 1 5 3
3 1 1 2 2 2 2 2 2 3
4 3 3 5 5 3 6 4 4 6
5 2 2 1 1 2 3 2 1 4
6 0 1 0 0 0 0 0 0 2
7 1 1 1 2 1 0 1 0 1
8 4 4 4 1 1 4 4 1 4

72
Table 7. Number of Different van Hiele Levels by Grade in Standards Documents
Grade Levels CCSSM AK IN MN NE OK SC TX VA
L1 3/20
15%
3/21
14.3%
2/23
8.7%
1/17
5.9%
2/23
8.7%
4/22
18.2%
1/21
4.8%
3/24
12.5%
2/24
8.3%
K L2 3/20
15%
3/21
14.3%
2/23
8.7%
1/17
5.9%
3/23
13%
1/22
4.5%
3/21
14.3%
2/24
8.3%
1/24
4.2%
L3 0/20
0%
0/21
0%
0/23
0%
0/17
0%
0/23
0%
0/22
0%
0/21
0%
1/24
4.2%
0/24
0%
L1 1/20
5%
1/21
4.8%
1/23
4.3%
1/17
5.9%
1/23
4.3%
4/22
18.2%
2/21
9.6%
0/24
0%
0/24
0%
1 L2 0/20
0%
0/21
0%
1/23
4.3%
1/17
5.9%
0/23
0%
0/22
0%
0/21
0%
3/24
12.5%
2/24
8.3%
L3 1/20
5%
1/21
4.8%
1/23
4.3%
0/17
0%
1/23
4.3%
0/22
0%
1/21
4.8%
2/24
8.3%
0/24
0%
L1 0/20
0%
0/21
0%
1/23
4.3%
1/17
5.9%
0/23
0%
3/22
13.6%
0/21
0%
2/24
8.3%
0/24
0%
2 L2 1/20
5%
1/21
4.8%
2/23
8.7%
1/17
5.9%
1/23
4.3%
1/22
4.5%
1/21
4.8%
3/24
12.5%
3/24
12.5%
L3 0/20
0%
0/21
0%
0/23
0%
0/17
0%
0/23
0%
0/22
0%
0/21
0%
0/24
0%
0/24
0%
L1 0/20
0%
0/21
0%
1/23
4.3%
0/17
0%
1/23
4.3%
1/22
4.5%
1/21
4.8%
0/24
0%
2/24
8.3%
3 L2 0/20
0%
0/21
0%
0/23
0%
2/17
11.8%
1/23
4.3%
1/22
4.5%
0/21
0%
1/24
4.2%
1/24
4.2%
L3 1/20
5%
1/21
4.8%
1/23
4.3%
0/17
0%
0/23
0%
0/22
0%
1/21
4.8%
1/24
4.2%
0/24
0%
L1 0/20
0%
0/21
0%
1/23
4.3%
0/17
0%
3/23
13%
1/22
4.5%
0/21
0%
1/24
4.2%
3/24
12.5%
4 L2 3/20
15%
3/21
14.3%
4/23
17.4%
5/17
29.4%
3/23
13%
2/22
9.1%
3/21
14.3%
3/24
12.5%
2/24
8.3%
L3 0/20
0%
0/21
0%
0/23
0%
0/17
0%
0/23
0%
0/22
0%
1/21
4.8%
0/24
0%
1/24
4.2%

73
Table 7 cont. Number of Different van Hiele Levels by Grade in Standards Documents
Grade Levels CCSSM AK IN MN NE OK SC TX VA
L1 0/20
0%
0/21
0%
0/23
0%
0/17
0%
2/23
8.7%
0/22
0%
0/21
0%
0/24
0%
1/24
4.2%
5 L2 0/20
0%
0/21
0%
0/23
0%
1/17
5.9%
0/23
0%
2/22
9.1%
0/21
0%
0/24
0%
2/24
8.3%
L3 2/20
10%
2/21
9.6%
1/23
4.3%
0/17
0%
1/23
4.3%
0/22
0%
2/21
9.6%
1/24
4.2%
1/24
4.2%
L1 0/20
0%
0/21
0%
0/23
0%
0/17
0%
0/23
0%
0/22
0%
0/21
0%
0/24
0%
1/24
4.2%
6 L2 0/20
0%
1/21
4.8%
0/23
0%
0/17
0%
0/23
0%
0/22
0%
0/21
0%
0/24
0%
1/24
4.2%
L3 0/20
0%
0/21
0%
0/23
0%
0/17
0%
0/23
0%
0/22
0%
0/21
0%
0/24
0%
0/24
0%
L1 0/20
0%
0/21
0%
0/23
0%
0/17
0%
0/23
0%
0/22
0%
0/21
0%
0/24
0%
0/24
0%
7 L2 1/20
5%
1/21
4.8%
1/23
4.3%
2/17
11.8%
0/23
0%
1/22
4.5%
0/21
0%
0/24
0%
1/24
4.2%
L3 0/20
0%
0/21
0%
0/23
0%
0/17
0%
0/23
0%
0/22
0%
1/21
4.8%
0/24
0%
0/24
0%
L1 0/20
0%
0/21
0%
0/23
0%
0/17
0%
0/23
0%
0/22
0%
0/21
0%
0/24
0%
0/24
0%
8 L2 2/20
10%
2/21
9.6%
3/23
13%
0/17
0%
3/23
13%
0/22
0%
2/21
9.6%
0/24
0%
3/24
12.5%
L3 2/20
10%
2/21
9.6%
1/23
4.3%
1/17
5.9%
1/23
4.3%
1/22
4.5%
2/21
9.6%
1/24
4.2%
1/24
4.2%

74
Figures 13-21 below present the distribution of descriptive geometry GLEs across grade
levels in CCSSM and other multiple state standard documents.
Figure 13. Distribution of GLEs at three van Hiele levels by grade in CCSSM
In figure 13, it can be seen that van Hiele level 1 tasks appear in only grades K and 1 in
the CCSSM document. Levels 2 and 3 skills show up in grades 1 through 8 almost in the same
proportion. Grade 6 in CCSSM does not have any descriptive geometry activities so no van Hiele
levels were coded for grade 6.
Figure 14 shows the distribution of van Hiele levels in Alaska Mathematics Standards document.
As can be seen it is identical to Figure 13 and hence this is same as the CCSSM document. In
fact, most of the words used in Alaska’s document are the ones used in CCSSM.
0
0.5
1
1.5
2
2.5
3
3.5
K 1 2 3 4 5 7 8
Level 1 Level 2 Level3

75
Figure 14. Distribution of GLEs at three van Hiele levels in Alaska Mathematics Standards
Figure 15. Distribution of GLEs at three van Hiele levels in Indiana Academic Mathematics
Standards
0
0.5
1
1.5
2
2.5
3
3.5
K 1 2 3 4 5 7 8
Level 1 Level 2 Level 3
0
0.5
1
1.5
2
2.5
3
3.5
4
4.5
K 1 2 3 4 5 7 8
Level 1 Level 2 Level 3
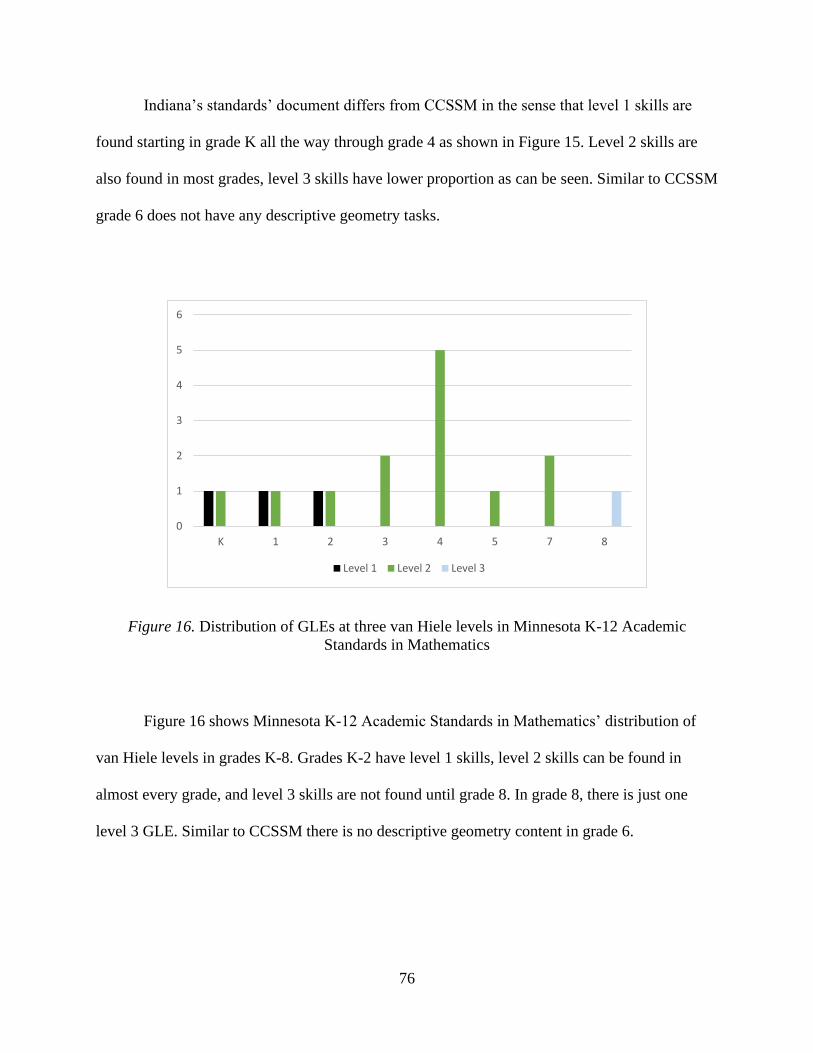
76
Indiana’s standards’ document differs from CCSSM in the sense that level 1 skills are
found starting in grade K all the way through grade 4 as shown in Figure 15. Level 2 skills are
also found in most grades, level 3 skills have lower proportion as can be seen. Similar to CCSSM
grade 6 does not have any descriptive geometry tasks.
Figure 16. Distribution of GLEs at three van Hiele levels in Minnesota K-12 Academic
Standards in Mathematics
Figure 16 shows Minnesota K-12 Academic Standards in Mathematics’ distribution of
van Hiele levels in grades K-8. Grades K-2 have level 1 skills, level 2 skills can be found in
almost every grade, and level 3 skills are not found until grade 8. In grade 8, there is just one
level 3 GLE. Similar to CCSSM there is no descriptive geometry content in grade 6.
0
1
2
3
4
5
6
K 1 2 3 4 5 7 8
Level 1 Level 2 Level 3
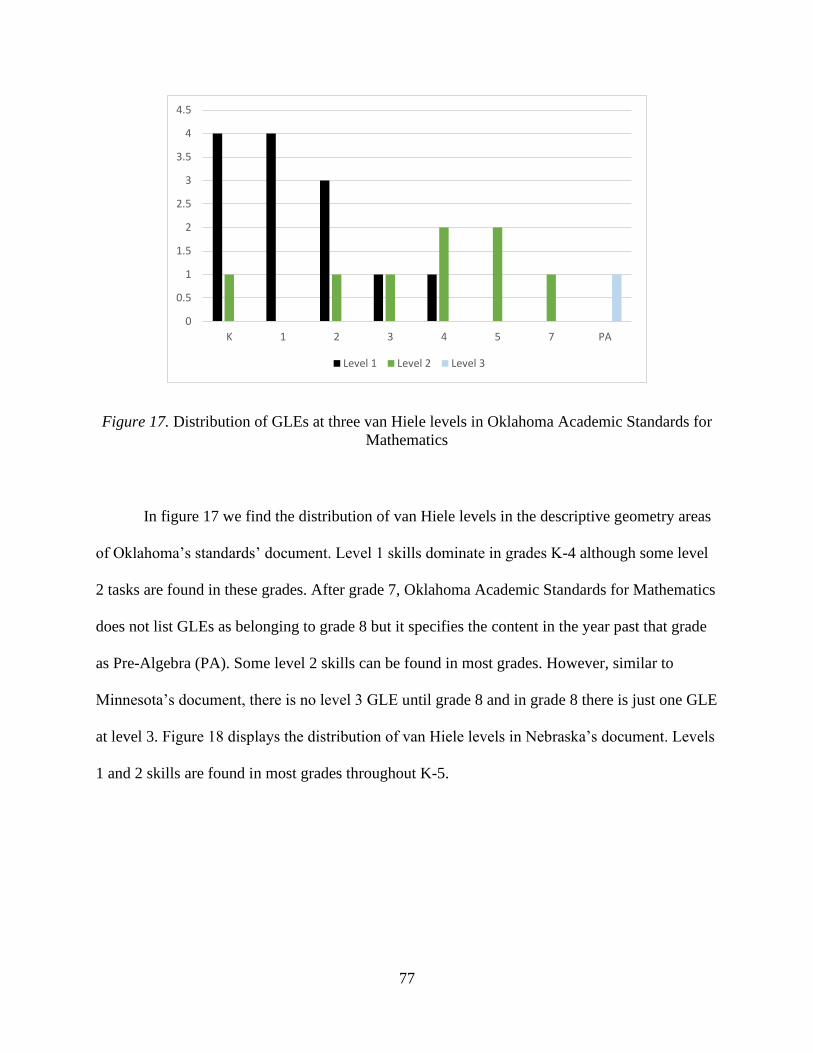
77
Figure 17. Distribution of GLEs at three van Hiele levels in Oklahoma Academic Standards for
Mathematics
In figure 17 we find the distribution of van Hiele levels in the descriptive geometry areas
of Oklahoma’s standards’ document. Level 1 skills dominate in grades K-4 although some level
2 tasks are found in these grades. After grade 7, Oklahoma Academic Standards for Mathematics
does not list GLEs as belonging to grade 8 but it specifies the content in the year past that grade
as Pre-Algebra (PA). Some level 2 skills can be found in most grades. However, similar to
Minnesota’s document, there is no level 3 GLE until grade 8 and in grade 8 there is just one GLE
at level 3. Figure 18 displays the distribution of van Hiele levels in Nebraska’s document. Levels
1 and 2 skills are found in most grades throughout K-5.
0
0.5
1
1.5
2
2.5
3
3.5
4
4.5
K 1 2 3 4 5 7 PA
Level 1 Level 2 Level 3

78
Figure 18. Distribution of GLEs at three van Hiele levels in Nebraska College and Career Ready
Standards in Mathematics
However, some level 3 is found in grades 1 and 5. There is no descriptive geometry
content in grades 6 and 7. There are both levels 2 and 3 in grade 8 with a predominance of level
2.
Figure 19. Distribution of GLEs at three van Hiele levels in South Carolina College and Career
Ready Standards for Mathematics
0
0.5
1
1.5
2
2.5
3
3.5
K 1 2 3 4 5 8
Level 1 Level 2 Level 3
0
0.5
1
1.5
2
2.5
3
3.5
K 1 2 3 4 5 7 8
Level 1 Level 2 Level 3

79
In figure 19 we find South Carolina’s document’s distribution of van Hiele levels. There
are level 1 skills in grades K, 1, and 3. Level 2 skills appear in grades K, 2, 4, and 8. There seems
to be higher proportion of level 3 tasks than previous documents. Also, similar to CCSSM there
are no descriptive geometry GLEs in grade 6.
Figure 20. Distribution of GLEs at three van Hiele levels in Texas Essential Knowledge and
Skills for Mathematics
Figure 20 shows van Hiele levels in the Texas’ document. Though level 1 skills appear in
grades K, 2, and 4 there is dominance of level 2 skills in lower grades, and level 3 skills can be
found in most grades. It must be noted that after grade 4 there are only level 3 tasks in this
document. There are no descriptive geometry GLEs in grades 6 and 7.
0
0.5
1
1.5
2
2.5
3
3.5
K 1 2 3 4 5 8
Level 1 Level 2 Level 3
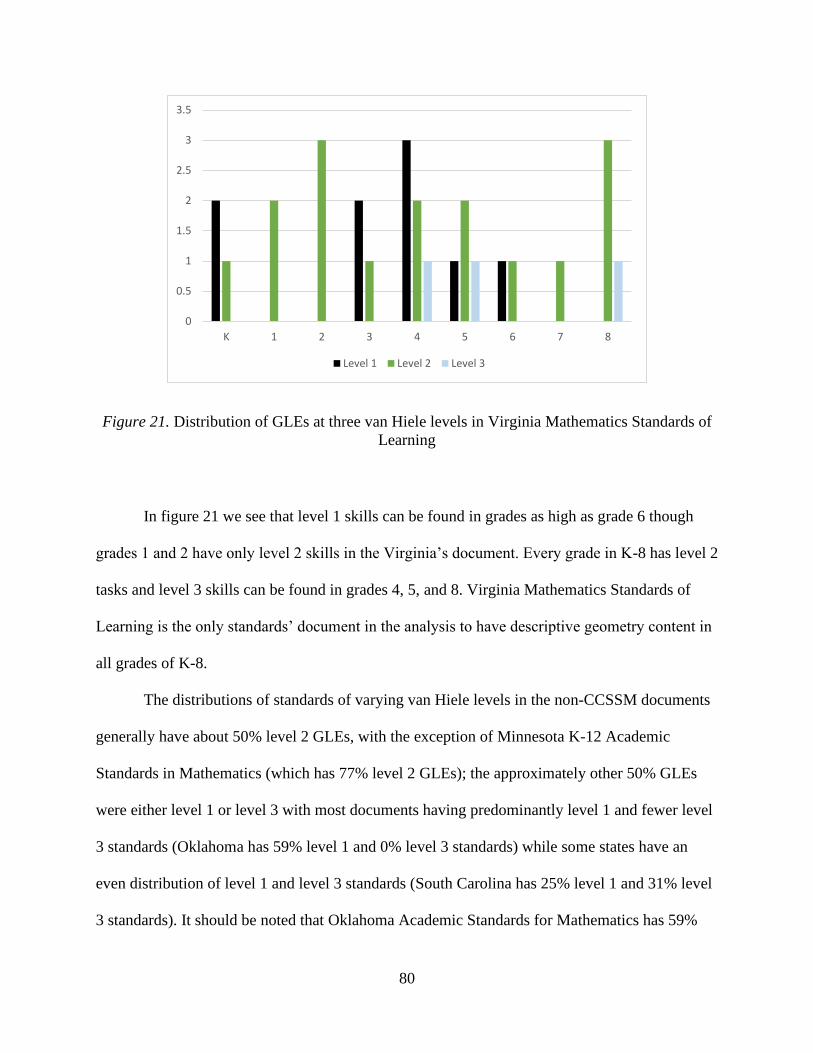
80
Figure 21. Distribution of GLEs at three van Hiele levels in Virginia Mathematics Standards of
Learning
In figure 21 we see that level 1 skills can be found in grades as high as grade 6 though
grades 1 and 2 have only level 2 skills in the Virginia’s document. Every grade in K-8 has level 2
tasks and level 3 skills can be found in grades 4, 5, and 8. Virginia Mathematics Standards of
Learning is the only standards’ document in the analysis to have descriptive geometry content in
all grades of K-8.
The distributions of standards of varying van Hiele levels in the non-CCSSM documents
generally have about 50% level 2 GLEs, with the exception of Minnesota K-12 Academic
Standards in Mathematics (which has 77% level 2 GLEs); the approximately other 50% GLEs
were either level 1 or level 3 with most documents having predominantly level 1 and fewer level
3 standards (Oklahoma has 59% level 1 and 0% level 3 standards) while some states have an
even distribution of level 1 and level 3 standards (South Carolina has 25% level 1 and 31% level
3 standards). It should be noted that Oklahoma Academic Standards for Mathematics has 59%
0
0.5
1
1.5
2
2.5
3
3.5
K 1 2 3 4 5 6 7 8
Level 1 Level 2 Level 3

81
level 1 GLEs. Oklahoma Academic Standards for Mathematics and Minnesota K-12 Academic
Standards in Mathematics include just a single van Hiele level 3 GLE and this revelation is
striking since every other curriculum document has typically more level 3 content. Each of the
figures indicates the prevalence of level 1 GLEs in lower grades, level 2 GLEs in upper
elementary through middle grades, and level 3 GLEs in predominantly higher grades. This
distribution is expected given the sequential nature of levels. It should be noted that there are
only a few level 3 GLEs in any given document. This observation does support the concern that
K-8 geometry curriculum may not be sufficiently preparing students for the formal reasoning of
a high school geometry course, as several researchers have pointed out (Clements & Battista,
1992b; Hoffer, 1983; Mayberry, 1983; Senk, 1989; Usiskin, 1982; Wirszup, 1976).
Do more than one van Hiele Level occur in the same grade in a given curriculum document?
It can be seen that different van Hiele levels occur at the same grade level in most grades
in most curriculum documents. For example, Table 8 shows 3 GLEs from grade 1 of Indiana
Academic Mathematics Standards document. Although it is rare to find three van Hiele levels in
a single grade, most standards documents have a lot of grades where at least two van Hiele levels
were found.

82
Table 8. Different van Hiele Level GLEs at the Same Grade Level
Van Hiele level Grade-Level Expectation
1
1.G.3: Use two-dimensional shapes (rectangles, squares,
trapezoids, triangles, half-circles, and quarter circles) or three-
dimensional shapes (cubes, right rectangular prisms, right circular
cones, and right circular cylinders) to create a composite shape,
and compose new shapes from the composite shape.
2
1.G.1: Identify objects as two-dimensional or three-dimensional,
classify and sort two-dimensional and three-dimensional objects
by shape, size, roundness and other attributes. Describe how two-
dimensional shapes make up the faces of three-dimensional
objects.
3
1.G.2: Distinguish between defining attributes of two- and three-
dimensional shapes (e.g., triangles are closed and three sided)
versus non-defining attributes (e.g., color, orientation, overall
size). Create and draw two-dimensional shapes with defining
attributes.
This is not surprising and is in fact expected, that students encounter geometric content at
different van Hiele levels simultaneously. It was noted that students demonstrate level 3 thinking

83
on familiar content whereas a newer topic often reverts them to level 1. The same students were
able to quickly reach level 3 for the relatively new content when taught with instructions
consistent with the van Hieles’ model (Fuys et al., 1988).
van Hiele level 3 corresponds to informal deduction of geometric facts and can be
broadly classified into four forms: (a) the hierarchical nature of classes of figures (e.g., squares
are rectangles, rectangles are parallelograms, and parallelograms are quadrilaterals), (b) the
relationships between the properties of figures, (c) the definition of classes of figures, and (d)
experiences with proof. It must be mentioned that if students are not expected to explicitly
construct formal proofs then the GLEs that deal with proof experiences should be coded as level
3. Table 9 presents these four types of level 3 GLEs along with an example of each. The various
types of level 3 GLEs are repeatedly discussed in van Hiele literature (e.g., Crowley, 1987; Fuys
et al., 1998). It is satisfying to learn that all documents included these informal deduction tasks,
although some have more than others.

84
Table 9. Different Types of van Hiele Level 3 GLEs in Curriculum Standards Documents
Type of level
3 GLE
Total number
of GLEs
Sample Grade-level expectation
Hierarchical
nature of
classes of
figures
16
Understand that attributes belonging to a category of two-
dimensional figures also belong to all subcategories of that
category. For example, all rectangles have four right angles and
squares are rectangles, so all squares have four right angles.
Relationships
between
properties of
figures
1 Use attributes to recognize rhombuses, parallelograms, trapezoids,
rectangles, and squares as examples of quadrilaterals and draw
examples of quadrilaterals that do not belong to any of these
subcategories
Defining
properties
8 Distinguish between defining attributes (e.g., triangles are closed
and three-sided) versus non-defining attributes (e.g., color,
orientation, overall size); build and draw shapes to possess
defining attributes.
Proof 11 Explain a proof of Pythagorean theorem and its converse.
85
In summary, the analysis of K-8 standards documents revealed that lower grades have
van Hiele level 1 tasks, upper elementary and lower middle grades have van Hiele level 2 tasks,
and upper middle school has van Hiele level 3 standards in general. There were no level 4
standards in K-8 documents. Alaska Mathematics Standards were closest to CCSSM with the
distribution of van Hiele levels almost identical except for the fact that it has one level 2 standard
in grade 6 document. The states that showed noticeable shift from CCSSM were Minnesota and
Oklahoma. While CCSSM had 30% level 3 GLEs beginning in grade 1 and going through grade
8, the documents from these states had only one level 3 standard appearing in grade 8.
With the eye towards studying the agreement between curriculum standards documents
and mathematics textbooks, it must be emphasized that unlike curriculum standards documents
where GLEs for each of the grades K-8 and beyond are listed, with the exception of Eureka Math
(which is based on CCSSM), mathematics textbooks in this study served either grades K-5 or 6-
8. Therefore, curriculum standards documents were further split into two classes for analysis:
grades K-5 and grades 6-8. Tables 10 and 11 list the percentage of van Hiele Levels 1, 2, 3, and 4
GLEs in grades K-5 and 6-8 curriculum standards documents respectively.

86
Table 10. Percentage of van Hiele Levels 1, 2, 3 & 4 in K-5 Standards Documents
vH level CCSSM AK IN MN NE OK SC TX VA
Level 1 31% 31% 33% 21% 47% 65% 25% 26% 38%
Level 2 54% 54% 50% 79% 42% 35% 44% 52% 52%
Level 3 15% 15% 17% 0% 11% 0% 31% 22% 10%
Level 4 0% 0% 0% 0% 0% 0% 0% 0% 0%
As Table 10 shows the percentage of van Hiele level 3 tasks in K-5 curriculum standards
documents ranged from 0-31% with most of them around 15%. Most of the descriptive geometry
GLEs in K-5 curriculum standards documents are aimed at Levels 1 & 2 thinking and this is
expected since there must be ample opportunity for those kinds of exercises in lower grades.
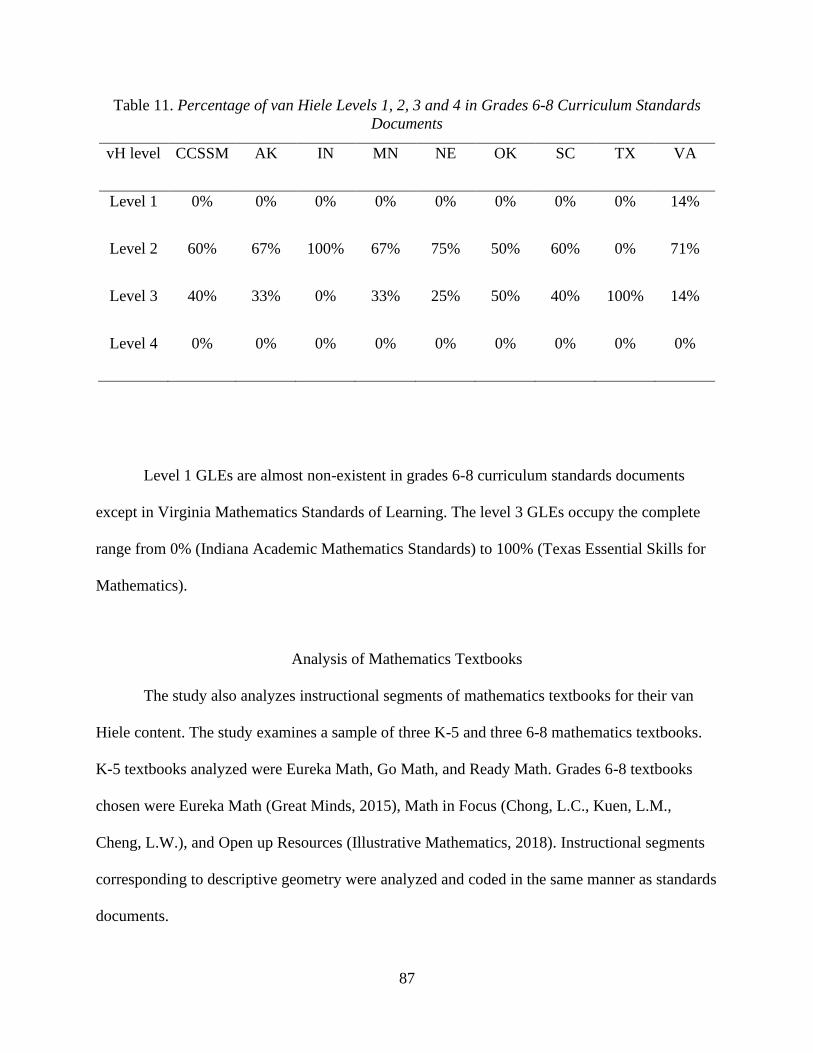
87
Table 11. Percentage of van Hiele Levels 1, 2, 3 and 4 in Grades 6-8 Curriculum Standards
Documents
vH level CCSSM AK IN MN NE OK SC TX VA
Level 1 0% 0% 0% 0% 0% 0% 0% 0% 14%
Level 2 60% 67% 100% 67% 75% 50% 60% 0% 71%
Level 3 40% 33% 0% 33% 25% 50% 40% 100% 14%
Level 4 0% 0% 0% 0% 0% 0% 0% 0% 0%
Level 1 GLEs are almost non-existent in grades 6-8 curriculum standards documents
except in Virginia Mathematics Standards of Learning. The level 3 GLEs occupy the complete
range from 0% (Indiana Academic Mathematics Standards) to 100% (Texas Essential Skills for
Mathematics).
Analysis of Mathematics Textbooks
The study also analyzes instructional segments of mathematics textbooks for their van
Hiele content. The study examines a sample of three K-5 and three 6-8 mathematics textbooks.
K-5 textbooks analyzed were Eureka Math, Go Math, and Ready Math. Grades 6-8 textbooks
chosen were Eureka Math (Great Minds, 2015), Math in Focus (Chong, L.C., Kuen, L.M.,
Cheng, L.W.), and Open up Resources (Illustrative Mathematics, 2018). Instructional segments
corresponding to descriptive geometry were analyzed and coded in the same manner as standards
documents.

88
A total of 380 descriptive geometry instructional segments were found in K-8
mathematics textbooks. Unlike standards documents most textbooks either serve K-5 or grades
6-8. Thus, the analysis of textbooks is done separately for K-5 and 6-8. Tables 12 and 13 list the
percentages of van Hiele levels 1, 2, and 3 instructional segments in K-5 and 6-8 mathematics
textbooks respectively. As can be seen in Table 12, K-5 mathematics textbooks have descriptive
geometry instructional segments that are dominated by levels 1 & 2. However, there are some
van Hiele level 3 tasks that ranged from 8% (Go Math) to 21% (Ready Math). It is interesting to
note that even though curriculum standards documents do not contain any level 4 GLEs because
none demand that students use formal reasoning, all of the grades 6-8 mathematics textbooks
analyzed in this study contained some level 4 instructional segments. level 4 tasks as a
percentage of overall descriptive geometry instructional segments varied from 2% (Math in
Focus) to 15% (Eureka Math). These level 4 tasks in textbooks often appear as challenge
problems that require students to use deductive reasoning from the mathematics they learned
prior. These tasks are perhaps ignored or assigned as a group project. Higher van Hiele level
tasks must be promoted in books and classrooms by teachers to develop a better understanding
for high school geometry. Figure 12 at the end of chapter 3 provides a van Hiele level 4 task
from grade 7 Open up Resources textbook.

89
Table 12. Percentage of van Hiele Levels 1, 2, 3, and 4 Tasks in K-5 Mathematics Textbooks
vH levels Eureka Math Go Math Ready Math
Level 1 33% 45% 32%
Level 2 54% 48% 47%
Level 3 13% 8% 21%
Level 4 0% 0% 0%
Table 13. Percentage of van Hiele Levels 1, 2, 3, and 4 in Grades 6-8 Mathematics Textbooks
vH levels Eureka Math Math in Focus Open up Resources
Level 1 0% 36% 8%
Level 2 49% 51% 72%
Level 3 35% 11% 17%
Level 4 15% 2% 3%

90
van Hiele Analysis of K-5 Mathematics Textbooks
The K-5 mathematics textbooks analyzed were Eureka Math, Go Math, and Ready Math.
Table 14 lists the number of descriptive geometry instructional segments in K-5 textbooks.
Tables 15, 16, and 17 list the percentages of different van Hiele level instructional segments by
grade in Eureka Math, Go Math, and Ready Math respectively.
Table 14. Number of Descriptive Geometry Instructional Segments in K-5 Textbooks
Grade Eureka Math Go Math Ready Math
K 15 23 8
1 14 8 5
2 17 8 4
3 6 9 7
4 22 9 6
5 23 8 4
The number of descriptive geometry instructional segments varied widely at a given
grade in all the textbooks analyzed. Table 14 lists those in the K-5 series of textbooks.

91
Table 15. Number of Different van Hiele Level Instructional Segments by Grade in Eureka Math
(K-5)
Grade Level 1 Level 2 Level 3
K 10 5 0
1 7 5 2
2 5 10 2
3 0 4 2
4 6 13 3
5 1 10 12
The number of instructional segments corresponding to each van Hiele level in Eureka
Math (K-5) series is listed in table 15.

92
Table 16. Number of Different van Hiele Level Instructional Segments by Grade in Go Math
Grade Level 1 Level 2 Level 3
K 14 9 0
1 6 2 0
2 3 5 0
3 3 4 2
4 1 6 2
5 2 5 1
The number of instructional segments corresponding to each van Hiele level in Go Math
(K-5) series is listed in table 16.

93
Table 17. Number of Different van Hiele Level Instructional Segments by Grade in Ready Math
Grade Level 1 Level 2 Level 3
K 5 3 0
1 3 2 0
2 2 2 0
3 1 3 3
4 0 4 2
5 0 2 2
The number of instructional segments corresponding to each van Hiele level in Ready
Math (K-5) series is listed in table 17.
van Hiele Analysis of 6-8 Mathematics Textbooks
The 6-8 textbooks analyzed were Eureka Math, Math in Focus, and Open up Resources.
Table 18 lists the number of descriptive geometry instructional segments in these textbooks.
Tables 19, 20, and 21 list the number of different van Hiele level instructional segments by grade
in Eureka Math (6-8), Math in Focus, and Open up Resources respectively.

94
Table 18. Number of Descriptive Geometry Instructional Segments in 6-8 Textbooks
Grade Eureka Math Math in Focus Open up Resources
6 0 13 10
7 7 23 23
8 58 11 39
The number of instructional segments varied widely between 6-8 mathematics textbooks
and table 18 lists each of them.
Table 19. Number of Different van Hiele Level Instructional Segments by Grade in Eureka Math
(6-8)
Grade Level 1 Level 2 Level 3 Level 4
6 0 0 0 0
7 0 7 0 0
8 0 25 23 10
The number of instructional segments corresponding to various van Hiele levels in
Eureka Math (6-8) is listed in table 19.

95
Table 20. Number of Different van Hiele Level Instructional Segments by Grade in Math in
Focus
Grade Level 1 Level 2 Level 3 Level 4
6 4 8 0 1
7 11 8 4 0
8 2 8 1 0
The number of instructional segments corresponding to various van Hiele levels in Math
in Focus (6-8) is listed in table 20.
Table 21. Number of Different van Hiele Level Instructional Segments by Grade in Open up
Resources
Grade Level 1 Level 2 Level 3 Level 4
6 4 4 2 0
7 2 18 2 1
8 0 30 8 1
The number of instructional segments corresponding to various van Hiele levels in Open
Up Resources (6-8) is listed in table 21.

96
Do more than one van Hiele level occur in the same textbook for the same grade?
As tables 21-25 and 27-29 show, the majority of mathematics textbooks have mixed
different van Hiele levels in the same grade in the same way as did the standards documents
indicating that students switch between levels at the same time depending on the content.
In the following sections K-8 mathematics textbooks are compared against CCSSM
document to observe similarities and differences in the van Hiele levels of their content. The
comparison is done for percentage of van Hiele levels 1, 2, 3, and 4 in the grade bands K-5 and
6-8. While the number of standards at a particular grade was generally not different at each grade
level, the number of instructional segments at a particular grade level differed drastically from
the number of standards at that particular grade level. Thus, a comparison is made between
percentages of different van Hiele levels to gain insight into the agreement of descriptive
geometry content in CCSSM and mathematics textbooks.
Comparison of CCSSM K-5 and K-5 mathematics textbooks
The distribution of van Hiele levels 1, 2, 3, and 4 in K-5 CCSSM document is shown in
Table 18 as 31%, 54%, 15%, and 0% respectively. Table 20 lists the same distribution for K-5
mathematics textbooks. Eureka Math with van Hiele levels 1, 2, 3, and 4 distribution of 33%,
54%, 13%, and 0% was almost similar to the CCSSM document. Go Math’s distribution of 45%,
48%%, 8%, and 0% indicates a higher level 1 and lower level 3 content whereas Ready Math
with a distribution of 32%, 47%, 21%, and 0% had a higher level 3 content than CCSSM. In
conclusion, Eureka Math is very similar to CCSSM, Go Math provides fewer opportunity for
higher level thinking, and Ready Math has greater opportunity to work at higher levels than
CCSSM.

97
Comparison of CCSSM 6-8 and grades 6-8 mathematics textbooks
Table 19 lists the distribution of van Hiele levels 1, 2, 3, and 4 in 6-8 CCSSM document
as 0%, 60%, 40%, and 0% respectively. The same distribution for 6-8 mathematics textbooks is
found in Table 21. Eureka Math with a distribution of 0%, 49%, 35%, and 15% indicates a shift
towards higher van Hiele thinking than the CCSSM document. Math in Focus has a distribution
of 36%, 51%, 11%, and 2% indicating a large proportion of lower level thinking but also has
some level 4 task. In the case of Open up Resources the distribution is 8%, 72%, 17%, and 3%.
In these textbooks, as in Math in Focus, there is a large proportion of levels 1 and 2 instructional
segments but some opportunity for level 4 thinking exist.
The comparison of 6-8 mathematics textbooks with CCSSM document reveals that
textbooks generally work at lower van Hiele levels than CCSSM but do include level 4 thinking
which is not found in CCSSM. An example of a level 4 task from Open up Resources is provided
below in Fig 30.
Figs 22-27 present the distribution of descriptive geometry instructional segments in each
of the textbooks analyzed. In contrast with the curriculum documents, all grades 6-8 mathematics
textbooks analyzed do have Level 4 instructional segments. They generally appear as
challenging problems that require formal deduction from geometric content learned earlier. In
this regard those textbooks have gone beyond the curriculum documents in providing
opportunity in K-8 to raise students’ van Hiele Levels. Fig 30 shows one such exercise from
Open Up Resources grade 7.
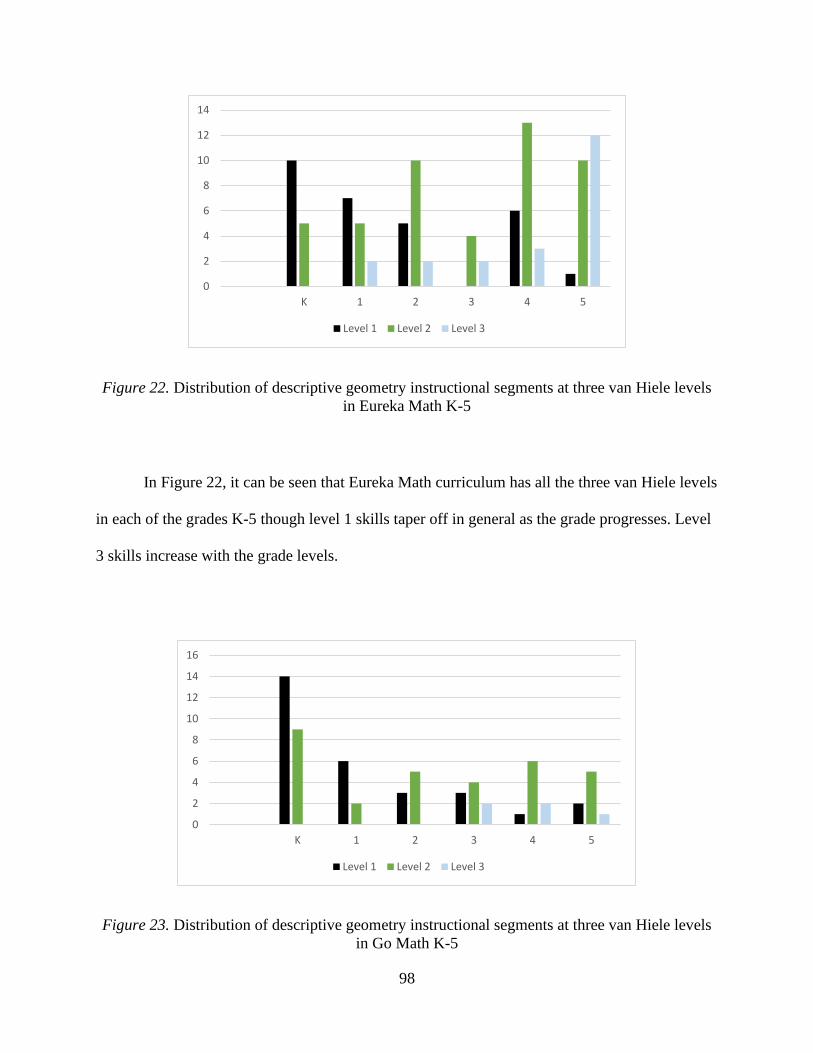
98
Figure 22. Distribution of descriptive geometry instructional segments at three van Hiele levels
in Eureka Math K-5
In Figure 22, it can be seen that Eureka Math curriculum has all the three van Hiele levels
in each of the grades K-5 though level 1 skills taper off in general as the grade progresses. Level
3 skills increase with the grade levels.
Figure 23. Distribution of descriptive geometry instructional segments at three van Hiele levels
in Go Math K-5
0
2
4
6
8
10
12
14
K 1 2 3 4 5
Level 1 Level 2 Level 3
0
2
4
6
8
10
12
14
16
K 1 2 3 4 5
Level 1 Level 2 Level 3
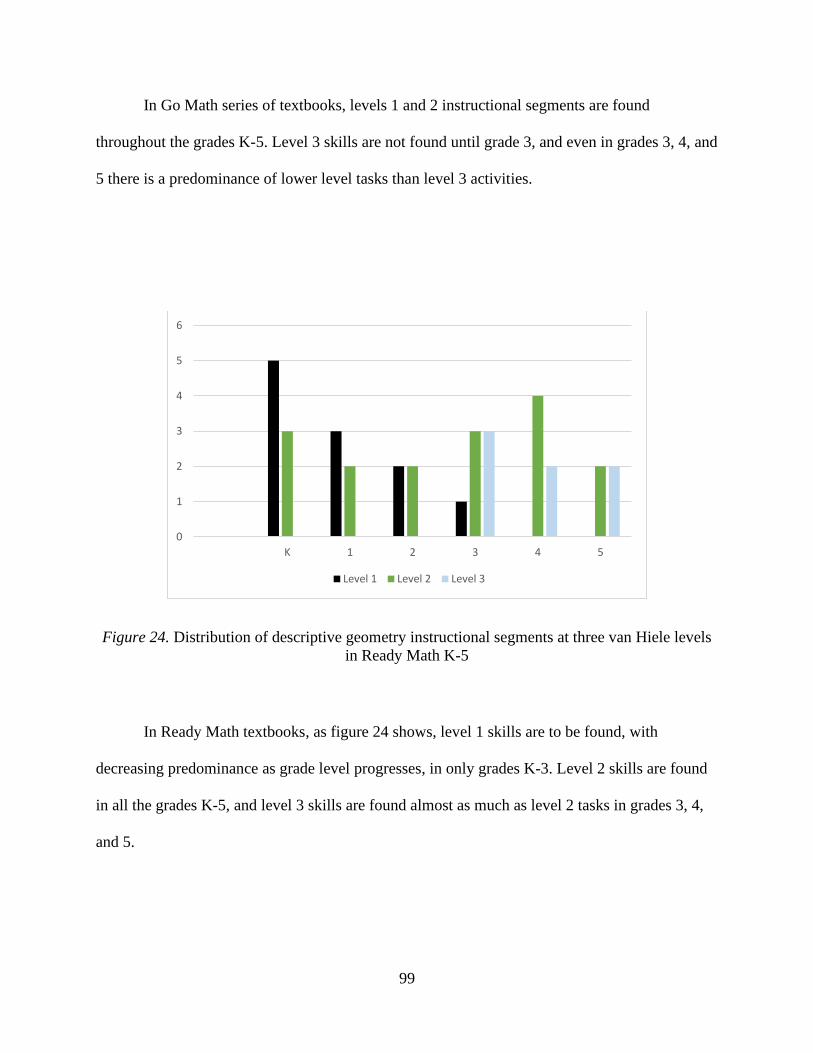
99
In Go Math series of textbooks, levels 1 and 2 instructional segments are found
throughout the grades K-5. Level 3 skills are not found until grade 3, and even in grades 3, 4, and
5 there is a predominance of lower level tasks than level 3 activities.
Figure 24. Distribution of descriptive geometry instructional segments at three van Hiele levels
in Ready Math K-5
In Ready Math textbooks, as figure 24 shows, level 1 skills are to be found, with
decreasing predominance as grade level progresses, in only grades K-3. Level 2 skills are found
in all the grades K-5, and level 3 skills are found almost as much as level 2 tasks in grades 3, 4,
and 5.
0
1
2
3
4
5
6
K 1 2 3 4 5
Level 1 Level 2 Level 3

100
Figure 25. Distribution of descriptive geometry instructional segments at four van Hiele levels in
Eureka Math 6-8
Figure 25 shows that in Eureka Math grades 6-8 there are no level 1 tasks. There were no
descriptive geometry segments in grade 6 (this is expected, since CCSSM document has 0
descriptive geometry GLEs in grade 6, and Eureka Math is based on CCSSM). There are some
level 2 tasks in grade 7, and grade 8 has vast majority of descriptive geometry activities that
included van Hiele levels 2, 3, and 4.
0
5
10
15
20
25
30
Level 1 Level 2 Level 3 Level 4
6 7 8

101
Figure 26. Distribution of descriptive geometry instructional segments at four van Hiele levels in
Math in Focus 6-8
Figure 26 shows the van Hiele levels in Math in Focus textbooks. In Series 2 (for grade
6) van Hiele levels 1, 2, and 4 are found. For Series 3 and 4 (for grades 7 and 8) van Hiele levels
1,2, and 3 are found. It must be noted that more than one van Hiele level is found in a given
grade, and sometimes higher van Hiele levels could be found in lower grades.
Figure 27. Distribution of descriptive geometry instructional segments at four van Hiele levels in
Open Up Resources 6-8
0
2
4
6
8
10
12
Math inFocus
Level 1 Level 2 Level 3 Level 4
0
5
10
15
20
25
30
35
OpenupResources
Level 1 Level 2 Level 3 Level 4
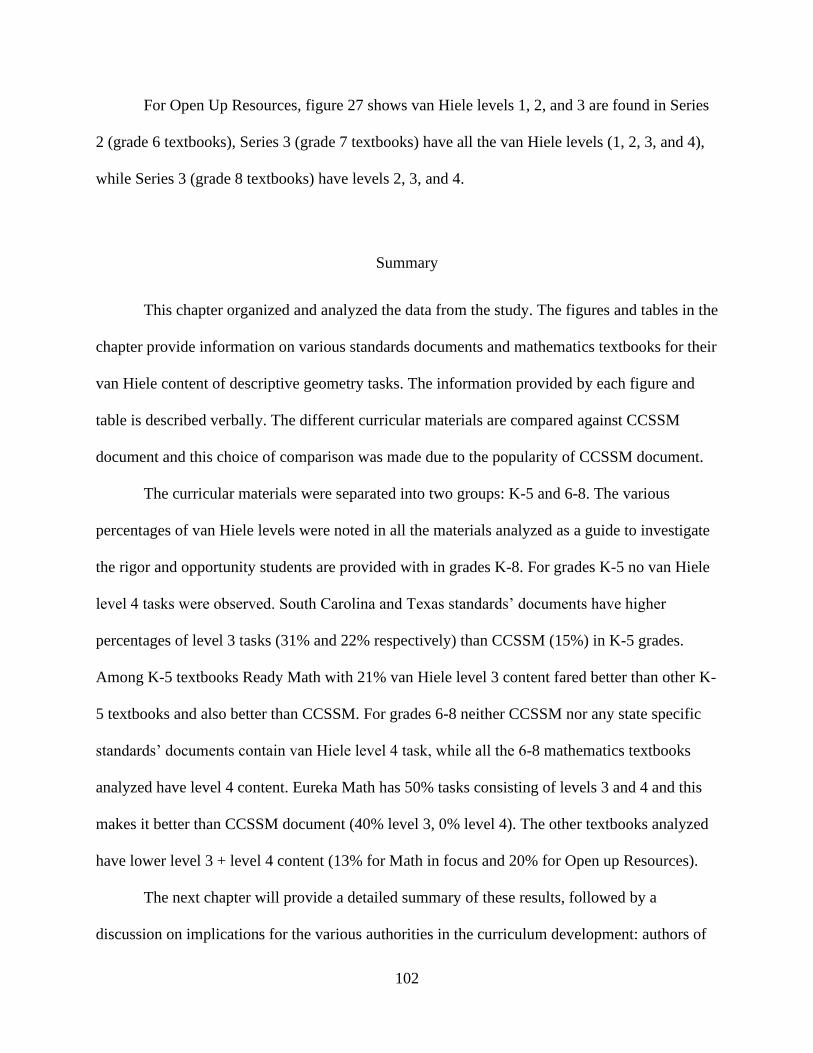
102
For Open Up Resources, figure 27 shows van Hiele levels 1, 2, and 3 are found in Series
2 (grade 6 textbooks), Series 3 (grade 7 textbooks) have all the van Hiele levels (1, 2, 3, and 4),
while Series 3 (grade 8 textbooks) have levels 2, 3, and 4.
Summary
This chapter organized and analyzed the data from the study. The figures and tables in the
chapter provide information on various standards documents and mathematics textbooks for their
van Hiele content of descriptive geometry tasks. The information provided by each figure and
table is described verbally. The different curricular materials are compared against CCSSM
document and this choice of comparison was made due to the popularity of CCSSM document.
The curricular materials were separated into two groups: K-5 and 6-8. The various
percentages of van Hiele levels were noted in all the materials analyzed as a guide to investigate
the rigor and opportunity students are provided with in grades K-8. For grades K-5 no van Hiele
level 4 tasks were observed. South Carolina and Texas standards’ documents have higher
percentages of level 3 tasks (31% and 22% respectively) than CCSSM (15%) in K-5 grades.
Among K-5 textbooks Ready Math with 21% van Hiele level 3 content fared better than other K-
5 textbooks and also better than CCSSM. For grades 6-8 neither CCSSM nor any state specific
standards’ documents contain van Hiele level 4 task, while all the 6-8 mathematics textbooks
analyzed have level 4 content. Eureka Math has 50% tasks consisting of levels 3 and 4 and this
makes it better than CCSSM document (40% level 3, 0% level 4). The other textbooks analyzed
have lower level 3 + level 4 content (13% for Math in focus and 20% for Open up Resources).
The next chapter will provide a detailed summary of these results, followed by a
discussion on implications for the various authorities in the curriculum development: authors of

103
standards’ documents and textbooks, publishers of textbooks, classroom teachers, etc. Directions
for further research and limitations of the study will be discussed as well.

104
CHAPTER 5
SUMMARY, DISCUSSION, AND RECOMMENDATIONS
The purpose of this study was to investigate the extent to which K-8 curriculum
documents and mathematics textbooks address the geometry needs of students in order to
prepare for high school geometry. The foundation for this study was provided by van Hiele
theory which focuses on the geometric thinking of adolescents. The van Hiele theory specifies
various levels students have to pass through before they can be proficient in the formal aspects of
high school geometry. Researchers claim that “helping children move through these levels may
be taken as a critical educational goal” (Clements et al., 1999, p.193). The main argument
stemming from van Hiele theory is that elementary and middle grades students need ample level
3 opportunity to succeed later in high school geometry. The current literature on van Hiele
research establishes a close connection with high school geometry accomplishments. This
dissertation focusses on the opportunity K-8 students have to develop higher van Hiele levels.
The study simultaneously addressed the agreement of various curricular materials to support
teachers and learners of K-8 geometry. The curriculum standards documents analyzed were
CCSSM (the most popular, adopted by 42 states and District of Columbia), and standards
documents from the remaining eight non-CCSSM states (Alaska, Indiana, Minnesota, Nebraska,
Oklahoma, South Carolina, Texas, and Virginia). The mathematics textbooks analyzed were in
two categories: a set of K-5 curricular materials comprised of Eureka Math, Go Math, and Ready
Math, and a set of 6-8 curricular materials consisting of Eureka Math, Math in Focus, and Open
Up Resources. This chapter presents a summary of the study and discusses the findings in
relation to the research questions and related literature. Limitations of this study, as well as
recommendations for future research are also presented.

105
Summary of Results and Key Findings
Data from the study illustrate the extent to which curricular materials incorporate
descriptive geometry tasks that could be assigned van Hiele levels, although different curricula
had different proportions of each of the van Hiele levels 1, 2, 3, and 4. This section will detail the
proportions of GLEs in CCSSM and non-CCSSM documents with the aim of comparing non-
CCSSM documents against the more popular CCSSM document. Since textbooks play a
significant role in the instruction, each of the K-5 and 6-8 textbooks series are also analyzed for
the proportion of each of the van Hiele instructional segments. With CCSSM document as a
yardstick each of the textbooks is analyzed for its rigor, which eventually provides opportunity to
develop formal thinking. Since textbook series are designed for either grades K-5 or 6-8,
CCSSM document is studied separately for these grade bands. Also, the number of GLEs in
standards documents and the number of instructional segments in mathematics textbooks vary
considerably, the study looks at the proportions of different van Hiele levels in these grade
bands.
Grades 6-8 textbooks sometimes included level 4 instructional segments. In general, in
both standards documents and mathematics textbooks, it was observed that level 1 skills
dominated elementary grades, level 2 skills were mostly found in upper elementary, and level 3
skills were predominantly found in middle grades. Despite this overall trend, curriculum
standards’ documents and K-8 mathematics textbooks vary substantially with respect to the van
Hiele levels apparent at specific grade levels. With such support for van Hiele theory, it must be
mentioned that curricular materials that have higher proportions of higher-level van Hiele tasks
must be taken as a model and those with greater percentages of lower level tasks must seek to
improve. The general thrust of the van Hiele theory is that geometric thinking is sequential. The
106
implication of this is that there must be lower level van Hiele tasks in lower grades, but there
must be movement towards higher levels during the K-8 years, especially given the fact that high
school geometry demands formal thinking. Research on geometry teaching and learning in the
past years has not demonstrated promise (Usiskin, 1987; Senk, 1985). The reason stated was that
many students were not learning even the simplest geometry notions in junior high school
(Usiskin, 1982). However, both curriculum standards’ documents and mathematics textbooks
analyzed in this study each increase in van Hiele levels as the grade progresses. Multiple van
Hiele level GLEs at the same grade level were found in both curriculum standards documents
and instructional segments in K-8 mathematics textbooks. These observations indicate that
students shift between different levels of thought as they navigate through the concepts of
geometry. As pointed out earlier, a student at van Hiele level 3 for a familiar concept might
revert back to level 1 thinking for a new concept in descriptive geometry. Thus, curricular
materials were found to have a healthy mix of van Hiele levels. If the enacted curriculum in the
classroom is in the spirit of these curricular materials, both standards documents and
mathematics textbooks, there is hope that students in the future will learn high school geometry
better. Levels 1 & 2 focus on the shapes and properties of geometric figures. These concepts
certainly must be mastered, but the process of deduction begins informally as level 3 thinking,
and research indicates greater facility at tasks on these levels leads to the success in proof writing
(Usiskin, 1982; Hoffer, 1983). There are four different types of van Hiele level 3 thinking:
• Hierarchical nature of geometric figures
• Relationships between properties of figures
• Definitions of geometric shapes
• Experiences with proof

107
Standards documents and mathematics textbooks of this study have included each of these
types of level 3 thinking, but not every textbook series included all of them. Either due to lack of
consensus between curriculum documents, or due to different documents focusing on different
issues, van Hiele level 3 tasks belonging to different categories can be found throughout the
curricular materials. It might seem even more promising that all the 6-8 mathematics textbooks
studied required level 4 thinking. However, it is also possible to lower the van Hiele level by rote
memorization and tricks that prevent students from moving to the subsequent level of reasoning
(van Hiele, 1986). van Hiele claimed that the “crisis of thinking” is essential for true
understanding, but in more difficult geometry problems, often the teachers and learners simplify
the mathematics by shortcuts. These approaches hinder the development of thinking and it is
generally not possible to determine if the learners are able to rise when the curricular materials
aim higher.
Summary of van Hiele Levels in K-5 Standards
CCSSM has a distribution of 31%, 54%, and 15% levels 1, 2, and 3 GLEs. Alaska has the
same distribution as CCSSM, while Indiana’s distribution is quite similar (33%, 50%, and 17%).
Minnesota and Oklahoma had 0% level 3 GLEs in grades K-5 while South Carolina had
significantly higher percentage of level 3 GLEs (31%) than CCSSM. Texas had a little higher
percentage of level 3 GLEs (22%), while Nebraska and Virginia had a little lower percentage of
level 3 GLEs (11% and 10% respectively) than CCSSM (see Table 3). As can be seen from the
various distributions there could be wide variations in the opportunity students will have in
different states for learning geometry. The more popular CCSSM document has 15% level 3
skills; against this reference South Carolina and Texas standards documents provide greater

108
opportunity while Minnesota and Oklahoma provide fewer opportunity for formal thinking in
grades K-5.
Summary of van Hiele Levels in 6-8 Standards
The distribution of levels 1, 2, and 3 GLEs in CCSSM grades 6-8 was 0%, 60%, and
40%. South Carolina has the identical distribution while Indiana with a distribution of 0%,
100%, and 0%, and Texas with a distribution of 0%, 0%, and 100% for levels 1, 2, and 3 GLEs
differed drastically. Alaska and Minnesota with distributions of 0%, 67%, and 33% for levels 1,
2, and 3 GLEs respectively were similar to CCSSM while Nebraska (0%, 75%, and 25%),
Oklahoma (0%, 50%, and 50%), and Virginia (14%, 71%, and 14%) were significantly different
from CCSSM. Similar to the comments on K-5 summary there is a wide variation in the
opportunity for learning geometry in grades 6-8. Texas with 100% of its 6-8 standards at van
Hiele level 3 provides the most opportunity for formal thinking while each of the other non-
CCSSM documents have fewer proportion of level 3 skills.
Agreement Between CCSSM and Mathematics Textbooks for Grades K-5
For grades K-5, CCSSM GLEs had the distribution of 31%, 54%, and 15% for levels 1,
2, and 3 GLEs. Eureka Math had a very similar distribution of 33%, 54%, and 13% instructional
segments. This is expected since the Eureka Math curriculum is based on CCSSM. Go Math has
a distribution of 45%, 48%, and 8% while the Ready Math curriculum has a distribution of 32%,
47%, and 21% for levels 1, 2, and 3 instructional segments. Thus, Go Math has lower proportion
of level 3 skills while Ready Math has higher proportions of level 3 tasks than CCSSM in grades
K-5.

109
Agreement Between CCSSM and Mathematics Textbooks for Grades 6-8
For grades 6-8, CCSSM GLEs has the distribution of 0%, 60%, and 40%. There are no
GLEs at level 4. However, Eureka Math has a distribution of 0%, 51%, 47%, and 2% for levels
1, 2, 3, and 4 instructional segments. It is interesting that the Eureka Math curriculum, though
based on CCSSM, has higher proportions of higher-level instructional segments than the
proportions of GLEs in CCSSM. The corresponding distribution for levels 1, 2, 3, and 4
instructional segments in Math in Focus is 36%, 51%, 11%, and 2% and that for Open Up
Resources was 8%, 72%, 17%, and 3%. Although both Math in Focus and Open Up Resources
have a very high proportion (80% or more) of levels 1 and 2 tasks, they also include some level 4
skills.
Implications of the Study
In this study the agreement between various curricular materials was studied. Curriculum
documents written for the entire state, and mathematics textbooks for grades K-8 were analyzed.
The most popular curriculum standards document CCSSM (adopted by 42 states and the District
of Columbia) was compared with the remaining 8 state specific standards documents for their
agreement with regards to the van Hiele levels in their descriptive geometry standards. K-5 and
6-8 mathematics textbooks that were accessible to the study were consulted and descriptive
geometry instructional segments within these books were compared against CCSSM for their
agreement of van Hiele levels. The results of the study are detailed in the summary of this study.
The research supporting van Hiele theory (Usiskin, 1982; Fuys et al., 1988) promote curricular
materials with higher proportions of higher-level tasks. In this respect, South Carolina and
Texas’ curriculum standards documents have greater percentage of level 3 GLEs than CCSSM
110
document in grades K-8 while Ready Math curriculum for grades K-5, and Eureka Math
curriculum for grades 6-8 have more percent instructional segments than those of CCSSM GLEs
in these grades. CCSSM document is the most popular document and this study has some
implications on its content. Since South Carolina and Texas’ documents provide greater
opportunity for formal thinking in geometry the authors of CCSSM could look into bringing
some changes in their descriptive geometry content in the next edition using the two states’
documents as a model. Similarly, the other six states that provide fewer opportunity in their K-8
documents might consider reevaluating their documents’ content in subsequent editions. Similar
arguments could be made about textbooks in the study: Ready Math, with its 21% instructional
segments on level 3 tasks might be referenced as a model for K-5 textbooks since this textbook
provides more opportunity in K-5 than any other K-5 textbook of this study. Eureka Math, with
50% of its grades 6-8 descriptive geometry content at levels 3 and 4 provide more opportunity
than any other textbook of the study for formal thinking.
Finally, it is up to the classroom teachers to implement and ensure that their students get
the opportunity their curricular materials (standards’ documents and mathematics textbooks)
provide. Especially in grades 6-8 there are ample opportunity for level 4 thinking in Eureka
Math, and if teachers can tap into those instructional segments their students will have a better
understanding of the formal aspects of high school geometry.
Limitations of the Study
The number of textbooks and other curricular materials that were analyzed in this study
was relatively small. Against this background, it is prudent to acknowledge the fact that the
findings might, perhaps, be altered if a larger sample of elementary and middle grades textbooks

111
is used. The textbooks that were examined are popular mathematics textbooks series of K-8 that
were readily available for the analysis. Consequently, any attempt to extend the results beyond
these textbooks has to be done with caution.
Also, the study did not interview individuals who were involved in the development of
the selected K-8 mathematics textbooks, or teachers and students who enact and learn from these
curricular materials about their perspectives on the presentation and development towards higher
van Hiele levels in the textbooks. Research suggests that some teachers strictly adhere to the
textbook for planning and instruction, while others use it as a guide to spur their own planning
(see Remillard’s work). The fidelity to which teachers implement the textbook as written has a
considerable impact on what students have the opportunity to learn, and thus can greatly
influence the level of thinking students must use in solving geometry problems. Obtaining data
on how teachers use these textbooks could add some valuable insight, and hence, the non-
availability of such data is another limitation to this study.
It must be noted that both curriculum standards’ documents and mathematics textbooks
undergo revisions and hence change rapidly. States continually review and revise their standards
and GLEs, often over periods of 6-10 years (Reys and Lappan, 2006). While changes in GLEs in
curriculum documents are not noticeable, the combination of a revised document and revised
textbook series might alter the results of a similar study significantly in the future.
Another limitation of the study is the difficulty in determining the alignment between
textbooks and content standards or GLEs focused on conceptual ideas. Learning expectations
such as “Understand that attributes belonging to a category of two-dimensional figures also
belong to all subcategories of that category” represent ideas that are important in developing an
understanding of students’ overall knowledge of plane geometry in general, and of two-

112
dimensional figures in particular, yet are difficult to measure for teachers and researchers looking
at curriculum materials that are focused on student outcomes.
Finally, the van Hiele theory is in no way limited to average students without any special
needs. Students with special needs are quite capable of learning, provided that the material is
tailored to their particular needs (Mason, 1995). Neither the curriculum standards’ documents
nor K-8 mathematics textbooks were studied with a focus on special education. Another study
that can incorporate the support for special education within these curricular materials might
display a different trend. The study looked for the minimum level of thought needed to
accomplish a given task. However, it’s possible that some students might be able to reason at
higher levels, but still need foundational knowledge. Mason (1997) worked with mathematically
talented students in grades 6-8. She found that about a third of students skipped van Hiele levels.
Many of them had not been exposed to or did not remember the essential defining attributes of
various figures; however, they looked for similarities and differences in figures and deduced
what the defining attributes might be. This study would have marked these students or the tasks
they are working on at higher van Hiele levels, but in the spirit of the van Hiele theory, these
aspects won’t fit the model and hence should be coded as “no level”. This ambiguity in the
decision of no level vs higher level puts another limitation to the study.
Directions for Further Research
As mentioned previously, the curricular materials involved were state specific curriculum
standards documents and a convenient sample of K-8 mathematics textbooks. The analysis of
curriculum documents was done thoroughly by a group of three researchers, and those ideas
were translated for the analysis of mathematics textbooks. The study did not address the teaching

113
phases of Dina van Hiele-Geldof. Research on the pedagogical aspects of raising van Hiele
levels could be a great supplement to that of the content in standards’ documents and
mathematics textbooks. The results of the study shed light on some differences in both kinds of
curricular materials. It would be interesting to see research on the achievements of states that
differ significantly from CCSSM document for its van Hiele levels. For example, the Minnesota
K-12 Academic Standards in Mathematics, and the Oklahoma Academic Standards for
Mathematics included only one Level 3 standard in grades K-8. If van Hiele theory urges more
level 3 opportunity in K-8 for success in high school geometry, it would be interesting to study
the performance achievements of high school geometry in these states. If the students’ scores in
these states are lower than in states that use standards with more Level 3 opportunity, then a call
could be made to include more Level 3 tasks in their documents. If, on the other hand, Minnesota
and Oklahoma high school geometry students perform on par or better than the rest of the United
States then that might raise some questions on van Hiele theory. Similarly, school districts that
use mathematics textbooks with large number of Level 3 and Level 4 tasks could be studied
closely for their high school geometry achievements. As noted in Chapter 4 of this study, Ready
Math has significantly higher percentage of Level 3 instructional segments (21%) in the K-5
grades, and Eureka Math similarly has strikingly large percentage of Level 3 and Level 4
instructional segments (50%) in 6-8 grade range. If an organized study is conducted that can
track the students’ high school geometry achievement who followed these textbooks in their K-8
grades, then that might provide some insight into the effectiveness of van Hiele theory in
mathematics textbooks.
114
Conclusion
The study examined K-8 curricular materials (standards documents and mathematics
textbooks) for the learning opportunity they provide students to develop formal thought
processes needed for high school geometry. The basis for the study is van Hiele theory
developed by the Dutch researchers Dina van Hiele-Geldof, and Pierre van Hiele. The theory
establishes a pathway to attain readiness for formal thinking. It is both descriptive and
prescriptive in the sense it announces the existence of sequential levels through which each
student must pass through to attain sophistication needed for a formal high school geometry
course. The theory also lays the groundwork for elevating students’ levels but that part was not
considered in this study. The geometric knowledge acquired by a student, though depends on
several factors, there are universal curriculum standards documents and mathematics textbooks
that play a significant role in the development of formal thinking. With this idea, the most
popular CCSSM document was examined, as well as the other non-CCSSM documents were
studied for comparison. Readily available sources of K-5 and 6-8 textbooks were studied for
their van Hiele content with the idea of comparing them against the opportunity provided by
CCSSM. The results were tabulated and analysis was done. Implications for curriculum
designers, textbook publishers, and classroom teachers were made, and limitations of the study
were described. This led to the directions for future related research.

115
REFERENCES
Battista, M.T., & Clements, D. H. (1988). A case for a Logo-based elementary school
geometry curriculum. Arithmetic Teacher, 36, 11-17.
Battista, M.T., Clements, D.H. (1995). Geometry and Proof. The Mathematics Teacher, 88(1),
48-54.
Begle, E.G. (1973). Some lessons learned by SMSG. The Mathematics Teacher, 66(3), pp.
207-214.
Bell, A. W. (1976). A study of pupils’ proof-explanations in mathematical situations.
Educational Studies in Mathematics, 7, 23-40.
Braswell, J. S., Lutkas, A.D., Grigg, W.S., Santapau, S.L., Tay-Lim, B.S., & Johnson, M.S.
(2001). Nation’s report card mathematics 2000. Jessup, MD: U.S. Department of
Education.
Burger W.F., & Shaughnessy J.M. (1986). Characterizing the van Hiele levels of development
in geometry. Journal for Research in Mathematics Education, 17, 31-48.
Carpenter, T.P., Corbitt, M.K., Kepner, H.S., Lindquist, M.M., & Reys, R.E. (1980). Results of
the second National Assessment of Educational Progress mathematics assessment:
Secondary school. Mathematics Teacher, 73, 329- 338.
Chong, L. C. Kuen, L.M., & Cheng, L.W. (2013). Math in Focus Singapore Math by
Marshall Cavendish, Course 2A.
Chong, L. C. Kuen, L.M., & Cheng, L.W. (2013). Math in Focus Singapore Math by
Marshall Cavendish, Course 2B.
Chong, L. C. Kuen, L.M., & Cheng, L.W. (2013). Math in Focus Singapore Math by
Marshall Cavendish, Course 2C.
Clements, D. H., & Battista, M.T. (1989). Learning of geometry concepts in a Logo
environment. Journal for Research in Mathematics Education, 21, 356-371.
Clements, D. H., Battista, M. T., Sarama, J., & Swaminathan, S. (1996). Development of turn by
turn measurement concepts in a computer-based instructional unit. Educational Studies
in Mathematics, 30, 313-337.
Clements, D. H., Sarama, J., & Battista, M. T (1996). Development of turn by turn
measurement concepts in a computer-based instructional unit. In E. Jakubowski, D.
Watkins, & H. Biske (Eds.), Proceedings of the Eighteenth Annual Meeting of the North
America Chapter of the International Group for the Psychology of Mathematics
Education (Vol 2, pp. 547-552). Columbus, OH: ERIC Clearinghouse for Science,
Mathematics, and Environmental Education.

116
Clements, D. H., Battista, M. T., Sarama, J., Swaminathan, S., & McMillen, S. (1997).
Students’ development of length measurement concepts in a Logo-based unit on
geometric paths. Journal for Research in Mathematics Education, 28(1), 70-95.
Clements, D. H., Sarama, J., & Battista, M. T. (1998). Development of concepts of
geometric figures in a specially designed Logo computer environment. Focus on
Learning Problems in Mathematics, 20, 47-64.
Clements D, H. (1999). Geometric and spatial thinking in young children. In J.V. Copley (Ed.),
Mathematics in the early years (pp.66-79). Reston, VA: National Council of
Teachers of Mathematics.
Clements D, H. (2003). Teaching and learning geometry. In J. Kilpatrick (Ed.) A research
companion to principles and standards for school mathematics (pp. 151-178). Reston,
VA: National Council of Teachers of Mathematics.
Clements, D. H., & Battista, M.T. (1992a). The development of a LOGO-based elementary
school geometry curriculum. Buffalo: State University of New York at Buffalo and
Kent, OH: Kent State University.
Clements, D, H., & Battista, M, T. (1992b). Geometry and spatial reasoning. In D. A.
Grouws (Ed.), Handbook of research on mathematics teaching and learning (pp.
420-464), New York: Macmillan.
Clements, D, H. (1999). Geometric and spatial thinking in young children. In J. V. Copley (Ed.),
Mathematics in the early years (pp. 66-79). Reston, VA: National Council of Teachers
of Mathematics.
Clements D, H., Swaminathan, S., Hannibal M. A. Z., & Sarama, J. (1999). Young
children’s concepts of shape. Journal for Research in Mathematics Education, 30, 192-
212.
Common Core State Standards for Mathematics. (2010). Retrieved from
http://www.corestandards.org/assets/CCSSI_Math%20Standards.pdf
Conley, D. T., Drummond, K. V., de Gonzalez, A., Seburn, M., Stout, O., & Rooseboom, J.
(2011). Lining up: The relationship between the Common Core State Standards and
five sets of comparison standards. Eugene, OR: Educational Policy Improvement Center.
Crowley, M. (1987). The van Hiele model of the development of geometric thought. In M.
Lindquist (Ed.), Learning and teaching geometry, K-12 (pp. 1-16). Reston, VA:
National Council of Teachers of Mathematics.
Curriculum Associates (2018). Ready Math. Grade K.
Curriculum Associates (2018). Ready Math. Grade 1.
Curriculum Associates (2018). Ready Math. Grade 2.
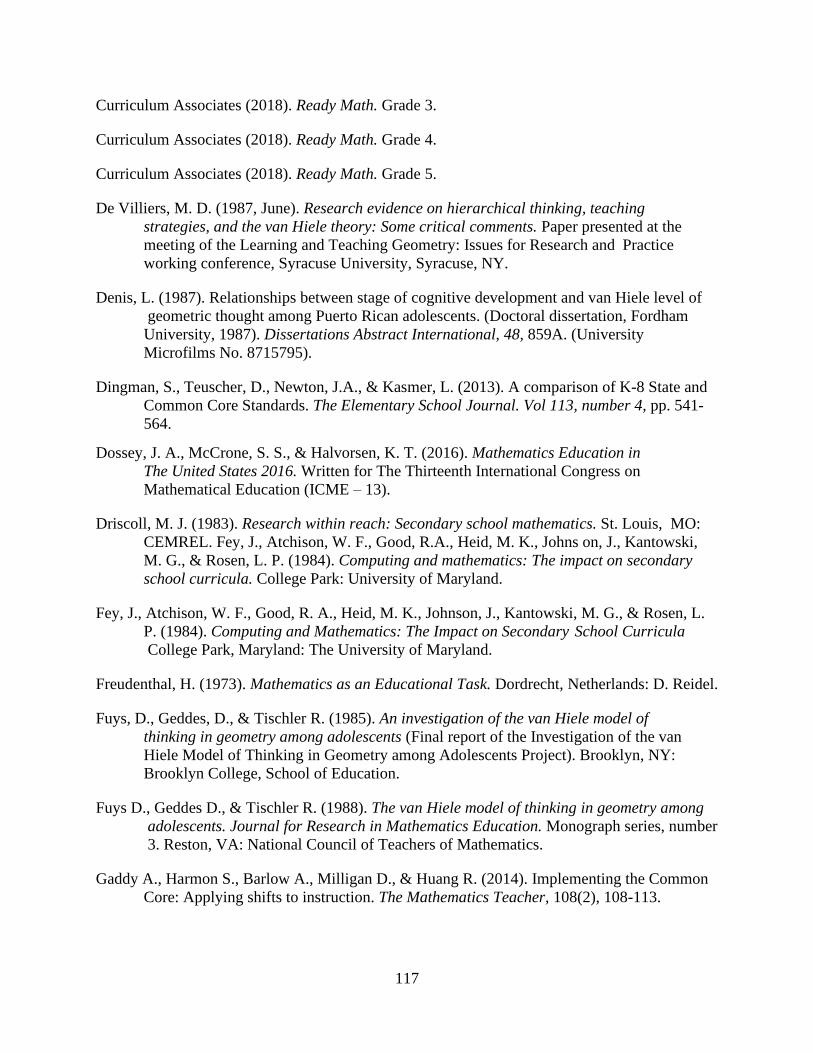
117
Curriculum Associates (2018). Ready Math. Grade 3.
Curriculum Associates (2018). Ready Math. Grade 4.
Curriculum Associates (2018). Ready Math. Grade 5.
De Villiers, M. D. (1987, June). Research evidence on hierarchical thinking, teaching
strategies, and the van Hiele theory: Some critical comments. Paper presented at the
meeting of the Learning and Teaching Geometry: Issues for Research and Practice
working conference, Syracuse University, Syracuse, NY.
Denis, L. (1987). Relationships between stage of cognitive development and van Hiele level of
geometric thought among Puerto Rican adolescents. (Doctoral dissertation, Fordham
University, 1987). Dissertations Abstract International, 48, 859A. (University
Microfilms No. 8715795).
Dingman, S., Teuscher, D., Newton, J.A., & Kasmer, L. (2013). A comparison of K-8 State and
Common Core Standards. The Elementary School Journal. Vol 113, number 4, pp. 541-
564.
Dossey, J. A., McCrone, S. S., & Halvorsen, K. T. (2016). Mathematics Education in
The United States 2016. Written for The Thirteenth International Congress on
Mathematical Education (ICME – 13).
Driscoll, M. J. (1983). Research within reach: Secondary school mathematics. St. Louis, MO:
CEMREL. Fey, J., Atchison, W. F., Good, R.A., Heid, M. K., Johns on, J., Kantowski,
M. G., & Rosen, L. P. (1984). Computing and mathematics: The impact on secondary
school curricula. College Park: University of Maryland.
Fey, J., Atchison, W. F., Good, R. A., Heid, M. K., Johnson, J., Kantowski, M. G., & Rosen, L.
P. (1984). Computing and Mathematics: The Impact on Secondary School Curricula
College Park, Maryland: The University of Maryland.
Freudenthal, H. (1973). Mathematics as an Educational Task. Dordrecht, Netherlands: D. Reidel.
Fuys, D., Geddes, D., & Tischler R. (1985). An investigation of the van Hiele model of
thinking in geometry among adolescents (Final report of the Investigation of the van
Hiele Model of Thinking in Geometry among Adolescents Project). Brooklyn, NY:
Brooklyn College, School of Education.
Fuys D., Geddes D., & Tischler R. (1988). The van Hiele model of thinking in geometry among
adolescents. Journal for Research in Mathematics Education. Monograph series, number
3. Reston, VA: National Council of Teachers of Mathematics.
Gaddy A., Harmon S., Barlow A., Milligan D., & Huang R. (2014). Implementing the Common
Core: Applying shifts to instruction. The Mathematics Teacher, 108(2), 108-113.

118
Genkins, E. F. (1975). The concept of bilateral symmetry in young children. In M. F.
Rosskopf (Ed.), Children’s mathematical concepts: Six Piagetian studies in
mathematics education (pp. 5-43). New York: Teachers College Press.
Govender, R., & de Villiers, M. (2002, July). Constructive evaluations of definition in a
sketchpad context. Paper presented at the meeting of the Association for Mathematics
Education of South Africa, Durban, South Africa.
Great Minds. (2015). New York State Common Core Mathematics Curriculum. Grade K,
Module 2. Eureka Math
Great Minds. (2015). New York State Common Core Mathematics Curriculum. Grade 1,
Module 5. Eureka Math
Great Minds. (2015). New York State Common Core Mathematics Curriculum. Grade 2,
Module 8. Eureka Math
Great Minds. (2015). New York State Common Core Mathematics Curriculum. Grade 3,
Module 7. Eureka Math
Great Minds. (2015). New York State Common Core Mathematics Curriculum. Grade 4,
Module 4. Eureka Math
Great Minds. (2015). New York State Common Core Mathematics Curriculum. Grade 5,
Module 5. Eureka Math
Great Minds. (2015). New York State Common Core Mathematics Curriculum. Grade 7,
Module 6. Eureka Math
Great Minds. (2015). New York State Common Core Mathematics Curriculum. Grade 8,
Module 2. Eureka Math
Great Minds. (2015). New York State Common Core Mathematics Curriculum. Grade 8,
Module 3. Eureka Math
Great Minds. (2015). New York State Common Core Mathematics Curriculum. Grade 8,
Module 7. Eureka Math
Grouws, D.A., & Smith, M.S. (2000). Findings from NAEP on the preparation and
practices of Mathematics teachers. In E.A. Silver & P.A. Kenney (Eds.), Results from the
Seventh Mathematics Assessment of the National Assessment of Education Progress (pp.
107-141). Reston, VA: National Council of Teachers of Mathematics.
Gutierrez, A. (1996). Visualization in 3-dimensional geometry: In search of a framework.
In L. Puig & A. Gutierrez (Eds.), Proceedings of the twentieth annual meeting of the
International Group for the Psychology of Mathematics Education, Vol 1 (pp. 3-19).
Valencia, Spain: Universidad de Valencia.

119
Gutirrez A., Jaime A. (1988). Globality versus locality of the van Hiele levels of geometric
reasoning. Unpublished manuscript, Universitat De Valencia, Valencia, Spain.
Gutirrez A., Jaime A., & Fortuny J. M. (1991). An alternative paradigm to evaluate the
acquisition of the van Hiele levels. Journal for Research in Mathematics Education, 22,
237-251.
Han, T. –S. (1986). The effects on achievement and attitude of a standard geometry
textbook consistent with the van Hiele theory. Dissertation Abstract International,
47, 3690A. (University Microfilms No. DA 8628106).
Hannafin, R. D., & Sullivan, H. J. (1996). Preferences and learner control over amount of
instruction. Journal of Educational Psychology, 88, 162-173.
Hoffer, A. (1979). Geometry (Teacher’s Ed.). Reading, MA: Addison-Wesley.
Hoffer, A. (1981). Geometry is more than proof. Mathematics Teacher, 74, 11-18.
Hoffer, A. (1983). Van Hiele-based research. In R. Lesh & M. Landau (Eds.) Acquisition
of mathematics concepts and processes (205-227). New York: Academic Press.
Houghton Mifflin Harcourt (2015). Go Math. Grade K.
Houghton Mifflin Harcourt (2015). Go Math. Grade 1.
Houghton Mifflin Harcourt (2015). Go Math. Grade 2.
Houghton Mifflin Harcourt (2015). Go Math. Grade 3.
Houghton Mifflin Harcourt (2015). Go Math. Grade 4.
Houghton Mifflin Harcourt (2015). Go Math. Grade 5.
Hoyles, C., & Healy, L. (1997). Unfolding meaning for reflective symmetry. International
Journal of Computers for Mathematical Learning, 2, 27-59.
Hughes, M., & Macleod, H. (1986). Part 2: Using Logo with very young children. In R. Lawler,
B. du Boulay, M. Hughes, & H. Macleod (Eds.), Cognition and computers: Studies in
learning (pp. 179-219). Chichester, England: Ellis Horwood.
Illustrative Mathematics (2018). Open Up Resources. Grade 6, Unit 1.
Illustrative Mathematics (2018). Open Up Resources. Grade 7, Unit 1.
Illustrative Mathematics (2018). Open Up Resources. Grade 7, Unit 3.
Illustrative Mathematics (2018). Open Up Resources. Grade 7, Unit 7.
Illustrative Mathematics (2018). Open Up Resources. Grade 8, Unit 1.

120
Illustrative Mathematics (2018). Open Up Resources. Grade 8, Unit 2.
Illustrative Mathematics (2018). Open Up Resources. Grade 8, Unit 5.
Illustrative Mathematics (2018). Open Up Resources. Grade 8, Unit 8.
Jaime, A. P., Chapa, F. A., & Gutirrez, A. R. (1992). Definiciones de triangulos y cuadrilateros:
Errores e inconsistencias en libros de texto de E. G. B. Epsilon, 23, 49-62.
Jones, D.L. (2004). Probability in middle grades mathematics textbooks. An examination of
historical trends, 1957-2004. Doctoral dissertation, University of Missouri.
Kidder, F. R. (1976). Elementary and middle school children’s comprehension of Euclidean
transformations. Journal for Research in Mathematics Education, 7, 40-52.
Kieran, C. (1986). Logo and the notion of angle among fourth and sixth grade children,
Proceedings of the 10th Annual Conference of the International Group for the
Psychology of Mathematics Education (pp. 99-104), London. University of
London, Institute of Education.
Kieren, T., & Olson, A. (1983, February). Linking Logo with learning levels in Mathematics.
Talk presented at the Northwest conference on Computers in Education, Oregon State
University, Corvallis.
Kouba, V. L., Brown, C. A., Carpenter, T. P., Lindquist, M. M., Silver, E. A., & Swafford,
J. O. (1988). Results of the fourth NAEP assessments of mathematics: Measurement,
geometry, data interpretation, attitudes, and other topics. Arithmetic Teacher, 35(9),
10-16.
Krippendorff, K. (1980). Content Analysis: An Introduction to its methodology. Beverly Hills:
Sage Publications.
Kynigos, C. (1993). Children’s inductive thinking during intrinsic and Euclidean geometrical
activities in a computer programming environment. Educational Studies in Mathematics,
24, 177-197.
Lehrer, R., & Smith, P.C. (1986, April). Logo learning: Are two heads better than one? Paper
presented at the meeting of the American Educational Research Association, San
Francisco.
Linn, R.L., Baker, E.L., & Betebenner, D.W. (2002). Accountability systems: Ramifications of
the No Child Left Behind Act of 2001. Retrieved from http://www.ecs.org/clearing
house/35/65/3565.htm.
Llorens Fuster, J.-L., & Perez Carreras, P. (1997). An extension of van Hiele’s model to the
study of local approximation. International Journal of Mathematical Education in
Science and Technology, 28, 713-726.

121
Lunkenbein, D. (1980). Observations Concerning the Child’s Concept of Space and its
Consequences for the Teaching of Geometry to Younger Children. [Summary].
Proceedings of the Fourth International Congress on Mathematics Education (pp. 172 –
174). Boston: Birkhauser.
Mason M. M. (1989, April). Geometric understanding and misconceptions among gifted fourth-
eighth graders. Paper presented at the meeting of the American Educational Research
Association, San Francisco, CA.
Mayberry J. (1983). The van Hiele levels of geometric thought in undergraduate preservice
teachers. Journal for Research in Mathematics Education, 14, 58-69.
McKnight, C. C., Travers, K. J., & Dossey, J. A. (1985). Twelfth-grade mathematics in U.S. high
schools: A report from the Secondary International Mathematics Study. Mathematics
Teacher, 78(4), 292-300.
Mistretta, R. M. (2000). Enhancing geometric reasoning. Adolescence, 35, 365-379.
Mitchelmore, M. C. (1989). The development of children’s concepts of angle. In G.
Vergnaud, J. Rogalski, & M. Artique (Eds.), Proceedings of the 13th conference of
the International Group for the Psychology of Mathematics Education (pp. 304-311).
Paris: University of Paris.
Monaghan, F. (2000). What difference does it make? Children’s view of the differences
between some quadrilaterals. Educational Studies in Mathematics, 42, 179-196.
Morris, J.P. (1983). Microcomputers in a sixth-grade classroom. Arithmetic Teacher, 31(2), 22-
24.
Mullis, I. V. S., Martin, M. O., Beaton, A. E., Gonzalez, E. J., Kelly, D. L., & Smith, T. A.
(1997). Mathematics Achievement in the Primary School Years: IEA’s Third
International Mathematics and Science Study (TIMSS). Chestnut Hill, MA: Center
for the Study of Testing, Evaluation, and Educational Policy, Boston College.
National Council of Teachers of Mathematics (1989). Curriculum and Evaluation
Standards for school mathematics. Reston, VA: National Council of Teachers of
Mathematics.
National Education Association (1894). Report of the committee of ten on secondary school
studies with the reports of the conferences arranged by the committee. New York:
American Book Company.
National Research Council. (2001). Adding it up. Washington DC: National Academy Press.
National Research Council (2004). On evaluating curricular effectiveness: Judging the quality of
K-12 mathematical evaluations. Washington, DC: The National Academic Press.

122
Newton J. (2011). An examination of K-8 Geometry State Standards through the lens of the van
Hiele levels of geometric thinking. In John P. Smith III (Ed.) Variability is the Rule: A
companion Analysis of K-8 State Mathematics Standards, pp. 71-94.
Nixon, E. (2005). Creating and learning abstract algebra: Historical phases and conceptual levels.
Doctoral dissertation, University of South Africa, 2005. Dissertations Abstracts
International, 68, 05.
Olive, J., Lankenau, C. A., & Scally, S. P. (1986). Teaching and Understanding geometric
relationships through Logo: Phase 2. (Interim Report, Atlanta – Emory Logo Project).
Atlanta: Emory University.
Olson, A. T., Kieran, T. E., & Ludwig, S. (1987). Linking Logo, levels, and language in
mathematics. Educational studies in Mathematics, 18, 359-370.
Owens, E. W., & Waxman, H. C. (1994). Comparing the effectiveness of computer-
assisted instruction and conventional instruction in mathematics for African-
American post-secondary students. International Journal of Instructional Media, 21,
327-336.
Pegg, J. (1997). Broadening the descriptors of van Hiele levels 2 and 3. In F. Biddulph,
& K. Carr (Eds.), People in Mathematics Education, Proceedings of the twentieth
annual conference of the Mathematics Education Group of Australasia (pp. 391- 396).
Rotorua, New Zealand: University of Waikata.
Piaget, J., & Inhelder, B. (1967). The child’s conception of space (F. J. Langdon & J.L.
Lunzer, Trans.). New York: W.W. Norton.
Porter, A. (1988). A curriculum out of balance: The case of elementary school mathematics.
Educational Researcher, 18, 9-15.
Pyshkalo, A. M. (1968). Geometry in Grades 1-4. Problems in the Formation of Geometric
Conceptions in Pupils in the Primary Grades. 2nd Edition. Moscow: Proveshchenie
Publishing House, 1968. Translated by the Survey of Recent East European
Mathematical Literature, University of Chicago, 1981.
Reys, B.J., (Ed.). 2006 The intended mathematics curriculum standards: Consensus or
confusion? Charlotte, NC: Information Age
Reys, B. J., & Lappan, G. (2006). Recommendations for future development of K-8
mathematics curriculum standards. In B. J. Reys (Ed.), The intended mathematics
curriculum as represented in state level curriculum standards: Consensus or
Confusion? (pp. 111-115). Greenwich, CT: Information Age Publishing, Inc.
Reys, B. J. State-level curriculum standards: Growth in authority and specificity. In B. J. Reys
(Ed.), The intended mathematics curriculum as represented in state-level curriculum
standards: Consensus or confusion? (pp. 1-13). Charlotte, NC: Information Age
Publishing.

123
Reys, B.J., Dingman, S., Sutter, A., & Teuscher, D. (2005). Development of state-level
mathematics curriculum documents: Report of a survey. Retrieved July 31, 2005, from
http://mathcurriculumcenter.org/news.html.
Reys, B.J., Thomas, A., Tran, D., Dingman, S., Kasmer, L., Newton, J., & Teuscher, D. (2013).
State-level actions following adoption of Common Core State Standards for
Mathematics. NCSM Journal of Mathematics Education Leadership, 14(2), 5-13.
Robitaille, D. F., & Travers, K. J. (1992). International studies of achievement in mathematics.
In D. A. Grouws (Ed.), Handbook of research in mathematics teaching and learning (pp.
687-723). Reston, VA: National Council of Teachers of Mathematics.
Schmidt, W. H., & Houang, R. T. (2102). Curricular coherence and the Common Core State
Standards for Mathematics. Educational Researcher, 41(8), 294-308.
doi:10.3102/0013189x12464517
Schoenfeld A (1985). Mathematical Problem Solving: Academic Press, Orlando, FL.
Schoenfeld, A.H. (2004). The math wars. Educational Policy, 18, 253-286.
Senk, S. L. (1985). How well do students write geometry proofs? Mathematics Teacher, 78,
448-456.
Senk S. (1989). Van Hiele levels and achievement in writing geometry proofs. Journal for
Research in Mathematics Education, 20, 309-321.
Shaughnessy, J. M., & Burger, W. F. (1985). Spadework prior to deduction in geometry,
Mathematics Teacher, 78, 419-428.
Sinclair, N. (2008). The History of the Geometry Curriculum in the United States. Information
Age Publishing Inc. Charlotte, North Carolina.
Stein, M., Cover, B., & Henningsen, M. (1996). Building student capacity for mathematical
thinking and reasoning: An analysis of mathematical tasks used in reform classrooms.
American Educational Research Journal, 33, 455-488.
Stevenson, H. W., Lee, S. –Y., & Stigler, J. W. (1986). Mathematics achievement of
Chinese, Japanese, and American children. Science, 231, 693-699.
Stigler, J.W., Lee, S. –Y., & Stevenson, H.W. (1990). Mathematical knowledge of
Japanese, Chinese, and American elementary school children. Reston, VA:
National Council of Teachers of Mathematics.
Sun K. L., & Strauss V. (2016, 15 January). Are the Common Core math standards being
misinterpreted?
Suydam, M.N. (1985). The Shape of Instruction in Geometry. The Mathematics Teacher,
78(6), 481-486.

124
Tall, D. & Vinner, S. (1981). Concept Image and Concept Definition in Mathematics with
particular reference to limits and continuity. Educational Studies in Mathematics, 12,
151-169.
The Washington Post. Retrieved from
https://www.washingtonpost.com/news/answer-sheet/wp/2016/01/15/
Thomas, B. (1982). An abstract of kindergarten teachers’ elicitation and utilization of
children’s prior knowledge in the teaching of shape concepts. Unpublished
manuscript, School of Education, Health, Nursing, and Arts Professions, New York
University.
Tran, D., Teuscher, D., Dingman, S., & Reys, B. (2104). The changing landscape of middle
grades mathematics: Draft report of a study. Retrieved from
http://matheddb.missouri.edu/ppt/MidSchAnalysis-DRAFT.pdf.
Tran, D., Reys, B.J., Teuscher, D., Dingman, S., and Kramer, L. (2016). Analysis of
curriculum standards: An important research area, Journal for Research in
Mathematics Education, 47(2), 118-133.
Tyson-Bernstein, H., & Woodward, A. (1991). Nineteenth century policies for twenty first
century practice: The textbook reform dilemma. In Altbach, G. P. Kelly, H. G., & Weis
L. (Eds.), Textbooks in American society: Politics, policy, and pedagogy (pp. 91-104).
Albany, NY: State University of New York Press.
Usiskin, Z. (1980). “What should not be in the Algebra and Geometry curricula of
average students?” Mathematics Teacher 73 (September 1980): 413-424.
Usiskin, Z. (1982). Van Hiele levels and achievement in secondary school geometry (Final
report of the Cognitive Development and Achievement in Secondary School Geometry
Project: ERIC Document Reproduction Service No. ED 220 288). Chicago: University of
Chicago.
Usiskin, Z. (1985). We need another revolution in secondary school mathematics. In C.R. Hirsch
& M. J. Zweng (Eds.), The secondary school mathematics curriculum: 1985 yearbook of
the National Council of Teachers of Mathematics. Reston, VA: National Council of
Teachers of Mathematics.
Usiskin, Z. (1987). Resolving the continuing dilemmas in school geometry. In Lindquist M. M.,
& Shulte, A. P. (Eds), Learning and Teaching Geometry, K-12 (1987 Yearbook of the
National Council of Teachers of Mathematics, pp. 17 – 31). Reston, VA: NCTM
Usiskin, Z. (1997). The Implications of “Geometry for All.” Journal of Mathematics
Education Leadership 1(1997):5-16.

125
van Hiele, P. M. (1959). Development and learning process: A study of some aspects of Piaget’s
psychology in relation with the didactics of mathematics. Utrecht: University of Utrecht,
1957.
van Hiele, P. M. (1984). English Summary. [The problem of insight in connection with school
children’s insight into the subject matter of geometry] (Unpublished doctoral dissertation,
University of Utrecht, 1957). In Fuys, D., Geddes, D., & Tischler, R. (Eds.). English
translation of selected writings of Dina van Hiele- Geldof and P. M. van Hiele (pp. 237-
241). Brooklyn: Brooklyn College.
van Hiele, P.M. (1986). Structure and insight: A theory of mathematics education.
Orlando, FL: Academic Press.
van Hiele, P. M. (1987, June). A method to facilitate the finding of levels of thinking in
geometry by using the levels in arithmetic. Paper presented at the working conference for
Learning and Teaching Geometry: Issues for Research and Practice, Syracuse, NY.
van Hiele-Geldof, D. (1957). De didaktiek van de Meetkunde in de eerste kaas van het
V.H.M.O. Unpublished thesis, University of Utrecht, 1957.
van Hiele-Geldof, D. (1984). The didactics of geometry in the lowest class of secondary school.
In D. Fuys, D. Geddes, & R. Tischler (Eds.), English translation of selected writings of
Dina van Hiele-Geldof and Pierre M. van Hiele (pp. 1-214). Brooklyn, NY: Brooklyn
College, School of Education. (ERIC Document Reproduction Service No. 289 697).
van Hiele, P. M. (1988). The child’s thought and geometry. In Fuys, D., Geddes, D., &
Tischler, R. (Eds.) (English translation of selected writings of Dina van Hiele-Geldof and
Pierre M. van Hiele) (pp. 243-252). New York: Brooklyn College.
Vinner, S., & Hershkowitz, R. (1980). Concept images and common cognitive paths in the
development of some simple geometrical concepts. In Karplus R. (Ed.), Proceedings
of the Fourth International Conference for the Psychology of Mathematics
Education (pp. 177 – 184). Berkeley: University of California, Lawrence Hall of Science.
Weber, R., P. (1985). Basic Content Analysis. Beverly Hills, CA: Sage.
Weiss, I. R., Banilower, E. R., McMahon, K.C., & Smith, P. S. (2001). Report of the 2000
national survey of science and mathematics education. Chapel Hill, NC: Horizon
Research, Inc.
Weiss, I. R., Pasley, J. D., Smith, P. S., Banilower, E. R., & Heck, D. J. (2003). Looking
inside the classroom: A study of K-12 mathematics and science education in the United
States. Chapel Hill, NC: Horizon Research, Inc.
http://www.horizonresearch.com/reports.com/reports/2003/insiderheclassroom/lo
oking.php.
Wirszup, I. (1976). Breakthroughs in the psychology of learning and teaching geometry. In J.L.
Martin & D. A. Bradbard (Eds.), Space and Geometry. Papers from a research

126
workshop (pp. 75-97). Athens, GA: University of Georgia, Georgia Center for the Study
of Learning and Teaching Mathematics. (ERIC Document Reproduction Service No. ED
132 033).

127
APPENDICES
Appendix A: van Hiele Levels in Standards’ Documents
CCSSM Level 1 Level 2 Level 3
K 3 3
1 1
1
2
1
3
1
4
3
5
2
7
1
8
2 2
Alaska Level 1 Level 2 Level 3
K 3 3
1 1
1
2
1
3
1
4
3
5
2
7
1
8
2 2
Indiana Level 1 Level 2 Level 3
K 2 2
1 1 1 1
2 1 2
3 1
1
4 1 4
5
1
7
1
8
3 1

128
Minnesota Level 1 Level 2 Level 3
K 1 1
1 1 1
2 1 1
3
2
4
5
5
1
7
2
8
1
Nebraska Level 1 Level 2 Level 3
K 2 3
1 1
1
2
1
3 1 1
4 3 3
5 2
1
8
3 1
Oklahoma Level 1 Level 2 Level 3
K 4 1
1 4
2 3 1
3 1 1
4 1 2
5
2
7
1
PA
1
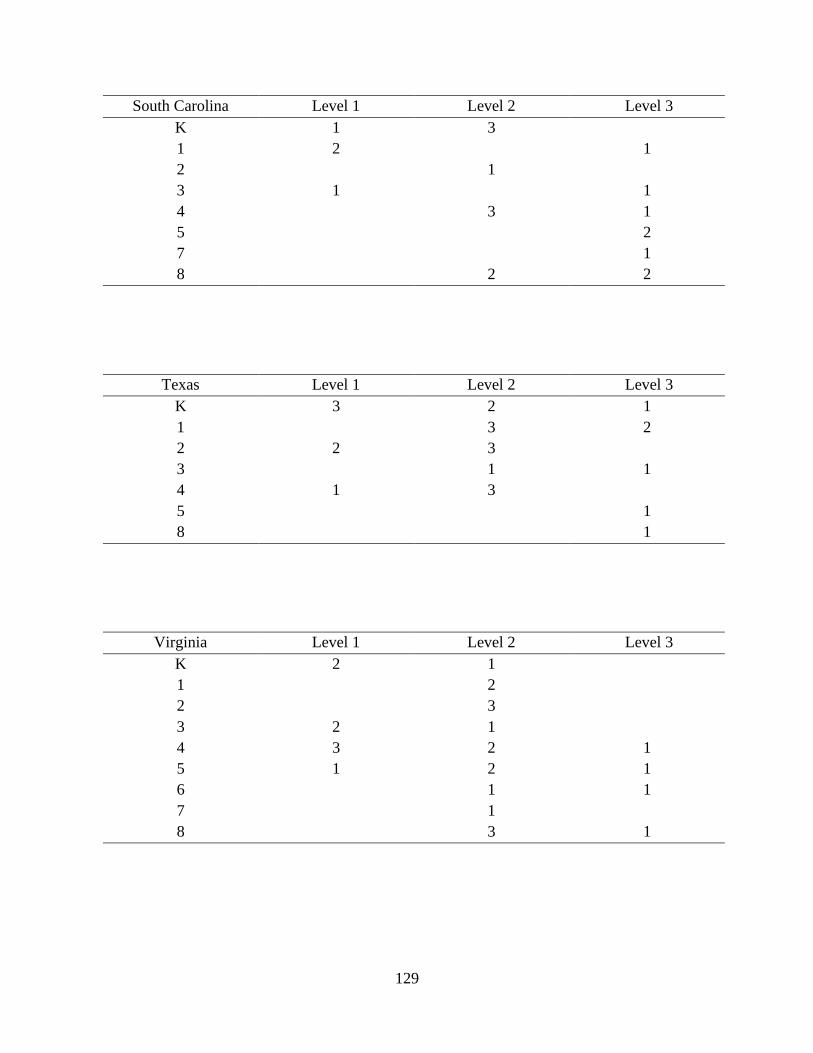
129
South Carolina Level 1 Level 2 Level 3
K 1 3
1 2
1
2
1
3 1
1
4
3 1
5
2
7
1
8
2 2
Texas Level 1 Level 2 Level 3
K 3 2 1
1
3 2
2 2 3
3
1 1
4 1 3
5
1
8
1
Virginia Level 1 Level 2 Level 3
K 2 1
1
2
2
3
3 2 1
4 3 2 1
5 1 2 1
6 1 1
7
1
8
3 1

130
Appendix B: van Hiele Levels in Mathematics Textbooks
Go Math K Level 1 Level 2 Level 3
pp. 357-362 x
p.363
x
pp.365-368 x
pp.369-371
x
pp.373-376 x
pp.377-380
x
pp.381-384 x
pp.385-388
x
pp.389-392 x
pp.393-396
x
pp.405-407 x
p.410 x x
pp.411-412
x
pp.417-419 x
p.422
x
p.423 x
p.427 x
pp.431-432 x
pp.433-435
x
p.438 x
pp.441-443 x
pp.445-447 x

131
Go Math 1 Level 1 Level 2 Level 3
pp.458-459 x pp.462-464 x pp.466-472 x pp.478-480 x pp.486-492 x pp.494-496 x pp.498-504 x pp.506-512 x
Go Math 2 Level 1 Level 2 Level 3
p.506 x p.508 x
pp.510-513 x pp.514-515 x pp.518-520 x pp.526-528 x
p.549 x p.550 x
Go Math 3 Level 1 Level 2 Level 3
pp.489-490 x pp.493-494 x pp.495-496 x pp.497-498 x pp.499-500 x pp.501-502 x pp. 503-504 x
pp.505-508 x pp.515-516 x
o Math 4 Level 1 Level 2 Level 3
pp.379-380 x pp.387-388 x
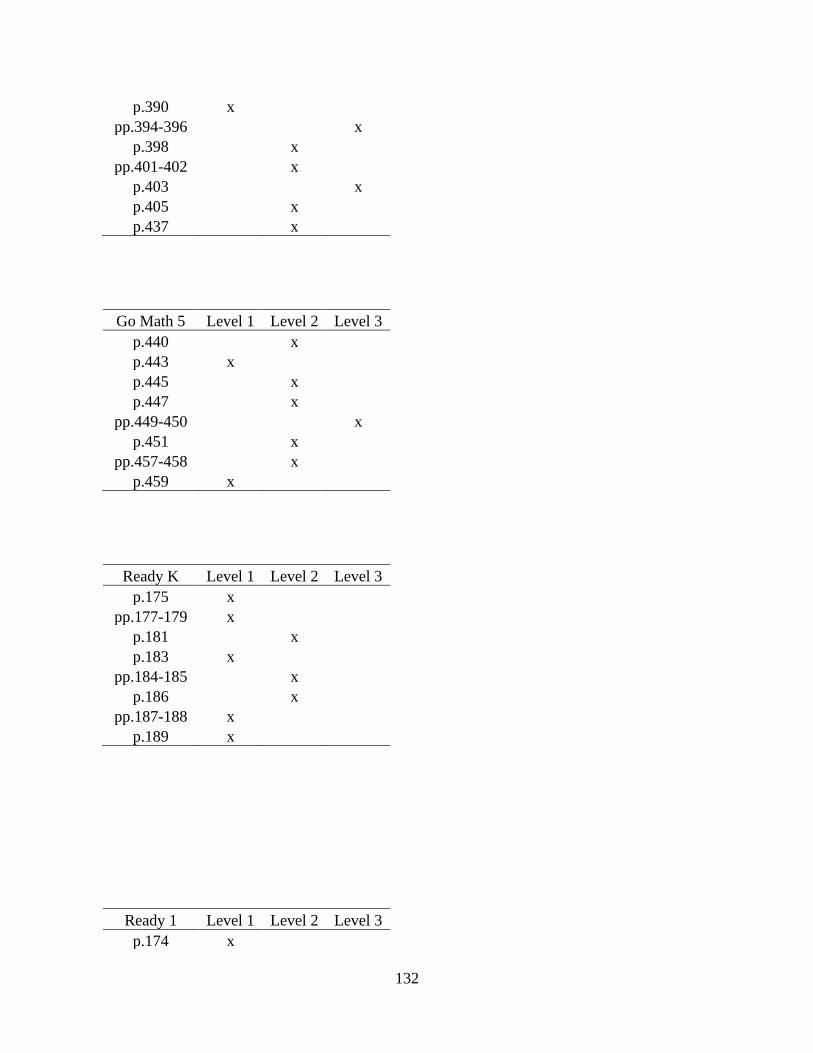
132
p.390 x pp.394-396 x
p.398 x pp.401-402 x
p.403 x
p.405 x p.437 x
Go Math 5 Level 1 Level 2 Level 3
p.440 x p.443 x p.445 x p.447 x
pp.449-450 x
p.451 x pp.457-458 x
p.459 x
Ready K Level 1 Level 2 Level 3
p.175 x pp.177-179 x
p.181 x p.183 x
pp.184-185 x p.186 x
pp.187-188 x p.189 x
Ready 1 Level 1 Level 2 Level 3
p.174 x

133
pp.175-176 x pp.180-181 x
p.182 x pp.191-192 x
Ready 2 Level 1 Level 2 Level 3
p.248 x p.251 x p.252 x
pp.255-256 x
Ready 3 Level 1 Level 2 Level 3
p.332 x p.334 x p.336 x p.337 x
p.339 x
p.340 x p.344 x
Ready 4 Level 1 Level 2 Level 3
p.339 x pp.344-345 x pp.347-349 x
pp.352-354 x pp.357-359 x
p.368 x
Ready 5 Level 1 Level 2 Level 3
pp. 301-305 x

134
p.307 x pp.309-311 x
p.312 x
Eureka K Description
Level
1
Level
2
Level
3
p.29 M2, L2, Application problem x
pp.32-34 M2, L2, problem set x p.37 M2, L3, Concept development x
pp.40-41 M2, L3, problem set x pp.49-50 M2, L4, problem set x pp.77-78 M2, L7, Concept development x
p.80 M2, L7, problem set x pp.81-82 M2, L7, problem set x pp.84-85 M2, L7, Concept development x pp. 93-94 M2, L9, Concept development x pp.95-96 M2, L9, problem set x
p.98 M2, L10, Concept development x
p.102
M2, End of module assessment task
A x
p.103
M2, End of module assessment task
B x
p.104
M2, End of module assessment task
C x
Eureka 1 Description Level 1 Level 2 Level 3
pp. 15-16 M5, L1, Student debrief x
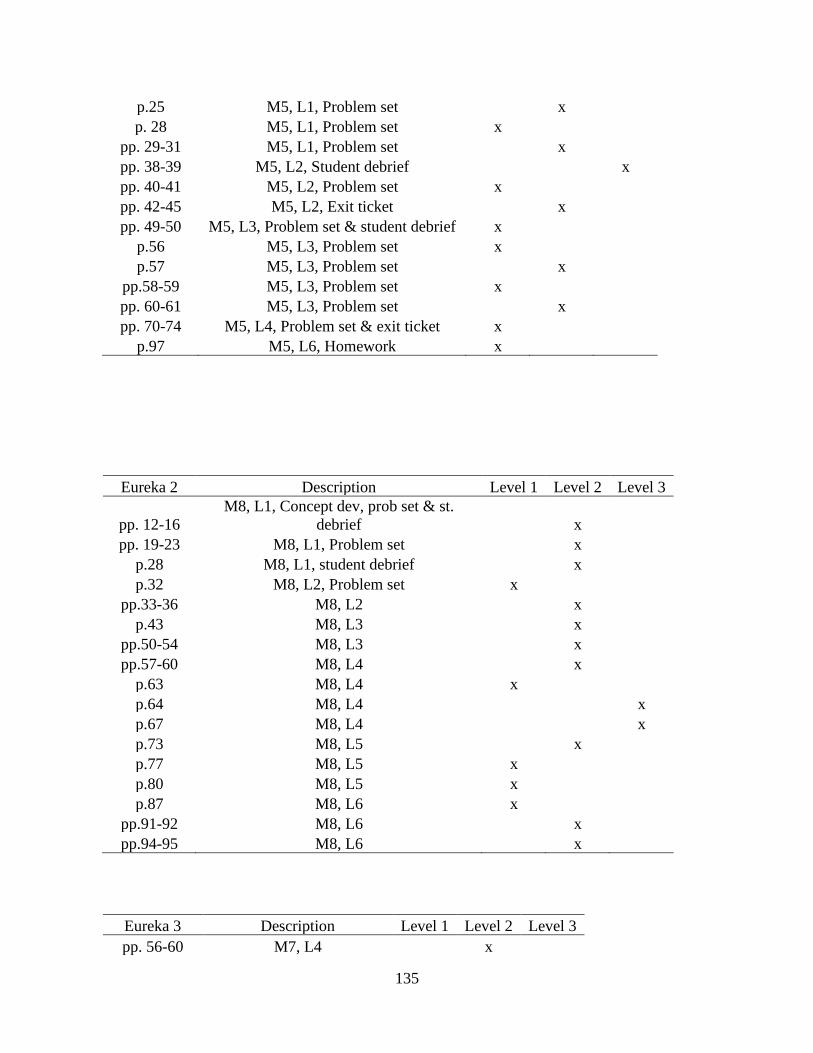
135
p.25 M5, L1, Problem set x p. 28 M5, L1, Problem set x
pp. 29-31 M5, L1, Problem set x pp. 38-39 M5, L2, Student debrief x
pp. 40-41 M5, L2, Problem set x pp. 42-45 M5, L2, Exit ticket x pp. 49-50 M5, L3, Problem set & student debrief x
p.56 M5, L3, Problem set x p.57 M5, L3, Problem set x
pp.58-59 M5, L3, Problem set x pp. 60-61 M5, L3, Problem set x pp. 70-74 M5, L4, Problem set & exit ticket x
p.97 M5, L6, Homework x
Eureka 2 Description Level 1 Level 2 Level 3
pp. 12-16
M8, L1, Concept dev, prob set & st.
debrief x pp. 19-23 M8, L1, Problem set x
p.28 M8, L1, student debrief x p.32 M8, L2, Problem set x
pp.33-36 M8, L2 x p.43 M8, L3 x
pp.50-54 M8, L3 x pp.57-60 M8, L4 x
p.63 M8, L4 x p.64 M8, L4 x
p.67 M8, L4 x
p.73 M8, L5 x p.77 M8, L5 x p.80 M8, L5 x p.87 M8, L6 x
pp.91-92 M8, L6 x pp.94-95 M8, L6 x
Eureka 3 Description Level 1 Level 2 Level 3
pp. 56-60 M7, L4 x

136
pp. 63-65 M7, L4 x pp. 68-72 M7, L5 x
pp. 78-81 M7, L5 x p. 83 M7, L6 x p. 84 M7, L6 x
Eureka 4 Description Level 1 Level 2 Level 3
pp. 16-17 M4, L1 x pp. 29-32 M4, L2 x
p.34 M4, L2 x p.35 M4, L2 x p.46 M4, L3 x p.47 M4, L3 x
pp.49-51 M4, L3 x p.52 M4, L3 x
pp.53-55 M4, L3 x pp.59-62 M4, L4 x
p. 64 M4, L4 x pp.65-66 M4, L4 x pp.67-68 M4, L4 x pp.69-70 M4, L4 x
pp.205-206 M4, L13 x
p. 209 M4, L13 x pp.211-213 M4, L13 x
p.222 M4, L14 x pp.226-227 M4, L14 x pp.231-234 M4, L15 x
pp.238-241 M4, L15 x
pp.243-255 M4, L16 x
Eureka 5 Description Level 1 Level 2 Level 3
pp 222-223 M5, L16, Quad. Fluency activity x

137
pp.223-224 M5, L16, Problem 1 x pp.224-226 M5, L16, Problem 2 x pp.226-228 M5, L16, student debrief x
pp.229-231 M5, L16, Problem set x pp.232-236 M5, L16, Homework x
pp.239-241 M5, L17, Problem 1 x pp.242-243 M5, L17, student debrief x
pp.244-245 M5, L17, Problem set x p.246 M5, L17, exit ticket x
pp.248-250 M5, L17, Homework x
pp.252-254 M5, L18, problems 1&2 x pp.256-257 M5, L18, student debrief x
pp.260-261 M5, L18, Problem set x p.262 M5, L18, exit ticket x
pp.263-264 M5, L18, Homework x pp.265-266 M5, L18, Templates x
pp.268-272 M5, L19, Problems 1&2 x
pp.272-273 M5, L19, Student debrief x
pp.276-280 M5, L19, Problem set & Homework x pp.281-282 M5, L19, Templates x
pp.285-289 M5, L20, Concept dev, student debrief, & problem set x
pp.290-297 M5, L20, Homework x
Eureka 7 Description Level 1 Level 2 Level 3
p.60 M6, L5, Example 2 x pp.62 M6, L5, Exit ticket x
pp.180-182 M6, , Examples 1,2, & 3 x p.183 M6, L16 x p.186 M6, L16 x p.197 M6, L17, Exit ticket x
pp.208-209 M6, L18, Problem set x
Eureka 8 Description Level 1 Level 2 Level 3 Level 4
p.11 M2, L1, Concept development x

138
p.14 M2, L1, Exploratory challenge x pp.24-25 M2, L2, Discussion x pp.29-30 M2, L2, Problem set x pp.32-34 M2, L3, Discussion x
p. 38 M2, L3, Problem set x pp.41-43 M2, L4, Examples and exercises x pp.44-45 M2, L4, Discussion x
p.46 M2, L4, Exercises x pp.48-51 M2, L4, Exit ticket x
p. 59 M2, L5, Concept development x p. 64 M2, L5, Problem set x
pp.65-66 M2, L6, Examples 1 & 2 x pp.71-72 M2, L6, Example 3 x
p. 79 M2, L7, Exploratory challenge x pp.84-86 M2, L7, Exit ticket x pp.89-91 M2, L8, Discussion and Exercises 4-7 x pp.97-100 M2, L9, Exploratory challenge x pp.109-112 M2, L10, Exercises x pp.117-122 M2, Midmodule assessment task x pp. 132-133 M2, L11, Exercise 1 x pp. 136-139 M2, L11, Exit ticket x pp. 139-140 M2, L12, Exp. Challenge 1 & Discussion x
pp. 141-143
M2, L12, Exp. Challenge 2, Discussion, &
closing x pp. 145-147 M2, L12, Exit ticket & problem set x
p. 149 M2, L13, Exploratory challenge 1 x p. 150 M2, L13, Exploratory challenge 2 x
pp.152-153 M2, L13, Exit ticket 2 x pp. 154-155 M2, L13, Problem set 1, 2, & 3 x
p. 157 M2, L13, Problem set 7 x pp.159-160 M2, L14, Discussion x pp. 160-161 M2, L14, Exercises 1-4 x pp. 161-165 M2, L14, Examples 1-4 and Exercises 5-10 x pp. 166-170 M2, L14, Exit ticket x
p. 171 M2, L14, End of Module Assessment x p.172 M2, L14, End of Module Assessment x
p.173 M2, L14, End of Module Assessment x pp.181-182 M2, L15, Discussion x
Eureka 8 Description Level 1 Level 2 Level 3 Level 4
pp. 18-24 M3, L2, Discussion x
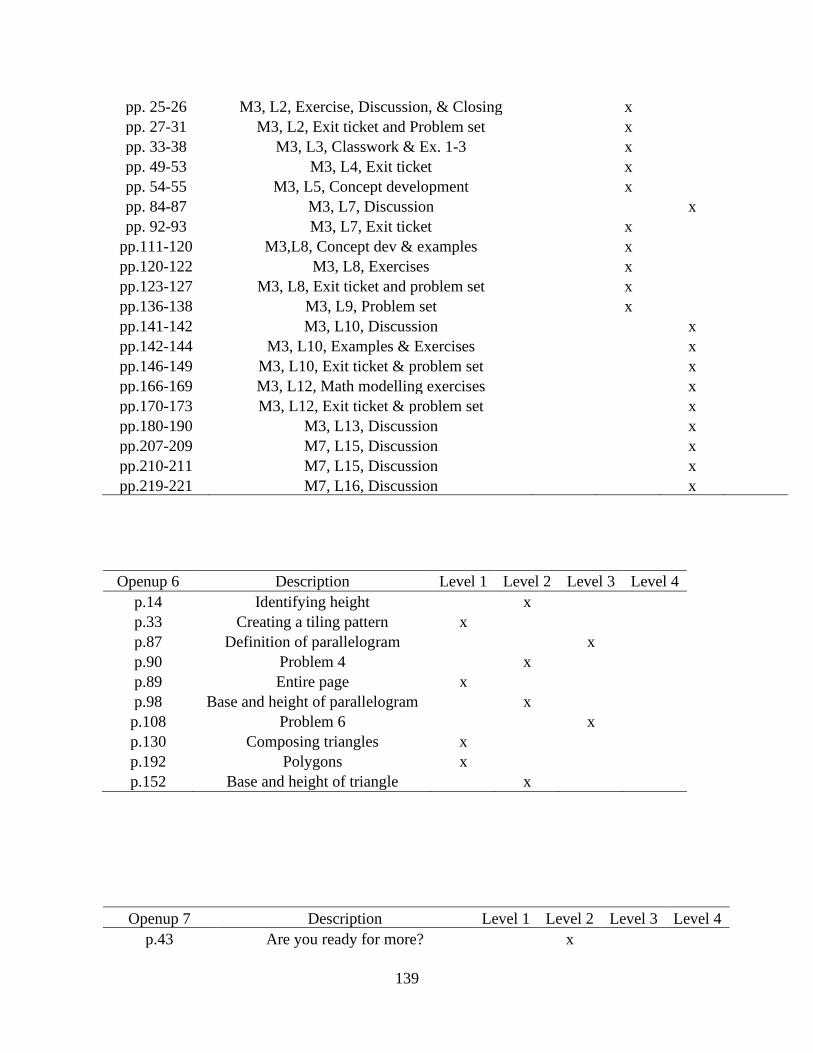
139
pp. 25-26 M3, L2, Exercise, Discussion, & Closing x pp. 27-31 M3, L2, Exit ticket and Problem set x pp. 33-38 M3, L3, Classwork & Ex. 1-3 x pp. 49-53 M3, L4, Exit ticket x pp. 54-55 M3, L5, Concept development x pp. 84-87 M3, L7, Discussion x pp. 92-93 M3, L7, Exit ticket x
pp.111-120 M3,L8, Concept dev & examples x pp.120-122 M3, L8, Exercises x pp.123-127 M3, L8, Exit ticket and problem set x pp.136-138 M3, L9, Problem set x pp.141-142 M3, L10, Discussion x pp.142-144 M3, L10, Examples & Exercises x pp.146-149 M3, L10, Exit ticket & problem set x pp.166-169 M3, L12, Math modelling exercises x pp.170-173 M3, L12, Exit ticket & problem set x pp.180-190 M3, L13, Discussion x pp.207-209 M7, L15, Discussion x pp.210-211 M7, L15, Discussion x pp.219-221 M7, L16, Discussion x
Openup 6 Description Level 1 Level 2 Level 3 Level 4
p.14 Identifying height x
p.33 Creating a tiling pattern x
p.87 Definition of parallelogram x
p.90 Problem 4 x
p.89 Entire page x
p.98 Base and height of parallelogram x
p.108 Problem 6 x
p.130 Composing triangles x
p.192 Polygons x
p.152 Base and height of triangle x
Openup 7 Description Level 1 Level 2 Level 3 Level 4
p.43 Are you ready for more? x

140
p.49 Activity synthesis x pp.50-51 Sec 2.5 Comparing circles x
p.95 Practice problems, problem 5 x p.103 Are you ready for more? x
pp.118-120 Optional classroom activity x p.10 End of unit assessment, prob 2 x
pp.18-19 Visualizing angles x pp.28-29 Identical isosceles triangles x pp.41-42 Are you ready for more? x
p.53 Activity synthesis x p.83 Are you ready for more? x
p.158 Warm up x Pp159 Activity synthesis x
pp.160-161 Classroom activity x p.161 Are you ready for more? x
pp.163-166 Section 11.4 x pp.167-168 Slicing a pentagonal pyramid x pp.169-170 Practice problems 1-3 x
p.179 Are you ready for more? x p.183 Practice problem 1 x p.187 Warm up x p.208 Practice problem 2 x

141
Openup 8 Description Level 1 Level 2 Level 3 Level 4
pp. 8-9 Problems 1&2 x p.11 Problem 5 x p.11 Problem 6 x p.12 Problem 7 x
pp.14-20 Problems 1,2,3,4,5, and 7 x pp.22-28 Problems 1,2,3,4,5, and 7 x pp.39-40 Practice problems 1-3 x
p.45 Classroom activity x pp.49-50 Activity synthesis x
p.52 Practice problems 1 and 2 x p.63 Section 3.3 x p.76 Classroom activity x
pp.81-82 Practice problems 1 and 2 x p.118 Classroom activity x
pp.122-123 Practice problems 1-3 x p.133 Classroom activity x p.135 Cool down x
pp.137-138 Practice problems 3 and 4 x p.161 Classroom activity x
pp.167-168 Practice problems 1-3 x pp. 170-171 Lesson narrative x
p.174 Classroom activity x p.179 Are you ready for more? x x
p.181 Cool down x pp.182-184 Practice problems 3,4, and 6 x
p.187 Warm up x pp.190-195 Classroom activity x pp.217-219 Practice problems x
p.256 Classroom activity x p.120 Classroom activity x p.124 Cool down x p.144 Practice problem 5 x
pp.280-281 Are you ready for more? x p.22 Are you ready for more? x p.89 Are you ready for more? x
pp.98-99 Classroom activity x pp.122-123 Classroom activity x
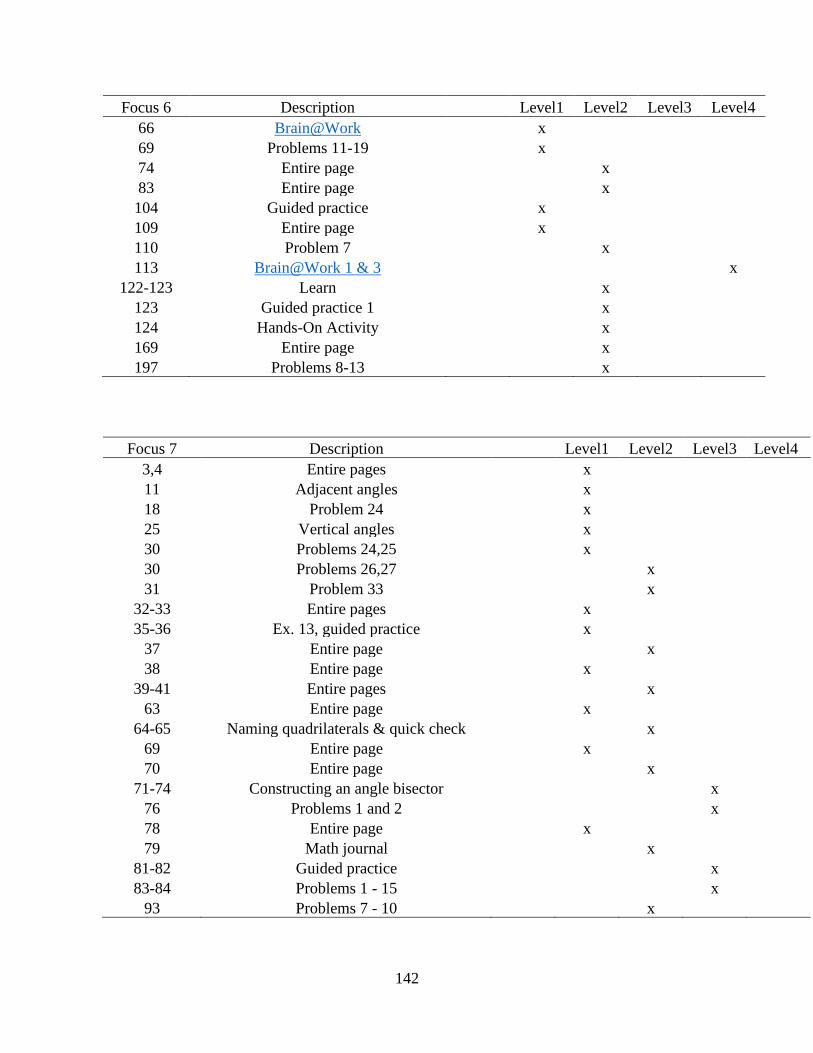
142
Focus 6 Description Level1 Level2 Level3 Level4
66 Brain@Work x 69 Problems 11-19 x 74 Entire page x 83 Entire page x 104 Guided practice x 109 Entire page x 110 Problem 7 x 113 Brain@Work 1 & 3 x
122-123 Learn x 123 Guided practice 1 x 124 Hands-On Activity x 169 Entire page x 197 Problems 8-13 x
Focus 7 Description Level1 Level2 Level3 Level4
3,4 Entire pages x 11 Adjacent angles x 18 Problem 24 x 25 Vertical angles x 30 Problems 24,25 x 30 Problems 26,27 x 31 Problem 33 x
32-33 Entire pages x 35-36 Ex. 13, guided practice x
37 Entire page x 38 Entire page x
39-41 Entire pages x 63 Entire page x
64-65 Naming quadrilaterals & quick check x 69 Entire page x 70 Entire page x
71-74 Constructing an angle bisector x 76 Problems 1 and 2 x 78 Entire page x 79 Math journal x
81-82 Guided practice x 83-84 Problems 1 - 15 x
93 Problems 7 - 10 x

143
Focus
8 Description Level 1 Level2 Level3 Level4
16 Problems 1 -2 x 50 Quick check x 55 Technology Activity x 63 Technology Activity x 72 Problem 7 x 77 Technology Activity x 85 Problems 7 - 8 x 90 Technology Activity x 92 Think Math x 97 Problem 8 x
98 -99 Technology Activity x


![Improving Students’ Van Hiele Level Of Geometric Thinking ... · Improving Students’ Van Hiele Level Of Geometric Thinking Using Geometer’s Sketchpad Poh Geik Tieng [1], Leong](https://static.fdocuments.in/doc/165x107/5ceb300f88c9931e1e8e0d13/improving-students-van-hiele-level-of-geometric-thinking-improving-students.jpg)