The Value of Reference Letters -...
51
The Value of Reference Letters Martin Abel * Rulof Burger † Patrizio Piraino ‡§ Abstract We show that reference letters from former employers alleviate information asymme- tries about workers’ skills and improve both match quality and equity in the labor market. A resume audit study finds that using a reference letter in the application increases callbacks by 61%. Women disproportionately benefit. Letters are effective because they provide valuable information about workers’ skills that employers use to select applicants of higher ability. A second experiment, which encourages job seekers to obtain and use a reference letter, finds consistent results. In particular, employment rates for women who obtain letters double, fully closing the gender gap in our sample. * Harvard University. Email: [email protected]. Corresponding author. † Stellenbosch University. Email: [email protected] ‡ University of Cape Town. Email: [email protected] § Acknowledgement: This paper greatly benefited from discussions with and comments by David Autor, Emmanuel Bakirdjian, Willa Brown, Eliana Carranza, Bruno Crepon, Robert Garlick, Rachel Glennerster, Rema Hanna, Lawrence Katz, Asim Khwaja, Michael Kremer, Amanda Pallais, Gareth Roberts, Volker Schoer, and participants at the CSAE and NEUDC conferences. Emma Lambert-Porter, Velenkosini Matse- bula, Samantha Ndiwalana and Svetlana Pimkina provided superb research assistance. We thank the South African Department of Labour and J-PAL Africa, especially Laura Poswell, for assistance in the implemen- tation of this project. This study was prepared in collaboration with the World Bank Jobs Group and the Africa Gender Innovation Lab. We thank EuropeAid for financial support. The experiment was registered under registry number AEARCTR-0000819. All errors and omissions are our own.
Transcript of The Value of Reference Letters -...
The Value of Reference Letters
Martin Abel∗ Rulof Burger† Patrizio Piraino‡§
Abstract
We show that reference letters from former employers alleviate information asymme-tries about workers’ skills and improve both match quality and equity in the labormarket. A resume audit study finds that using a reference letter in the applicationincreases callbacks by 61%. Women disproportionately benefit. Letters are effectivebecause they provide valuable information about workers’ skills that employers use toselect applicants of higher ability. A second experiment, which encourages job seekersto obtain and use a reference letter, finds consistent results. In particular, employmentrates for women who obtain letters double, fully closing the gender gap in our sample.
∗Harvard University. Email: [email protected]. Corresponding author.†Stellenbosch University. Email: [email protected]‡University of Cape Town. Email: [email protected]§Acknowledgement: This paper greatly benefited from discussions with and comments by David Autor,
Emmanuel Bakirdjian, Willa Brown, Eliana Carranza, Bruno Crepon, Robert Garlick, Rachel Glennerster,Rema Hanna, Lawrence Katz, Asim Khwaja, Michael Kremer, Amanda Pallais, Gareth Roberts, VolkerSchoer, and participants at the CSAE and NEUDC conferences. Emma Lambert-Porter, Velenkosini Matse-bula, Samantha Ndiwalana and Svetlana Pimkina provided superb research assistance. We thank the SouthAfrican Department of Labour and J-PAL Africa, especially Laura Poswell, for assistance in the implemen-tation of this project. This study was prepared in collaboration with the World Bank Jobs Group and theAfrica Gender Innovation Lab. We thank EuropeAid for financial support. The experiment was registeredunder registry number AEARCTR-0000819. All errors and omissions are our own.

1 Introduction
Information asymmetries about workers’ skills are prevalent in labor markets, especially inthe market for low-skill and entry-level jobs.1 Hiring firms can reduce these asymmetriesthrough reference letters from previous employers (Ioannides and Loury, 2004). However,in various contexts (particularly in the developing world) this practice is largely absent andmost firms resort instead to informal referrals, such as those from their existing workforce.2
This has potential adverse effects on match quality as it limits the pool of candidates (Loury,2006) and as current employees may refer close friends or family members rather than theirmost qualified peers (Beaman and Magruder, 2012). In addition, informal referral systemsmay exacerbate inequity as they disadvantage less connected groups; in particular, theyharm women who often lack access to informal referral networks (Beaman et al., 2013;Montgomery, 1991).
We conduct three experiments in cooperation with the South African Department of Labour(DoL) to investigate the value and usage of standardized reference letters among youngjob seekers. Specifically, we design a reference letter template and encourage young jobseekers to have a former employer complete it. To test whether reference letters are valuablein principle, we first submit applications on behalf of job seekers to vacancies with andwithout reference letters and compare firm responses (Experiment 1).3 To assess whetherletters are valuable in practice, we conduct an additional experiment in which we encouragehalf of job seekers to obtain a letter and subsequently follow their job search behavior andemployment outcomes (Experiment 2). Given the large positive effects we find, we run athird experiment that tests different explanations for why letters are not more prevalent(Experiment 3). Evidence from these experiments enables us to answer three questions: i)Do reference letters have value? ii) How do they generate value? and iii) What explainstheir (lack of) usage?
We find that reference letters are valuable to both job seekers and hiring firms. Attachinga letter increases the probability that a firm responds to the applicant by 61% (from 4.15%to 6.69%) and the rate of interview requests by 64% (from 2.4% to 3.94%). Effect sizes are
1In these markets, job seekers often have limited work experience and lack educational degrees to signalskills. Firms are less likely to invest in costly screening as employment relationships are often short-term(Autor and Scarborough, 2008). A literature on firm learning provides indirect evidence that informationasymmetries are prevalent at the time of hiring (Kahn and Lange, 2014; Farber and Gibbons, 1996; Altonjiand Pierret, 2001).
2In developed economies about 50% of jobs are found through informal network (Topa, 2011). In SouthAfrica, an emerging economy with high unemployment, about 68% of jobs are found through informalreferrals (Schoer et al., 2014).
3We are among the first to conduct an audit study with actual job seekers. This addresses the criticismthat application materials designed by researchers may not be realistic or include all relevant information(Heckman, 1998) as well as ethical concerns about sending fictitious applications (Riach and Rich, 2004).
1
larger for women, increasing employer responses by 89% (results from Exp.1). While we donot detect significant impacts for men, female participants who obtained letters are morelikely to receive job interviews and their employment rate doubles after three months, thusfully closing the gender employment gap in our sample (Exp.2). On the firm side, referenceletters help to select candidates of higher ability: performing one standard deviation higheron an aptitude test (observable by us but not by the employer) increases the likelihood of anemployer response by 2.6 percentage points (63%) for applications that include a referenceletter, as opposed to 0.6 percentage points (15%) for those not including a letter (Exp.1).These improvements in firms’ screening ability apply to both male and female candidates.Although our design cannot explicitly test for general equilibrium effects, theory predictsthat the identification of higher ability workers should increase firm demand (Pissarides,1985).
How do reference letters generate value? We find that letters are informative of workers’skills: ratings from previous employers are highly correlated with aptitude scores of both maleand female job seekers, even after controlling for information that can be easily inferred fromthe resume or school transcripts. Firms correctly use this information to update their beliefsof applicants and are more likely to respond to applications with positive letters (Exp.1).However, reference letters in which the former employer gives the highest rating in everycategory are ineffective, despite the fact that job seekers with these glowing reference lettersperform very well in the aptitude test. This suggests that a perceived lack of credibility of theletter harms their employment prospects. The effect of employer ratings is more pronouncedfor women, indicating that firms are more uncertain about their skills and thus pay moreattention to their letters’ content (Exp.1).
In light of these results, one might ask why reference letters are not more prevalent andthose that do exist often lack relevant information.4 At baseline, 88% of job seekers saythey do not have a letter because they “never asked”, often claiming they did not knowthey needed one. Once prompted, 31-42% of participants succeed in obtaining a letter. Thisshare increases substantially when we provide job seekers with information on the benefits ofhaving a letter (Exp.3). By contrast, an arm of the experiment which offered cash incentivesfor obtaining letters had no effect. Underestimating potential benefits may thus explain whyjob seekers are not asking former employers to provide (informative) reference letters. Inorder to investigate why job seekers do not discover their effectiveness, we analyze actualapplications submitted by participants and find that only about 20% of people who obtain a
4About 2% of people in the control group use a reference letter in the job search and the majority ofthese letters are generic and do not provide information about skills (72%) or even the reference’s contactinformation (44%). Interviews with firms indicate that employers know what content a letter should include,but providing this information to the market is costly and references do not directly benefit from it (Averyet al., 1999).
2

letter submit it as part of their application (Exp.2). This low usage stifles any learning abouttheir benefits through job search. We also find that among participants in the treatmentgroup, women are significantly more likely to use letters in their search, which can explainthe large gender difference in employment effects.
How would the effectiveness of reference letters differ as they become more common? First,we introduce a simple model of employer learning that predicts that the penalty of notsending a letter increases as reference letters become more prevalent. Simulation results showthat this in turn induces more job seekers to submit a letter, improving the ability of firmsto screen applicants. Secondly, as reference letters become more common, an applicationmay be less distinctive by having a letter attached. We test this hypothesis by randomlyvarying the share of applicants for whom we submit reference letters. We find that increasingthe number of reference letters sent to a given vacancy does not affect the letters’ impact(Exp.1).
Our results contribute to the literature on job referrals. Previous studies have largely focusedon whether social network links can be exploited to reduce information asymmetries, showingthat although workers have information on the productivity of their peers (Pallais and Sands,2016; Burks et al., 2015), they are less likely to pass on truthful information to firms unlesssufficiently incentivized (Beaman and Magruder, 2012). Former employers may providemore credible information because their incentives are more aligned with the hiring firm. Inaddition, they can assess workers more accurately as they observed them in a professionalsetting (Aamodt, 2015). However, few studies have looked at the role of former employers inreducing information asymmetries. Two notable exceptions are Pallais, 2014, who finds thatfeedback on workers’ past performance in an online labor market increases their employmentprospects, and Bassi and Nansamba, 2017 who study the effect of certifying soft skills. Wecontribute to this literature by investigating a more traditional labor market setting in whichworkers can choose both the referee and whether to reveal the information to the marketafter they observe it.
In addition, we contribute to the literature on how search frictions affect employment(Mortensen and Pissarides, 1994). Information asymmetries between firms and workerslead to socially sub-optimal hiring of people with limited work experience and an overalldecrease in market efficiency (Pallais, 2014; Terviö, 2009). We show that a simple interven-tion can improve firms’ screening ability and reduce these asymmetries. This is a necessaryprecondition for reference letters to have general equilibrium employment effects, providinga rationale for the government to facilitate the information exchange.
This study also adds to an extensive literature evaluating the effectiveness of active labormarket policies (ALMP) (see Card et al., 2015 and McKenzie, 2017 for recent reviews).
3

The evidence on ALMPs is mixed, in part because they typically include a package ofinterventions which makes it difficult to isolate the effectiveness of specific components.In this study, we are able to isolate one component of ALMPs, namely the reduction ofinformation asymmetries.5
Lastly, we are to our knowledge the first to test experimentally the effect of reference let-ters on employment.6 Our results suggest that letters can be effective: they benefit jobseekers and enhance firms’ screening ability. In particular, we find large employment gainsfor women, a group often excluded from informal referral networks. Reducing informationasymmetries - through reference letters or other interventions - may thus improve equity byleveling the playing field for women in labor markets.
The remainder of this paper is structured as follows: Section 2 describes the study contextand introduces a conceptual framework. Section 3 describes the study designs. Section4 investigates the effects of reference letters on firm responses and employment. Section5 explores how firms use reference letters in the hiring process. Section 6 discusses whyreference letters are not more widely adopted and Section 7 concludes.
2 Background and Conceptual Framework
2.1 South Africa’s Labor Market
The unemployment rate in South Africa is high (26.4%), especially for youths (36.9%)(StatsSA, 2015). The gender employment gap among black South Africans is substantial,despite the fact that black females are on average more educated than their male coun-terparts (Rospabe, 2001; Shepherd, 2008). One explanation is that firms appear to eitherunderestimate or are more uncertain of the ability of female applicants.7
5Two recent studies test the effect of reducing information frictions by a third party in the context ofdeveloping countries. In Jordan, Groh et al., 2014 use results from psychometric and skill testing to matchjob seekers to vacancies. Abebe et al., 2016 test a combination of job counseling and skill certification forjob seekers in Ethiopia.
6There is relatively little research on reference letters, defined as a “description or evaluation of anapplicant that is completed by an observer and used as a source of information for personnel selection”(McCarthy and Goffin, 2001), despite its ubiquity in the selection process (Aamodt, 2015). Existing researchfocuses on the ability of reference letters to predict future performance. One exception is Kaas and Manger,2012 who find through an audit study that reference letters do not increase overall employer responses butmay benefit applicants from minority groups.
7Malindi, 2016 finds that black females have a much higher returns to job tenure than black males, whitefemales or white males in South Africa. This is consistent with a model in which employers initially under-estimate or attach greater uncertainty to the value of productive attributes possessed by black females, butthen upwardly adjust their wages once they observe their true productivity.
4

The labor market in South Africa offers a context conducive to investigating the role ofinformation asymmetries. Most of the unemployed did not complete secondary education(55%) and have no or limited work experience (50.6%), which leaves firms with very littleinformation to screen job applicants. In addition, the quality of education is low on averageand highly variable, which limits the use of educational credentials as signals for productivity(van der Berg, 2007). Finally, unemployment spells in weak labor markets are less indicativeof job seekers’ ability (Kroft et al., 2013).
Information asymmetries affect how firms and workers are matched. Some large firms inSouth Africa administer aptitude tests as part of the hiring process. While these tests canincrease aggregate productivity and labor demand by improving match quality (Mortensenand Pissarides, 1994; Pissarides, 1985), they have not been widely adopted. This may bedue to firms having fewer incentives to test candidates for jobs where investment in trainingis limited and employment spells are brief (Autor and Scarborough, 2008). Moreover, manysmall firms lack the expertise and resources to systematically test applicants.
Faced with these challenges, South African employers have increasingly turned to socialnetworks and the existing workforce to fill vacancies. Schoer et al., 2014 report that up to 68%of workers found employment via social networks.8 Yet, firms face a trade-off in their choiceof hiring channels (Montgomery, 1991). Under the “good match” hypothesis (Rees, 1966),current employers can help overcome the asymmetric information problem and create betteremployment matches as they know both the firm and the people in their network. Bycontrast, the “limited choices” hypothesis stresses that finding employment through socialnetworks limits the opportunities and match quality (Loury, 2006). In addition, currentemployees may have personal interests in referring friends that conflict with the interest ofthe firm (Beaman and Magruder, 2012;Fafchamps and Moradi, 2015).
A formal referral system with endorsements from former employers may thus be a moreeffective mechanism to reduce information asymmetries. Interviews with South African firmsconfirm the benefits of having former employers as references: if available, hiring managersreport that they typically call them for the group of shortlisted candidates. However, focusgroup discussions with job seekers reveal that most do not have contactable references listedon their CV and less than 5% used a reference letter as part of the application process.
8Female job seekers may be at a particular disadvantage; previous research shows that women are morereliant on social networks and informal channels in the search process (Schoer and Leibbrandt, 2006) andthat family networks in South Africa favor male members (Magruder, 2010).
5
2.2 Conceptual Framework
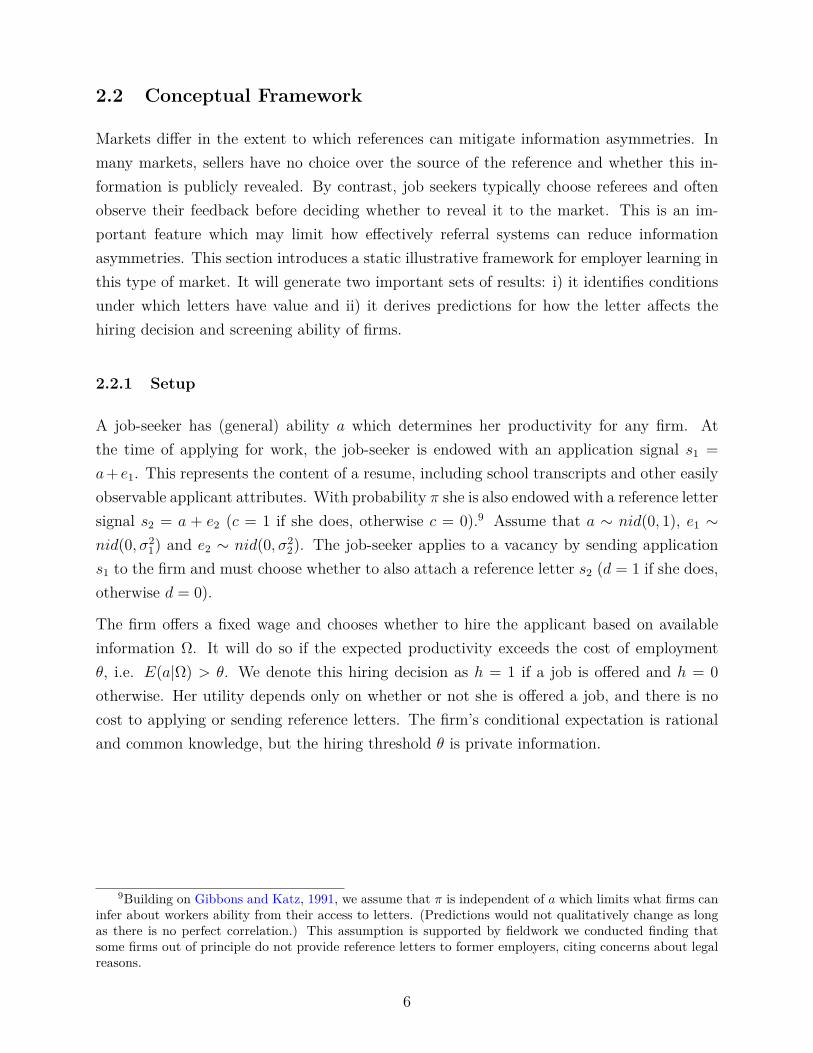
Markets differ in the extent to which references can mitigate information asymmetries. Inmany markets, sellers have no choice over the source of the reference and whether this in-formation is publicly revealed. By contrast, job seekers typically choose referees and oftenobserve their feedback before deciding whether to reveal it to the market. This is an im-portant feature which may limit how effectively referral systems can reduce informationasymmetries. This section introduces a static illustrative framework for employer learning inthis type of market. It will generate two important sets of results: i) it identifies conditionsunder which letters have value and ii) it derives predictions for how the letter affects thehiring decision and screening ability of firms.
2.2.1 Setup
A job-seeker has (general) ability a which determines her productivity for any firm. Atthe time of applying for work, the job-seeker is endowed with an application signal s1 =a+ e1. This represents the content of a resume, including school transcripts and other easilyobservable applicant attributes. With probability π she is also endowed with a reference lettersignal s2 = a + e2 (c = 1 if she does, otherwise c = 0).9 Assume that a ∼ nid(0, 1), e1 ∼nid(0, σ2
1) and e2 ∼ nid(0, σ22). The job-seeker applies to a vacancy by sending application
s1 to the firm and must choose whether to also attach a reference letter s2 (d = 1 if she does,otherwise d = 0).
The firm offers a fixed wage and chooses whether to hire the applicant based on availableinformation Ω. It will do so if the expected productivity exceeds the cost of employmentθ, i.e. E(a|Ω) > θ. We denote this hiring decision as h = 1 if a job is offered and h = 0otherwise. Her utility depends only on whether or not she is offered a job, and there is nocost to applying or sending reference letters. The firm’s conditional expectation is rationaland common knowledge, but the hiring threshold θ is private information.
9Building on Gibbons and Katz, 1991, we assume that π is independent of a which limits what firms caninfer about workers ability from their access to letters. (Predictions would not qualitatively change as longas there is no perfect correlation.) This assumption is supported by fieldwork we conducted finding thatsome firms out of principle do not provide reference letters to former employers, citing concerns about legalreasons.
6
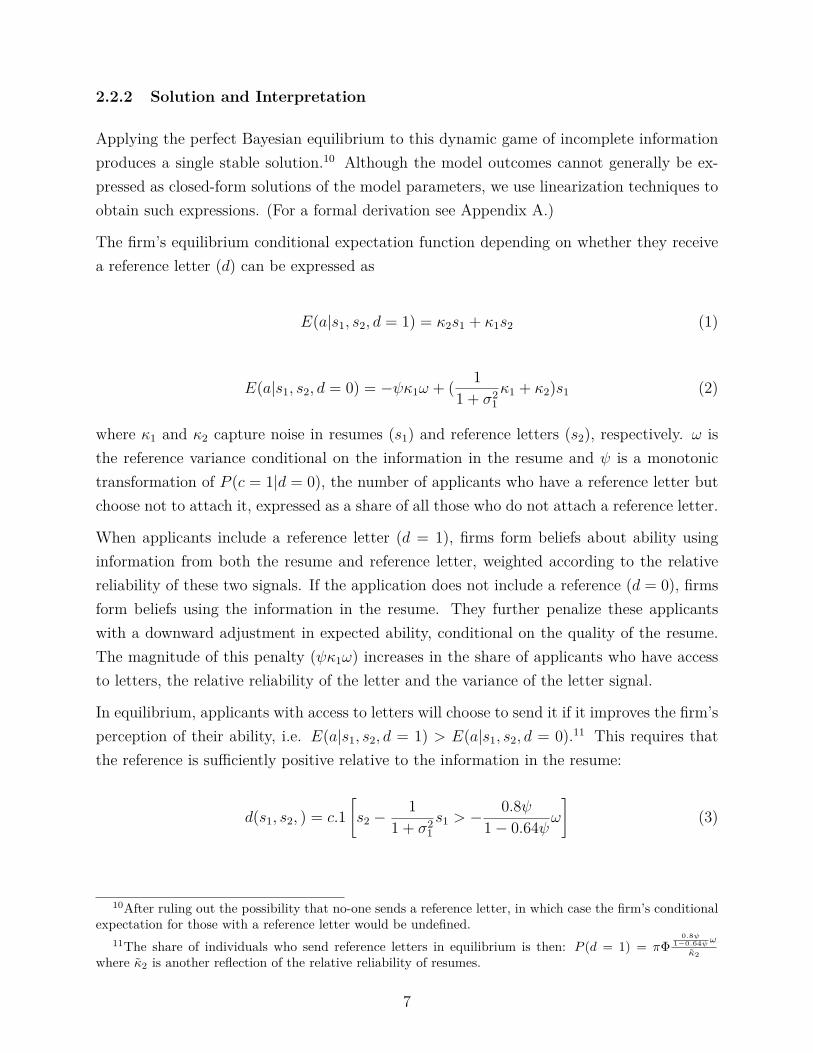
2.2.2 Solution and Interpretation
Applying the perfect Bayesian equilibrium to this dynamic game of incomplete informationproduces a single stable solution.10 Although the model outcomes cannot generally be ex-pressed as closed-form solutions of the model parameters, we use linearization techniques toobtain such expressions. (For a formal derivation see Appendix A.)
The firm’s equilibrium conditional expectation function depending on whether they receivea reference letter (d) can be expressed as
E(a|s1, s2, d = 1) = κ2s1 + κ1s2 (1)
E(a|s1, s2, d = 0) = −ψκ1ω + ( 11 + σ2
1κ1 + κ2)s1 (2)
where κ1 and κ2 capture noise in resumes (s1) and reference letters (s2), respectively. ω isthe reference variance conditional on the information in the resume and ψ is a monotonictransformation of P (c = 1|d = 0), the number of applicants who have a reference letter butchoose not to attach it, expressed as a share of all those who do not attach a reference letter.
When applicants include a reference letter (d = 1), firms form beliefs about ability usinginformation from both the resume and reference letter, weighted according to the relativereliability of these two signals. If the application does not include a reference (d = 0), firmsform beliefs using the information in the resume. They further penalize these applicantswith a downward adjustment in expected ability, conditional on the quality of the resume.The magnitude of this penalty (ψκ1ω) increases in the share of applicants who have accessto letters, the relative reliability of the letter and the variance of the letter signal.
In equilibrium, applicants with access to letters will choose to send it if it improves the firm’sperception of their ability, i.e. E(a|s1, s2, d = 1) > E(a|s1, s2, d = 0).11 This requires thatthe reference is sufficiently positive relative to the information in the resume:
d(s1, s2, ) = c.1[s2 −
11 + σ2
1s1 > −
0.8ψ1− 0.64ψω
](3)
10After ruling out the possibility that no-one sends a reference letter, in which case the firm’s conditionalexpectation for those with a reference letter would be undefined.
11The share of individuals who send reference letters in equilibrium is then: P (d = 1) = πΦ0.8ψ
1−0.64ψω
κ2where κ2 is another reflection of the relative reliability of resumes.
7

2.2.3 Predictions
Implicit in the model setup are two testable assumptions about the information provided byreference letters: i) letters are informative about the applicant’s ability, i.e. δE(s2|a)
δa > 0 , andii) letters contain information that is not already contained in the applicant’s resume, i.e.δE(s2|a,s1)
δa > 0. Under these assumptions, the model makes the following predictions abouthow job seekers use letters and how firms respond to receiving letters.
1. Hiring probability: Firms will be more likely to hire candidates with stronger letters:∂P (h=1|s1,s2,d=1)
∂s2> 0.
2. Screening on ability: Letters results in a closer mapping from ability to job offers:E(a|h = 1, d = 1) > E(a|h = 1, d = 0).
3. Credibility: Since the effect of reference letters depends on their relative reliability (κ2),any attribute that casts doubt over their reliability (e.g. not providing contact infor-mation or being implausibly positive) reduces their effectiveness: ∂2P (h=1|s1,s2,d=1)
∂s2∂κ2< 0.
4. Variance in (prior) beliefs:
(a) If employers are more uncertain about ability of job seekers, then the content ofreference letters matters more: ∂2P (h=1|s1,s2,d=1)
∂σ21∂s2
= σ22
(σ22+σ2
1σ22+σ2
1)2 > 0.
(b) Evidence suggests that in our study context, employers are more uncertain aboutskills of female job seekers. The content of women’s letters therefore has a largereffect on the hiring probability:∂P (h=1|s1,s2,d=1,female)
∂s2> ∂P (h=1|s1,s2,d=1,male)
∂s2.
5. Usage of letters:
(a) As more job seekers gain access to reference letters (π), the usage will increase fortwo reasons: i) mechanically, more people will have access to positive letters thatmeet condition 3, and ii) on the margin, people with less positive letters will useit as the penalty of not sending the letter (ψκ1ω) increases.
(b) As access to and usage of letters increase, the ability of firms to identify higherability candidates improves: ∂2P (h=1)
∂aδπ> 0.
The next section describes the experiments we conduct. Section 4 reports results on thevalue of reference letters (Predictions 1 and 2). Section 5 provides evidence on the roleof credibility (Prediction 3) and variance in prior beliefs (Prediction 4), as well as the twotestable assumptions regarding the letters’ content. Appendix B provides simulation results
8
on how the effects of reference letters change as they become more widely adopted (Prediction5). This framework presents a rational benchmark model, which assumes that job seekershave correct beliefs about the value of reference letters. We revisit this assumption in Section6.
3 Study Design
This section first describes the sampling and the process of eliciting reference letters commonto all three experiments. We then describe each of the experimental designs in detail.
3.1 Study Sample
Our target population are unemployed youths between the ages of 18 and 34.12 We limitour study sample to African unemployed job seekers who have some form of previous workexperience (as our interventions tests reference letter from previous employers), have notcompleted university-level tertiary education and live within traveling distance from ourfour implementing labor centers in the Gauteng and Limpopo provinces.
Job seekers who meet these criteria were randomly selected from the Employment ServicesSouth Africa (ESSA) data base. We further stratify the sample by gender to facilitate sub-group analysis. In the recruitment call, surveyors explain that the job seeker is invited toparticipate in an employment service study at the local labor center on a specified day. In re-turn, they receive a stipend of 30 Rand (2 USD) to cover travel costs. Across all experiments,67% of the successfully contacted unemployed individuals agreed to participate.13
3.2 Obtaining Reference Letters
We conducted more than 30 interviews with employers who frequently mentioned the im-portance of contactable references in the screening process. When asked what information
12Table A.3 provides summary statistics for job seekers in our sample: 50.2% are female and the averageage is 27.3 years. The average level of education is 12.1 years and 67% have completed secondary school(matric). 7% of participants are married and they have on average one child. 11.4% receive unemploymentinsurance and the average participant spends 14 hours per week searching for work.
13Using the limited demographic information provided in ESSA, we find that age and gender are notcorrelated with the decision to participate. By contrast, every year of additional education increases theprobability of participation by 1.6 percentage points (p-value: 0.063). Of those that agree to participate,63.5% showed up at the labor center on the specified day. None of the socioeconomic variables predictwhether participants fail to show up at the agreed time and day.
9

they collect from references, employers listed both non-cognitive skills like motivation, reli-ability and work ethic as well as cognitive skills like numeracy and literacy. They are alsointerested in the nature of the relationship between the referee and job seeker and why theemployment relationship ended. Based on this feedback, we designed a reference letter tem-plate that employers can easily fill out. (Figure A.1 shows the template. For examples ofcompleted reference letters see Figure A.2.)
The study employs an encouragement design implemented in cooperation with the Depart-ment of Labour (DoL). A baseline survey is administered through an in-person interview atthe labor center, followed by an aptitude test that evaluates basic math and literacy skills.14
Next, participants assigned to the treatment group have a brief individual meeting explain-ing how to use reference letters in the job search. This is followed by a discussion of the jobseekers’ work history and identification of potential referees. We provide job seekers withseveral hard copies of the template and instructions on how to return the completed letterto us. After one week, participants receive a text message reminding them to obtain andreturn the reference letter.
31% of encouraged job seekers returned the completed letter. In surveys after five weeks, 42%of people claim to have obtained a letter. Table A.1 investigates which characteristics arecorrelated with the probability of obtaining a letter. Age is the only statistically significantpredictor of receiving a letter. However, there are likely unobservable variables correlatedwith the propensity to obtain a letter.15
Table A.2 provides summary statistics of the reference letter content, converting employerratings into numeric values (0=below average, 1=average, 2=good, 3=very good). Overall,ratings tend to be positive: on a scale from 0 to 6, the average aggregate hard and soft skillrating is 4.9; 11% have a perfect score of 6. We find that hard skills are slightly less positivelyrated than soft skills (2.3 vs. 2.6 on a 3 point scale; Figure A.6 shows the distribution ofscores). While for most categories women receive slightly more positive ratings, only onegender difference is significant at the 10% level (Team Ability) and one at the 5% level (Howhighly recommended). Note that we do not verify the authenticity of the reference letters.In Section 5, we will explore whether the letter provides truthful information.
14The test takes about 20 minutes and was designed by the researchers. It closely follows standard entrylevel tests used in the hiring process by large employers in South Africa. Figure A.4 shows that results areapproximately normally distributed with a mean (median) joint numeracy and literacy score of 61% (63%).For sample questions see Figure A.3.
15Older job seekers are significantly more likely to have the letter completed, whereas the coefficientsof both education and gender are small in magnitude and not statistically significant (Table A.1). Othercovariates, including search intensity, aptitude, and unemployment spell, are not significantly correlated withthe probability to obtain a letter.
10
3.3 Experimental Designs
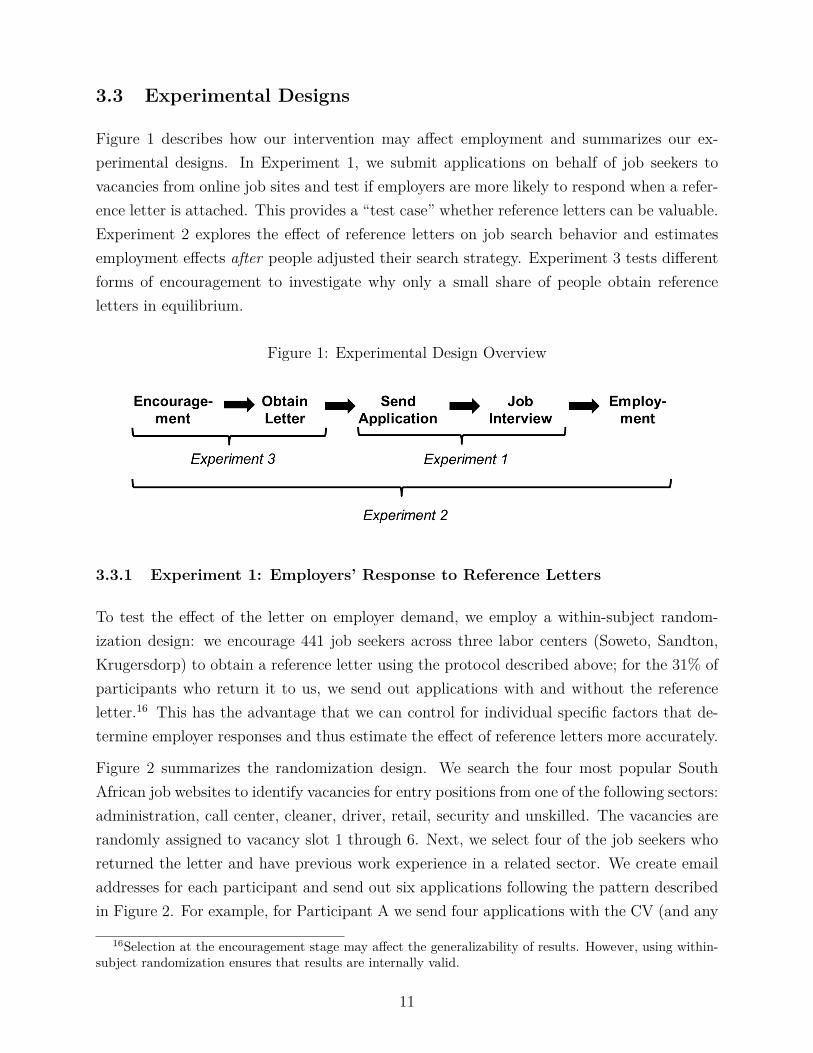
Figure 1 describes how our intervention may affect employment and summarizes our ex-perimental designs. In Experiment 1, we submit applications on behalf of job seekers tovacancies from online job sites and test if employers are more likely to respond when a refer-ence letter is attached. This provides a “test case” whether reference letters can be valuable.Experiment 2 explores the effect of reference letters on job search behavior and estimatesemployment effects after people adjusted their search strategy. Experiment 3 tests differentforms of encouragement to investigate why only a small share of people obtain referenceletters in equilibrium.
Figure 1: Experimental Design Overview
3.3.1 Experiment 1: Employers’ Response to Reference Letters
To test the effect of the letter on employer demand, we employ a within-subject random-ization design: we encourage 441 job seekers across three labor centers (Soweto, Sandton,Krugersdorp) to obtain a reference letter using the protocol described above; for the 31% ofparticipants who return it to us, we send out applications with and without the referenceletter.16 This has the advantage that we can control for individual specific factors that de-termine employer responses and thus estimate the effect of reference letters more accurately.
Figure 2 summarizes the randomization design. We search the four most popular SouthAfrican job websites to identify vacancies for entry positions from one of the following sectors:administration, call center, cleaner, driver, retail, security and unskilled. The vacancies arerandomly assigned to vacancy slot 1 through 6. Next, we select four of the job seekers whoreturned the letter and have previous work experience in a related sector. We create emailaddresses for each participant and send out six applications following the pattern describedin Figure 2. For example, for Participant A we send four applications with the CV (and any
16Selection at the encouragement stage may affect the generalizability of results. However, using within-subject randomization ensures that results are internally valid.
11
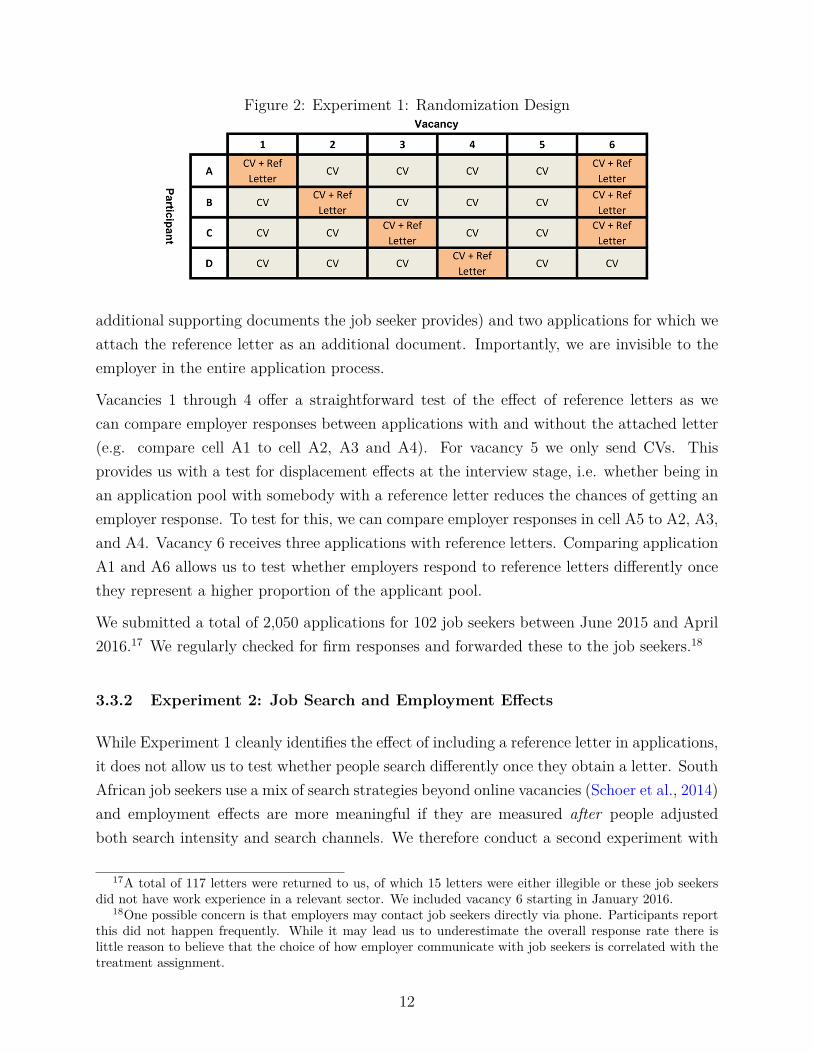
Figure 2: Experiment 1: Randomization Design
additional supporting documents the job seeker provides) and two applications for which weattach the reference letter as an additional document. Importantly, we are invisible to theemployer in the entire application process.
Vacancies 1 through 4 offer a straightforward test of the effect of reference letters as wecan compare employer responses between applications with and without the attached letter(e.g. compare cell A1 to cell A2, A3 and A4). For vacancy 5 we only send CVs. Thisprovides us with a test for displacement effects at the interview stage, i.e. whether being inan application pool with somebody with a reference letter reduces the chances of getting anemployer response. To test for this, we can compare employer responses in cell A5 to A2, A3,and A4. Vacancy 6 receives three applications with reference letters. Comparing applicationA1 and A6 allows us to test whether employers respond to reference letters differently oncethey represent a higher proportion of the applicant pool.
We submitted a total of 2,050 applications for 102 job seekers between June 2015 and April2016.17 We regularly checked for firm responses and forwarded these to the job seekers.18
3.3.2 Experiment 2: Job Search and Employment Effects
While Experiment 1 cleanly identifies the effect of including a reference letter in applications,it does not allow us to test whether people search differently once they obtain a letter. SouthAfrican job seekers use a mix of search strategies beyond online vacancies (Schoer et al., 2014)and employment effects are more meaningful if they are measured after people adjustedboth search intensity and search channels. We therefore conduct a second experiment with
17A total of 117 letters were returned to us, of which 15 letters were either illegible or these job seekersdid not have work experience in a relevant sector. We included vacancy 6 starting in January 2016.
18One possible concern is that employers may contact job seekers directly via phone. Participants reportthis did not happen frequently. While it may lead us to underestimate the overall response rate there islittle reason to believe that the choice of how employer communicate with job seekers is correlated with thetreatment assignment.
12

a separate sample in which half of the job seekers receive the encouragement treatmentdescribed in Section 3.2.
A total of 1,267 participants are part of this sample and were initially surveyed betweenSeptember 2015 and February 2016. Participants are invited to come to the labor centeron a certain date, randomly assigned to either control or treatment days. The same callingscript is used for the control and treatment group to ensure that there is no differentialselection. The share of invited participants who show up are very similar (64.2% referenceletter, 63% control group, p-value of test of equal coefficient: 0.55). Table A.3 suggests thatthe randomization was successful.
To track job search activities and employment outcomes over time, we conduct phone surveysfive weeks and three months after the treatment.19 One potential shortcoming of any surveydata is that it is self-reported. We therefore complement the survey data with an observedmeasure of job search. Specifically, study participants are notified about a vacancy and areasked to submit their full application via email in case they are interested.20
3.3.3 Experiment 3: Barriers to Obtaining Letters
Results discussed in more detail below suggest that reference letters substantially increasethe probability of receiving an employer response. This raises the question of why only about2% of job seekers in the control group use reference letters in their job search. Experiment3 tests different barriers to obtaining reference letters.
During follow up surveys, a significant share of participants could not provide us with areason why they have not tried to obtain the letter or cited reasons like “No Time” or thatthey do not need it. This may be a sign that job seekers do not believe they benefit from thesereference letters or are in other ways insufficiently incentivized to obtain them. We designtwo interventions to test potential explanations for low take-up: i) provide job seekers withinformation on the effectiveness of letters and ii) compensate participants with 100 Rand(about half a daily wage) in cell phone airtime if they obtain a letter.
A group of 438 job seekers, previously encouraged to obtain a letter, receives a follow-uptext message to their cell phone and (if provided) email address reminding them of how to
19Table A.4 shows that attrition rate increases from about 6% in wave 1 to 17% in wave 2, likely due tosurvey fatigue and participants switching phone numbers. Attrition is clearly not random: younger and lesseducated participants are more likely to attrite, but importantly rates do not differ between treatment andcontrol group.
20Participants were informed about a vacancy in a specific sector. Among those with work experiencein multiple sectors, we randomly chose for which sector we notify them. For job seekers for who we do nothave information on previous sectors, we send a general notification about a vacancy. Sectoral shares werebalanced by treatment status. Applications were submitted to actual vacancies after the end of the lastsurvey wave so that it would not confound employment estimates.
13
return the completed letter to us. Participants were randomized into three groups.21 Thecontrol group received only this reminder. The other two groups received one of the followingadditional messages:
• “Research suggests reference letters almost double chances of getting a job interview.”(Information)
• “To compensate your costs, you get 100 Rand airtime after sending us the completedletter.” (Compensation)
4 Do Reference Letters Have Value?
4.1 Empirical Strategy
This section tests the effect of the reference letter on firm demand using data from Ex-periment 1. We use two measures of employer response: i) a narrow measure of interestthat captures interview requests and ii) a broader measure of interest that captures eitheran interview request or a different employer response (most commonly, firms asked ques-tions, requested specific documents, or provided more information about the job and askedif job seekers were still interested). Throughout the analysis we will report results for bothoutcomes.
To estimate the effect of the reference letter, we estimate the following model:
yis = βRefi + λs + µk + es (4)
Outcome yis is a binary variable measuring whether employers respond to application i ofperson s. Refi is an indicator variable for whether a reference letter was included withapplication i. λs and µk capture individual and sector fixed effects, respectively. The errorterm es is clustered at the individual level. The coefficient of interest β captures the causaleffect of the reference letters.
4.2 Employer Responses
Table 1 reports results from Specification 4. Column 1 to 4 report effects using the broadmeasure of interest as an outcome and Column 5 to 8 report effects on interview requests.
21Comparing observable characteristics between the treatment and control group suggests that random-ization was successful (Table A.5).
14

On a control mean of 4.15 percent, the reference letter increases the chance of getting anyemployer response by 2.54 percentage points (61%) (1) and on getting an interview requestby 1.54 percentage points (64%) on a control mean of 2.4 percent (4). Coefficients are robustto including sector and individual fixed effects (Column 2, 3, 6, 7). Treatment coefficientsfor both outcomes are substantially higher for women, although the difference across genderis not statistically significant.22
Do employers respond differently if they receive multiple applications with reference letters?We estimate Specification 4 including an interaction term between the reference letter vari-able and an indicator variable for vacancy 6, which received three applications with letters.The coefficient on the interaction term is very close to zero indicating that the effect doesnot differ if the employer receives more than one letter (Table A.6, Column 2, 5). Theseresults suggest that it is not the novelty of seeing a reference letter that is driving the positiveemployer response.
Next, we test if there is a negative effect from being in the applicant pool with a job seekerwho submits a reference letter. We include a dummy for pure control applications (sentto vacancy 5) in Specification 4. Coefficients in Table A.6 are small in magnitude and notstatistically significant (3, 6). However, these coefficients are estimated relatively impreciselyand we cannot rule out the possibility of displacement.
4.3 Screening Ability
The starting premise of the paper is that information asymmetries inhibit firms to identifythe most suitable candidates. Following the model in Section 2.2, we assume that there isan ability parameter a, imperfectly observed by the firm at the time of the application. Asa proxy for productivity, we employ standardized results of the aptitude test administeredas part of the baseline survey.
To test whether the letters enable firms to identify applicants of high ability, we estimatethe following model:
yis = βRefi + γas + δRefi ∗ as + µk + es (5)
Coefficient γ captures whether employers select higher ability applicants when only the CV isattached and γ+δ is the effect when the letter is attached. Results are presented in Table 2. Itis noteworthy that the coefficient γ is small in magnitude and not significant suggesting that
22Within the sample of women, we find significant effects for the interest outcome (at the 1% level) andinterview outcome (at the 5% level).
15

without the reference letter, firms are ineffective in selecting the more productive applicants.δ is positive indicating that reference letters enable firms to identify applicants of higherability (despite not seeing the aptitude score). The coefficients are significant at the 5% leveland large in magnitude (Column 1, 3). For applications with reference letters, a one standarddeviation higher performance in the aptitude test increases the probability of receiving anemployer response and interview request by an additional 2 percentage points (47%) and 1.3percentage points (54%), respectively. Put differently, in control applications the chance ofreceiving an employer response for job seekers at the 90th ability percentile is 1.8 percentagepoints (35%) higher compared to those at the 10th percentile. Once the reference letter isincluded, this figure increases to 6.3 percentage points (123%). This is one of our key results,as economic theory predicts that an improvement in screening ability increases firms’ labordemand. Note also that these improvements in firms’ screening ability do not differ by thegender of the job seeker (Column 2, 4).
4.4 Employment Effects
To test whether reference letters increase firm responses and employment when used by jobseekers, we use data from Experiment 2 and estimate the following model:
yij = βTi + γXi + δybsij + λj + ei (6)
The dependent variable yij is measured for individual i residing in location j. We focus onthree key outcomes: number of applications submitted and job interviews in the last fourweeks, and employment status. In order to increase precision we control for the baselinevalue ybsij of outcomes. To account for differences in firm demand across space, we controlfor location fixed effects λj. Robust standard errors are computed at the individual level.Results from the audit study (Table 1) suggest that the effect of reference letters may differby gender. We therefore also estimate specification 6 separately for women and men.
Columns 1 to 3 in Table 3 report intent to treat (ITT) effects after three months. Columns4 to 6 report local average treatment effects (LATE) estimated with 2SLS, using the randomencouragement assignment to instrument for the take-up of reference letters. Results in thepooled sample are inconclusive (Panel A): coefficients on both the number of applicationssubmitted and on employment outcomes are sizable - LATE estimates range between 20%and 30% of the control mean - but not statistically significant.
Panel B and C show that there is important treatment effect heterogeneity by gender: afterthree months, women in the treatment group submit more applications and are significantly
16

more likely to receive interviews and find employment. Employment effects are large inmagnitude: 5.7 percentage points for ITT estimates (3) and 11.7 p.p. for LATE estimates(6), effectively doubling employment rates for the group of compliers. Coefficients for menare close to zero and insignificant. We can reject that employment coefficients for womenand men are equal at the 10 percent level. While estimates are relatively imprecise, theseresults show that reference letters can improve employment outcomes.23
Overall, the results presented in Section 4 provide support for Prediction 1 and 2. Next, weexplore the mechanism underlying these large and significant effects of reference letters.
5 How Do Firms Use Reference Letters?
5.1 Are letters informative?
This section tests the two key assumptions necessary for reference letters to be effective:they must be informative of applicants’ skills and provide information that cannot easilybe inferred from other application documents. We test these assumptions by comparingsubjective employer ratings to an objective assessment. Specifically, we regress results fromthe aptitude test we administer on the ratings provided by employers on numeracy andliteracy. Table 4 shows that employer ratings and test results are highly correlated for bothliteracy (1) and numeracy (4). This implies that the average letter contains informationabout the applicant’s skills. Next, we explore how the correlation changes when we controlfor additional covariates (age, education, gender) and school grades in English and math,respectively. While the magnitude of the coefficients decreases, they stay highly significantsuggesting that the letter contains information that employers cannot easily infer from theresume (2, 5).24 Results do not differ by gender, ruling out that treatment effects are largerfor women because their reference letters are more informative (3, 6).
These results confirm that referee ratings contain additional information, at least for skillscaptured in the aptitude test. Arguably, it would be even more difficult for firms to learnabout other skills from the CV, especially non-cognitive skills like reliability or work ethics(Aamodt, 2015).
23Table A.7 reports results after five weeks. Results are smaller and insignificant, possibly because thefollow up period is too short as many participants report that it takes them longer to obtain a referenceletter.
24Groh et al. (2016) employ a similar test on a sample of unemployed youths in Jordan and find that resultsfrom psychometric and skill tests have predictive power for subsequent employment, even after controllingfor easily observable worker characteristics. Abebe et al. (2016) find that the job search workshop improvesfirms’ ability to identify applicants’ whose observable characteristics predict higher performance in aptitudetests.
17
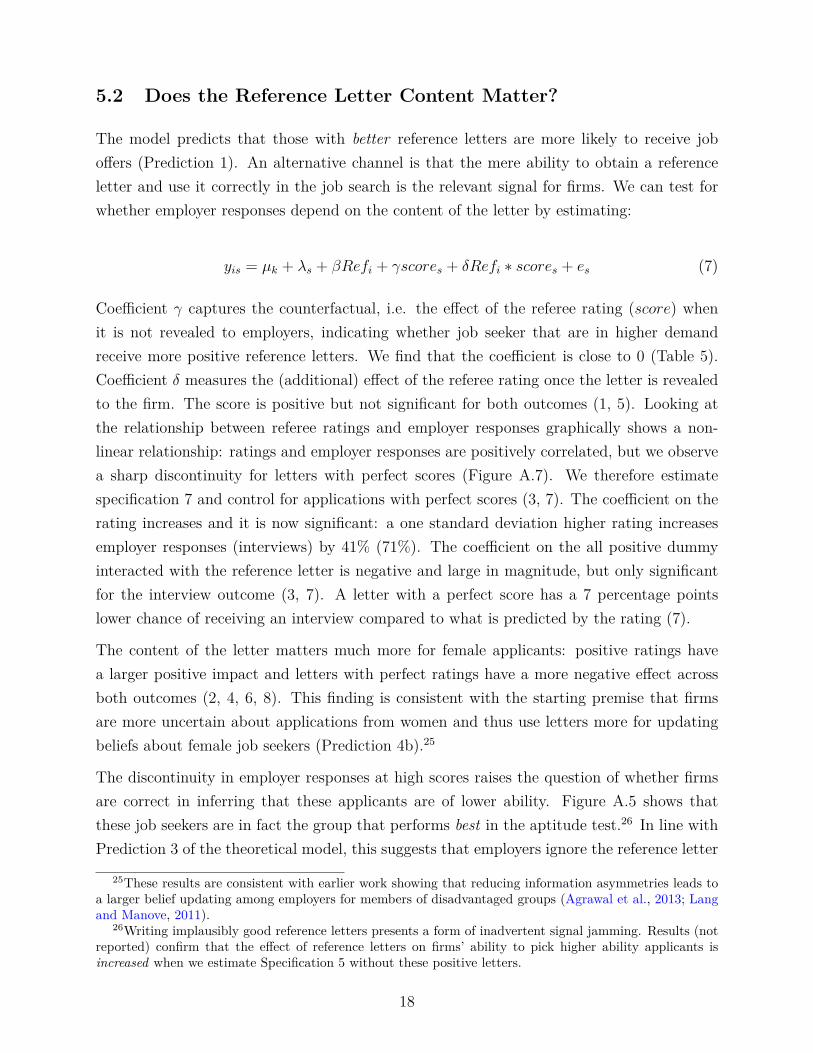
5.2 Does the Reference Letter Content Matter?
The model predicts that those with better reference letters are more likely to receive joboffers (Prediction 1). An alternative channel is that the mere ability to obtain a referenceletter and use it correctly in the job search is the relevant signal for firms. We can test forwhether employer responses depend on the content of the letter by estimating:
yis = µk + λs + βRefi + γscores + δRefi ∗ scores + es (7)
Coefficient γ captures the counterfactual, i.e. the effect of the referee rating (score) whenit is not revealed to employers, indicating whether job seeker that are in higher demandreceive more positive reference letters. We find that the coefficient is close to 0 (Table 5).Coefficient δ measures the (additional) effect of the referee rating once the letter is revealedto the firm. The score is positive but not significant for both outcomes (1, 5). Looking atthe relationship between referee ratings and employer responses graphically shows a non-linear relationship: ratings and employer responses are positively correlated, but we observea sharp discontinuity for letters with perfect scores (Figure A.7). We therefore estimatespecification 7 and control for applications with perfect scores (3, 7). The coefficient on therating increases and it is now significant: a one standard deviation higher rating increasesemployer responses (interviews) by 41% (71%). The coefficient on the all positive dummyinteracted with the reference letter is negative and large in magnitude, but only significantfor the interview outcome (3, 7). A letter with a perfect score has a 7 percentage pointslower chance of receiving an interview compared to what is predicted by the rating (7).
The content of the letter matters much more for female applicants: positive ratings havea larger positive impact and letters with perfect ratings have a more negative effect acrossboth outcomes (2, 4, 6, 8). This finding is consistent with the starting premise that firmsare more uncertain about applications from women and thus use letters more for updatingbeliefs about female job seekers (Prediction 4b).25
The discontinuity in employer responses at high scores raises the question of whether firmsare correct in inferring that these applicants are of lower ability. Figure A.5 shows thatthese job seekers are in fact the group that performs best in the aptitude test.26 In line withPrediction 3 of the theoretical model, this suggests that employers ignore the reference letter
25These results are consistent with earlier work showing that reducing information asymmetries leads toa larger belief updating among employers for members of disadvantaged groups (Agrawal et al., 2013; Langand Manove, 2011).
26Writing implausibly good reference letters presents a form of inadvertent signal jamming. Results (notreported) confirm that the effect of reference letters on firms’ ability to pick higher ability applicants isincreased when we estimate Specification 5 without these positive letters.
18

signal if it is perceived to be implausibly positive and thus deemed non-credible. After all, itis unclear why the firm did not continue to employ these job seekers if they are “very good”at every skill.27
These findings provide empirical support for studies that explore the role of credibility ofsignals. Clark and Martorell (2011) conclude that in addition to providing relevant informa-tion, signals must be verifiable in order to be of value. Avery and Meyer (2011) echo thisargument and observe that there is no universal standard for the assessment procedure, nordatabases on the history of past recommendations. This induces evaluators to be biased,which reduces their usefulness in the hiring process (Avery and Meyer, 2011).
6 Why are Reference Letters Not More Widely Used?
The previous section showed that both job seekers and firms benefit from reference letters:they increase workers’ chances of receiving callbacks and help employers to pick job seekersof higher ability. This raises the question of why the market is in a near pooling equilibriumin which reference letters are almost completely absent. The previous analysis rules outtwo of the most obvious explanations, confirming that reference letters contain additionalinformation and, despite being sent by job seekers, employers use them to update beliefs.This section explores additional explanations on the part of previous employers, hiring firmsand job seekers.
6.1 The Role of Previous Employers, Hiring Firms and Job Seek-ers
6.1.1 Previous Employers
We ask job seekers to bring all their application documents to the initial meeting at thelabor center. We find that among job seekers with previous work experience, only about 4%have a reference letter from a former employer. When probed, 86.4% of job seekers reportthat they “Did not ask”, while only 3.1% report that they asked but the employer refused(Table 6). It is however possible that many job seekers did not ask because they correctlypredict that employers would not be willing to write a letter. We can exploit results from
27A uniform rating may also indicate that the referee did not take the time to carefully consider eachcategory. However, we do not find that the effect of these uniform assessments differs for letters that includemore detailed comments on skill categories, suggesting that the negative effect is not due to a perceived lackof effort of the referee.
19
our encouragement design to test this hypothesis. Five weeks after the treatment, 56% ofjob seekers report that they have tried to obtain a letter. Of this group, 73.6% succeeded.Among those that tried, only 4.1% report that they failed to obtain a letter because theemployer refused.
6.1.2 Hiring Firm
Results in Section 4 indicate that firms believe letters (unless they are implausibly positive),use them to update beliefs about job seekers, and benefit as it enables them to select peopleof higher ability. Interviews with hiring managers further shows that they recognize that jobseekers do not have any bargaining power to request letters. Firms therefore do not requireapplicants to submit letters.
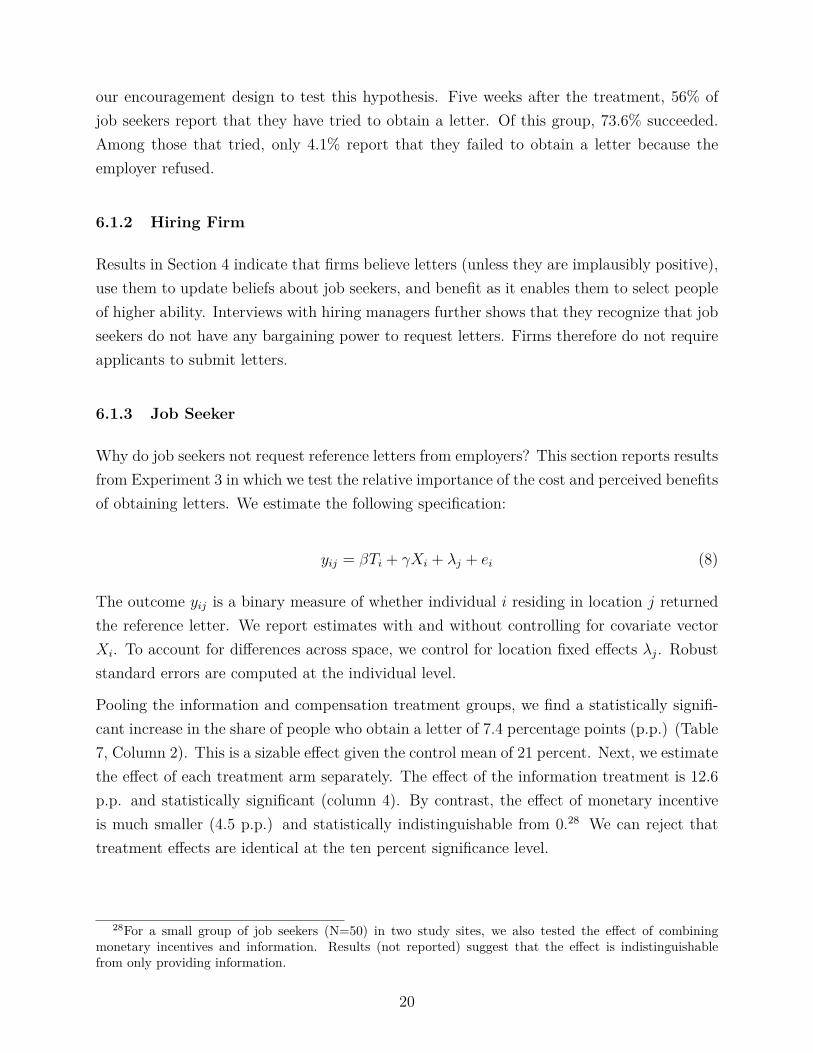
6.1.3 Job Seeker
Why do job seekers not request reference letters from employers? This section reports resultsfrom Experiment 3 in which we test the relative importance of the cost and perceived benefitsof obtaining letters. We estimate the following specification:
yij = βTi + γXi + λj + ei (8)
The outcome yij is a binary measure of whether individual i residing in location j returnedthe reference letter. We report estimates with and without controlling for covariate vectorXi. To account for differences across space, we control for location fixed effects λj. Robuststandard errors are computed at the individual level.
Pooling the information and compensation treatment groups, we find a statistically signifi-cant increase in the share of people who obtain a letter of 7.4 percentage points (p.p.) (Table7, Column 2). This is a sizable effect given the control mean of 21 percent. Next, we estimatethe effect of each treatment arm separately. The effect of the information treatment is 12.6p.p. and statistically significant (column 4). By contrast, the effect of monetary incentiveis much smaller (4.5 p.p.) and statistically indistinguishable from 0.28 We can reject thattreatment effects are identical at the ten percent significance level.
28For a small group of job seekers (N=50) in two study sites, we also tested the effect of combiningmonetary incentives and information. Results (not reported) suggest that the effect is indistinguishablefrom only providing information.
20
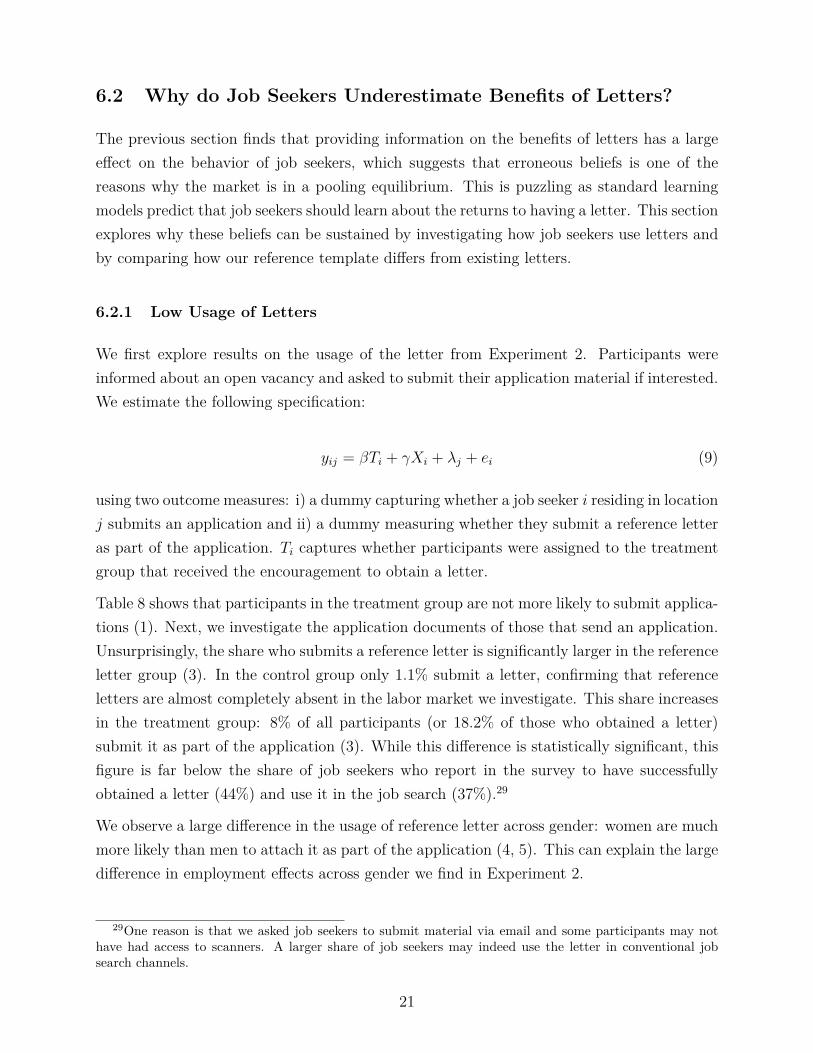
6.2 Why do Job Seekers Underestimate Benefits of Letters?
The previous section finds that providing information on the benefits of letters has a largeeffect on the behavior of job seekers, which suggests that erroneous beliefs is one of thereasons why the market is in a pooling equilibrium. This is puzzling as standard learningmodels predict that job seekers should learn about the returns to having a letter. This sectionexplores why these beliefs can be sustained by investigating how job seekers use letters andby comparing how our reference template differs from existing letters.
6.2.1 Low Usage of Letters
We first explore results on the usage of the letter from Experiment 2. Participants wereinformed about an open vacancy and asked to submit their application material if interested.We estimate the following specification:
yij = βTi + γXi + λj + ei (9)
using two outcome measures: i) a dummy capturing whether a job seeker i residing in locationj submits an application and ii) a dummy measuring whether they submit a reference letteras part of the application. Ti captures whether participants were assigned to the treatmentgroup that received the encouragement to obtain a letter.
Table 8 shows that participants in the treatment group are not more likely to submit applica-tions (1). Next, we investigate the application documents of those that send an application.Unsurprisingly, the share who submits a reference letter is significantly larger in the referenceletter group (3). In the control group only 1.1% submit a letter, confirming that referenceletters are almost completely absent in the labor market we investigate. This share increasesin the treatment group: 8% of all participants (or 18.2% of those who obtained a letter)submit it as part of the application (3). While this difference is statistically significant, thisfigure is far below the share of job seekers who report in the survey to have successfullyobtained a letter (44%) and use it in the job search (37%).29
We observe a large difference in the usage of reference letter across gender: women are muchmore likely than men to attach it as part of the application (4, 5). This can explain the largedifference in employment effects across gender we find in Experiment 2.
29One reason is that we asked job seekers to submit material via email and some participants may nothave had access to scanners. A larger share of job seekers may indeed use the letter in conventional jobsearch channels.
21

Overall, these results suggest that low usage of the reference letters stifles the feedback thatjob seekers receive about reference letters from the market. The resulting failure to learn isfurther compounded by the overall low level of search activity among job seekers. Resultsin Section 4 show that the letter reduces the number of applications needed to obtain anemployer response from 25 to 15 and an interview request from 40 to 28. However, at baselinethe average job seeker only submits about 4 applications per month.
6.2.2 Existing Reference Letters Are Less Informative
A second reason why job seekers may underestimate the potential benefit of reference lettersis that the type of letter in circulation at the time of the baseline is in fact of lower value.Our model predicts that the effectiveness depends on the noisiness of the reference letterrelative to the resume. Reviewing a total of 30 reference letters collected from job seekers inour sample at the time of baseline provides strong support for this hypothesis: the majorityof letters lack information on the workers’ position (48% include this information), respon-sibilities (38%), skills (28%) duration of employment (48%), and reason for termination ofemployment (18%). In addition, only 48% of letters are signed and 56% provide contactinformation. If job seekers experiment with reference letters that are both less informativeand credible, they may incorrectly infer that all letters are ineffective.
In-depth interviews with a sample of 28 hiring firms provide further support for this explana-tion. 73% of hiring managers report that our reference letter template is more effective thanother reference letters they receive. The most frequently cited reasons are that the templateprovides information on specific skills (55%) and that it is more clearly structured (32%).30
Asked for reasons that make the template less effective than other letters, managers pointto the lack of a firm letter head or stamp (45%) and that letters are too positive (14%).This corroborates our experimental findings documenting the importance of credibility andsuggests that modifications in the design of the letter may further increase its effectiveness.
7 Conclusion
The internet has drastically reduced information asymmetries across many markets: onlinelabor market require firms to provide public evaluations of employees’ performance and offerworkers to take tests to certify their skills. Services like LinkedIn offer an easy way to
30In addition, the rubric form offers less ambiguous presentation of the assessment than a reference letterin paragraph form. This may particularly benefit women as previous research documents that candidates whoare perceived to be similar by the predominantly male hiring managers receive more favorable evaluations(Cardy and Dobbins, 1986).
22
communicate credentials, work experience and even endorsements from former coworkersand employers. These professional network sites also identify common connections than canserve as informal references. Yet, large parts of the global labor force is working in marketsthat have not been affected by these changes.
Our study investigates the role of information asymmetries in one such market: the low-skill sector in South Africa. We document that information asymmetries are prevalent inthis market and employers struggle to identify high ability job seekers. We find that asimple intervention - encouraging job seekers to obtain a standardized reference letter froma former employer - can lead to substantial improvements in firms’ ability to select job seekersof higher ability from the large pool of applicants. Women, who are excluded from manyinformal referral networks in South Africa, especially benefit from reference letters. Thisdemonstrates that reducing information asymmetries can improve equity in labor markets.
While our study looks at the effects of reference letter in a static framework, reducing infor-mation asymmetries may also have dynamic effects. Similar to other developing countries,South Africa suffers from low quality of education, which limits the use of educational cre-dentials to screen job seekers. This has adverse dynamic effects: if a high school certificateloses its signaling value, youths may be less motivated to study or graduate. Likewise, ifworkers are employed on temporary contracts and their job performance is not revealedto the market, returns to exerting effort are lower. Our results suggest that reference let-ters have the potential to provide a powerful incentive to workers. Reducing informationasymmetries may therefore have positive effects on productivity beyond the diminishmentof frictions in the matching process explored in this study. Yet, not having a reference lettermay also pose a barrier for new labor market entrants as letters enhance firms’ ability toscreen applicants with job experience relative to entrants. This could lead to inefficiently lowhiring of people without work experience (Pallais, 2014). Quantifying these dynamic effectsremains the work of future research.
23
References
Aamodt, M. (2015). Industrial organizational psychology (8th ed.). London: Cengage Learn-ing.
Abebe, G., S. Caria, M. Fafchamps, P. Falco, S. Franklin, and S. Quinn (2016). Curse ofAnonymity or Tyranny of Distance? Working Paper .
Agrawal, A., N. Lacetera, and E. Lyons (2013). Does Information Help or Hinder JobAppliants from Less Developed Countries in Online Markets? NBER Working Paper18720 .
Altonji, J. G. and C. R. Pierret (2001). Employer Learning and Statistical DiscriminationAuthor. Quarterly Journal of Economics 116 (1), 313–350.
Autor, D. and D. Scarborough (2008). Does job testing harm minority workers? Evidencefrom retail establishments. The Quarterly Journal of Economics 123 (1), 219–277.
Avery, C. and M. Meyer (2011). Designing Promotion and Hiring Procedures with BiasedEvaluators. Working Paper .
Avery, C., P. Resnick, and R. Zeckhauser (1999). The Market for Evaluations. The AmericanEconomic Review 89 (3), 564–584.
Bassi, V. and A. Nansamba (2017). Information Frictions in the Labor Market: Evidencefrom a Field Experiment in Uganda. mimeo.
Beaman, L., N. Keleher, and J. Magruder (2013). Do Job Networks Disadvantage Women?Evidence from a Recruitment Experiment in Malawi. Working Paper (December).
Beaman, L. and J. Magruder (2012). Who gets the job referral? Evidence from a socialnetworks experiment. The American Economic Review 102 (7), 3574–3593.
Burks, S. V., B. Cowgill, M. Hoffman, and M. Housman (2015). The Value of Hiring throughEmployee Referrals. Quarterly Journal of Economics 130 (2), 805–839.
Card, D., J. Kluve, and A. Weber (2015). Active Labor Market Policy Evaluations: A MetaAnalysis. NBER Working Paper No. 21431.
Cardy, R. and G. Dobbins (1986). Affect and appraisal accuracy: Liking as an integraldimension in evaluating performance. Journal of Applied Psychology 71 (4).
Fafchamps, M. and A. Moradi (2015). Referral and Job Performance : Evidence from theGhana Colonial Army. Economic Development and Cultural Change 63 (4), 715–751.
24
Farber, H. S. and R. Gibbons (1996). Learning and Wage Dynamics. Quarterly Journal ofEconomics 111 (4), 1007–1047.
Gibbons, R. and L. Katz (1991). Layoffs and Lemons. Journal of Labor Economics 9,351–380.
Groh, M., D. McKenzie, and T. Vishwanath (2014). Reducing Information Asymmetries inthe Youth Labor Market of Jordan with Psychometrics and Skill Based Tests. World BankEconomic Review 29 (1), 106–117.
Heckman, J. J. (1998). Detecting Discrimination. The Journal of Economic Perspec-tives 12 (2), 101–116.
Ioannides, Y. M. and L. D. Loury (2004). Job Information Networks , Neighborhood Effects,and Inequality. Journal of Economic Literature 42 (4), 1056–1093.
Kaas, L. and C. Manger (2012). Ethnic Discrimination in Germany’s Labour Market: AField Experiment. German Economic Review 13 (1), 1–20.
Kahn, L. and F. Lange (2014). Employer Learning, Productivity, and the Earnings Distri-bution: Evidence from Performance Measures. The Review of Economic Studies 81 (4),1575–1613.
Kroft, K., F. Lange, and M. J. Notowidigdo (2013). Duration Dependence and Labor MarketConditions: Evidence from a Field Experiment. Quarterly Journal of Economics 128 (3),1123–1167.
Lang, K. and M. Manove (2011). Education and Labor-Market Discrimination. AmericanEconomic Review 101 (4), 1467–1496.
Loury, L. (2006). Some Contacts Are More Equal than Others : Informal Networks, JobTenure, and Wages. Journal of Labor Economics 24 (2), 299–318.
Magruder, J. (2010). Intergenerational networks, unemployment, and persistent inequalityin South Africa. American Economic Journal: Applied Economics 2 (1), 62–85.
Malindi, K. (2016). Wage Effect of Labour Market Experience and Firm Tenure for Blackand White South African Workers. Working Paper .
McCarthy, J. and R. Goffin (2001). Improving the Validity of Letters of Recommendation:An Investigation of Three Standardized Reference Forms. Military Psychology 13 (4),199–222.
25
McKenzie, D. (2017). How Effective Are Active Labor Market Policies in Developing Coun-tries? A Critical Review of Recent Evidence. Working Paper .
Montgomery, B. (1991). Social Networks and Labor-Market Outcomes : Toward an EconomicAnalysis. American Economic Review 81 (5), 1408–1418.
Mortensen, D. and C. Pissarides (1994). Job creation and job destruction in the theory ofunemployment. The Review of Economic Studies 61 (3), 397–415.
Pallais, A. (2014). Inefficient Hiring in Entry-Level Labor Markets. American EconomicReview 104 (11), 3565–3599.
Pallais, A. and E. G. Sands (2016). Why the Referential Treatment? Evidence from FieldExperiments on Referrals. Journal of Political Economy.
Pissarides, C. (1985). Short-Run Equilibrium Dynamics of Unemployment , Vacancies , andReal Wages. American Economic Review 75 (4), 676–690.
Rees, A. (1966). Information Networks in Labor Markets. American Economic Review 56 (1),559–566.
Riach, P. and J. Rich (2004). Deceptive Field Experiments of Discrimination: Are theyEthical? Kyklos 57, 457–470.
Rospabe, S. (2001). An Empirical Evaluation of Gender Discrimination in Employment,Occupation Attainment and Wage in South Africa in the late 1990s. Working Paper .
Schoer, V. and M. Leibbrandt (2006). Determinants of job search strategies: Evidencefrom the Khayelitsha/Mitchell’s Plain survey. South African Journal of Economics 74 (4),702–724.
Schoer, V., N. Rankin, and G. Roberts (2014). Accessing the first job in a slack labourmarket: job matching in South Africa. Journal of International Development 26, 1–22.
Shepherd, D. (2008). Post-Apartheid Trends in Gender Discrimination in South Africa:Analysis through Decomposition Techniques. Working Paper .
StatsSA (2015). National and provincial labour market: Youth. Technical Report Quartile1., Statistics South Africa.
Terviö, M. (2009). Superstars and Mediocrities : Market Failure in the Discovery of Talent.Review of Economic Studies 76 (2), 829–850.
26

Topa, G. (2011). Labor markets and referrals. In Handbook of Social Economics, pp. 1193–1221.
van der Berg, S. (2007). Apartheid’s Enduring Legacy: Inequalities in Education. Journalof African Economies 16 (5), 849–880.
27

Tables
Table 1: Effect of Reference Letter on Call Backy=Employer Response: Interest y=Employer Response: Interview
(1) (2) (3) (4) (5) (6) (7) (8)Reference Letter 0.0254∗∗ 0.0251∗∗ 0.0244∗∗ 0.0105 0.0154∗ 0.0147∗ 0.0144 0.0037
(0.0102) (0.0102) (0.0107) (0.0162) (0.0087) (0.0087) (0.0091) (0.0115)Female -0.0107 -0.0037
(0.0141) (0.0085)Female x Letter 0.0268 0.0203
(0.0211) (0.0163)Sector F.E. N Y Y Y N Y Y YIndividual F.E. N N Y N N N Y NR2 0.003 0.01 0.078 0.009 0.002 0.016 0.057 0.010N 2050 2050 2050 2050 2050 2050 2050 2050Control mean 0.0415 0.0415 0.0415 0.0415 0.0240 0.0240 0.0240 0.0240Notes: ∗ p < 0.10, ∗∗ p < 0.05, ∗∗∗ p < 0.01. Standard errors (reported in parentheses) are clustered at the applicant level. Results report OLS
estimates. Dependent variables are binary measures of employer response: interview requests (Col. 5-8) and either interview request or a
different employer response expressing interest in the job applicant (Col 1-4). Sector fixed effects are included for the six sectors for which we
send applications.
Table 2: Effect of Reference Letter on Screening Productive ApplicantsY=Interest Y=Interview
(1) (2) (3) (4)Reference Letter 0.02575∗∗ 0.00838 0.01555* 0.00522
(0.010) (0.016) (0.009) (0.012)Aptitude (z-score) 0.00618 0.00801 0.00062 0.00047
(0.005) (0.009) (0.003) (0.004)Ref Let x Aptitude (z-score) 0.01999∗∗ 0.01574 0.01305∗∗ 0.01230
(0.008) (0.011) (0.006) (0.008)Ref Let x Female 0.03166 0.02078
(0.022) (0.018)Ref Let x Female x Aptitude (z-score) -0.00271 -0.00807
(0.011) (0.015)R2 0.003 0.008 0.002 0.004N 2050 2050 2050 2050Control mean 0.0415 0.0415 0.0240 0.0240Notes: ∗ p < 0.10, ∗∗ p < 0.05, ∗∗∗ p < 0.01. Standard errors (reported in parentheses) are clustered at the
applicant level. Results report OLS estimates controlling for sector fixed effects. Aptitude is measuring the
standardized English and Math score. For readability reasons, we suppressed coefficients for Female and
Female x Aptitude. These coefficients are small in magnitude and insignificant.
28
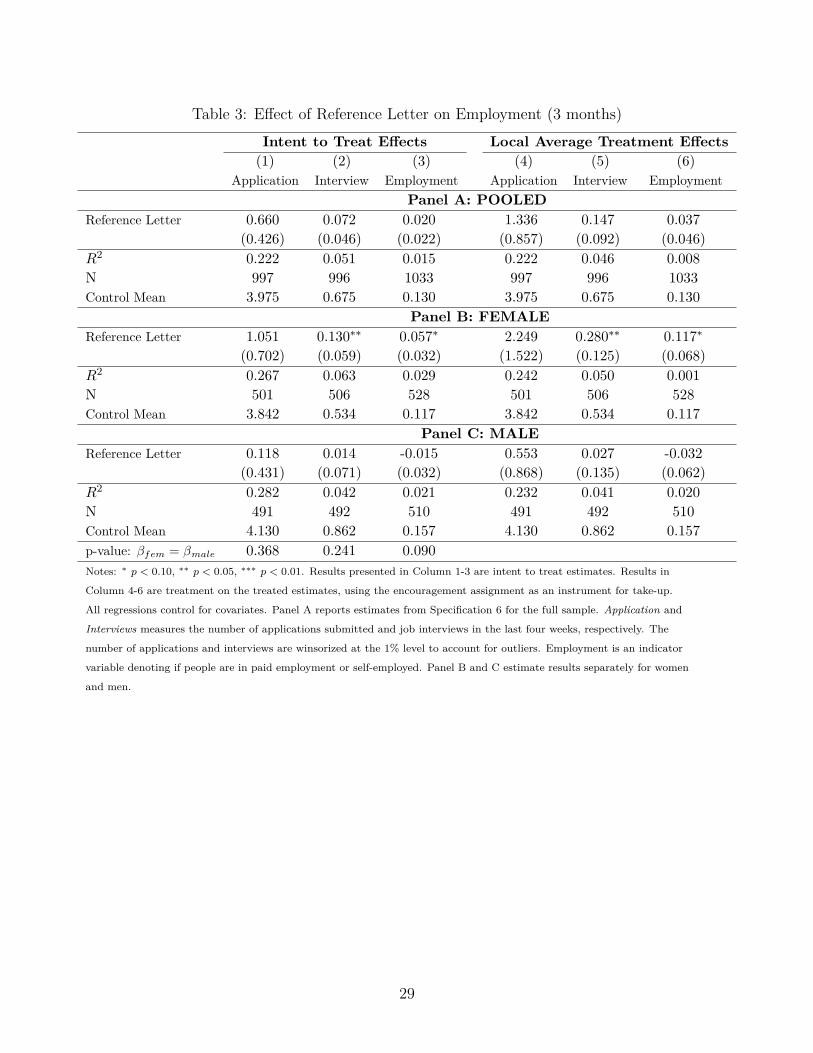
Table 3: Effect of Reference Letter on Employment (3 months)Intent to Treat Effects Local Average Treatment Effects(1) (2) (3) (4) (5) (6)
Application Interview Employment Application Interview EmploymentPanel A: POOLED
Reference Letter 0.660 0.072 0.020 1.336 0.147 0.037(0.426) (0.046) (0.022) (0.857) (0.092) (0.046)
R2 0.222 0.051 0.015 0.222 0.046 0.008N 997 996 1033 997 996 1033Control Mean 3.975 0.675 0.130 3.975 0.675 0.130
Panel B: FEMALEReference Letter 1.051 0.130∗∗ 0.057∗ 2.249 0.280∗∗ 0.117∗
(0.702) (0.059) (0.032) (1.522) (0.125) (0.068)R2 0.267 0.063 0.029 0.242 0.050 0.001N 501 506 528 501 506 528Control Mean 3.842 0.534 0.117 3.842 0.534 0.117
Panel C: MALEReference Letter 0.118 0.014 -0.015 0.553 0.027 -0.032
(0.431) (0.071) (0.032) (0.868) (0.135) (0.062)R2 0.282 0.042 0.021 0.232 0.041 0.020N 491 492 510 491 492 510Control Mean 4.130 0.862 0.157 4.130 0.862 0.157p-value: βfem = βmale 0.368 0.241 0.090Notes: ∗ p < 0.10, ∗∗ p < 0.05, ∗∗∗ p < 0.01. Results presented in Column 1-3 are intent to treat estimates. Results in
Column 4-6 are treatment on the treated estimates, using the encouragement assignment as an instrument for take-up.
All regressions control for covariates. Panel A reports estimates from Specification 6 for the full sample. Application and
Interviews measures the number of applications submitted and job interviews in the last four weeks, respectively. The
number of applications and interviews are winsorized at the 1% level to account for outliers. Employment is an indicator
variable denoting if people are in paid employment or self-employed. Panel B and C estimate results separately for women
and men.
29

Table 4: Are Numeracy and Literacy Employer Ratings Correlated with Aptitude?Literacy: Reference Letter (z-score) Numeracy: Reference Letter (z-score)
(1) (2) (3) (4) (5) (6)Literacy: Aptitude 0.3645∗∗∗ 0.2274∗∗ 0.2458∗∗
(z-score) (0.0935) (0.1026) (0.1185)Female x Literacy Apt -0.04907
(z-score) (0.2066)Numeracy: Aptitude 0.3001∗∗∗ 0.2627∗∗∗ 0.25585∗
(z-score) (0.0885) (0.0966) (0.1381)Female x Numeracy Apt 0.01548
(z-score) (0.1788)Covariate N Y Y N Y YSchool Grade N Y Y N Y YR2 0.136 0.232 0.232 0.093 0.116 0.116N 116 116 116 114 114 114Notes: ∗ p < 0.10, ∗∗ p < 0.05, ∗∗∗ p < 0.01. The dependent variable is the standardized value of the numeric employer rating
(0=below average, 3=very good). Literacy and Numeracy measure the standardized performance in the aptitude test. Control
variables include age, gender and education. School grade is measuring the grade (in %) participants achieved in the last math and
English class, respectively.
30

Table 5: Effect of Referee Rating on Call BackY=Interest Y=Interview
(1) (2) (3) (4) (5) (6) (7) (8)Reference Letter 0.0371 -0.0014 0.0441 -0.0033 0.0447 0.0268 0.0531 0.0156
(0.0561) (0.0605) (0.0544) (0.0584) (0.0469) (0.0519) (0.0454) (0.0502)Referee Rating (z-score) -0.0006 0.0101 -0.0030 0.0083 0.0014 0.0044 0.0007 0.0060
(0.0057) (0.0084) (0.0056) (0.0065) (0.0040) (0.0057) (0.0045) (0.0060)Letter x Rating (z-score) 0.0077 -0.0120 0.0167∗ -0.0065 0.0057 0.0002 0.0169∗ 0.0009
(0.0086) (0.0127) (0.0089) (0.0117) (0.0080) (0.0084) (0.0092) (0.0091)Letter x Rating x Female 0.0396∗∗ 0.0558∗∗∗ 0.0089 0.0368∗∗
(0.0184) (0.0188) (0.0140) (0.0162)All positive 0.0164 0.0211 0.0048 -0.0288∗∗
(0.0266) (0.0766) (0.0140) (0.0131)Letter x All positive -0.0584 -0.0708 -0.0731∗∗∗ 0.0016
(0.0353) (0.0809) (0.0248) (0.0183)Letter x All positive x Female -0.0213 -0.1265∗∗∗
(0.0897) (0.0358)R2 0.014 0.016 0.015 0.019 0.014 0.015 0.017 0.021N 2050 2050 2050 2050 2050 2050 2050 2050Control content Y Y Y Y Y Y Y YControl mean 0.0415 0.0415 0.0415 0.0415 0.0240 0.0240 0.0240 0.0240Notes: ∗ p < 0.10, ∗∗ p < 0.05, ∗∗∗ p < 0.01. Standard errors (reported in parentheses) are clustered at the applicant level. Total Score measures
the average employer rating converted to numeric values (out of 6). All positive is a indicator variable for whether employers give a perfect
rating. We estimate the model with all interaction terms but suppress coefficients for readability reasons. All columns control for other content
revealed in the reference letter. We include dummy variables for five reference letters that did not include a rating.
31

Table 6: Reasons for Low Prevalence of Reference LettersN Mean
Why do you not have a letter? (Baseline)I did not ask 936 0.864Employer refused 936 0.031It was not requested 936 0.016Other 936 0.089
Did you try to obtain a letter? (After encouragement)Yes 618 0.56If No, Why did you not try?Travel Cost / Distance 618 0.052Firm Unavailable / Relocated 618 0.038No Time 618 0.037Bad Terms wit Employer 618 0.019No Need for it 618 0.013Other 618 0.281
Did you Succeed? (If participant tried)Yes 360 0.736If No, Why Not?Firm relocated / unavailable 360 0.078Waiting to hear back 360 0.053Firm Refused 360 0.041Other 360 0.087Note: Results report responses at different points in time. The first
panel asks why participants do not have letters at the time of the
baseline. The second panel reports follow up survey responses in the
treatment group that was encouraged to obtain a letter. The third
panel limits responses to participants that tried to obtain a letter.
32
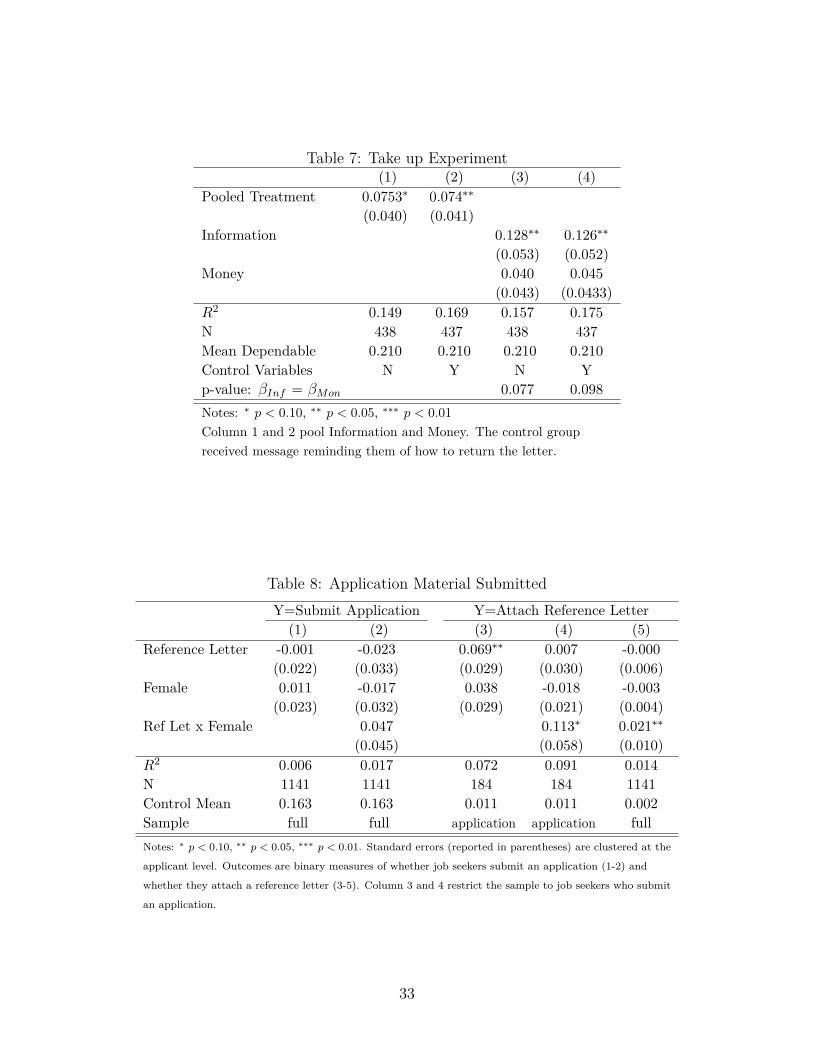
Table 7: Take up Experiment(1) (2) (3) (4)
Pooled Treatment 0.0753∗ 0.074∗∗(0.040) (0.041)
Information 0.128∗∗ 0.126∗∗(0.053) (0.052)
Money 0.040 0.045(0.043) (0.0433)
R2 0.149 0.169 0.157 0.175N 438 437 438 437Mean Dependable 0.210 0.210 0.210 0.210Control Variables N Y N Yp-value: βInf = βMon 0.077 0.098Notes: ∗ p < 0.10, ∗∗ p < 0.05, ∗∗∗ p < 0.01Column 1 and 2 pool Information and Money. The control groupreceived message reminding them of how to return the letter.
Table 8: Application Material SubmittedY=Submit Application Y=Attach Reference Letter
(1) (2) (3) (4) (5)Reference Letter -0.001 -0.023 0.069∗∗ 0.007 -0.000
(0.022) (0.033) (0.029) (0.030) (0.006)Female 0.011 -0.017 0.038 -0.018 -0.003
(0.023) (0.032) (0.029) (0.021) (0.004)Ref Let x Female 0.047 0.113∗ 0.021∗∗
(0.045) (0.058) (0.010)R2 0.006 0.017 0.072 0.091 0.014N 1141 1141 184 184 1141Control Mean 0.163 0.163 0.011 0.011 0.002Sample full full application application fullNotes: ∗ p < 0.10, ∗∗ p < 0.05, ∗∗∗ p < 0.01. Standard errors (reported in parentheses) are clustered at the
applicant level. Outcomes are binary measures of whether job seekers submit an application (1-2) and
whether they attach a reference letter (3-5). Column 3 and 4 restrict the sample to job seekers who submit
an application.
33

Appendix
Tables
Table A.1: Selection: Who returns Reference Letters?Dep var: 1=return letter (1) (2) (3) (4) (5) (6) (7)
demogr search aptitude job spell unemp spell job terminationEducation (yr) 0.01820 0.01911 0.01221 0.01484 0.01765 0.00884 0.00568
(0.0215) (0.0220) (0.0232) (0.0217) (0.0215) (0.0228) (0.0248)Age (yr) 0.01277∗∗ 0.01272∗∗ 0.01292∗∗ 0.01767∗∗∗ 0.01268∗∗ 0.01370∗∗∗ 0.01765∗∗∗
(0.0050) (0.0050) (0.0051) (0.0059) (0.0052) (0.0051) (0.0059)1=Female -0.00344 -0.00411 -0.00686 -0.01303 -0.00345 -0.00856 -0.01830
(0.0435) (0.0437) (0.0436) (0.0441) (0.0437) (0.0442) (0.0447)Nr Applications (4 weeks) 0.00161 0.00214
(0.0075) (0.0076)Aptitude Score (%) 0.00070 0.00039
(0.0012) (0.0013)Last job spell (yr) -0.02174∗ -0.01762
(0.0120) (0.0122)Time since last job (yr) 0.00175 0.00144
(0.0029) (0.0028)Job termination: contract end 0.03234 0.03983
(0.0508) (0.0512)Job termination: fired -0.08013 -0.04502
(0.0855) (0.0874)Job termination: voluntary 0.08781 0.08085
(0.0852) (0.0875)R2 0.027 0.028 0.027 0.035 0.028 0.033 0.038N 437 435 436 437 437 437 434Dep Var mean 0.308 0.308 0.308 0.308 0.308 0.308 0.308Notes: ∗ p < 0.10, ∗∗ p < 0.05, ∗∗∗ p < 0.01.The table explores factors correlated with whether job seekers return a completed letter. Aptitude Score measures the averagenumeracy and literacy score of an aptitude test. Last job spell captures the number of years the job seeker stayed in her last job.The Job termination variable capture the reason of termination stated by employers on the reference letter.
34

Table A.2: Content of Reference Letter by GenderGender
N mean Female Male p-valueTotal Score 119 4.933 5.04 4.821 .134Hard Skill Score 119 2.307 2.362 2.25 .211Soft Skill 120 2.625 2.677 2.571 .151All Positive 119 0.109 0.131 0.086 0.434TeamAbility 117 2.692 2.77 2.607 .058WorkEthics 120 2.675 2.742 2.603 .162Reliability 118 2.568 2.597 2.536 .568Agreeability 118 2.61 2.645 2.571 .448Interpersonalskills 119 2.597 2.639 2.552 .408Literacy Ref 117 2.462 2.5 2.421 .487Numeracy Ref 115 2.174 2.22 2.125 .48ComputerLiteracy 109 1.917 2.052 1.765 .104LearningAbility 118 2.576 2.574 2.579 .961Task1 70 2.5 2.5 2.5 1Task2 60 2.433 2.452 2.414 .807Comments (any) 120 .458 .452 .466 .88Comments (nr) 120 1.842 1.984 1.69 .606How Recommend (0=reserv.,2=highly) 104 1.558 1.691 1.408 .012Confidence Assessing (0=low, 2=high) 112 1.67 1.717 1.615 .278Termination: Voluntary 107 .224 .263 .18 .304Termination: Contract Ended 107 .645 .632 .66 .762Termination: Retrenchment 107 .112 .088 .14 .403Termination: Fired 107 .019 .018 .02 .927Signed 115 .974 .967 .981 .63Phone listed 115 .957 .934 .981 .205Email listed 115 .496 .492 .5 .931Notes: The table reports details from the completed reference letters. Ratingsare converted to numeric values (0=below average, 3=very good). Columns onthe right provide summary statics separately for women and men and reportp-values of a test of equal means.
35

Table A.3: Balance Test: Reference Letter vs Control GroupFull Sample Control Reference Let pvalueN mean N mean N mean
1=Female 1267 .502 566 .516 701 .491 .373Age in yrs 1267 27.33 566 27.07 701 27.55 .042Education (years) 1262 12.16 561 12.08 701 12.23 .3951=married 1267 .069 566 .055 701 .081 .06Nr of Children 1179 1.026 525 1.021 654 1.031 .8781=moved to Johannesburg 1267 .744 566 .753 701 .738 .539Zulu 1267 .273 566 .281 701 .267 .575Xhosa 1267 .084 566 .083 701 .086 .871Venda 1267 .056 566 .049 701 .061 .3561=ever had job 1267 1 566 1 701 1 .1=ever selfemployed 1267 .193 566 .187 701 .197 .667Currently receiving UIF 1267 .114 566 .102 701 .124 .225Reservation wage (ZAR/month) 1259 3381 559 3251 700 3484 .079Fair Wage (ZAR/month) 1265 6108 565 5930 700 6251 .143Hours search (week) 1226 14.35 544 14.13 682 14.52 .768Interview requests (month) 1041 .671 472 .593 569 .735 .127Plan for job search 1132 2.972 471 2.958 661 2.982 .71Total search cost (ZAR/month) 1107 169.01 458 168.434 649 169.416 .93Likelihood find job 1129 2.06 471 2.038 658 2.076 .421Notes: The table reports summary statistics for the full sample as well as separately for the control and the treatment
group. The last column reports p-values of a test of equal means of the control and treatment group. Results (not
reported) show that we can reject joint significance of control variables in explaining treatment status (p-value: 0.72).
Likelihood find job measures preceived chances to find employment in next month (0=very unlikely, 4=very likely).
36

Table A.4: Attrition (Experiment 2)Wave 1 Wave 2
(1) (2) (3) (4)Reference Letter -0.010 -0.005 -0.019 -0.017
(0.014) (0.014) (0.021) (0.021)Education (yrs) -0.009∗∗∗ -0.009∗∗∗
(0.001) (0.002)Age (yrs) -0.003∗∗ -0.005∗∗
(0.002) (0.003)1=Female -0.006 -0.013
(0.014) (0.021)Control Variables N Y N YR2 0.000 0.024 0.001 0.016N 1246 1241 1246 1241Control Mean 0.068 0.068 0.182 0.182Notes: Standard errors in parentheses. ∗ p < 0.10, ∗∗ p < 0.05, ∗∗∗ p < 0.01.
The dependent variable is an indicator variable for whether people attrited
in wave 1 and 2 of the follow up survey.
Table A.5: Balance Test: Take-Up ExperimentPooled Control Information Money
N Mean Mean Mean p-value Mean p-valueAge in yrs 496 26.85 27.12 27.25 .813 26.28 .1341=Female 498 .506 .508 .524 .796 .483 .697Married 498 .056 .047 .056 .733 .052 .862Nr of Children 498 .998 .977 1.089 .372 1.026 .711Education (years) 497 11.95 11.76 12 .098 11.97 .1881=Migrant 498 .795 .781 .823 .412 .802 .6951=Ever self-employed 498 .205 .227 .234 .891 .198 .591Currently receiving UIF 498 .143 .109 .129 .632 .164 .22Reservation wage 496 3121 2949 3299 .214 3547 .091Hours search (week) 487 13.8 11.98 12.94 .555 18.08 .004Total search cost (month) 455 165.1 164 173 .71 167 .904Likelihood find job (month) 459 2.07 2.04 2.02 .791 2.08 .73Note: The table reports summary statistics for the pooled sample, control group and treatment groups. P-values
report results of a test of equal means of the control group and respective treatment group. Likelihood to find job
converts reports responses converted to numeric values (0=very unlikely, 4=very likely).
37
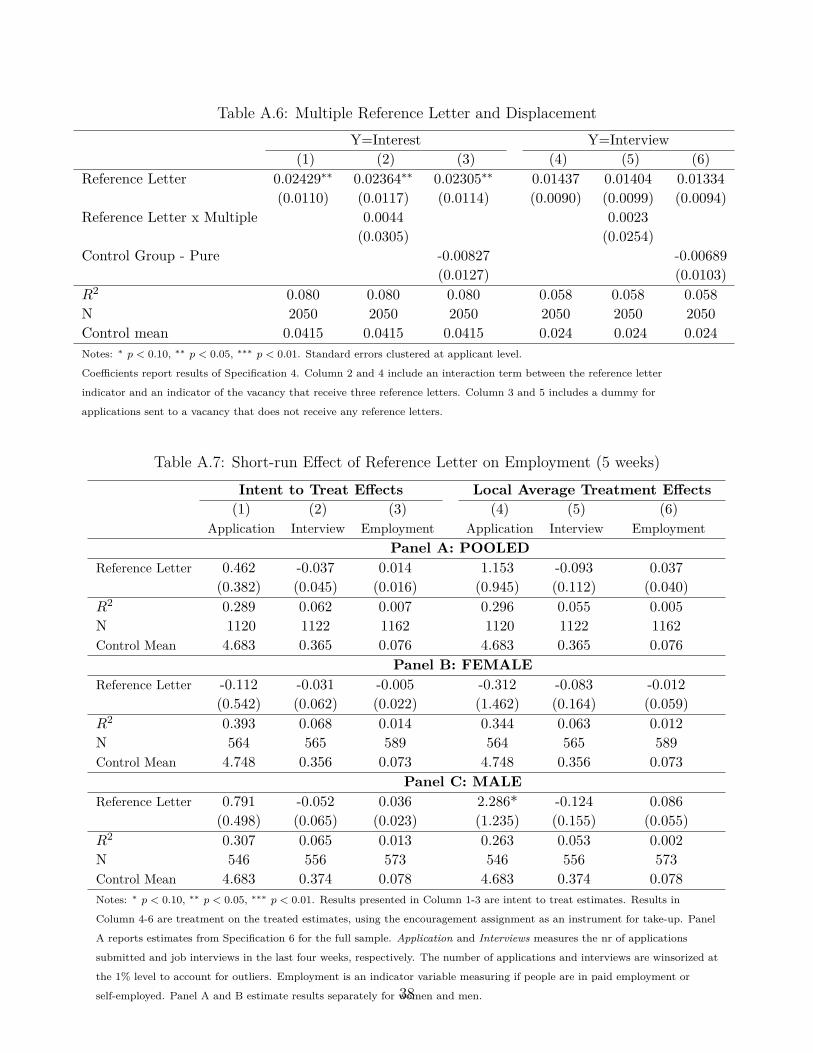
Table A.6: Multiple Reference Letter and DisplacementY=Interest Y=Interview
(1) (2) (3) (4) (5) (6)Reference Letter 0.02429∗∗ 0.02364∗∗ 0.02305∗∗ 0.01437 0.01404 0.01334
(0.0110) (0.0117) (0.0114) (0.0090) (0.0099) (0.0094)Reference Letter x Multiple 0.0044 0.0023
(0.0305) (0.0254)Control Group - Pure -0.00827 -0.00689
(0.0127) (0.0103)R2 0.080 0.080 0.080 0.058 0.058 0.058N 2050 2050 2050 2050 2050 2050Control mean 0.0415 0.0415 0.0415 0.024 0.024 0.024Notes: ∗ p < 0.10, ∗∗ p < 0.05, ∗∗∗ p < 0.01. Standard errors clustered at applicant level.
Coefficients report results of Specification 4. Column 2 and 4 include an interaction term between the reference letter
indicator and an indicator of the vacancy that receive three reference letters. Column 3 and 5 includes a dummy for
applications sent to a vacancy that does not receive any reference letters.
Table A.7: Short-run Effect of Reference Letter on Employment (5 weeks)Intent to Treat Effects Local Average Treatment Effects(1) (2) (3) (4) (5) (6)
Application Interview Employment Application Interview EmploymentPanel A: POOLED
Reference Letter 0.462 -0.037 0.014 1.153 -0.093 0.037(0.382) (0.045) (0.016) (0.945) (0.112) (0.040)
R2 0.289 0.062 0.007 0.296 0.055 0.005N 1120 1122 1162 1120 1122 1162Control Mean 4.683 0.365 0.076 4.683 0.365 0.076
Panel B: FEMALEReference Letter -0.112 -0.031 -0.005 -0.312 -0.083 -0.012
(0.542) (0.062) (0.022) (1.462) (0.164) (0.059)R2 0.393 0.068 0.014 0.344 0.063 0.012N 564 565 589 564 565 589Control Mean 4.748 0.356 0.073 4.748 0.356 0.073
Panel C: MALEReference Letter 0.791 -0.052 0.036 2.286* -0.124 0.086
(0.498) (0.065) (0.023) (1.235) (0.155) (0.055)R2 0.307 0.065 0.013 0.263 0.053 0.002N 546 556 573 546 556 573Control Mean 4.683 0.374 0.078 4.683 0.374 0.078Notes: ∗ p < 0.10, ∗∗ p < 0.05, ∗∗∗ p < 0.01. Results presented in Column 1-3 are intent to treat estimates. Results in
Column 4-6 are treatment on the treated estimates, using the encouragement assignment as an instrument for take-up. Panel
A reports estimates from Specification 6 for the full sample. Application and Interviews measures the nr of applications
submitted and job interviews in the last four weeks, respectively. The number of applications and interviews are winsorized at
the 1% level to account for outliers. Employment is an indicator variable measuring if people are in paid employment or
self-employed. Panel A and B estimate results separately for women and men.38

Figures
Figure A.1: Reference Letter Template
39

Figure A.2: Reference Letter Template - Examples
40

Figure A.3: Aptitude Test - Sample Questions
41

Figure A.4: Aptitude Distribution
Figure A.5: Correlation between Employer Rating and Aptitude
42

Figure A.6: Distribution of Reference Letter Scores
43

Figure A.7: Quartile Regression
44

A Model
The firm’s conditional expectation function is
E(a|s1, s2, d) = β00 + β01d+ β10s1 + β11s1d+ β21s2
Since the firm’s expectations are rational and common knowledge, the job-seeker’s decision tosend a reference letter is
d(s1, s2, d) = c.1(E(a|s1, d = 0) < E(a|s1, s2, d = 1))
Under the additional linearity assumption this becomes
d(s1, s2, ) = c.1(β01 + β11s1 + β21s2 > 0) = c.1(s2 > −β01
β21− β11
β21s1)
If the candidate sends a reference letter, then the employer observes s1 and s2 but no additionalinformation about a is conveyed by the fact that the letter was sent. The linear coefficients ofE(a|s1, s2, d = 1) can therefore be calculated as regression coefficients. The linear regressioncoefficients for
E(a|s1, s2, d = 1) = (β00 + β01) + (β10 + β11)s1 + β21s2
can be calculated via the Frisch-Waugh-Lovell theorem as
β10 + β11 = σ22
σ22 + σ2
1σ22 + σ2
1
β21 = σ21
σ22 + σ2
1σ22 + σ2
1
β00 + β01 = 0
45
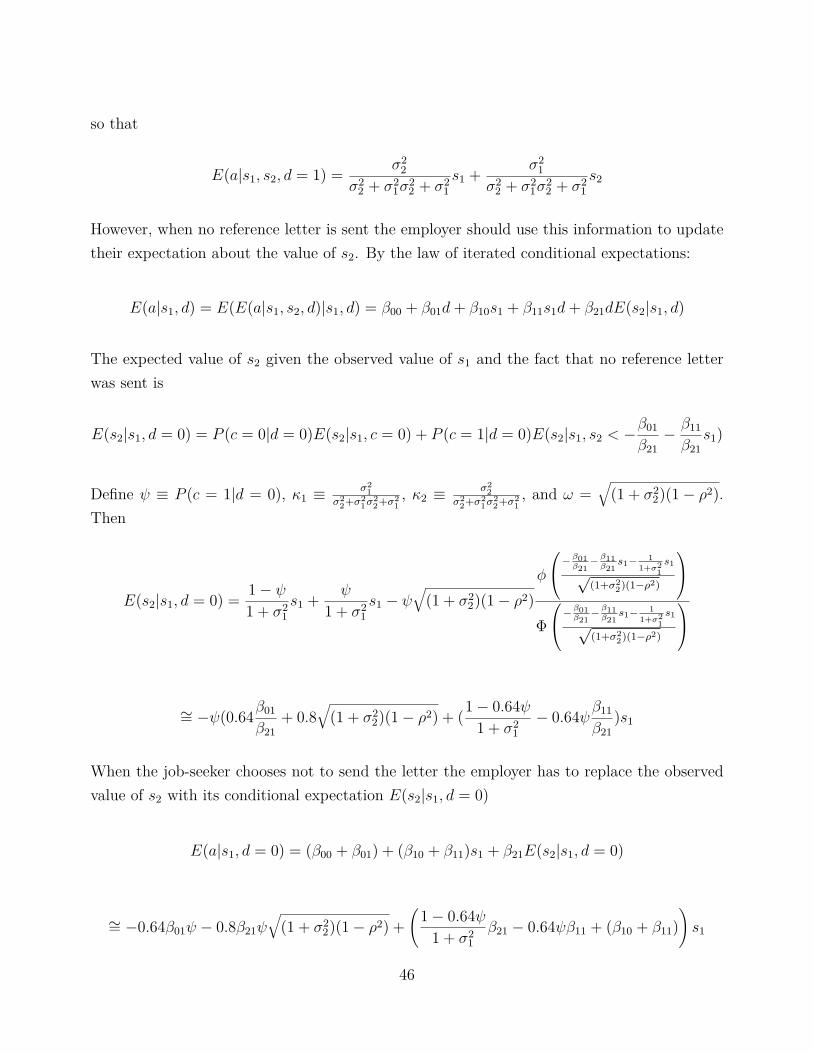
so that
E(a|s1, s2, d = 1) = σ22
σ22 + σ2
1σ22 + σ2
1s1 + σ2
1σ2
2 + σ21σ
22 + σ2
1s2
However, when no reference letter is sent the employer should use this information to updatetheir expectation about the value of s2. By the law of iterated conditional expectations:
E(a|s1, d) = E(E(a|s1, s2, d)|s1, d) = β00 + β01d+ β10s1 + β11s1d+ β21dE(s2|s1, d)
The expected value of s2 given the observed value of s1 and the fact that no reference letterwas sent is
E(s2|s1, d = 0) = P (c = 0|d = 0)E(s2|s1, c = 0) + P (c = 1|d = 0)E(s2|s1, s2 < −β01
β21− β11
β21s1)
Define ψ ≡ P (c = 1|d = 0), κ1 ≡ σ21
σ22+σ2
1σ22+σ2
1, κ2 ≡ σ2
2σ2
2+σ21σ
22+σ2
1, and ω =
√(1 + σ2
2)(1− ρ2).Then
E(s2|s1, d = 0) = 1− ψ1 + σ2
1s1 + ψ
1 + σ21s1 − ψ
√(1 + σ2
2)(1− ρ2)φ
−β01β21−β11
β21s1− 1
1+σ21s1
√(1+σ2
2)(1−ρ2)
Φ−β01
β21−β11
β21s1− 1
1+σ21s1
√(1+σ2
2)(1−ρ2)
∼= −ψ(0.64β01
β21+ 0.8
√(1 + σ2
2)(1− ρ2) + (1− 0.64ψ1 + σ2
1− 0.64ψβ11
β21)s1
When the job-seeker chooses not to send the letter the employer has to replace the observedvalue of s2 with its conditional expectation E(s2|s1, d = 0)
E(a|s1, d = 0) = (β00 + β01) + (β10 + β11)s1 + β21E(s2|s1, d = 0)
∼= −0.64β01ψ − 0.8β21ψ√
(1 + σ22)(1− ρ2) +
(1− 0.64ψ
1 + σ21β21 − 0.64ψβ11 + (β10 + β11)
)s1
46
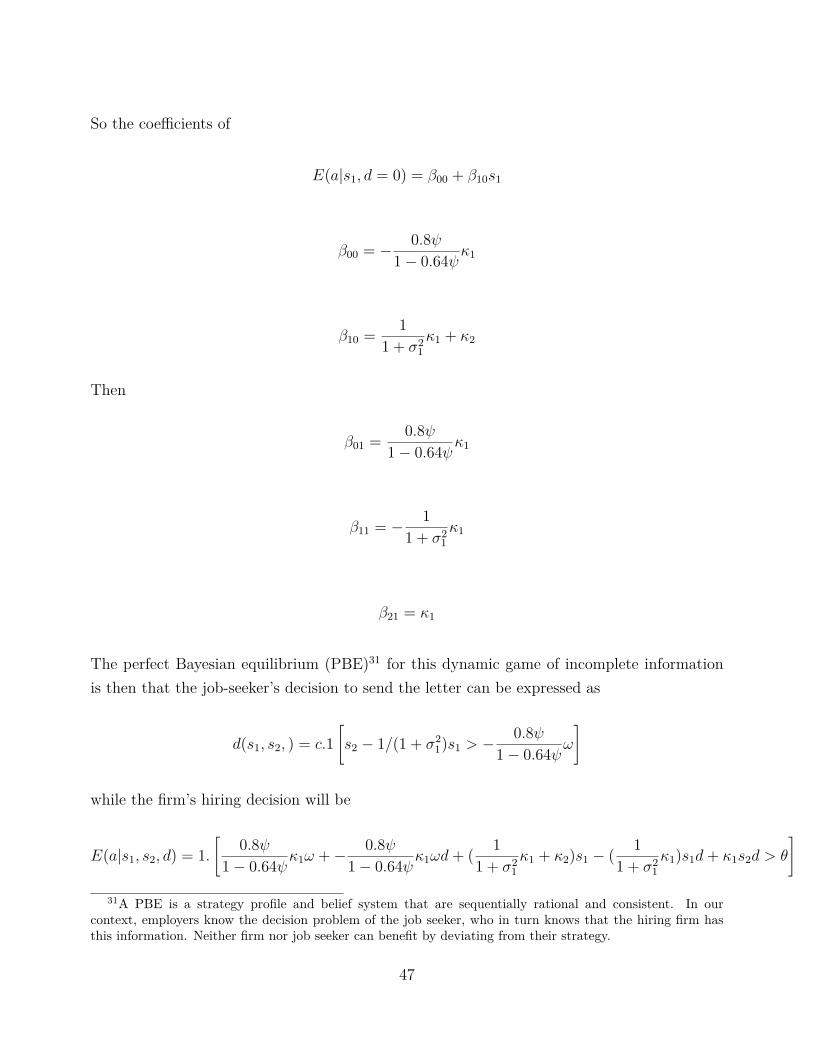
So the coefficients of
E(a|s1, d = 0) = β00 + β10s1
β00 = − 0.8ψ1− 0.64ψκ1
β10 = 11 + σ2
1κ1 + κ2
Then
β01 = 0.8ψ1− 0.64ψκ1
β11 = − 11 + σ2
1κ1
β21 = κ1
The perfect Bayesian equilibrium (PBE)31 for this dynamic game of incomplete informationis then that the job-seeker’s decision to send the letter can be expressed as
d(s1, s2, ) = c.1[s2 − 1/(1 + σ2
1)s1 > −0.8ψ
1− 0.64ψω]
while the firm’s hiring decision will be
E(a|s1, s2, d) = 1.[
0.8ψ1− 0.64ψκ1ω +− 0.8ψ
1− 0.64ψκ1ωd+ ( 11 + σ2
1κ1 + κ2)s1 − ( 1
1 + σ21κ1)s1d+ κ1s2d > θ
]
31A PBE is a strategy profile and belief system that are sequentially rational and consistent. In ourcontext, employers know the decision problem of the job seeker, who in turn knows that the hiring firm hasthis information. Neither firm nor job seeker can benefit by deviating from their strategy.
47

The share of applicants π who use of the reference letter in equilibrium (P (c = 1)) is
P (d(s1, s2, ) = 1) = π.P (s2 −1
1 + σ21s1 > −
0.8ψ1− 0.64ψω)
48

B Simulation: How do effects change as letters becomewidely adopted?
Section 4 finds that increasing the number of letters from one to three does not change theireffectiveness. However, this still presents a relatively small share of the applicant pool asemployers report to typically receive about 50 applications per vacancy. While the experi-ment cannot create substantive variation in the share of applications submitted with referenceletters, we can employ our conceptual framework (Section 2.2) to investigate how effects maychange as reference letters become more widely adopted.
Simulation results presented in Figure A.8 illustrate the relationship between the share withaccess to letters (c) and the share using it in the job search (d). The share using the letterincreases for two reasons: first, more high ability people with positive letters gain access and,second, the share using the letter conditional on having access to it P (d = 1|c = 1) increases.One corollary is that the ability of the marginal job seeker using the letter decreases as moreget access (results not shown). The intuition behind these results is that in an equilibriumwith very few reference letters, the information employers can infer about the applicant’sability from not receiving a letter is limited. Workers who receive a negative letter can hidein the larger pool of job seekers without access to letters and will thus only accrue a smallpenalty, i.e. firms only slightly adjust their beliefs about ability downward.
Figure A.9 depicts how the firms’ screening ability changes as more people get access toletters. Two effects emerge: the overall share of people hired P (h = 1) increases suggestingthat the letter has positive net employment effects and the average ability of the hired personE(a|h = 1) increases.32 Combined, these results suggest that the unraveling of the market(i.e. P (c = 1) → 1) is desirable from a market efficiency perspective as it maximizes theinformation available to firms to identify the most able candidates.
32Pissarides, 1985 concludes that labor demand can change very rapidly as firms make hiring decision basedon the perceived cost and benefits of future matches.
49
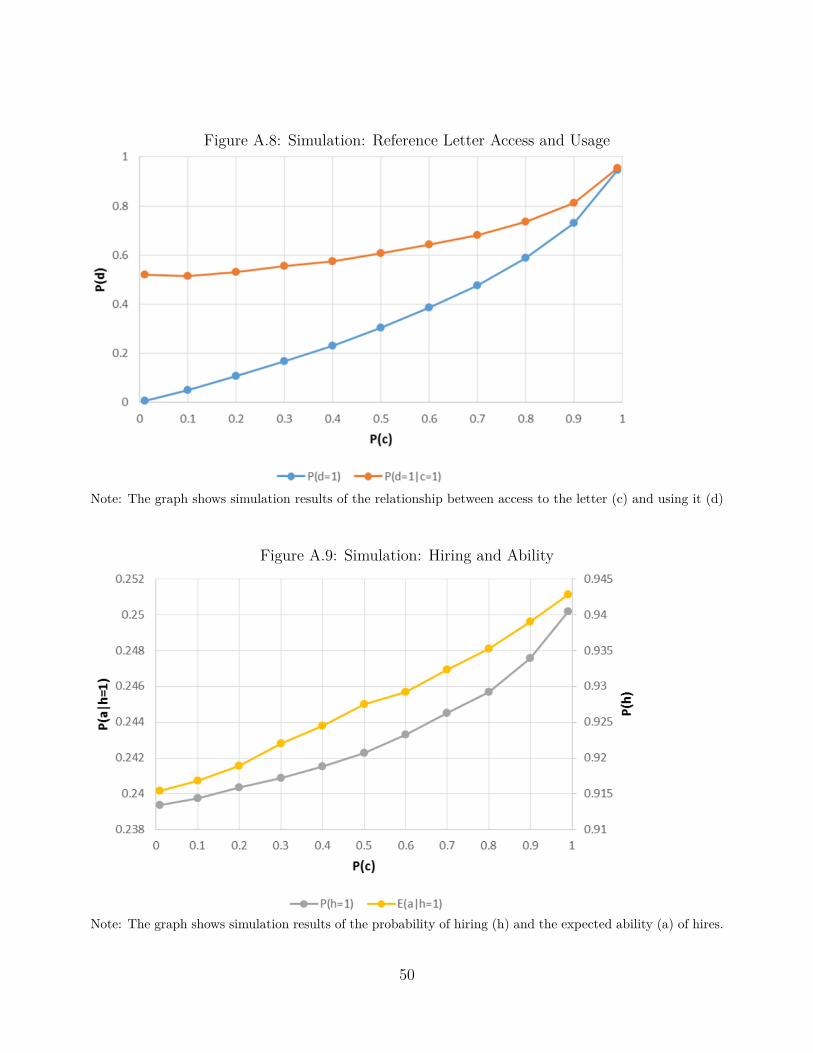
Figure A.8: Simulation: Reference Letter Access and Usage
Note: The graph shows simulation results of the relationship between access to the letter (c) and using it (d)
Figure A.9: Simulation: Hiring and Ability
Note: The graph shows simulation results of the probability of hiring (h) and the expected ability (a) of hires.
50