The Value of Offshore Secrets Evidence from the Panama … · The Value of Offshore Secrets –...
36
The Value of Offshore Secrets – Evidence from the Panama Papers James O’Donovan † INSEAD Hannes Wagner ‡ Bocconi University Stefan Zeume †‡ University of Michigan First Draft: April 19, 2016 This Draft: September 19, 2016 Preliminary. Abstract We use the data leak of the Panama Papers on April 3, 2016 to study whether and how the use of offshore vehicles affects valuation around the world. The data leak made transparent the operations of more than 214,000 shell companies incorporated in tax havens by Panama-based law firm Mossack Fonseca. We find that, around the world, the data leak erased an unprecedented risk-adjusted US$112 billion in market capitalization among 488 firms with direct exposure to the revelations of the Panama Papers, reflecting 0.5%-0.6% of these firms’ market value. The negative effect on firms with exposure to the leak is stronger among tax aggressive firms and firms with exposure to more corrupt countries, especially to countries where high-ranked government officials were implicated by name in the leaked data. These results suggest that investors associate the leak with reductions in firms’ ability to avoid taxes and finance corruption, or with regulatory fines for tax evasion and violating anti-corruption regulations. The results also highlight that offshore vehicles are used for value-enhancing but potentially illegal activities that go beyond tax avoidance. Keywords: Panama Papers, tax havens, tax evasion, corruption, offshore vehicle. JEL Classification: G32, G38, H25, H26 We have benefitted from discussions with Morten Bennedsen, Alexander Dyck, Julian Franks, Nicola Gennaioli, Karl Lins, Colin Mayer, Marco Ottaviani, Paolo Pasquariello, Uday Rajan, Fabiano Schivardi, Andrei Shleifer, and Joel Slemrod. All remaining errors are our own. † Department of Finance, INSEAD, [email protected]. ‡ Department of Finance, Bocconi University, [email protected]. ‡† Department of Finance, University of Michigan, [email protected].
Transcript of The Value of Offshore Secrets Evidence from the Panama … · The Value of Offshore Secrets –...

The Value of Offshore Secrets – Evidence from the Panama Papers
James O’Donovan†
INSEAD
Hannes Wagner‡
Bocconi University
Stefan Zeume †‡
University of Michigan
First Draft: April 19, 2016
This Draft: September 19, 2016
Preliminary.
Abstract
We use the data leak of the Panama Papers on April 3, 2016 to study whether and how the use of offshore
vehicles affects valuation around the world. The data leak made transparent the operations of more than
214,000 shell companies incorporated in tax havens by Panama-based law firm Mossack Fonseca. We
find that, around the world, the data leak erased an unprecedented risk-adjusted US$112 billion in market
capitalization among 488 firms with direct exposure to the revelations of the Panama Papers, reflecting
0.5%-0.6% of these firms’ market value. The negative effect on firms with exposure to the leak is
stronger among tax aggressive firms and firms with exposure to more corrupt countries, especially to
countries where high-ranked government officials were implicated by name in the leaked data. These
results suggest that investors associate the leak with reductions in firms’ ability to avoid taxes and finance
corruption, or with regulatory fines for tax evasion and violating anti-corruption regulations. The results
also highlight that offshore vehicles are used for value-enhancing but potentially illegal activities that go
beyond tax avoidance.
Keywords: Panama Papers, tax havens, tax evasion, corruption, offshore vehicle.
JEL Classification: G32, G38, H25, H26
We have benefitted from discussions with Morten Bennedsen, Alexander Dyck, Julian Franks, Nicola Gennaioli,
Karl Lins, Colin Mayer, Marco Ottaviani, Paolo Pasquariello, Uday Rajan, Fabiano Schivardi, Andrei Shleifer, and
Joel Slemrod. All remaining errors are our own. †
Department of Finance, INSEAD, [email protected]. ‡
Department of Finance, Bocconi University, [email protected]. ‡† Department of Finance, University of Michigan, [email protected].

Retrieved April 14, 2016.
1
Offshore vehicles have been studied widely as a means to avoid corporate taxes1. Yet narrative
accounts identify them as means of evading taxes, financing corruption, laundering money, and
violating sanctions. Owing to their secretive nature, the use of offshore vehicles for such—
predominantly illegal—activities is much less well understood. The purpose of this paper is to
examine whether and how the use of offshore vehicles affects valuation and corporate decisions.
In order to gain insights into the partially unobservable activities of offshore vehicles, we
exploit a data leak of unprecedented size. On April 3, 2016, news sources around the world
started reporting about a data leak of confidential documents concerning the business activities
of Mossack Fonseca, a Panama-based law firm and provider of corporate services. These so-
called Panama Papers comprised 11.5 million emails, contracts, transcripts and scanned
documents, and constituted the largest data leak to date. The leaked documents provided insights
into the operation and management of more than 214,000 shell companies during the past 45
years. According to Mossack Fonseca’s internal documents, 95% of the company’s work
consisted of “selling [corporate] vehicles to avoid taxes”. Yet individual stories quickly
highlighted that the use of offshore vehicles went well beyond tax avoidance. Cases of
implicated foreign politicians, for instance, suggested that the vehicles were employed to finance
corruption, thereby violating sanctions such as anti-bribery regulations.2
Using event study methodology, we show that firms that can be traced to the leaked data
have negative abnormal returns around dates relevant to the revelation of the leaked documents.
Besides documenting that some of the negative market response is explained by tax avoidance
considerations, we also show that offshore vehicles are used by corporations for other, partly
1 See Hanlon and Heitzman (2010) for a review of the tax avoidance literature.
2 ‘The Panama Papers: how the world’s rich and famous hide their money offshore’, April 3, 2016, The Guardian.

that all leaked documents would be made available to the public and with further specific news stories.
2
illegal activities, such as financing corruption. Such activities are value enhancing, and the
Panama Papers data leak destroys some of that value.
Specifically, we use a sample of 23,535 publicly traded firms from 73 countries, with a
total of 526,541 subsidiaries across 211 sovereign and non-sovereign territories, to assess the
impact of the Panama Papers data leak on firm value. We measure firm value by abnormal
returns around three dates associated with news about the data leak. 3
Firms are defined as
exposed to the data leak if any entity, intermediary, or officer listed in the leaked Mossack
Fonseca documents is linked to a subsidiary of a firm in our sample, a director of a firm in our
sample, or a director of a sample firm’s subsidiary. This definition generates a sample of 488
firms linked to the data leak. These firms are headquartered in roughly half of our sample
countries and operate in a range of industries; they tend to be large firms with tax haven
subsidiaries and exposure to perceptively corrupt countries, particularly to countries where high-
ranked government officials were implicated by name in the leaked data.
In theory, the unexpected data leak might reduce or increase firm value generated from
offshore vehicles. The leak might negatively affect value if it makes it harder to avoid future
taxes or to use offshore money to bribe foreign government officials. The same applies if the
leak increases expected costs of regulatory punishment for past tax evasion and violations of
anti-bribery regulations. Additionally, reputational damage may arise from the revelations.
However, if offshore structures were used to tunnel resources out of the firm at the expense of
minority shareholders, the leak might increase the costs of such activities, thereby increasing
firm value. Indeed, the leak may reduce investors’ uncertainty about activities in tax havens.
3 The first date is April 3, 2016, which was when journalists reported about the leak and published a few first
company-specific news stories. The other two dates – April 26 and May 9 – were associated with announcements

3
Our results show that, across countries, the data leak wiped out a total of US$112 billion
in market capitalization among firms with exposure to the revelations of the Panama Papers.4
Around the data leak, an average firm with exposure to the Panama Papers experiences a drop in
firm value of 0.5 to 0.6 percent relative to same-country same-industry firms without such
exposure. These results are stronger among firms linked to an officer or an intermediary in the
Mossack Fonseca files and during the first two related event days. Our results are robust to using
alternative event windows and adjusting for market risk exposure.
We then study two channels that may explain the negative market response. First, we
establish that tax aggressive firms with a link to the leaked data have a more negative stock price
response. We measure tax aggressiveness by the difference between statutory tax rate and
effective tax rate, as well as by having subsidiaries in territories considered tax havens by the
OECD Grey list. For instance, firms with a link to the leaked data and tax haven subsidiary are
0.8% more negatively affected around relevant event dates than otherwise comparable firms.
This evidence is suggestive of investors believing firms will be less able to (aggressively) avoid
taxes in the future, or firms being subject to regulatory fines for tax evasion. The results
complement a large and growing literature in accounting and finance that has focused on the use
of tax havens to avoid taxes.5
Our results support the findings of this literature but additionally
4
For this calculation, we consider the 488 firms with direct exposure to the Panama paper data leak. To obtain
US$112bn, we multiply each of the 488 firms’ market valuation at the end of 2015 by their cumulative abnormal
returns between March 31, 2016 and April 6, 2016, April 22 and April 28, and May 5 and May 11 (our main event
dates). Cumulative abnormal returns are based on a 1-factor CAPM (see Section 2 for more detail). We obtain
quantitatively similar results when applying the average drop in firm value after also controlling for country and
industry fixed effects. 5
See Hanlon and Heitzman (2010) for a comprehensive literature review. See also Hanlon, Maydew and Thornock
(2015) on the use of tax haven subsidiaries for round-trip tax evasion and Graham and Tucker (2006) on the use of
tax shelters as a substitute for debt. Desai, Foley, and Hines (2004) study economic effects of tax havens, and
Slemrod (1985) offers perspectives on individual tax evasion. Despite their use for tax avoidance, tax havens are
costly when managers use excessive cash parked in tax havens to finance inefficient acquisitions (Hanlon, Lester,
and Verdi 2015).

4
suggest that firms may have to adjust their tax planning to the occurrence of data leaks—and that
authorities may use leaked data to punish some firms.
Second, we find that firms exposed to the data leak are more negatively affected when
they are also exposed to perceptively corrupt countries, especially to countries in which high-
ranked government officials were implicated by the data leak.6
For instance, firms with a link to
the leaked data and a subsidiary in one of ten countries whose government officials were
immediately implicated are 0.7% more negatively affected around relevant event dates than
otherwise comparable firms. This evidence is suggestive of the data leak reducing firms’ ability
to win contracts in perceptively corrupt countries or firms becoming subject to regulatory fines
for violation of anti-bribery regulations. To this end, prior work has studied the benefits of
bribery and the costs of anti-bribery regulations for firms. 7
Our paper suggests that secret
offshore vehicles are one previously undocumented channel through which bribes may be paid –
and through which anti-bribery regulations are violated.
Methodologically, our paper adds to a fast-growing literature that uses shocks to the
transparency of tax haven activities to understand the use of tax haven subsidiaries. The passage
of so-called tax information exchange agreements (TIEAs)—allowing tax authorities to
exchange information relevant in tax investigations—has been used to document that tax havens
are used for round-trip tax evasion (Hanlon, Maydew and Thornock 2015) but also that
corporations use tax haven subsidiaries to expropriate minority shareholders (Bennedsen and
6 We use news stories from April 2016 to identify such countries; these countries are: Argentina, Georgia, Iceland,
Iraq, Jordan, Qatar, Saudi Arabia, Sudan, United Arab Emirates, and the Ukraine. 7
Reviews of the corruption and growth literature are provided by Shleifer and Vishny (1993), Bardhan (1997), and
Svensson (2005). Specifically, firms appear to use bribes to create shareholders value (Cheung, Rau, and Stouraitis
2012, Zeume 2016). Yet prosecution costs associated with detected violations of anti-bribery regulation more than
offset the value of contracts obtained through bribe payments if prosecution for bribery is accompanied by charges
of financial fraud (Karpoff, Lee, and Martin 2015).

5
Zeume 2016).8
More recently, Nesbitt, Outslay and Persson (2016) have used the Luxembourg
Leak to show that such leaks may reduce tax uncertainty, which benefits shareholders.
In sum, our results suggest that investors associate the Panama Paper data leak with
reductions in firms’ ability to avoid taxes and finance corruption, or with regulatory fines for tax
evasion and violating anti-corruption regulations. The results also highlight that offshore vehicles
are used for value-enhancing but potentially illegal activities that go beyond tax avoidance.
1. Event, Methodology, and Data
In this section, we describe event, methodology, and data. The Appendix lists all variable
definitions and data sources.
1.1 Event
On Sunday, April 3, 2016, news sources around the world started reporting about a data
leak of confidential documents concerning the business activities of Mossack Fonseca, a
Panama-based law firm and provider of corporate services. Along with this revelation came first
news stories concerning firms and politicians, based on 150 of the leaked documents. Soon after,
it was confirmed that the leaked data overall comprised an unprecedented 2.6 terabytes of data,
or 11.5 million confidential documents. The leaked documents provided insights into the uses of
more than 214,000 shell companies during the past 45 years. Of the 214,000 companies that
appear in Mossack Fonseca’s files, 90 percent were incorporated in just four tax havens - the
British Virgin Islands (BVI) (114,000 firms), Panama (48,000), the Bahamas (16,000), and the
Seychelles (15,000). The remaining firms were incorporated in Niue (9,600), Samoa (5,300),
8 Relatedly, Johannesen and Zucman (2014) show that bank deposits respond to the passage of TIEAs.

6
British Anguilla (3,200), Nevada (1,300), Hong Kong (450), the UK (150), and a few other
countries.
Besides April 3, we identify two additional dates relevant for our analysis. We describe
each in turn. On Tuesday, April 26, the International Consortium of Investigative Journalists
(ICIJ) announced that thousands of leaked documents would be made available to the public. On
that day and the following days, journalists published further news stories implicating
corporations and politicians, suggesting that access to the documents was available to at least
some individuals. On Monday, May 9, 2016, a large set of documents was made available to the
public at large through ICIJ’s website. These documents contain information on more than
200,000 entities incorporated by Mossack Fonseca. The documents are available for complete
download but are also searchable by company names and officer names. This way, ICIJ’s
webpage interface allows for illustration of how specific companies and individuals are linked to
entities, officers, and intermediaries in the leaked Mossack Fonseca files.
1.2 Methodology
One approach to studying the value created by corporate offshore activities is to collect
data from reports about detected tax haven activity. However, there are few detected cases and
such cases may differ from undetected cases along dimensions that correlate with the value they
create. To alleviate these concerns, we employ event study techniques to study the market
response of firms linked to the Panama Paper data leak around announcement of the leak.
In the first part of the analysis, we study the market response of firms exposed to the data
leak around dates relevant to the data leak. Specifically, we run the following regression:

7
where CARi denotes the cumulative returns of firm i around event days relevant to the revelation
of the Mossack Fonseca documents, Panama_Paper_Linki indicates whether firms are exposed
to the leaked documents, and Xi is a vector of controls measured before April 2016, including
country times industry fixed effects. The coefficient of interest ß1 captures whether exposure to
the leaked documents impacts firm value.
In the second part of the analysis, we augment equation (1) by firm characteristics in
order to test whether certain types of activities are priced. We run the following regression:
where FCi is a firm characteristic of interest measured before April 2016. Of particular interest is
ß3, which indicates whether firms exposed to the leak are differentially affected when they have
certain firm characteristics.
Equations (1) and (2) use two-way clusters (country and industry).9
1.3 Data and Variable Construction
Our paper combines data from several sources. Links to the Panama Paper data leak are
established from files made publicly available by the ICIJ, as well as from subsidiary and
director data of all publicly listed firms in Bureau van Dijk’s Orbis database as of 2015.
Accounting and market data is obtained from Datastream/Worldscope and Orbis. Appendix 1
provides a complete list of variable definitions.
1.3.1 Links to the Panama Papers
9 We have experimented with various dimensions of clusters and obtained similar results. Clustering standard errors
at the dimensions mentioned here generally produces the most conservative standard errors.

8
The data contained in the leak of the Panama Papers presents a unique opportunity to
understand the effects of offshore entities on firm valuation. We make use of several files made
publicly available by the ICIJ on the 9th May 2016. We focus on 3 leaked files in particular, an
"entities" file which contains information on companies, trusts, or funds created in low-tax,
offshore jurisdictions by Mossack Fonseca, an "officers" file which contains information on
individuals who play a role in the aforementioned entities, and an "intermediaries" file which
contains information on middlemen (usually law or accounting firms) who arrange the creation
of offshore entities for their clients. We focus on these three dimensions of the data leak—entity
existence, operation, and management—and link them to publicly listed firms in three ways:
directly to a firm through its subsidiaries, directly to a firm through its directors, and indirectly to
a firm through directors of its subsidiaries. In this way we aim to measure precisely which
aspects of the links between offshore vehicles and publicly listed firms may drive valuation
effects.
For all links we use a fuzzy matching algorithm to match the names of directors and
subsidiaries in Orbis to the names in the three Mossack Fonseca files. We require that names in
Orbis and in the leaked data are associated with the same headquarter country, and that the
names are very similar, allowing for minor variation in the spelling of names across our data
sources.10
Specifically, we proceed in two steps, dealing with Orbis subsidiary names and Orbis
officer names separately. First, we match the Orbis subsidiaries of publicly listed firms to the
Mossack Fonseca files using the subsidiary name and headquarter country code from the
10 Examples of fuzzy matches with slight variations in spelling include China-based firms ”Sun Hung Kai Properties
limited” (Orbis) compared to ” Sun Hungkai Properties limited” (Mossack Fonseca), as well as Cyprus-based officer
”Christina Drousiotou” (Orbis) compared to ” Christina Droussiotou” (Mossack Fonseca).

9
subsidiaries file. Sub_Entity, Sub_Officer, and Sub_Intermediary are 3 variables that capture
whether a firm’ subsidiary appears in the leaked Entities, Officers, and Intermediaries file,
respectively. These variables take a value of 1 if a subsidiary is linked to Entities, Officers, and
Intermediaries in the leaked data, respectively.
Second, we match directors of publicly listed firms from Orbis to the Mossack Fonseca
files using the director name and country11
as identifying information. Dir_Entity, Dir_Officer,
and Dir_Intermediary are 3 variables that capture whether a director appears in the leaked
Entities, Officers, and Intermediaries file, respectively. These variables take a value of 1 if a firm
is linked through a director. We repeat the matching of director names for directors of
subsidiaries of publicly listed firms. We refer to these latter links as indirect links since the link
between public firms and the leaked data is through a subsidiary of a publicly listed firm. The
three resulting variables Dir_sub_Entity, Dir_sub_Officer, and Dir_sub_Intermediary capture
links from the directors of subsidiaries of publicly listed firms from Orbis to Entities, Officers,
and Intermediaries in the leaked data, respectively.
We aggregate the 9 measures described above to our key variables of interest. The
dummy variable Any_link is equal to 1 if any of the 9 links are equal to 1. The dummy variable
Officer_link is a dummy variable that takes a value of 1 if any of the Dir_sub_Officer,
Dir_Officer, or Sub_Officer dummies are equal to 1. The dummy variables Entity_link and
Intermediary_Link are constructed in the same manner, taking a value of 1 if any of the three
links—through a director, through a subsidiary, or through a director of a subsidiary—are equal
to 1.
11
The country in which a director is located is extracted from the Orbis director address field.

10
In order to ensure that we do not falsely classify firms as being linked to the leaked
documents, we check a subset of matched names by hand. At the same time, on a cautionary
note, we cannot entirely rule out that we miss some links due to different naming conventions in
Orbis and in the leaked files that are not captured by our fuzzy match. Missing some links most
likely biases us against finding an effect.12
1.3.2 Measures of firm value
We measure the impact of the data leak on firm value using daily returns around relevant
event days (see Section 2). Specifically, returns over the [-2;2] period around each event date are
obtained from the closing price 3 days prior to the event date and the closing price 2 days after
the event date. When event dates fall on non-trading days – as is the case with Sunday, April 3 –
we move the event date to the next trading day (Monday, April 4 in this case).
We obtain daily stock prices from Datastream for all publicly listed firms. We apply
standard data filters and drop penny stocks (prices below US$0.10), stocks indicated as inactive
by Datastream, stocks with only zero returns between March 31, 2016 and April 6, 2016, and we
exclude firms with assets below US$5mn. We winsorize returns at the 1% and 99% percentiles
to remove outliers.13
Besides using raw returns, we calculate 1-factor alphas, i.e. stock returns in
excess of market returns after controlling for firms’ exposure to the market index. Alphas are
obtained from a 1-factor model estimated over March 4, 2015 to March 3, 2016. We require
stocks to have at least 100 observations available during that period. Because local indices and
12 Alleviating some of the concerns that we may miss some links, countries that we cannot match to the Mossack
Fonseca files tend to show up rarely in the published Mossack Fonseca documents, suggesting that firms from these
countries did not use Mossack Fonseca excessively in the first place. For instance, Korea shows up a mere 181 times
in the leaked entity, officer, and intermediary files (compared to 1,681 publicly listed Korean firms), and these 181
occurrences may well refer to private Korean firms. In comparison, the U.K. shows up 15,900 times in the leaked
entity, officer, and intermediary files (compared to 1,079 publicly listed U.K. firms). 13
All our results are robust to alternative specifications.

11
local risk-free rates are unavailable for some countries in our sample, we download all stock
prices in USD and use the US index and US T-Bill as market index and risk-free rate,
respectively. Our results are robust to using local indices and local risk-free rates where
available.
1.3.3 Other Firm Characteristics
Finally, we construct several variables that try to capture firms’ tax aggressiveness and
their exposure to corruption. All variables are measured in 2015 in order to ensure that they are
not affected by the Panama Paper data leak.
Tax Aggressiveness is the statutory tax rate at the country level less a firm’s effective tax
rate where the effective tax rate is defined as tax expense over EBIT. Tax Haven Link is a
dummy variable equal to one if, in 2015, a firm has at least one subsidiary in a tax haven listed
on the OECD Grey List in its August 17, 2009 version.
Has 1St
Layer Link is a Dummy variable equal to one if a firm had at least one subsidiary
in any of the countries whose presidents or major officials were implicated by the Panama Papers
in 2015. We use news stories from April 2016 to identify such countries; these countries are:
Argentina, Georgia, Iceland, Iraq, Jordan, Qatar, Saudi Arabia, Sudan, United Arab Emirates,
and the Ukraine.
Initial news stories focused primarily on the use of offshore vehicles by several
government leaders, presidents, and other politicians in these 10 countries, as of 21 April 2016,
the list of potentially implicated individuals has grown to include politicians and other

12
individuals from at least 40 countries.14
We construct Corruption exposure, a measure capturing
the idea that politicians from many more countries may have been implicated—and assuming
that politicians from countries perceived to be more corrupt are more likely implicated.
Corruption exposure is the natural logarithm of the minimum corruption score of a firm’s
subsidiary headquarter countries. Corruption scores are taken from Transparency International’s
2015 Corruption Perceptions Index. We subtract country-level scores from 10 so that Corruption
exposure is increasing in firms’ exposure to corruption.
2. Descriptive statistics
Table 1 provides summary statistics for firms with and without exposure to the Panama
Papers data leak.
-- -- Table 1 about here -- --
Panel A of Table 1 shows the number of firms linked to the leak by subsidiary, officer, or
intermediary. 488 firms, or 2.1% of our sample firms are linked to the Panama Papers data leak
through subsidiaries, officers, or intermediaries (Any_link=1). We further disaggregate this link
measure to understand which of the Panama Papers data leak files contributes to the link. 253
firms (1.1% of our sample) are linked through the entities file, 390 firms (1.7% of our sample)
are linked through the officers file, and 102 firms (0.4% of our sample) are linked through the
intermediaries file. It should be noted that some firms are linked to the leaked data through a
combination of entity, officer, and intermediary files.
14 Additional countries include Armenia, Australia, Azerbaijan, Bangladesh, Brazil, Canada, Chile, China,
Colombia, Cyprus, Egypt, France, Hong Kong, India, Indonesia, Israel, Italy, Malta, Mexico, New Zealand,
Norway, Pakistan, Russia, Singapore, Spain, Sweden, Switzerland, Thailand, Tunisia, the UK, and the US.

13
Panel B of table 1 shows how many firms in a given country are linked to the Panama
Papers data leak through each of our link measures. We present results for countries with more
than 50 firms with all other countries placed in the “rest of world” category. Column 4 captures
the percentage of firms with any link to the Panama Papers data leak (i.e. the percentage of firms
for which the dummy variable Any_link is equal to 1). There is large variation in fraction of firms
linked to the data leak, with Hong Kong (one in five firms) and the U.K. (one in seven firms)
leading the table. It is also noteworthy that we cannot link any firm from countries such as
Brazil, New Zealand, South Africa, and Korea to the data leak. We selectively double-check our
name matching procedure to ensure that this is not driven by different spelling conventions
across datasets. Even though we cannot entirely rule out that this drives some of the low
fractions of matches, we believe that such bias towards not identifying firms will bias us against
finding results. As stated earlier, some of the countries for which Any_link is zero on average
show up very rarely in the Mossack Fonseca documents, suggesting that firms from these
countries did not use Mossack Fonseca excessively in the first place. Appendix 2 additionally
shows results by industry; it is noteworthy that firms with links exist across many different
industries.
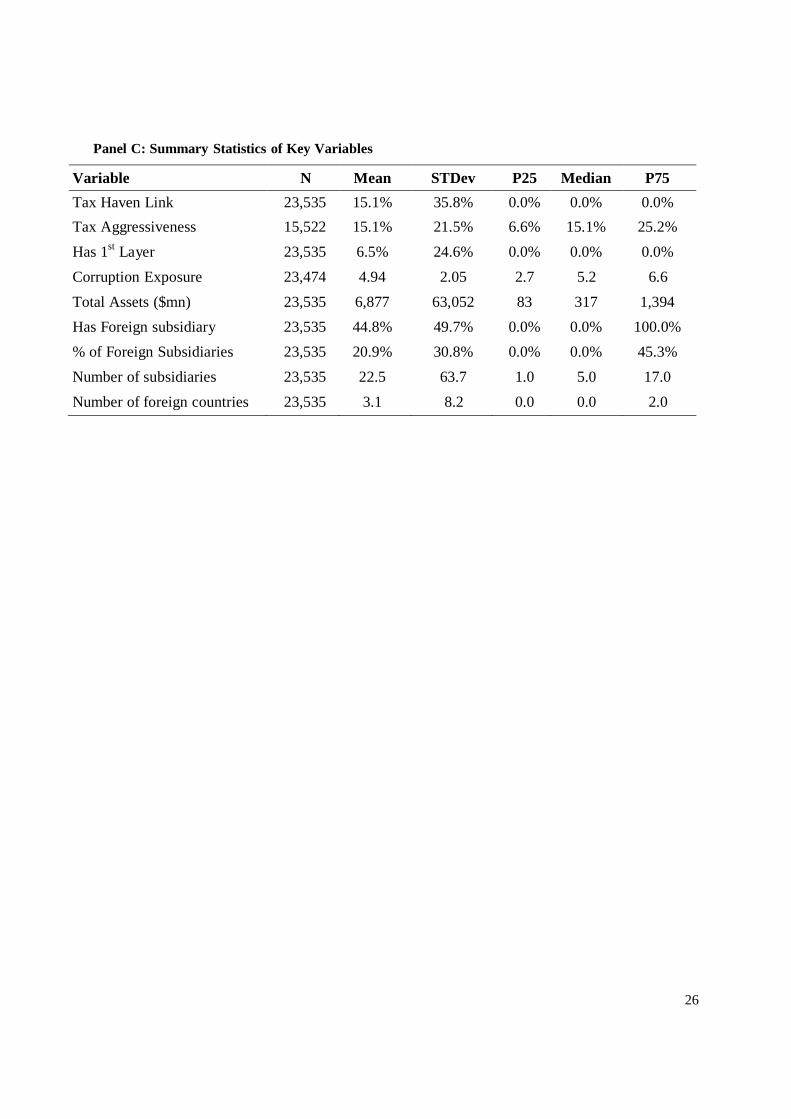
Panel C shows summary statistics of firm and country level variables. This table is aimed
at the later analysis of cross-sectional characteristics and at control variables. 15% of sample
firms are located in tax havens and these firms paid, on average, much less than their headquarter
country’s statutory tax. 6.5% of our sample firms are exposed to countries whose politicians
were implicated by the data leak almost immediately. The average firm in our sample has 6.9
billion United States Dollars (USD) in assets.
In Table 2, we examine the characteristics of firms with and without a link to the Panama

14
Papers data leak using the variable Any_link. Panel A present results of univariate tests to
compare average values of key firm level characteristics of firms with and without links to the
Panama Papers data leak. Firms connected to the data leak are substantially more likely to have
tax haven subsidiaries; moreover, they are exposed to more perceptively corrupt countries on
average and more likely to have subsidiaries in countries whose politicians were implicated by
the data leak. Notably, linked firms have an average total assets of $112.8 billion, compared to
$4.6 billion for firms without a link. This motivates us to control for size throughout our
analysis.
-- -- Table 2 about here -- --
Even though the univariate differences are significant statistically and economically, one
concern is that all results are merely explained by firm size. We therefore now turn to
multivariate probit regressions in which we control for size as well as country and industry fixed
effects. Consistent with the results in Panel A, we find that firms with a link are more likely to
have tax haven subsidiaries and are more exposed to perceptively corruption by both our
measures even after controlling for size and including various fixed effects.
Overall, in this subsection, we establish that our measures of links are sensibly related to
many firm-level characteristics. Thus, firms linked to the leak are larger, more likely to have a
tax haven subsidiary, and more exposed to corruption as well as to countries whose politicians
were implicated. Next, we turn to the effect of the data leak on firm value.

15
3. The Market Reaction to the Panama Papers Data Leak
In this section we analyze the market response to the Panama Paper data leak. We
measure firm value by cumulative raw and abnormal returns around the three event dates
described in Section 1.1. These event dates and associated event periods are listed in Panel A of
Table 3.
--- Table 3 about here ---
3.1 Market Response of Firms Connected to the Panama Papers Data Leak
Panel B of Table 3 shows regressions of our dependent variables on firms’ exposure to
the Panama papers and controls. The dependent variable of interest is Cumulative raw returns
and Cumulative abnormal returns around three event dates. The control variable of interest is
Link=1, a dummy variable equal to one if a firm is linked to any of the three files leaked by ICIJ
through its directors or subsidiaries as defined in Section 1.3. All specifications include country x
industry fixed effects where industries are Fama-French 49.
Our analysis reveals that firms linked to the Panama Papers data leak have negative
cumulative raw returns during the event window. Raw returns over three event dates are 1.15%
lower for such firms than for same-country, same-industry firms without a link to the data leak
(Column (1)).
A possible concern is that firms with Panama Papers exposure tend to have higher market
risk, and that high-beta firms have lower returns during the event period for other reasons.
However, using Cumulative abnormal returns (alphas) over the event windows, firms with link
to the leaked data are still significantly negatively affected though the economic magnitude is
reduced to 0.5% (Column (2)).

16
A similar concern is that firms with Panama Papers exposure are larger and that larger
firms have lower returns during the event period for other reasons. However, additionally
controlling for size, our results remain statistically and economically significant (Columns (3)-
(4)). After controlling for size and country x industry fixed effects, firms linked to the Panama
Papers data leak have 0.5% lower abnormal returns over three event periods associated with
news about the data leak.
Our results are robust to a series of robustness tests. First, rather than cumulating returns
over days [-2;2] around relevant event dates, our results still hold when cumulating over event
dates [-1;3]. Second, our results are robust to controlling for country and industry fixed effects
rather than the interaction of these two effects (interacting the effects may raise concerns that our
identification stems from few industry-country pairs with more than one firm, one of which has a
link). Third, our results are robust when we use alternative estimation periods. Fourth,
winsorizing at other levels does not affect our results.
3.2 Market Response by Link Sub-Measure
We have so far shown that firms with any link to the Panama Papers data leak have
economically and statistically significant negative returns during the event window. Next, we
distinguish firms by their link to each of the 3 Panama Papers data leak files. One purpose of this
analysis is to understand whether the negative market reactions observed in Panel A are driven
by a particular type of link to the Panama Papers data leak.
In Panel C of Table 3, we identify firms that are linked to the entities file (Column (1)),
the officer file (Column (2)), or the intermediary file (Column (3)), respectively, through their
subsidiaries, directors, or directors of subsidiaries. We follow the most robust specification of

17
Panel B for abnormal returns with size control and country x industry fixed effects (Panel B
Column (4)).
In our analysis of the sub measures in Panel C of Table 3, we find that the negative
response by firms linked to the Panama Paper data leak is by-and-large driven by firms with
links to the Officers or Intermediaries file. The magnitude of the effect is largest for firms linked
through the Officer file (0.9%) and no different from zero for firms linked through the entities
file. One possible explanation is that links to Mossack Fonseca’s entity file are more easily
observable prior to the data leak (for instance, Orbis lists tax haven subsidiaries) and that their
value is priced prior to April 2016. Links to the intermediary and officer files might be harder to
observe—and are therefore priced only when they are made public.
3.3 Market Response by Individual Event Day
In a further additional test, we study each event date separately. For instance, even
though the third event date received a lot of public attention (everyone could finally dive into the
data!), firm-specific stories already circulated around the first and—more so—around the second
event date. In efficient markets, if some individuals learn about the content of the leak by event
date two, information posted on ICIJ’s homepage on the third event date would have been priced
earlier already.
In analyzing individual event dates, we again follow the strongest specification of Panel
B for abnormal returns with size control and country x industry fixed effects (Panel B Column
(4)). Splitting by individual event date, we find that abnormal returns of firms linked to the
Panama Paper data leak are most negative around event dates one and two. The market reaction
on both days is of a similar economic magnitude, at -0.4% each (Columns (1)-(2)). The market

18
response on the third event day is not statistically different from zero (Column (3)). Indeed, the
overall market valuation effect is contained in event dates one and two (Column (4)).
4. Cross-sectional Variation in the Market Reaction to the Data Leak
We have so far established that firms linked to the leaked documents had more negative
returns around events related to the Panama Paper data leak. We now turn our attention to
potential channels. In turns, we examine whether the data leak reduces the scope for tax
avoidance and financing corruption. Because any stock price response to the revelations of the
Panama papers may also reflect expected regulatory fines, we entertain this idea in our
interpretation of the results.
4.1 Tax avoidance
The data leak may impact firms’ ability to aggressively avoid taxes or to evade taxes. If
that is the case, more tax aggressive firms with links to the leaked data will suffer more from the
data leak. We therefore now examine whether the effect of the Panama Paper data leak on firm
value is more pronounced for tax aggressive firms.
In Table 4, we study the subset of firms with exposure to the Panama Paper data leak and
also compare these firms to unexposed firms. Our preferred measures of tax avoidance are (i) tax
aggressiveness, measured by the difference between firms’ home country statutory tax rate and
their effective tax rate, and (ii) a Dummy equal to one if a firm has a subsidiary in a territory
listed as a tax haven on the OECD Grey list.
-- Table 4 about here --

19
Among firms with exposure to the leaked data, tax aggressive firms have more negative
abnormal returns though the effect is not statistically significant (Column (1)). Once we augment
the specification to all our sample firms, we find that firms exposed to the leak are significantly
more negatively affected when they are more tax aggressive. This result persists when we control
for having a link to the leaked data and for the tax aggressiveness of all sample firms (Columns
(2)-(3)). Among firms that are linked to the data leak, a one standard deviation higher tax
aggressiveness is associated with a 0.5% (=21.5%*2.487) larger decline in firm value.
Similarly, among firms with exposure to the leaked data, those with a subsidiary in a
territory considered a tax haven by the OECD have 1% lower abnormal returns (Column (4)).
Once we augment the sample to all firms and control for having a link as well as having a tax
haven subsidiary, this effect on firms exposed to the data leak is still significant and amounts to
0.8% of firm value (Columns (5)-(6)).
Overall, firms that avoid taxes more aggressively are more negatively affected by the leak
than other firms, even after controlling for country x industry fixed effects, size, and market risk.
This result suggests that investors believe firms will have diminished ability to (aggressively)
avoid taxes in the future, or that firms will become the subject of regulatory fines for overly
aggressive tax avoidance or even tax evasion.
4.2 Financing Corruption
Besides tax motives, offshore vehicles may have been used to finance corruption, as was
revealed by various news stories illuminating links between firms, governments, and middlemen
in the Panama Paper documents.15
If corporations did indeed use offshore vehicles to finance
15 http://www.france24.com/en/20160725-panama-papers-show-italian-bribes-path-algeria-icij
http://www.cbc.ca/news/business/panama-papers-victor-dahdaleh-alcoa-bribery-case-1.3598527
20
corruption, firms linked to the leaked data and exposed to perceptively corrupt countries will
suffer more from the data leak because they are less able to secretly transfer funds to foreign
politicians or because they may face regulatory fines for violating bribery regulations.16
We
therefore now examine whether the effect of the Panama Paper data leak on firm value is more
pronounced for firms exposed to perceptively corrupt countries.
In Table 5, we study the subset of firms with exposure to the Panama Paper data leak and
also compare these firms to unexposed firms. Our preferred measures of exposure to corruption
are (i) an indicator variable for firms with subsidiaries in ten countries whose high-ranked
government officials were implicated by the data leak and (ii) the highest corruption level a firm
is exposed to through its subsidiaries..
-- Table 5 about here --
Among firms with exposure to the leaked data, those with subsidiary in countries whose
government officials were implicated by the data leak have 1.4% more negative abnormal returns
than those without such subsidiaries (Column (1)). Once we augment the specification to all our
sample firms, the effect is 0.7% after controlling for having a link to the leaked data and for
having a subsidiary in countries whose officials were implicated (Columns (2)-(3)).
Similarly, among firms with exposure to the leaked data, those with a subsidiary in
perceptively more corrupt countries are more negatively affected. Again, once we augment the
sample to all firms and control for having a link to the data leak as well as the level of corruption
of the subsidiary headquartered in the most corrupt country, this effect is still significantly
https://www.theguardian.com/news/2016/may/10/bp-hired-firm-linked-to-bribery-scandal-panama-papers-reveal 16 Examples of regulation making bribery of public government officials illegal includes the Foreign Corrupt
Practices Act (USA; 1977) and the UK Bribery Act (United Kingdom; 2010); moreover, most OECD countries have
signed the OECD Anti-Bribery Convention and thereby agreed to adopt some of its features into national regulation.

21
negative. Among firms that are linked to the data leak, a one standard deviation higher
corruption exposure score is associated with a 2.2% (=2.05*1.079%) larger decline in firm value.
Overall, firms that are more exposed to perceptively corrupt countries are more
negatively affected by the leak than other firms, even after controlling for country x industry
fixed effects, size, and market risk. This indicates that the data leak reduces firms’ ability to win
contracts in perceptively corrupt countries or that firms may become subject of regulatory
punishment for violations of anti-bribery regulations.
5. Conclusion
We use the data leak of the Panama Papers on April 3, 2016 to study whether and how
the use of offshore vehicles affects valuation around the world. The data leak made transparent
the operations of more than 214,000 shell companies incorporated in tax havens by Panama-
based law firm Mossack Fonseca. We find that, around the world, the data leak erased an
unprecedented risk-adjusted US$112 billion in market capitalization among 488 firms with direct
exposure to the revelations of the Panama Papers, reflecting 0.5%-0.6% of these firms’ market
value. The negative effect on firms with exposure to the leak is stronger among tax aggressive
firms and firms with exposure to more corrupt countries, especially to countries where high-
ranked government officials were implicated by name in the leaked data. These results suggest
that investors associate the leak with reductions in firms’ ability to avoid taxes and finance
corruption, or with regulatory fines for tax evasion and violating anti-corruption regulations.
Our results shed light on uses of offshore vehicles other than for tax avoidance purposes.
Notably, offshore vehicles appear to be used to hide other value-enhancing but illegal activities.
We leave the analysis of real responses by firms linked to the data leak to future research.

22
References
Bardhan, Pranab. 1997. Corruption and development: A review of issues. Journal of Economic
Literature 35, 1320-1346.
Bennedsen, Morten and Stefan Zeume. 2016. Corporate Tax Havens and Transparency. Working
Paper. Cheung, Yan Leung, P. Raghanvendra Rau, and Aris Stouritis. 2012. How much do firms pay as
bribes and what benefits do they get? Evidence from corruption cases worldwide. NBER
Working Paper.
Desai, Mihir A., Alexander Dyck, and Luigi Zingales. 2007. Theft and taxes. Journal of
Financial Economics 84, 591–623.
Desai, Mihir A., C. Fritz Foley, and James R. Hines. 2004. Economic Effects of Regional Tax
Havens. NBER Working Paper.
Graham, John R., and Alan L. Tucker. 2006. Tax shelters and corporate debt policy. Journal of
Financial Economics 81, 563–594.
Hanlon, Michelle, and Shane Heitzman. 2010. A review of tax research. Journal of Accounting
and Economics 50, 127–178.
Hanlon, Michelle, Rebecca Lester, and Rodrigo S. Verdi. 2015. The effect of repatriation tax
costs on U.S. multinational investment. Journal of Financial Economics 116, 179-196.
Hanlon, Michelle, Edward L. Maydew, and Jacob R. Thornock. 2015. Taking the long way
home: U.S. tax evasion and offshore investments in U.S. equity and debt markets. Journal of
Finance 70, 257–287.
Johannesen, Niels, and Gabriel Zucman. 2014. The end of bank secrecy? An evaluation of the
G20 tax crackdown. American Economic Journal: Economic Policy 6, 65–91.
Karpoff, Jonathan M., D. Scott Lee, and Gerald S. Martin. 2015. The value of foreign bribery to
bribe-paying firms. Working Paper.
Mironov, Maxim. 2013. Taxes, theft, and firm performance. Journal of Finance 68, 1441–1472.
Nesbitt, Wayne L., Edmund Outslay, and Anh Persson. 2016. The Relation between Tax Risk
and Firm Value: Evidence from the Luxembourg Tax Leaks. Michigan State University Working Paper.
Shleifer, Andrei and Robert W. Vishny. 1993. Corruption. Quarterly Journal of Economics 108,
599-617.
Slemrod, Joel. 1985. An Empirical Test for Tax Evasion. The Review of Economic and Statistics
67, 232-238.
Svensson, Jakob. 2005. Eight questions about corruption. The Journal of Economic Perspectives
19, 19-42.
Zeume, Stefan. 2016. Bribes and Firm Value. Working Paper.

23
Table 1
Summary Statistics
This table shows summary statistics of firms with and without exposure to the Panama Papers data leak.
Panel A shows the number of firms linked to the leak by entity, officer, and intermediary. Details on the
procedure to establish these links can be found in Appendix 1. Panel B shows number and fraction of
firms linked to the leak by country for countries with at least 50 firms; countries with fewer than 50 firms
are aggregated to Rest of the World. Panel C presents summary statistics of all firm and country level
variables used in the analysis. Continuous variables are winsorized at 1% and 99% level. All variables are
defined in the appendix.
Panel A: Firms Connected to the Panama Papers Data Leak
Link Type #Firms #Firms with Link %Firms with Link
Fuzzy Matches
Entity Link
23,535
253
1.1%
Officer Link 23,535 390 1.70%
Intermediary Link 23,535 102 0.4%
Any Link 23,535 488 2.1%
Others
Has Subsidiary in Major
Mossack Fonseca Tax Haven 23,535 1,083 4.6%

24
Panel B: Firms Connected to the Panama Papers Data Leak by Country
Country # Firms # Firms
with Link
% Firms
with Link
% Firms
with Entity
Link
% Firms
Officer
Link
% Firms
Intermediary
Link
Average
number of
subsidiaries
Hong Kong 161 36 22.4% 22.4% 12.4% 6.2% 46
UK 1,079 152 14.1% 5.2% 12.2% 3.8% 40
Russia 100 7 7.0% 6.0% 3.0% 0.0% 33
Belgium 108 7 6.5% 4.6% 4.6% 1.9% 36
Austria 66 4 6.1% 0.0% 6.1% 0.0% 77
Spain 124 7 5.7% 0.8% 4.0% 0.8% 86
Netherlands 107 5 4.7% 2.8% 3.7% 0.0% 62
Italy 216 9 4.2% 2.3% 3.2% 1.4% 37
France 551 19 3.5% 2.5% 2.4% 1.1% 49
Israel 326 11 3.4% 1.2% 3.1% 0.6% 13
Sweden 258 7 2.7% 0.8% 1.9% 1.2% 22
USA 3,505 94 2.7% 1.4% 2.1% 0.5% 50
Canada 696 18 2.6% 0.9% 2.3% 0.6% 12
Australia 587 15 2.6% 1.4% 2.0% 0.0% 28
Norway 127 3 2.4% 0.8% 2.4% 0.8% 23
Singapore 305 7 2.3% 1.6% 1.6% 0.7% 18
Germany 493 11 2.2% 1.0% 2.2% 0.4% 61
Philippines 90 2 2.2% 1.1% 2.2% 0.0% 7
China 2,270 29 1.3% 1.1% 1.0% 0.1% 11
Greece 80 1 1.3% 1.3% 0.0% 0.0% 18
Mexico 109 1 0.9% 0.0% 0.9% 0.0% 20
Denmark 111 1 0.9% 0.9% 0.9% 0.9% 27
India 1,585 11 0.7% 0.3% 0.6% 0.1% 7
Taiwan 1,124 7 0.6% 0.6% 0.4% 0.0% 7
Malaysia 602 3 0.5% 0.3% 0.5% 0.0% 14
Turkey 279 1 0.4% 0.0% 0.4% 0.0% 8
Poland 352 1 0.3% 0.0% 0.3% 0.0% 9
Japan 3,443 9 0.3% 0.0% 0.3% 0.0% 16
Argentina 63 0 0.0% 0.0% 0.0% 0.0% 7
Brazil 251 0 0.0% 0.0% 0.0% 0.0% 11
Bulgaria 83 0 0.0% 0.0% 0.0% 0.0% 9
Chile 110 0 0.0% 0.0% 0.0% 0.0% 14
Croatia 71 0 0.0% 0.0% 0.0% 0.0% 10
Egypt 89 0 0.0% 0.0% 0.0% 0.0% 11

25
Finland 115 0 0.0% 0.0% 0.0% 0.0% 35
Indonesia 57 0 0.0% 0.0% 0.0% 0.0% 10
Korea (Rep.) 1,681 0 0.0% 0.0% 0.0% 0.0% 4
Kuwait 72 0 0.0% 0.0% 0.0% 0.0% 13
New Zealand 90 0 0.0% 0.0% 0.0% 0.0% 15
Pakistan 128 0 0.0% 0.0% 0.0% 0.0% 3
Peru 89 0 0.0% 0.0% 0.0% 0.0% 3
Romania 55 0 0.0% 0.0% 0.0% 0.0% 9
South Africa 179 0 0.0% 0.0% 0.0% 0.0% 25
Sri Lanka 117 0 0.0% 0.0% 0.0% 0.0% 8
Switzerland 210 0 0.0% 0.0% 0.0% 0.0% 39
Thailand 202 0 0.0% 0.0% 0.0% 0.0% 9
Vietnam 384 0 0.0% 0.0% 0.0% 0.0% 1
Rest of the World 635 10 1.6% 1.1% 1.3% 0.2% 18
Total 23535 488 2.1% 1.1% 1.7% 0.4% 23
26
Panel C: Summary Statistics of Key Variables
Variable N Mean STDev P25 Median P75
Tax Haven Link 23,535 15.1% 35.8% 0.0% 0.0% 0.0%
Tax Aggressiveness 15,522 15.1% 21.5% 6.6% 15.1% 25.2%
Has 1st
Layer 23,535 6.5% 24.6% 0.0% 0.0% 0.0%
Corruption Exposure 23,474 4.94 2.05 2.7 5.2 6.6
Total Assets ($mn) 23,535 6,877 63,052 83 317 1,394
Has Foreign subsidiary 23,535 44.8% 49.7% 0.0% 0.0% 100.0%
% of Foreign Subsidiaries 23,535 20.9% 30.8% 0.0% 0.0% 45.3%
Number of subsidiaries 23,535 22.5 63.7 1.0 5.0 17.0
Number of foreign countries 23,535 3.1 8.2 0.0 0.0 2.0

27
Table 2
Univariate Analysis
This table shows characteristics of firms with and without exposure to the Panama Papers data leak. Panel
A shows the mean value of key variables for firms with and without exposure to the Panama Papers data
leak in Has Link and Has No Link, respectively. The column labeled Difference captures the difference in
means between the two groups. Panel B shows the results of probit regressions relating firm
characteristics to the probability of exposure to the leak. Country and industry fixed effects (Fama–French
49) are included as indicated. Standard errors, clustered by country and industry, are given in parentheses.
The Appendix provides detailed variable definitions for variables used in both Panels. All continuous
variables are winsorized at the 1% and 99% levels. *,**, and *** indicate statistical significance at a
10%, 5%, and 1% level, respectively.
Panel A: Univariate Split
Variable Firm Has No Link Firm Has Link Difference
# Firms Mean # Firms Mean
Tax Haven Link 23,047 14.2% 488 55.9% -41.7%***
Tax Aggressiveness 15,166 15.1% 356 16.0% -0.94%
Has 1st
Layer 23,047 6.0% 488 29.9% -23.9%***
Corruption Exposure 22,987 4.9 487 6.0 -1.1***
Total Assets 23,047 4,635 488 112,770 -108,135***
Has foreign subsidiary 23,047 47.4% 488 91.6% -44.2%***
Percentage of foreign
subsidiaries
23,047 22.8% 488 45.8% -23.0%***
Number of
subsidiaries
23,047 2.9 488 15.5 -12.5***
Number of foreign
subsidiaries
23,047 20.1 488 139.4 -119.3***

28
Panel B: Multivariate Probit
(1)
Has Link (2)
Has Link (3)
Has Link (4)
Has Link
Tax Haven Link
0.464***
0.405***
(0.0964) (0.0950) Tax Aggressiveness -0.0851 -0.0923*
Has 1St
Layer
0.372*** (0.0685)
0.602*** (0.0488)
(0.0661) (0.0848) Corruption exposure 0.0955*** 0.131***
(0.0151) (0.0186)
Size 0.233*** 0.223*** 0.229*** 0.222***
(0.0328) (0.0306) (0.0294) (0.0334)
Country FE
Y
Y
Y
Y
Industry FE Y Y Y Y
Clustered SE Y Y Y Y
Observations 18,834 18,790 12,419 12,397

29
Table 3
Abnormal Returns and Exposure
This table provides an overview of the event dates (Panel A) and then links returns of publicly listed firms
around these event dates to firm characteristics (Panels B-D). In Panels B-D, the sample consists of all
publicly listed firms with non-missing daily returns in the 5 days surrounding at least one of the three
event dates. In Panel A, the dependent variable is Cumulative raw return in Columns (1) and (3) and
Cumulative abnormal return in Columns (2) and (4). The independent variable of interest is Link=1, a
dummy that takes the value of 1 if any entity, intermediary, or officer listed in the leaked Mossack
Fonseca documents is linked to a subsidiary of a firm in our sample, a director of a firm in our sample, or
a director of a sample firm’s subsidiary. Size is the natural logarithm of a firm’s assets in $000s. Panels C
and D follow exactly the set-up of Panel B Column (4) but vary the Link types and event period,
respectively. In Panel C, Link=1 is a dummy variable that takes a value of 1 if an entity (Column (1)), an
officer (Columns (2)), or an intermediary (Column (3)) listed in the leaked Mossack Fonseca documents
is linked to a subsidiary of a firm in our sample, a director of a firm in our sample, or a director of a
sample firm’s subsidiary. In Panel D, Cumulative Abnormal Returns are measured over each individual
event day (Columns (1)-(3)) and the first two event days (Column (4)). The Appendix provides detailed
variable definitions. All continuous variables are winsorized at the 1% and 99% levels. Country times
industry fixed effects (Fama–French 49) are included as indicated. Standard errors are clustered at
country and industry level (2-way cluster). t-statistics are given in parentheses; *, **, and *** denote
significance at the 10%, 5%, and 1% levels, respectively.
Panel A: Event days
Variable Date (2016) Event window [-2;2] Description
Day 1 Sunday, April 3 March 31 – April 6 First news stories from the leaked
documents published, along with 150
documents.
Day 2 Tuesday, April 26 April 22 – April 28 Announcement that all documents will be made public. Journalists publish
further news stories, suggesting that
Day 3
Monday, May 9
May 5 – May 11
documents are available to them. Leaked documents released to the
public by ICIJ.
Panel B: Market Response of Firms Connected to the Panama Papers Data Leak
(1) (2) (3) (4)
LHS Raw Return Alpha Raw Return Alpha
Link=1 -1.149***
(-4.12)
-0.477**
(-2.30)
-0.656***
(-2.83)
-0.547**
(-2.19)
Size -0.205** 0.029
(-2.13) (0.48)
Country * Industry FE Y Y Y Y
N 23,535 23,535 23,535 23,535
R2 0.116 0.055 0.119 0.055
Adj. R2 0.112 0.050 0.114 0.050

30
Panel C: Market Response by Link Sub-Measure
LHS
(1)
Alpha
(2)
Alpha
(3)
Alpha Link Type Entity Officer Intermediary
Link=1 0.121 -0.923*** -0.633*
(0.29) (-4.18) (-1.68)
Controls Y Y Y Country * Industry FE Y Y Y
N 23,535 23,535 23,535
R2 0.055 0.055 0.055
Adj. R2 0.050 0.051 0.050
Panel D: Market Response by Individual Event Day
(1)
LHS Alpha
(2)
Alpha
(3)
Alpha
(4)
Alpha Event days Day 1 Day 2 Day 3 Days 1&2
Link=1 -0.357* -0.354*** 0.001 -0.547**
(-1.79) (-2.78) (0.01) (-2.53)
Controls Y Y Y Y Country * Industry FE Y Y Y Y
N 23,396 23,090 23,015 23,511
R2 0.093 0.035 0.111 0.062
Adj. R2 0.088 0.030 0.106 0.057

31
Table 4
Tax Avoidance
This table links Cumulative abnormal returns around three event days associated with the leaked
Mossack Fonseca documents to firms’ tax characteristics. The sample consists of all publicly listed firms
with non-missing daily returns in the 5 days surrounding at least one of the three event dates. Link=1, a
dummy that takes the value of 1 if any entity, intermediary, or officer listed in the leaked Mossack
Fonseca documents is linked to a subsidiary of a firm in our sample, a director of a firm in our sample, or
a director of a sample firm’s subsidiary. In Columns (1)-(3), the tax aggressiveness measure of interest is
Tax Aggressiveness, the statutory tax rate at the country level less a firm’s effective tax rate. The effective
tax rate is defined as tax over EBIT. In Columns (4)-(6), the tax aggressiveness measure of interest is Tax
Haven Link, a dummy equal to one if a firm, in 2015, has at least one subsidiary in a tax haven listed on
the OECD Grey List (as of August 17, 2009). Controls include LN(Assets) and fixed effects are included
as indicated. The Appendix provides detailed variable definitions. All continuous variables are winsorized
at the 1% and 99% levels. Standard errors are clustered at country and industry level (2-way cluster). t-
statistics are given in parentheses; *, **, and *** denote significance at the 10%, 5%, and 1% levels,
respectively.
Tax Variable
(1)
Tax
(2)
Tax
(3)
Tax
(4)
Tax
(5)
Tax
(6)
Tax Aggressiven. Aggressiven. Aggressiven. Haven Haven Haven
Link to Leak -0.158 -0.066 0.125 0.083
(-0.65) (-0.30) (0.45) (0.30)
Tax Variable -1.413 0.623 -0.992*** -0.287**
(-1.08) (1.12) (-2.79) (-2.40)
Interaction -1.912** -2.487** -1.045*** -0.781***
(-2.38) (-2.25) (-4.41) (-2.67)
Controls Y Y Y Y Y Y
Industry FE Y - - Y - -
Country FE Y - - Y - -
Ind*Ctr FE N Y Y N Y Y
N 356 15,522 15,522 488 23,535 23,535
R2 0.353 0.061 0.062 0.314 0.055 0.056
Adj. R2 0.189 0.054 0.054 0.185 0.051 0.051

32
Table 5
Exposure to Implicated Politicians and Corruption
This table links Cumulative abnormal returns around three event days associated with the leaked
Mossack Fonseca documents to firms’ exposure to corruption. The sample consists of all publicly listed
firms with non-missing daily returns in the 5 days surrounding at least one of the three event dates.
Link=1, a dummy that takes the value of 1 if any entity, intermediary, or officer listed in the leaked
Mossack Fonseca documents is linked to a subsidiary of a firm in our sample, a director of a firm in our
sample, or a director of a sample firm’s subsidiary. In Columns (1)-(3), the measure of interest is Has
1StLayer Link, a Dummy variable equal to one if a firm has at least one subsidiary in any of the countries
whose presidents or major officials were implicated by the Panama Papers (Argentina, Georgia, Iceland,
Iraq, Jordan, Qatar, Saudi Arabia, Sudan, United Arab Emirates, Ukraine). In Columns (4)-(6), the
measure of interest is Corruption exposure, the natural logarithm of the minimum corruption score of a
firm’s subsidiary headquarter countries. Controls include LN(Assets) and fixed effects are included as
indicated. The Appendix provides detailed variable definitions. All continuous variables are winsorized at
the 1% and 99% levels. Standard errors are clustered at country and industry level (2-way cluster). t-
statistics are given in parentheses; *, **, and *** denote significance at the 10%, 5%, and 1% levels,
respectively.
Corruption
(1)
Has 1St
(2)
Has 1St
(3)
Has 1St
(4)
Corruption
(5)
Corruption
(6)
Corruption
Variable Layer Link Layer Link Layer Link Exposure Exposure Exposure
Link to Leak 0.046 -0.054 -2.608*** -2.118**
(0.16) (-0.18) (-3.00) (-2.32)
Corruption -1.361*** -0.400*** -1.121 -0.398*
Variable (-3.81) (-2.62) (-1.29) (-1.75)
Interaction -1.071***
(-4.42)
-0.740***
(-2.58) -1.358**
(-2.35)
-1.079*
(-1.76)
Controls Y Y Y Y Y Y
Industry FE Y - - Y - -
Country FE Y - - Y - -
Ind*Ctr FE N Y Y N Y Y
N 488 23,535 23,535 487 23,474 23,474
R2 0.392 0.055 0.056 0.389 0.055 0.056
Adj. R2 0.277 0.051 0.051 0.274 0.050 0.051

33
Appendix 1: Data Appendix
All continuous variables are winsorized at the 1% and 99% levels.
Description Description (detailed) Source
Alpha [a;b] Cumulative daily abnormal returns in % from closing on day a-1 to closing of day b relative to
some event date. Daily abnormal returns are obtained from parameters of a one-factor model
estimated over days [−294; −41] relative to event dates. Excess return on the market is the
return of the local index in USD over and above the US risk-free rate.
Datastream
Cumulative raw
returns [a;b]
Cumulative daily stock returns in % from closing on day a-1 to closing of day b relative to
some event date.
Datastream
Entity Link
(Fuzzy)
Intermediary
Link (Fuzzy)
Officer Link
(Fuzzy)
Any Link
(Fuzzy)
A dummy variable that takes a value of 1 if an entity listed in the leaked Mossack Fonseca
documents is linked to a subsidiary of a firm in our sample, a director of a firm in our sample,
or the director of a sample firm’s subsidiary. Links are established using (i) exact matches
between the headquarter country of the entity in the Mossack Fonseca documents and the
headquarter country of the firm, its subsidiaries, or officers in our data, and (ii) a fuzzy match
of the entity’s name.
A dummy variable that takes a value of 1 if an intermediary listed in the leaked Mossack
Fonseca documents is linked to a subsidiary of a firm in our sample, a director of a firm in our
sample, or the director of a sample firm’s subsidiary. Links are established using (i) exact
matches between the headquarter country of the intermediary in the Mossack Fonseca
documents and the headquarter country of the firm, its subsidiaries, or officers in our data, and
(ii) a fuzzy match of the intermediary’s name.
A dummy variable that takes a value of 1 if an officer listed in the leaked Mossack Fonseca
documents is linked to a subsidiary of a firm in our sample, a director of a firm in our sample,
or the director of a sample firm’s subsidiary. Links are established using (i) exact matches
between the headquarter country of the officer in the Mossack Fonseca documents and the
headquarter country of the firm, its subsidiaries, or officers in our data, and (ii) a fuzzy match
of the officer’s name.
A dummy variable which takes the value of 1 if a firm has an entity link, an intermediary link,
or an officer link using the fuzzy match.
ICIJ, Orbis
ICIJ, Orbis
ICIJ, Orbis
ICIJ, Orbis
Has Any Dummy variable equal to 1 if a firm has at least one subsidiary in any of the four main tax
havens used by Mossack Fonseca (Panama, British Virgin Islands, Bahamas, Seychelles).
Orbis
Tax
Aggressiveness
The statutory tax rate at the country level less a firm’s effective tax rate. The effective tax rate
is defined as tax over EBIT.
KPMG,
Orbis
Tax Haven Link Dummy variable equal to 1 if a firm, in 2015, has at least one subsidiary in a tax haven listed
on the OECD Grey List (as of August 17, 2009).
Orbis
Has 1st Layer
Link
Corruption
Exposure
Dummy variable equal to 1 if a firm has at least one subsidiary in any of the countries whose
presidents or major officials were implicated by the Panama Papers (Argentina, Georgia,
Iceland, Iraq, Jordan, Qatar, Saudi Arabia, Sudan, United Arab Emirates, Ukraine).
The natural logarithm of the minimum corruption score of a firm’s subsidiary headquarter
countries. Uses Transparency International’s Corruption Perceptions Index subtracted from 10
so that Corruption exposure is increasing in firms’ exposure to corruption.
Orbis
Orbis,
Transparency
International
Total Assets Total assets. Regressions use the natural logarithm. Worldscope/
Datastream
# Subsidiaries Number of subsidiaries.
MNE (Dummy) Dummy variable equal to 1 if a firm has at least one subsidiary outside of its parent
headquarter country.
Orbis
% Foreign
Subsidiaries
# Foreign
Countries
Fraction of a firm’s subsidiaries headquartered outside of its parent headquarter country. Orbis
Number of foreign countries in which firm has subsidiaries. Orbis

34
Appendix 2: Firms Connected to the Panama Papers Data Leak by Industry
Industry #Firms #Firms
with Link
%Firms
with Link
%Firms with
Entity Link
%Firms with
Officer Link
%Firms with Inter-
mediary Link
Average
#Subsidiaries
Trading 882 96 10.9% 4.2% 10.1% 1.8% 24
Insurance 39 3 7.7% 0.0% 7.7% 2.6% 81
Aircraft 56 3 5.4% 0.0% 5.4% 0.0% 52
Banking 224 12 5.4% 1.8% 5.4% 1.3% 30
Restaurants,
Hotels, Motels
303 11 3.6% 2.3% 2.6% 1.0% 30
Real Estate 794 27 3.4% 3.2% 2.1% 0.9% 45
Construction 499 16 3.2% 1.2% 2.6% 0.8% 37
Non-Metallic and
Industrial Metal
Mining
188 6 3.2% 2.7% 2.7% 1.1% 22
Transportation 536 15 2.8% 2.1% 1.9% 0.4% 30
Apparel 192 5 2.6% 2.6% 1.6% 0.5% 26
Petroleum and
Natural Gas
461 12 2.6% 1.3% 2.6% 0.0% 28
Entertainment 164 4 2.4% 1.2% 1.2% 0.0% 25
Machinery 712 16 2.3% 1.0% 1.5% 0.0% 21
Retail 621 14 2.3% 1.1% 1.6% 0.8% 33
Recreation 91 2 2.2% 1.1% 1.1% 1.1% 13
Personal Services 156 3 1.9% 0.0% 1.9% 0.0% 25
Steel Works 417 8 1.9% 1.4% 1.0% 0.0% 17
Coal 53 1 1.9% 1.9% 1.9% 0.0% 22
Business Services 1,706 32 1.9% 1.2% 1.3% 0.3% 23
Business Supplies 219 4 1.8% 0.5% 1.4% 0.5% 22
Beer & Liquor 179 3 1.7% 0.6% 1.7% 0.6% 26
Communication 433 7 1.6% 0.7% 1.2% 0.0% 29
Electronic
Equipment
Medical
Equipment
555 9 1.6% 1.3% 0.7% 0.2% 16
203 3 1.5% 1.5% 0.5% 0.0% 23
Wholesale 675 10 1.5% 0.7% 1.0% 0.4% 21
Precious Metals 149 2 1.3% 1.3% 0.0% 0.7% 11
Automobiles and
Trucks
307 4 1.3% 0.7% 1.3% 0.0% 31
Utilities 474 6 1.3% 0.6% 0.8% 0.0% 37
Measuring and
Control Equipment
159 2 1.3% 0.6% 1.3% 0.0% 33

35
Shipping
Containers
88 1 1.1% 1.1% 0.0% 0.0% 16
Construction
Materials
624 7 1.1% 1.0% 0.8% 0.3% 19
Textiles 292 3 1.0% 0.3% 1.0% 0.3% 7
Food Products 508 5 1.0% 0.4% 0.8% 0.4% 21
Printing and
Publishing
126 1 0.8% 0.0% 0.8% 0.0% 27
Chemicals 633 4 0.6% 0.2% 0.3% 0.2% 20
Computers 167 1 0.6% 0.6% 0.0% 0.6% 14
Consumer Goods 365 2 0.6% 0.6% 0.6% 0.0% 23
Rubber and Plastic
Products
200 1 0.5% 0.5% 0.5% 0.0% 13
Agriculture 219 1 0.5% 0.0% 0.5% 0.0% 16
Electrical
Equipment
498 2 0.4% 0.4% 0.2% 0.0% 18
Pharmaceutical
Products
634 2 0.3% 0.2% 0.0% 0.2% 17
Defense 8 0 0.0% 0.0% 0.0% 0.0% 23
Fabricated
Products
67 0 0.0% 0.0% 0.0% 0.0% 7
Healthcare 153 0 0.0% 0.0% 0.0% 0.0% 67
Shipbuilding,
Railroad
Equipment
51 0 0.0% 0.0% 0.0% 0.0% 28
Tobacco Products 24 0 0.0% 0.0% 0.0% 0.0% 38
Other 7,431 122 1.6% 0.8% 1.5% 0.5% 17
Total 23,535 488 2.1% 1.1% 1.7% 0.4% 23