The Value of Honey Bees As Pollinators of U.S. Crops in 2000utahcountybeekeepers.org/Other...
31
________ Roger A. Morse Nicholas W. Calderone Cornell University Ithaca - New York HomePage | This Month's BeeCulture | Archived Articles | More Information | Subscribe Today The Value of Honey Bees As Pollinators of U.S. Crops in 2000 page: 1 2 3 4 5 6 7 8 9 10 11 12 13 14 15 next > March 2000 pg. 1 Pollination 2000 Page 1 of 1 Pollination 2000 - Cover 6/13/2003 http://www.beeculture.com/beeculture/pollination2000/pg1.html
Transcript of The Value of Honey Bees As Pollinators of U.S. Crops in 2000utahcountybeekeepers.org/Other...
________
Roger A. Morse
Nicholas W. Calderone
Cornell University
Ithaca - New York
HomePage | This Month's BeeCulture | Archived Articles | More Information | Subscribe Today
The Value of Honey Bees
As Pollinators of
U.S. Crops
in 2000
page: 1 2 3 4 5 6 7 8 9 10 11 12 13 14 15 next >
March 2000 pg. 1 Pollination 2000
Page 1 of 1Pollination 2000 - Cover
6/13/2003http://www.beeculture.com/beeculture/pollination2000/pg1.html
The Value of Honey Bees As Pollinators of U.S. Crops in 2000
< previous 1 2 3 4 5 6 7 8 9 10 11 12 13 14 15 next >
Summary
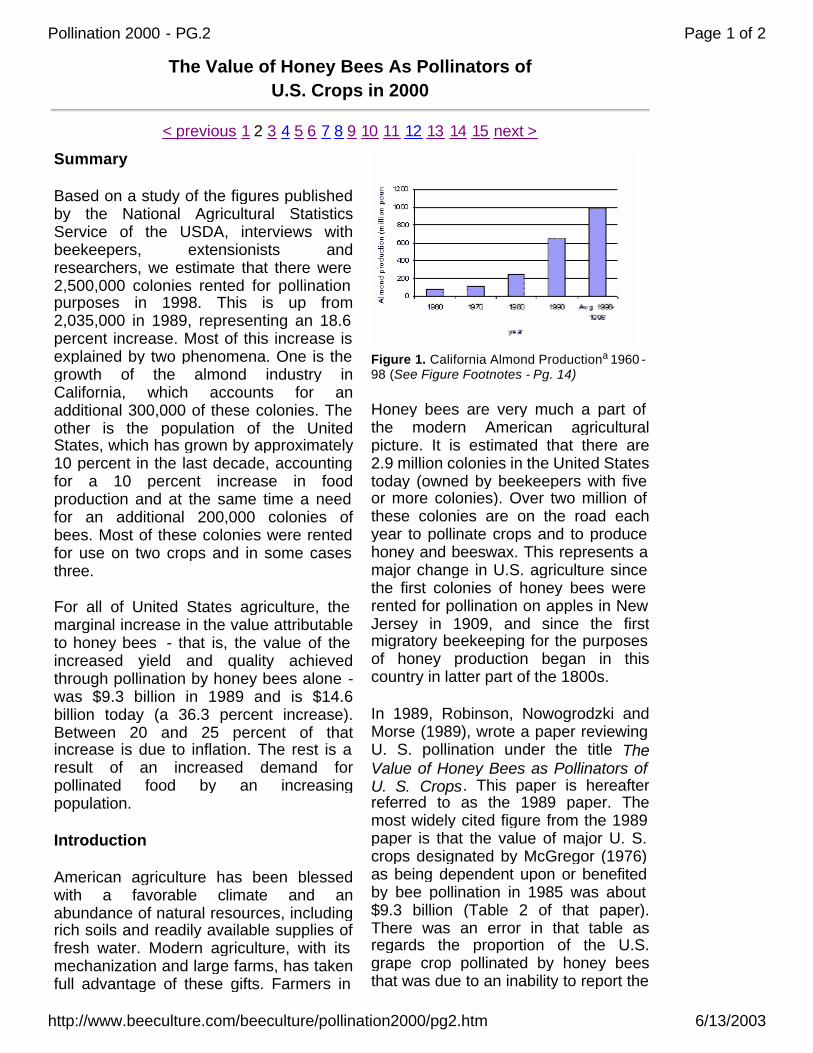
Based on a study of the figures published by the National Agricultural Statistics Service of the USDA, interviews with beekeepers, extensionists and researchers, we estimate that there were 2,500,000 colonies rented for pollination purposes in 1998. This is up from 2,035,000 in 1989, representing an 18.6 percent increase. Most of this increase is explained by two phenomena. One is the growth of the almond industry in California, which accounts for an additional 300,000 of these colonies. The other is the population of the United States, which has grown by approximately 10 percent in the last decade, accounting for a 10 percent increase in food production and at the same time a need for an additional 200,000 colonies of bees. Most of these colonies were rented for use on two crops and in some cases three.
For all of United States agriculture, the marginal increase in the value attributable to honey bees - that is, the value of the increased yield and quality achieved through pollination by honey bees alone - was $9.3 billion in 1989 and is $14.6 billion today (a 36.3 percent increase). Between 20 and 25 percent of that increase is due to inflation. The rest is a result of an increased demand for pollinated food by an increasing population.
Introduction
American agriculture has been blessed with a favorable climate and an abundance of natural resources, including rich soils and readily available supplies of fresh water. Modern agriculture, with its mechanization and large farms, has taken full advantage of these gifts. Farmers in
Figure 1. California Almond Productiona 1960 -98 (See Figure Footnotes - Pg. 14)
Honey bees are very much a part of the modern American agricultural picture. It is estimated that there are 2.9 million colonies in the United States today (owned by beekeepers with five or more colonies). Over two million of these colonies are on the road each year to pollinate crops and to produce honey and beeswax. This represents a major change in U.S. agriculture since the first colonies of honey bees were rented for pollination on apples in New Jersey in 1909, and since the first migratory beekeeping for the purposes of honey production began in this country in latter part of the 1800s.
In 1989, Robinson, Nowogrodzki and Morse (1989), wrote a paper reviewing U. S. pollination under the title The Value of Honey Bees as Pollinators of U. S. Crops. This paper is hereafter referred to as the 1989 paper. The most widely cited figure from the 1989 paper is that the value of major U. S. crops designated by McGregor (1976) as being dependent upon or benefited by bee pollination in 1985 was about $9.3 billion (Table 2 of that paper). There was an error in that table as regards the proportion of the U.S. grape crop pollinated by honey bees that was due to an inability to report the
Page 1 of 2Pollination 2000 - PG.2
6/13/2003http://www.beeculture.com/beeculture/pollination2000/pg2.htm
The Value of Honey Bees As Pollinators of U.S. Crops in 2000
< previous 1 2 3 4 5 6 7 8 9 10 11 12 13 14 15 next >
Changes in American agriculture
The United States Department of Agriculture's National Agricultural Statistics Service for 1998 paints a clear picture as regards what has happened to agriculture in the past 100 years in this country.
In the case of several crops, we see that acreage is increasing, but planting and/or management schemes are much different. Often, we cannot compare 1989 and today's acreages because the number of flowers per acre, as well as production per acre, are different. This is evident from the discussions of several crops, especially almonds, apples and lowbush blueberries.
Growth of the American population
At the same time that farm numbers and the acreage devoted to agriculture are decreasing, there continues to be a sharp rise in the population in the United States, as is summarized in Table 2. This, in part, has changed market demands and is responsible for the growth in the production of some crops.
Table 1. Farms*: Numbers, Acreage and Average Size
Year Number of Farms Farms (acreage)
Average Acreage per
Farm
1910 6,385,822 878,798,325 138
1950 (peak acreage) 1,161,419,720
1988 2,200,940 994,423,423 452
1997 2,057,910 968,338,000 471
*A farm is any establishment from which $1,000 or more of agricultural products were sold or would normally be sold during the year. (NASS 1998)
Table 2. U.S. Population Growth, Past, Present & Projected. (from Statistical
Abstracts of the U.S., 1998)
Year Population
1790 3,929,214
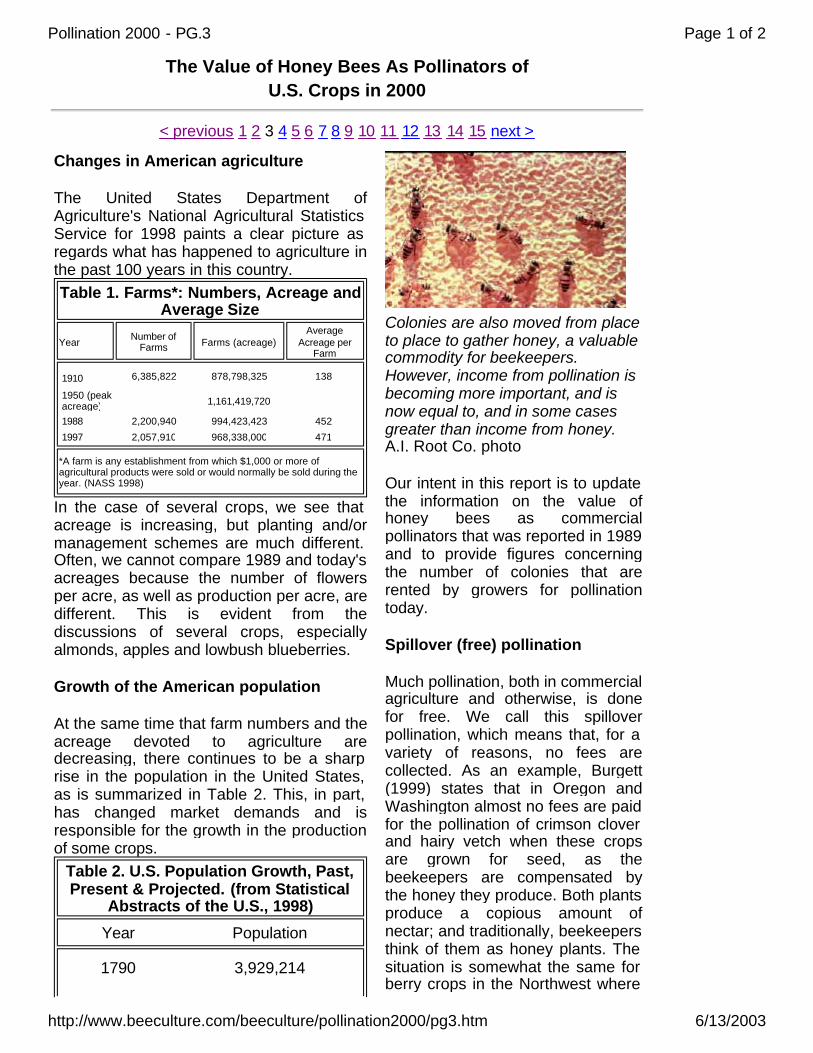
Colonies are also moved from place to place to gather honey, a valuable commodity for beekeepers. However, income from pollination is becoming more important, and is now equal to, and in some cases greater than income from honey. A.I. Root Co. photo
Our intent in this report is to update the information on the value of honey bees as commercial pollinators that was reported in 1989 and to provide figures concerning the number of colonies that are rented by growers for pollination today.
Spillover (free) pollination
Much pollination, both in commercial agriculture and otherwise, is done for free. We call this spillover pollination, which means that, for a variety of reasons, no fees are collected. As an example, Burgett (1999) states that in Oregon and Washington almost no fees are paid for the pollination of crimson clover and hairy vetch when these crops are grown for seed, as the beekeepers are compensated by the honey they produce. Both plants produce a copious amount of nectar; and traditionally, beekeepers think of them as honey plants. The situation is somewhat the same for berry crops in the Northwest where
Page 1 of 2Pollination 2000 - PG.3
6/13/2003http://www.beeculture.com/beeculture/pollination2000/pg3.htm
HomePage | This Month's BeeCulture | Archived Articles | More Information | Subscribe Today
1890 62,947,7141990 248,718,301
1990-1998 270,251,655 (a 21,533,354 increase)
2050 projected 393,931,000
fees are paid for the use of some colonies and not for others owned by beekeepers producing honey. Mussen (1999) points out that the same is true of some California crops (see the discussion of California Agriculture Statistics and Position below). This makes the average overall pollination fees paid to
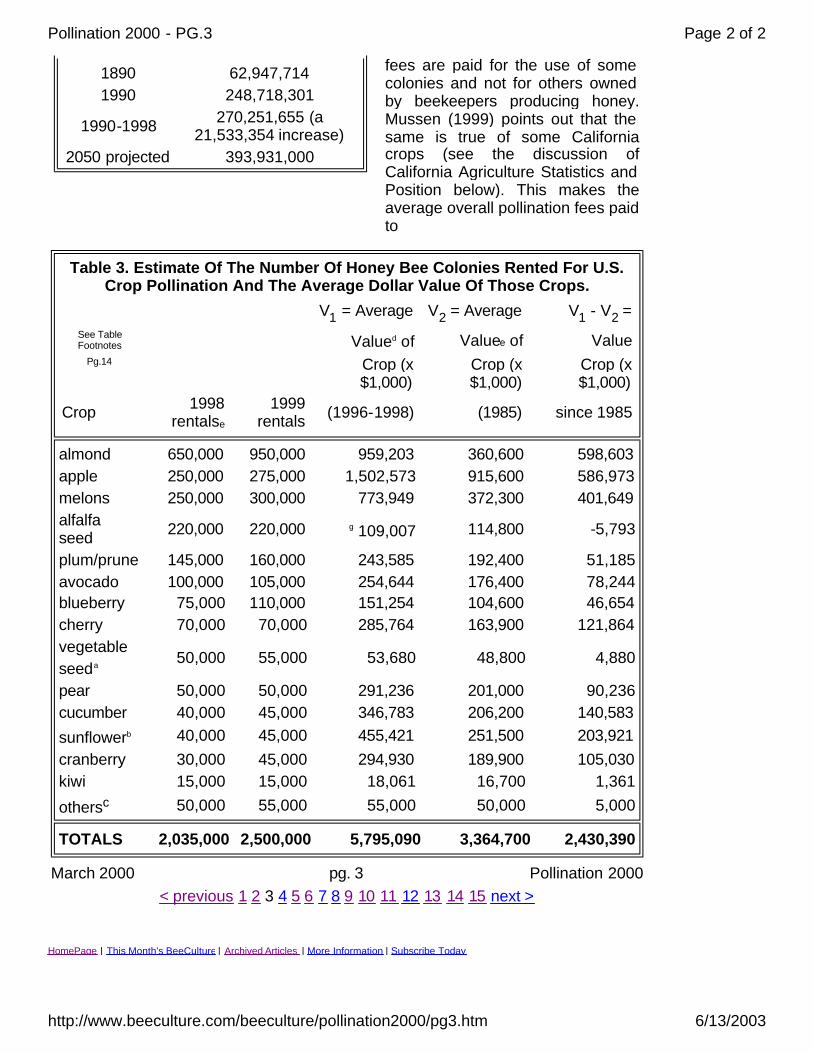
Table 3. Estimate Of The Number Of Honey Bee Colonies Rented For U.S. Crop Pollination And The Average Dollar Value Of Those Crops.
V1 = Average V2 = Average V1 - V2 = See Table Footnotes Valued of Valuee of Value
Pg.14 Crop (x
$1,000) Crop (x $1,000)
Crop (x $1,000)
Crop 1998 rentalse
1999 rentals (1996-1998) (1985) since 1985
almond 650,000 950,000 959,203 360,600 598,603 apple 250,000 275,000 1,502,573 915,600 586,973 melons 250,000 300,000 773,949 372,300 401,649 alfalfa seed 220,000 220,000 g 109,007 114,800 -5,793
plum/prune 145,000 160,000 243,585 192,400 51,185 avocado 100,000 105,000 254,644 176,400 78,244 blueberry 75,000 110,000 151,254 104,600 46,654 cherry 70,000 70,000 285,764 163,900 121,864 vegetable seeda
50,000 55,000 53,680 48,800 4,880
pear 50,000 50,000 291,236 201,000 90,236 cucumber 40,000 45,000 346,783 206,200 140,583
sunflowerb 40,000 45,000 455,421 251,500 203,921 cranberry 30,000 45,000 294,930 189,900 105,030 kiwi 15,000 15,000 18,061 16,700 1,361
othersc 50,000 55,000 55,000 50,000 5,000
TOTALS 2,035,000 2,500,000 5,795,090 3,364,700 2,430,390
March 2000 pg. 3 Pollination 2000< previous 1 2 3 4 5 6 7 8 9 10 11 12 13 14 15 next >
Page 2 of 2Pollination 2000 - PG.3
6/13/2003http://www.beeculture.com/beeculture/pollination2000/pg3.htm
The Value of Honey Bees As Pollinators of U.S. Crops in 2000
< previous 1 2 3 4 5 6 7 8 9 10 11 12 13 14 15 next >
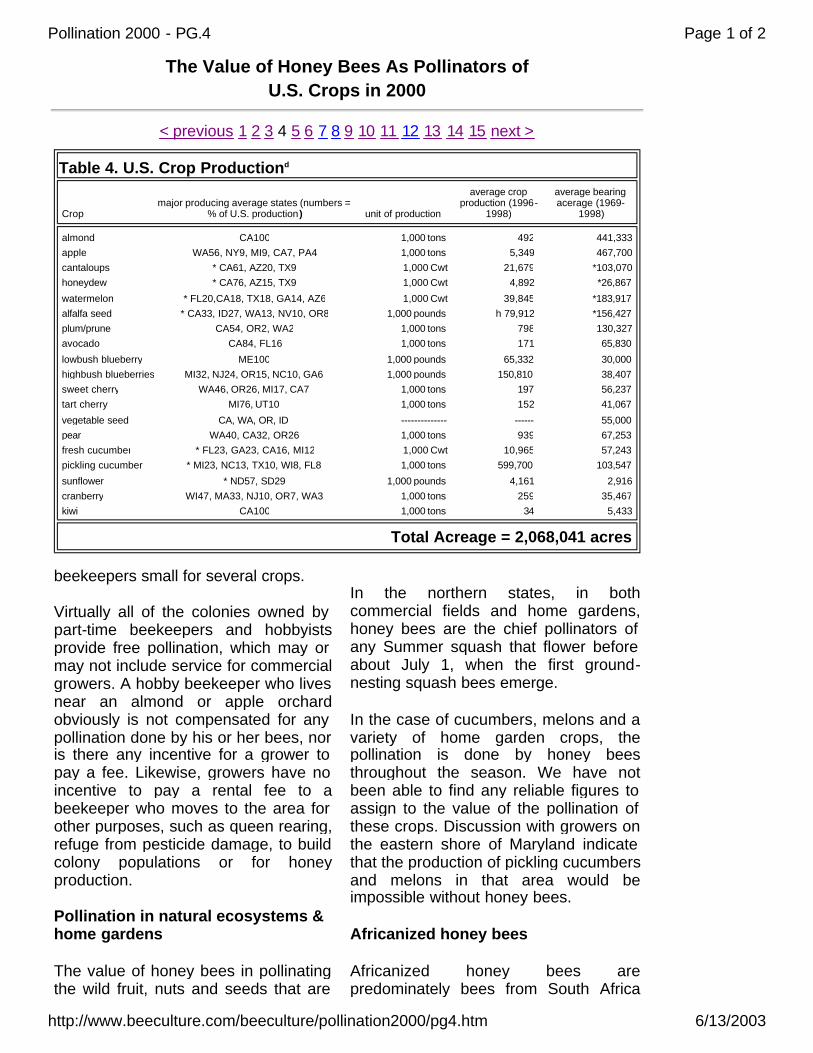
Table 4. U.S. Crop Productiond
Crop major producing average states (numbers =
% of U.S. production) unit of production average crop
production (1996-1998)
average bearing acerage (1969-
1998) almond CA100 1,000 tons 492 441,333 apple WA56, NY9, MI9, CA7, PA4 1,000 tons 5,349 467,700 cantaloups * CA61, AZ20, TX9 1,000 Cwt 21,679 *103,070 honeydew * CA76, AZ15, TX9 1,000 Cwt 4,892 *26,867
watermelon * FL20,CA18, TX18, GA14, AZ6 1,000 Cwt 39,845 *183,917 alfalfa seed * CA33, ID27, WA13, NV10, OR8 1,000 pounds h 79,912 *156,427 plum/prune CA54, OR2, WA2 1,000 tons 798 130,327 avocado CA84, FL16 1,000 tons 171 65,830
lowbush blueberry ME100 1,000 pounds 65,332 30,000 highbush blueberries MI32, NJ24, OR15, NC10, GA6 1,000 pounds 150,810 38,407 sweet cherry WA46, OR26, MI17, CA7 1,000 tons 197 56,237 tart cherry MI76, UT10 1,000 tons 152 41,067
vegetable seed CA, WA, OR, ID -------------- ------ 55,000 pear WA40, CA32, OR26 1,000 tons 939 67,253 fresh cucumber * FL23, GA23, CA16, MI12 1,000 Cwt 10,965 57,243 pickling cucumber * MI23, NC13, TX10, WI8, FL8 1,000 tons 599,700 103,547 sunflower * ND57, SD29 1,000 pounds 4,161 2,916 cranberry WI47, MA33, NJ10, OR7, WA3 1,000 tons 259 35,467 kiwi CA100 1,000 tons 34 5,433
Total Acreage = 2,068,041 acres
beekeepers small for several crops.
Virtually all of the colonies owned by part-time beekeepers and hobbyists provide free pollination, which may or may not include service for commercial growers. A hobby beekeeper who lives near an almond or apple orchard obviously is not compensated for any pollination done by his or her bees, nor is there any incentive for a grower to pay a fee. Likewise, growers have no incentive to pay a rental fee to a beekeeper who moves to the area for other purposes, such as queen rearing, refuge from pesticide damage, to build colony populations or for honey production.
Pollination in natural ecosystems & home gardens
The value of honey bees in pollinating the wild fruit, nuts and seeds that are
In the northern states, in both commercial fields and home gardens, honey bees are the chief pollinators of any Summer squash that flower before about July 1, when the first ground-nesting squash bees emerge.
In the case of cucumbers, melons and a variety of home garden crops, the pollination is done by honey bees throughout the season. We have not been able to find any reliable figures to assign to the value of the pollination of these crops. Discussion with growers on the eastern shore of Maryland indicate that the production of pickling cucumbers and melons in that area would be impossible without honey bees.
Africanized honey bees
Africanized honey bees are predominately bees from South Africa
Page 1 of 2Pollination 2000 - PG.4
6/13/2003http://www.beeculture.com/beeculture/pollination2000/pg4.htm

HomePage | This Month's BeeCulture | Archived Articles | More Information | Subscribe Today
harvested by wildlife and necessary for their survival is unknown but is obviously substantial. At the same time, honey bees pollinate a number of native and exotic crops that are important in erosion control. The contribution of honey bees to home gardens, ornamentals and ecosystems are discussed by Barclay and Moffett (1984) and Moffett and Barclay (1984).
In the southwest, U. S. beekeepers
must now contend with African honey bees. The best way to do this is to make sure European queens head
their colonies. This queen is marked so the beekeeper knows when she took
over the colony, and that she is, indeed, the queen installed. Flottum
photo
and Tanzania that were brought to Brazil in 1956 for the express purpose of developing a beekeeping industry in the tropical parts of that country. The bees that were used in central and southern Brazil until the introduction of the African bees evolved in the temperate climate of Europe. European bees could not survive in the northern, tropical parts of Brazil. The introduced African bees mated freely with the European bees, but the Africans dominated, and the bees we call Africanized are genetically 90 to 95 percent African.
The goal of honey bee importation from Africa was achieved, and there is now an extensive beekeeping industry in the tropical parts of Brazil, especially in the Amazon basin. However, unintentionally, the bees continued to migrate northward, and in 1990 were found in southern Texas. By 1999, they were widespread over central and western Texas, southern New Mexico, Arizona, southern Nevada and southern California.
The California Department of Food and Agriculture reports that in the Spring of 1999, all of Imperial, Los Angeles, Orange, Riverside, San Bernardino, San Diego and parts of Kern and Ventura counties were populated with Africanized honey bees. There is little doubt that these bees will spread farther northward in California, but their failure to spread east out of Texas is a mystery. The eventual northern spread of these bees will be limited by climate, just as it has been in Argentina due to similar factors.
March 2000 pg. 4 Pollination 2000< previous 1 2 3 4 5 6 7 8 9 10 11 12 13 14 15 next >
Page 2 of 2Pollination 2000 - PG.4
6/13/2003http://www.beeculture.com/beeculture/pollination2000/pg4.htm
The Value of Honey Bees As Pollinators of U.S. Crops in 2000
< previous 1 2 3 4 5 6 7 8 9 10 11 12 13 14 15 next >
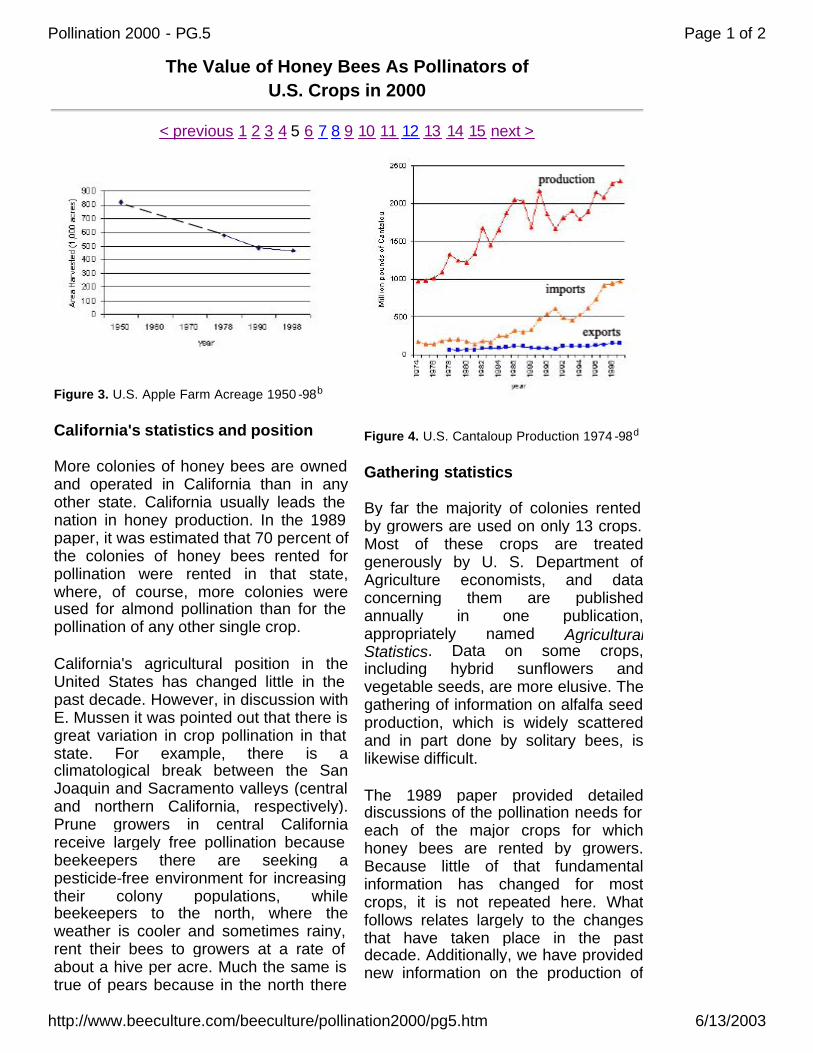
Figure 3. U.S. Apple Farm Acreage 1950 -98b
California's statistics and position
More colonies of honey bees are owned and operated in California than in any other state. California usually leads the nation in honey production. In the 1989 paper, it was estimated that 70 percent of the colonies of honey bees rented for pollination were rented in that state, where, of course, more colonies were used for almond pollination than for the pollination of any other single crop.
California's agricultural position in the United States has changed little in the past decade. However, in discussion with E. Mussen it was pointed out that there is great variation in crop pollination in that state. For example, there is a climatological break between the San Joaquin and Sacramento valleys (central and northern California, respectively). Prune growers in central California receive largely free pollination because beekeepers there are seeking a pesticide-free environment for increasing their colony populations, while beekeepers to the north, where the weather is cooler and sometimes rainy, rent their bees to growers at a rate of about a hive per acre. Much the same is true of pears because in the north there
Figure 4. U.S. Cantaloup Production 1974 -98d
Gathering statistics
By far the majority of colonies rented by growers are used on only 13 crops. Most of these crops are treated generously by U. S. Department of Agriculture economists, and data concerning them are published annually in one publication, appropriately named Agricultural Statistics. Data on some crops, including hybrid sunflowers and vegetable seeds, are more elusive. The gathering of information on alfalfa seed production, which is widely scattered and in part done by solitary bees, is likewise difficult.
The 1989 paper provided detailed discussions of the pollination needs for each of the major crops for which honey bees are rented by growers. Because little of that fundamental information has changed for most crops, it is not repeated here. What follows relates largely to the changes that have taken place in the past decade. Additionally, we have provided new information on the production of
Page 1 of 2Pollination 2000 - PG.5
6/13/2003http://www.beeculture.com/beeculture/pollination2000/pg5.htm
HomePage | This Month's BeeCulture | Archived Articles | More Information | Subscribe Today
are few years in which it is possible to set a commercial crop parthenocarpically (without pollination). California is also different from other U.S. states in that farms are larger and there are fewer feral colonies because there are fewer buildings and forests with hollow trees where bees might nest. At the same time, Varroa mites pretty much wiped out feral colonies in the mid-1990s. There are also fewer hobby beekeepers in California's agricultural areas
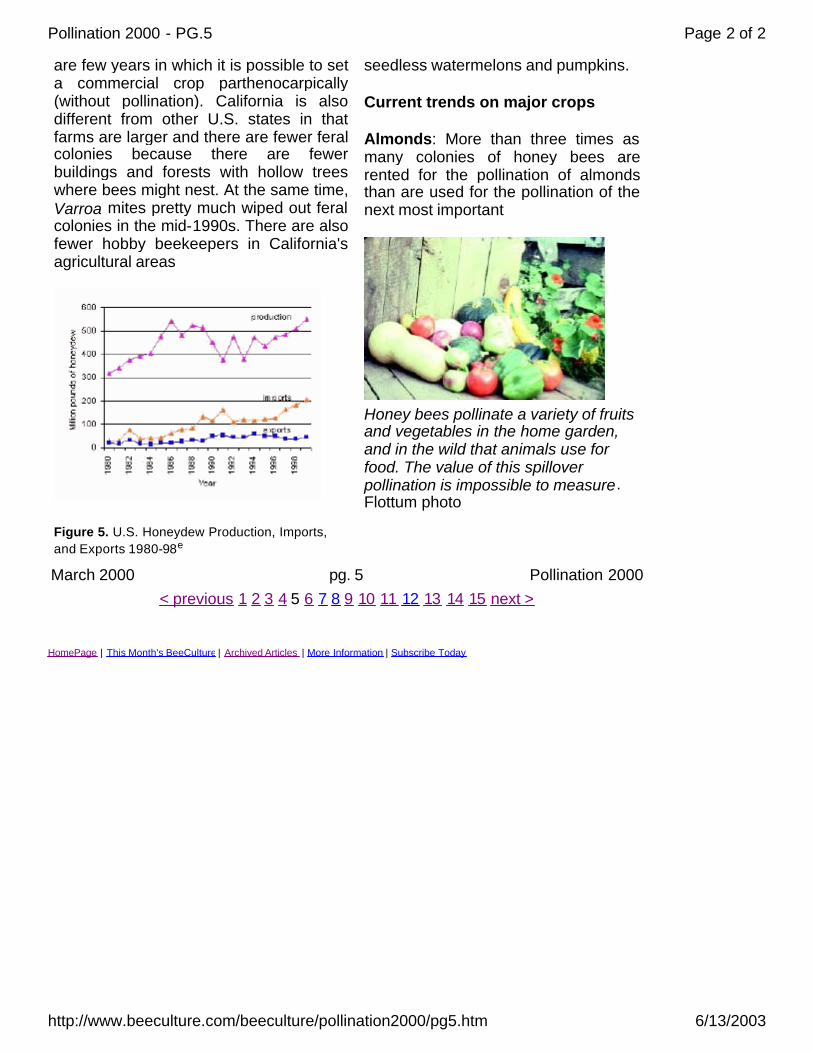
Figure 5. U.S. Honeydew Production, Imports, and Exports 1980-98e
seedless watermelons and pumpkins.
Current trends on major crops
Almonds: More than three times as many colonies of honey bees are rented for the pollination of almonds than are used for the pollination of the next most important
Honey bees pollinate a variety of fruits and vegetables in the home garden, and in the wild that animals use for food. The value of this spillover pollination is impossible to measure. Flottum photo
March 2000 pg. 5 Pollination 2000< previous 1 2 3 4 5 6 7 8 9 10 11 12 13 14 15 next >
Page 2 of 2Pollination 2000 - PG.5
6/13/2003http://www.beeculture.com/beeculture/pollination2000/pg5.htm

The Value of Honey Bees As Pollinators of U.S. Crops in 2000
< previous 1 2 3 4 5 6 7 8 9 10 11 12 13 14 15 next >
Figure 6. U.S. Watermelon Production, Imports, and Exports 1974-98h
crop (apples). Almond acreage and production continue to increase. California is the only state that produces a significant crop and it is responsible for more than half of the world's production of these nuts. E. Mussen (personal communication) estimates that 900,000 colonies were moved into almond orchards in 1999, a figure that is agreed to by most other almond experts with whom we have talked. However, figures such as these can be elusive. Traynor (1999), looking at the increased plantings and grower enthusiasm for honey bees, is more bold and estimated that one million colonies were being rented for almond pollination in 1999.
The density of trees in almond orchards has changed. The older orchards had 50 to 100 trees per acre, but some growers are now experimenting with densities of 150 to 200 trees per acre. With higher densities, orchards may come into profitable production after only three to six growing seasons, which is a much shorter period of time than when fewer trees were planted per acre and management schemes were less intense.
Mussen (1999) reports there are currently
Figure 7. California Alfalfa Seed Acreage 1987-98
almonds with growers using two or more colonies of honey bees per acre for pollination.
Apples: In the first half of this century, there was only one design for a proper apple orchard. Trees were planted 40 feet apart at the rate of 27 per acre. However, MacDaniels and Heinicke (1929) wrote that there were semi-permanent trees planted between the 27 permanent trees with the former being removed when the permanent trees were larger. It was 15 years before an apple orchard was brought into full production. Apple growers are still experimenting with planting designs, but many apple orchards today contain several hundred trees per acre.
An example of the research that is under way to boost production is found in an overview by Barritt (1999), who seeks to increase apple production in the "hot and dry Summer climate of central Washington." What has
Page 1 of 2Pollination 2000 - PG.6
6/13/2003http://www.beeculture.com/beeculture/pollination2000/pg6.htm
HomePage | This Month's BeeCulture | Archived Articles | More Information | Subscribe Today
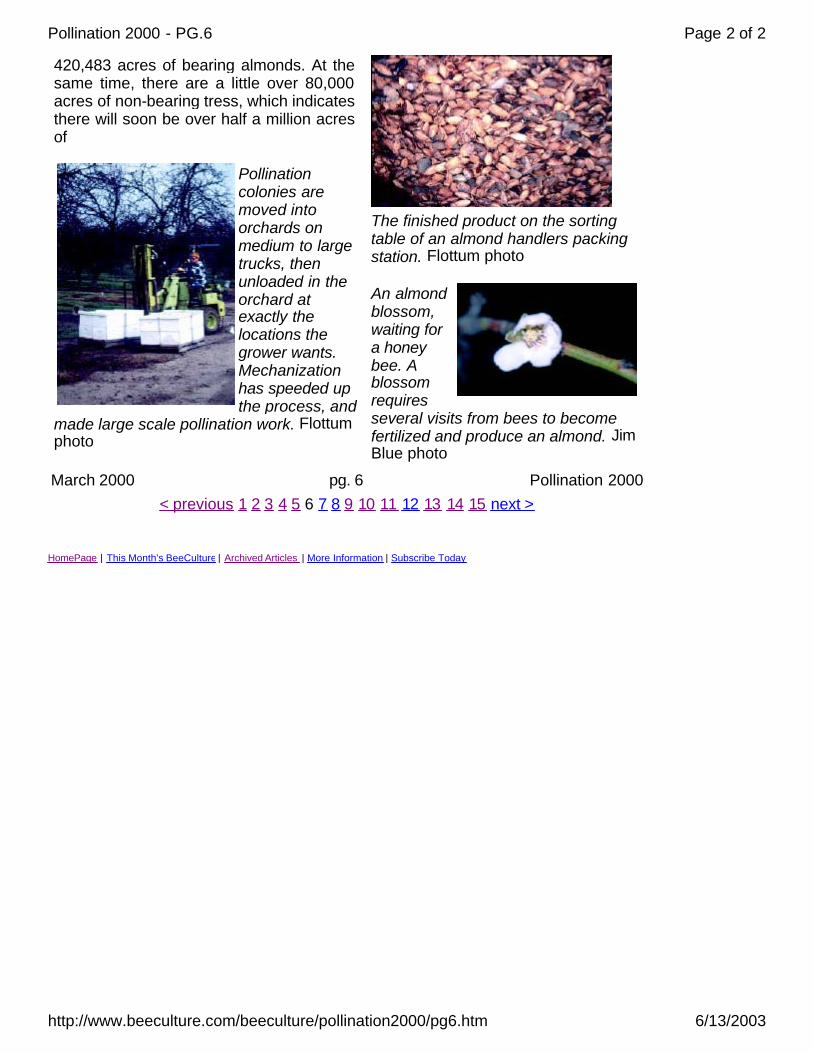
420,483 acres of bearing almonds. At the same time, there are a little over 80,000 acres of non-bearing tress, which indicates there will soon be over half a million acres of
Pollination colonies are moved into orchards on medium to large trucks, then unloaded in the orchard at exactly the locations the grower wants. Mechanization has speeded up the process, and
made large scale pollination work. Flottum photo
The finished product on the sorting table of an almond handlers packing station. Flottum photo
An almond blossom, waiting for a honey bee. A blossom requires several visits from bees to become fertilized and produce an almond. Jim Blue photo
March 2000 pg. 6 Pollination 2000< previous 1 2 3 4 5 6 7 8 9 10 11 12 13 14 15 next >
Page 2 of 2Pollination 2000 - PG.6
6/13/2003http://www.beeculture.com/beeculture/pollination2000/pg6.htm
The Value of Honey Bees As Pollinators of U.S. Crops in 2000
< previous 1 2 3 4 5 6 7 8 9 10 11 12 13 14 15 next >
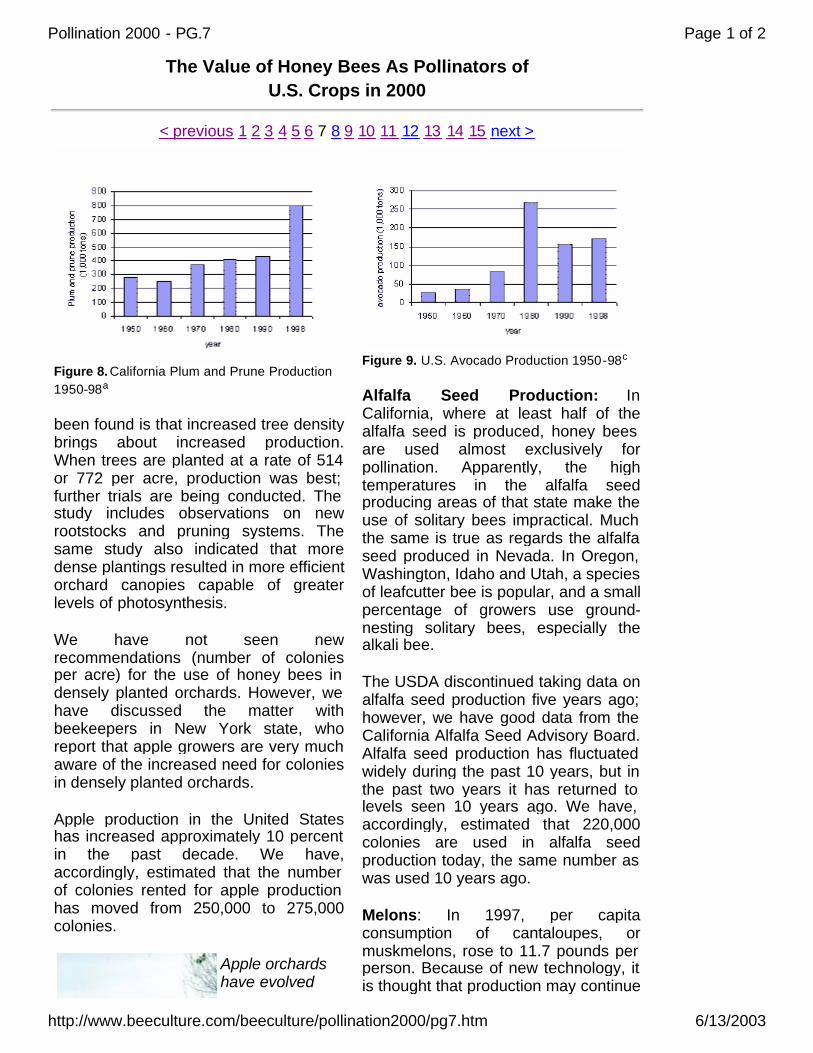
Figure 8. California Plum and Prune Production 1950-98a
been found is that increased tree density brings about increased production. When trees are planted at a rate of 514 or 772 per acre, production was best; further trials are being conducted. The study includes observations on new rootstocks and pruning systems. The same study also indicated that more dense plantings resulted in more efficient orchard canopies capable of greater levels of photosynthesis.
We have not seen new recommendations (number of colonies per acre) for the use of honey bees in densely planted orchards. However, we have discussed the matter with beekeepers in New York state, who report that apple growers are very much aware of the increased need for colonies in densely planted orchards.
Apple production in the United States has increased approximately 10 percent in the past decade. We have, accordingly, estimated that the number of colonies rented for apple production has moved from 250,000 to 275,000 colonies.
Apple orchards have evolved
Figure 9. U.S. Avocado Production 1950-98c
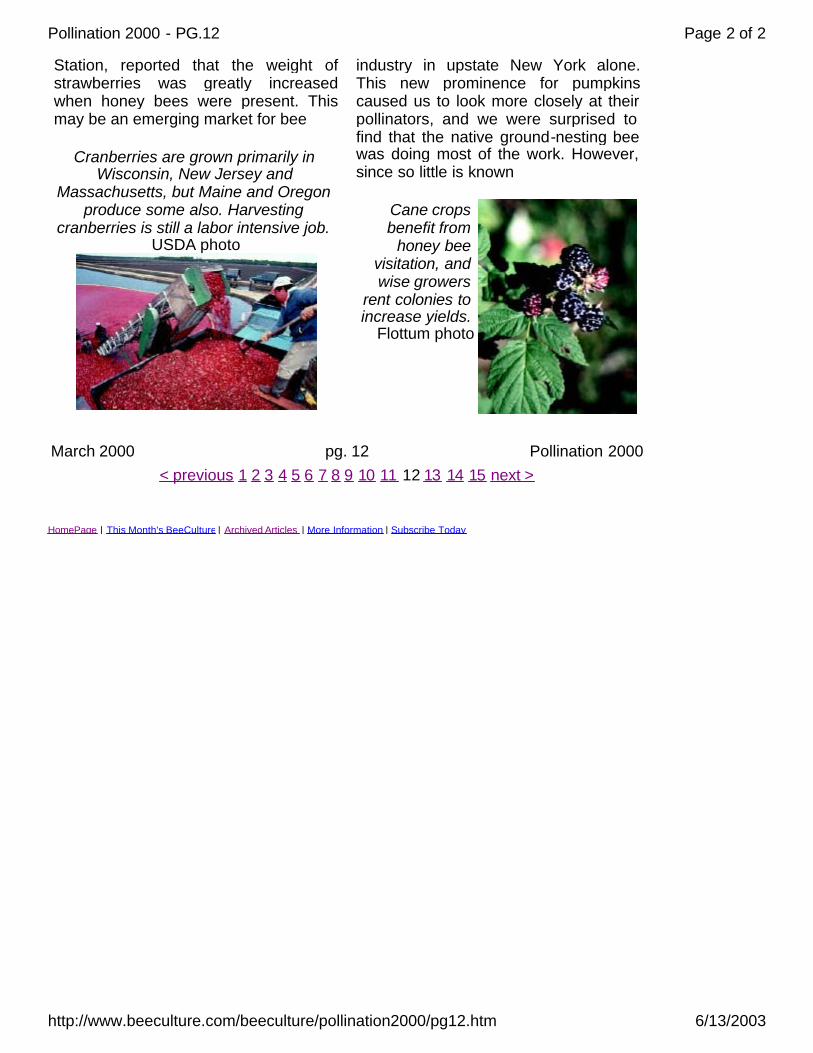
Alfalfa Seed Production: In California, where at least half of the alfalfa seed is produced, honey bees are used almost exclusively for pollination. Apparently, the high temperatures in the alfalfa seed producing areas of that state make the use of solitary bees impractical. Much the same is true as regards the alfalfa seed produced in Nevada. In Oregon, Washington, Idaho and Utah, a species of leafcutter bee is popular, and a small percentage of growers use ground-nesting solitary bees, especially the alkali bee.
The USDA discontinued taking data on alfalfa seed production five years ago; however, we have good data from the California Alfalfa Seed Advisory Board. Alfalfa seed production has fluctuated widely during the past 10 years, but in the past two years it has returned to levels seen 10 years ago. We have, accordingly, estimated that 220,000 colonies are used in alfalfa seed production today, the same number as was used 10 years ago.
Melons: In 1997, per capita consumption of cantaloupes, or muskmelons, rose to 11.7 pounds per person. Because of new technology, it is thought that production may continue
Page 1 of 2Pollination 2000 - PG.7
6/13/2003http://www.beeculture.com/beeculture/pollination2000/pg7.htm

HomePage | This Month's BeeCulture | Archived Articles | More Information | Subscribe Today
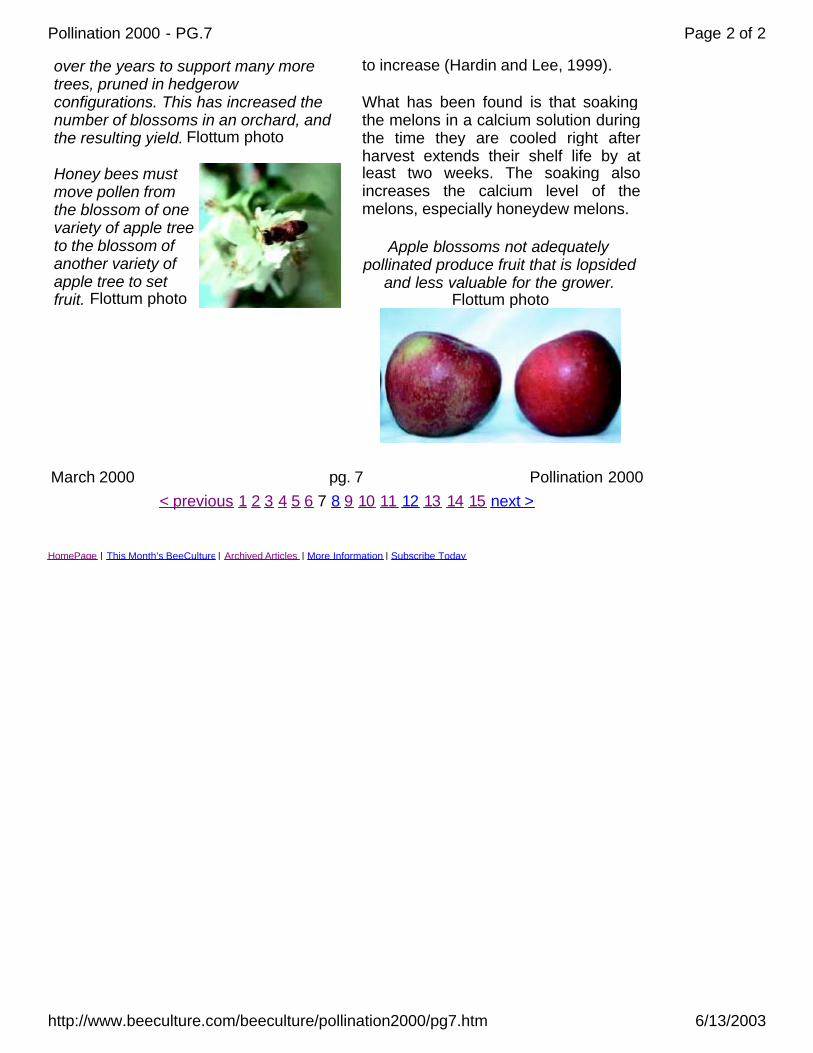
over the years to support many more trees, pruned in hedgerow configurations. This has increased the number of blossoms in an orchard, and the resulting yield. Flottum photo
Honey bees must move pollen from the blossom of one variety of apple tree to the blossom of another variety of apple tree to set fruit. Flottum photo
to increase (Hardin and Lee, 1999).
What has been found is that soaking the melons in a calcium solution during the time they are cooled right after harvest extends their shelf life by at least two weeks. The soaking also increases the calcium level of the melons, especially honeydew melons.
Apple blossoms not adequately pollinated produce fruit that is lopsided
and less valuable for the grower. Flottum photo
March 2000 pg. 7 Pollination 2000< previous 1 2 3 4 5 6 7 8 9 10 11 12 13 14 15 next >
Page 2 of 2Pollination 2000 - PG.7
6/13/2003http://www.beeculture.com/beeculture/pollination2000/pg7.htm
HomePage | This Month's BeeCulture | Archived Articles | More Information | Subscribe Today
over the years to support many more trees, pruned in hedgerow configurations. This has increased the number of blossoms in an orchard, and the resulting yield. Flottum photo
Honey bees must move pollen from the blossom of one variety of apple tree to the blossom of another variety of apple tree to set fruit. Flottum photo
to increase (Hardin and Lee, 1999).
What has been found is that soaking the melons in a calcium solution during the time they are cooled right after harvest extends their shelf life by at least two weeks. The soaking also increases the calcium level of the melons, especially honeydew melons.
Apple blossoms not adequately pollinated produce fruit that is lopsided
and less valuable for the grower. Flottum photo
March 2000 pg. 7 Pollination 2000< previous 1 2 3 4 5 6 7 8 9 10 11 12 13 14 15 next >
Page 2 of 2Pollination 2000 - PG.7
6/13/2003http://www.beeculture.com/beeculture/pollination2000/pg7.htm
The Value of Honey Bees As Pollinators of U.S. Crops in 2000
< previous 1 2 3 4 5 6 7 8 9 10 11 12 13 14 15 next >
Certain calcium solutions reduce tissue aging. Additionally, new varieties are sweeter, making them more desirable in the marketplace.
All melon production has increased in the past decade, but the industry is scattered over a wide area. We estimate that the use of honey bees for all melon production has increased about 20 percent and have concluded from these data that the number of colonies being rented for melon pollination today is approximately 300,000.
Seedless watermelons: These melons, first produced in Japan in 1939, have gained market prominence only in recent years. Despite the fact that they produce no seeds, they must be cross-pollinated to produce fruit. Colonies of honey bees are used at the rate of one to two per acre. Sometimes more.
Seedless watermelons are hybrids arising from selected tetraploid female plants and diploid male plants. It is noted by Beste et al. (1999) that fruit enlargement in most fruit is stimulated by growth-promoting hormones produced by the developing seeds. These are lacking in seedless watermelons. Instead, the hormones are provided from the pollen placed on the stigmas of the seedless varieties. The fruit will be misshapen unless interplanted with suitable pollenizers, and an adequate number of bees must be provided to spread the pollen from the pollenizer to the seedless fruit. It is important to select pollenizers that are easily distinguished from the seedless varieties to facilitate picking.
Plums and prunes: The production of plums and prunes has fluctuated widely in recent years. We estimate that the number of colonies used for plum and prune pollination has increased about 10 percent to 160,000.
Avocados: The production of avocados has increased slightly in the past 10 years, but we are told that today's growers are more aware of the need for cross-pollination. They are also alert to the fact that male and female flowers on the same plant mature at different times.
More important is the fact that under NAFTA, the first shipment of avocados from Mexico to the United States was made in November 1997
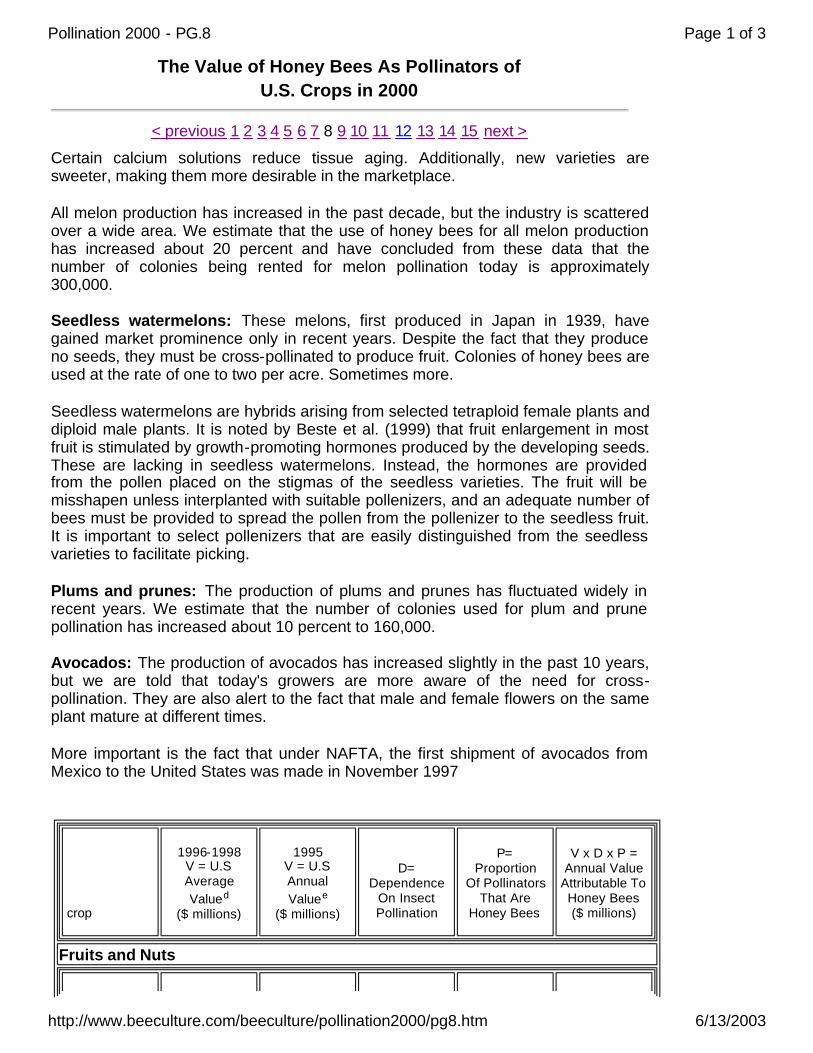
crop
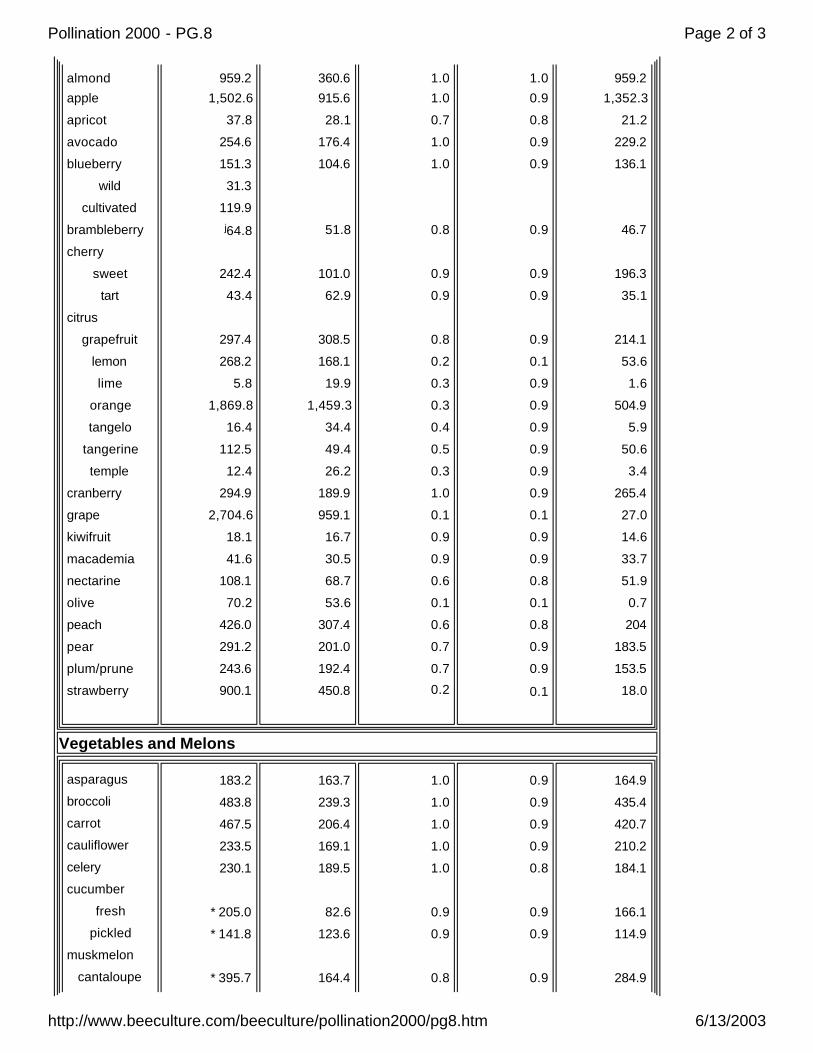
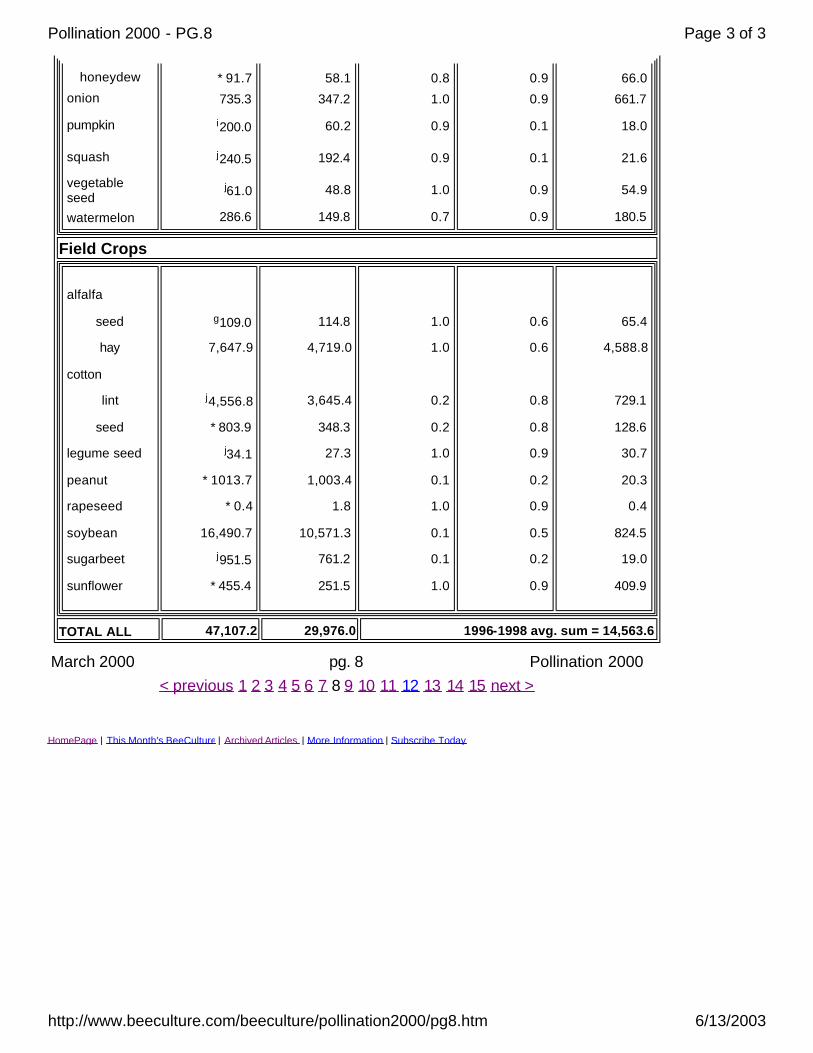
1996-1998 V = U.S Average Valued
($ millions)
1995 V = U.S Annual Valuee
($ millions)
D= Dependence
On Insect Pollination
P= Proportion
Of Pollinators That Are
Honey Bees
V x D x P = Annual Value
Attributable To Honey Bees ($ millions)
Fruits and Nuts
Page 1 of 3Pollination 2000 - PG.8
6/13/2003http://www.beeculture.com/beeculture/pollination2000/pg8.htm
almond
apple
apricot
avocado
blueberry
wild cultivated
brambleberry
cherry
sweet tart
citrus grapefruit
lemon lime
orange tangelo
tangerine temple
cranberry grape kiwifruit macademia nectarine olive peach pear plum/prune strawberry
959.2 1,502.6
37.8 254.6 151.3 31.3
119.9 j64.8
242.4 43.4
297.4 268.2
5.8 1,869.8
16.4 112.5 12.4
294.9 2,704.6
18.1 41.6
108.1 70.2
426.0 291.2 243.6 900.1
360.6 915.6 28.1
176.4 104.6
51.8
101.0 62.9
308.5 168.1 19.9
1,459.3 34.4 49.4 26.2
189.9 959.1 16.7 30.5 68.7 53.6
307.4 201.0 192.4 450.8
1.0 1.0 0.7 1.0 1.0
0.8
0.9 0.9
0.8 0.2 0.3 0.3 0.4 0.5 0.3 1.0 0.1 0.9 0.9 0.6 0.1 0.6 0.7 0.7 0.2
1.0 0.9 0.8 0.9 0.9
0.9
0.9 0.9
0.9 0.1 0.9 0.9 0.9 0.9 0.9 0.9 0.1 0.9 0.9 0.8 0.1 0.8 0.9 0.9 0.1
959.2 1,352.3
21.2 229.2 136.1
46.7
196.3 35.1
214.1 53.6 1.6
504.9 5.9
50.6 3.4
265.4 27.0 14.6 33.7 51.9 0.7 204
183.5 153.5 18.0
Vegetables and Melons
asparagus broccoli carrot cauliflower celery cucumber
fresh pickled
muskmelon cantaloupe
183.2 483.8 467.5 233.5 230.1
* 205.0 * 141.8
* 395.7
163.7 239.3 206.4 169.1 189.5
82.6 123.6
164.4
1.0 1.0 1.0 1.0 1.0
0.9 0.9
0.8
0.9 0.9 0.9 0.9 0.8
0.9 0.9
0.9
164.9 435.4 420.7 210.2 184.1
166.1 114.9
284.9
Page 2 of 3Pollination 2000 - PG.8
6/13/2003http://www.beeculture.com/beeculture/pollination2000/pg8.htm
HomePage | This Month's BeeCulture | Archived Articles | More Information | Subscribe Today
honeydew onion
pumpkin
squash
vegetable seed
watermelon
* 91.7 735.3
i200.0
j240.5
j61.0
286.6
58.1 347.2
60.2
192.4
48.8
149.8
0.8 1.0
0.9
0.9
1.0
0.7
0.9 0.9
0.1
0.1
0.9
0.9
66.0 661.7
18.0
21.6
54.9
180.5
Field Crops
alfalfa
seed
hay
cotton
lint
seed
legume seed
peanut
rapeseed
soybean
sugarbeet
sunflower
g109.0
7,647.9
j4,556.8
* 803.9 j34.1
* 1013.7
* 0.4
16,490.7 j951.5
* 455.4
114.8
4,719.0
3,645.4
348.3
27.3
1,003.4
1.8
10,571.3
761.2
251.5
1.0
1.0
0.2
0.2
1.0
0.1
1.0
0.1
0.1
1.0
0.6
0.6
0.8
0.8
0.9
0.2
0.9
0.5
0.2
0.9
65.4
4,588.8
729.1
128.6
30.7
20.3
0.4
824.5
19.0
409.9
TOTAL ALL 47,107.2 29,976.0 1996-1998 avg. sum = 14,563.6
March 2000 pg. 8 Pollination 2000< previous 1 2 3 4 5 6 7 8 9 10 11 12 13 14 15 next >
Page 3 of 3Pollination 2000 - PG.8
6/13/2003http://www.beeculture.com/beeculture/pollination2000/pg8.htm
The Value of Honey Bees As Pollinators of U.S. Crops in 2000
< previous 1 2 3 4 5 6 7 8 9 10 11 12 13 14 15 next >
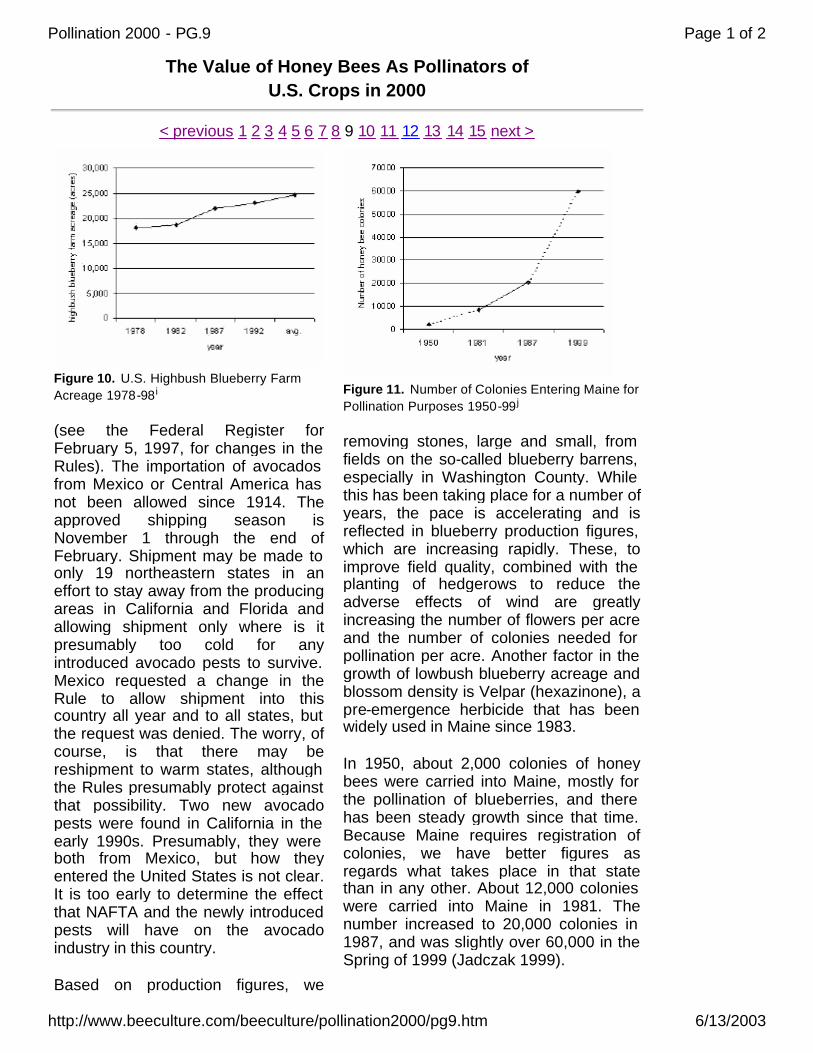
Figure 10. U.S. Highbush Blueberry Farm Acreage 1978-98 i
(see the Federal Register for February 5, 1997, for changes in the Rules). The importation of avocados from Mexico or Central America has not been allowed since 1914. The approved shipping season is November 1 through the end of February. Shipment may be made to only 19 northeastern states in an effort to stay away from the producing areas in California and Florida and allowing shipment only where is it presumably too cold for any introduced avocado pests to survive. Mexico requested a change in the Rule to allow shipment into this country all year and to all states, but the request was denied. The worry, of course, is that there may be reshipment to warm states, although the Rules presumably protect against that possibility. Two new avocado pests were found in California in the early 1990s. Presumably, they were both from Mexico, but how they entered the United States is not clear. It is too early to determine the effect that NAFTA and the newly introduced pests will have on the avocado industry in this country.
Based on production figures, we
Figure 11. Number of Colonies Entering Maine for Pollination Purposes 1950-99 j
removing stones, large and small, from fields on the so-called blueberry barrens, especially in Washington County. While this has been taking place for a number of years, the pace is accelerating and is reflected in blueberry production figures, which are increasing rapidly. These, to improve field quality, combined with the planting of hedgerows to reduce the adverse effects of wind are greatly increasing the number of flowers per acre and the number of colonies needed for pollination per acre. Another factor in the growth of lowbush blueberry acreage and blossom density is Velpar (hexazinone), a pre-emergence herbicide that has been widely used in Maine since 1983.
In 1950, about 2,000 colonies of honey bees were carried into Maine, mostly for the pollination of blueberries, and there has been steady growth since that time. Because Maine requires registration of colonies, we have better figures as regards what takes place in that state than in any other. About 12,000 colonies were carried into Maine in 1981. The number increased to 20,000 colonies in 1987, and was slightly over 60,000 in the Spring of 1999 (Jadczak 1999).
Page 1 of 2Pollination 2000 - PG.9
6/13/2003http://www.beeculture.com/beeculture/pollination2000/pg9.htm
HomePage | This Month's BeeCulture | Archived Articles | More Information | Subscribe Today
estimate that the number of colonies of honey bees rented for avocado production is 105,000 colonies versus 100,000 10 years ago.
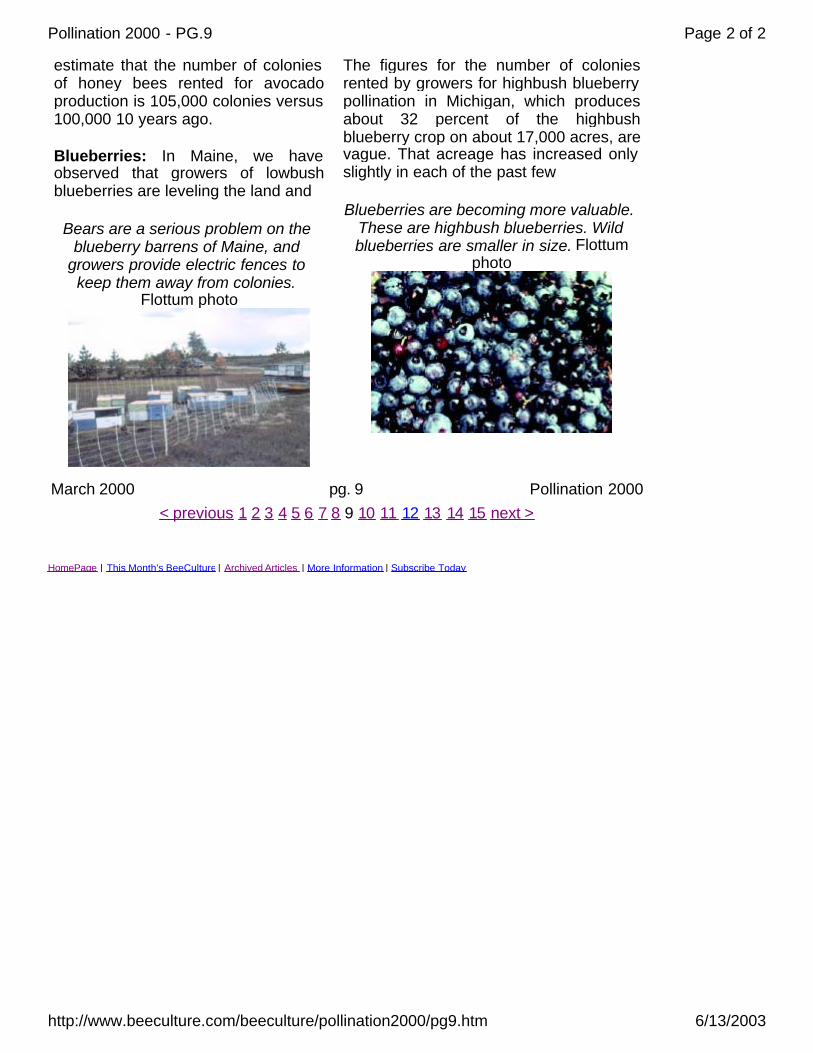
Blueberries: In Maine, we have observed that growers of lowbush blueberries are leveling the land and
Bears are a serious problem on the blueberry barrens of Maine, and
growers provide electric fences to keep them away from colonies.
Flottum photo
The figures for the number of colonies rented by growers for highbush blueberry pollination in Michigan, which produces about 32 percent of the highbush blueberry crop on about 17,000 acres, are vague. That acreage has increased only slightly in each of the past few
Blueberries are becoming more valuable. These are highbush blueberries. Wild blueberries are smaller in size. Flottum
photo
March 2000 pg. 9 Pollination 2000< previous 1 2 3 4 5 6 7 8 9 10 11 12 13 14 15 next >
Page 2 of 2Pollination 2000 - PG.9
6/13/2003http://www.beeculture.com/beeculture/pollination2000/pg9.htm
The Value of Honey Bees As Pollinators of U.S. Crops in 2000
< previous 1 2 3 4 5 6 7 8 9 10 11 12 13 14 15 next >
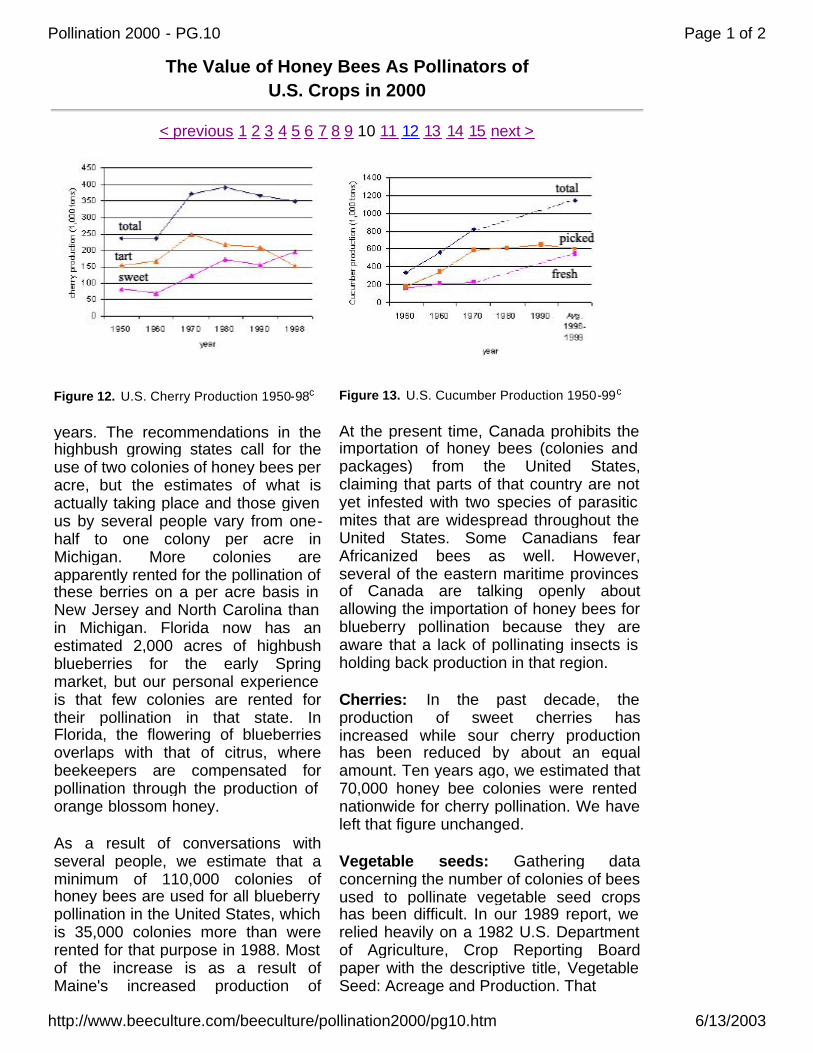
Figure 12. U.S. Cherry Production 1950-98c
years. The recommendations in the highbush growing states call for the use of two colonies of honey bees per acre, but the estimates of what is actually taking place and those given us by several people vary from one-half to one colony per acre in Michigan. More colonies are apparently rented for the pollination of these berries on a per acre basis in New Jersey and North Carolina than in Michigan. Florida now has an estimated 2,000 acres of highbush blueberries for the early Spring market, but our personal experience is that few colonies are rented for their pollination in that state. In Florida, the flowering of blueberries overlaps with that of citrus, where beekeepers are compensated for pollination through the production of orange blossom honey.
As a result of conversations with several people, we estimate that a minimum of 110,000 colonies of honey bees are used for all blueberry pollination in the United States, which is 35,000 colonies more than were rented for that purpose in 1988. Most of the increase is as a result of Maine's increased production of
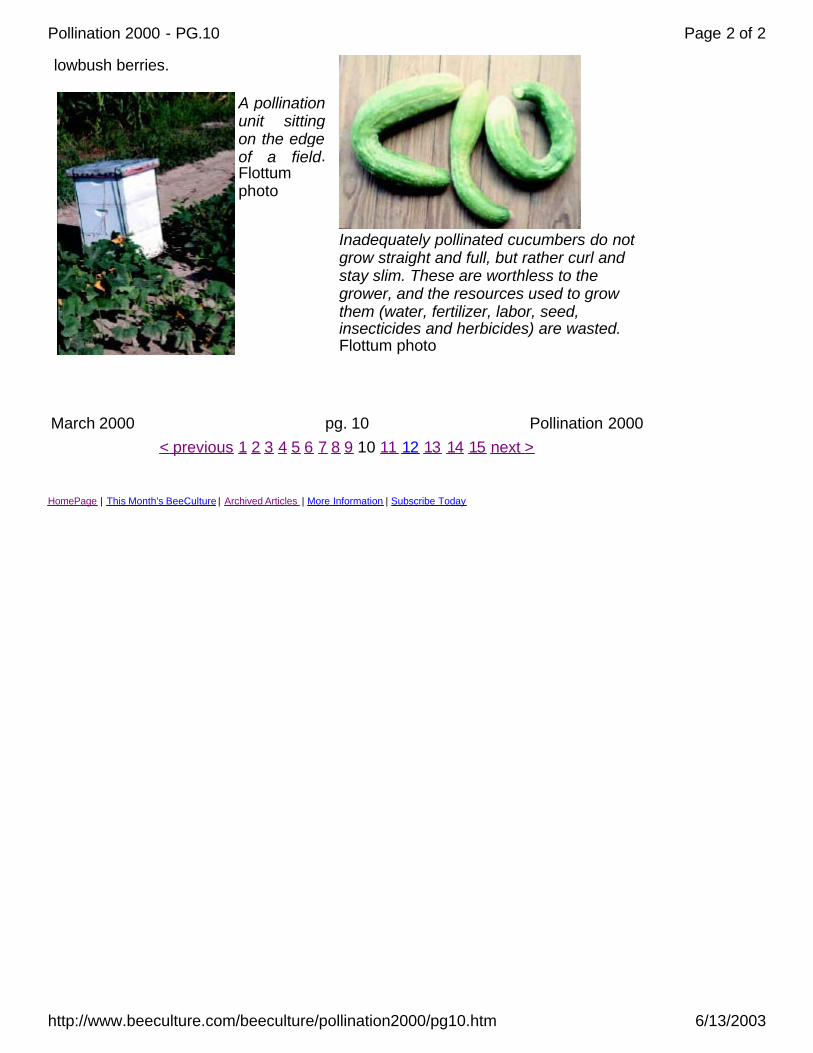
Figure 13. U.S. Cucumber Production 1950-99c
At the present time, Canada prohibits the importation of honey bees (colonies and packages) from the United States, claiming that parts of that country are not yet infested with two species of parasitic mites that are widespread throughout the United States. Some Canadians fear Africanized bees as well. However, several of the eastern maritime provinces of Canada are talking openly about allowing the importation of honey bees for blueberry pollination because they are aware that a lack of pollinating insects is holding back production in that region.
Cherries: In the past decade, the production of sweet cherries has increased while sour cherry production has been reduced by about an equal amount. Ten years ago, we estimated that 70,000 honey bee colonies were rented nationwide for cherry pollination. We have left that figure unchanged.
Vegetable seeds: Gathering data concerning the number of colonies of bees used to pollinate vegetable seed crops has been difficult. In our 1989 report, we relied heavily on a 1982 U.S. Department of Agriculture, Crop Reporting Board paper with the descriptive title, Vegetable Seed: Acreage and Production. That
Page 1 of 2Pollination 2000 - PG.10
6/13/2003http://www.beeculture.com/beeculture/pollination2000/pg10.htm
HomePage | This Month's BeeCulture | Archived Articles | More Information | Subscribe Today
lowbush berries.
A pollination unit sitting on the edge of a field. Flottum photo
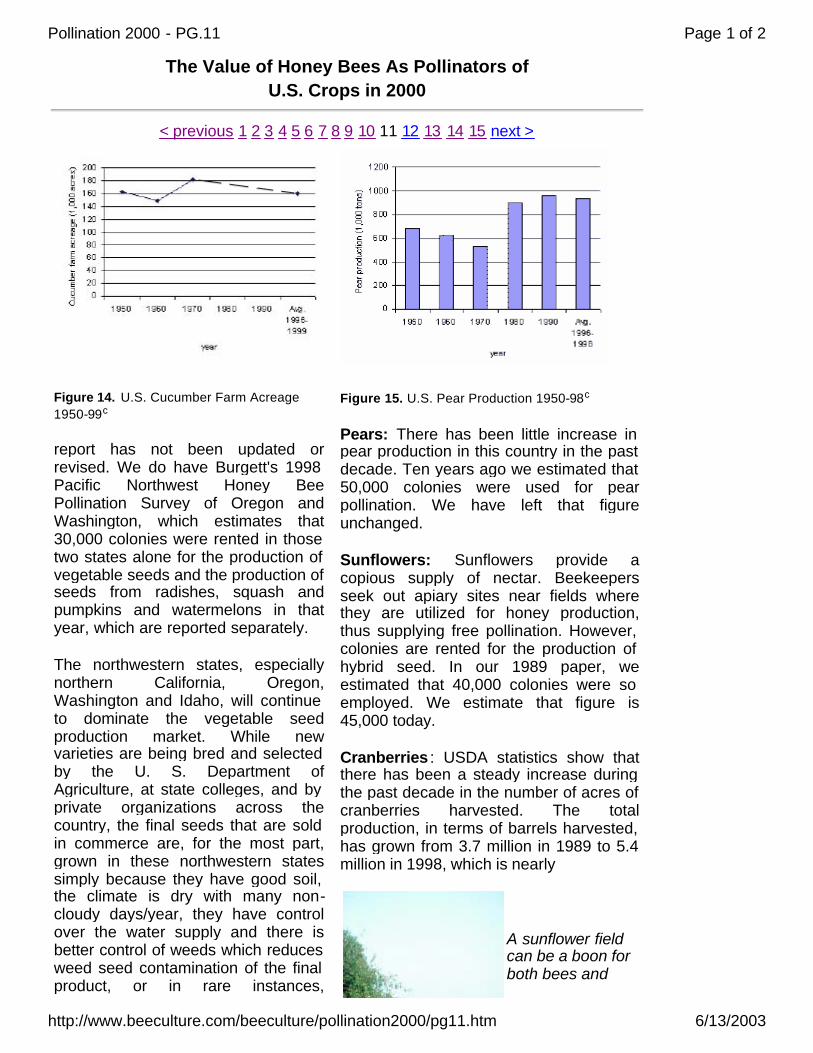
Inadequately pollinated cucumbers do not grow straight and full, but rather curl and stay slim. These are worthless to the grower, and the resources used to grow them (water, fertilizer, labor, seed, insecticides and herbicides) are wasted. Flottum photo
March 2000 pg. 10 Pollination 2000< previous 1 2 3 4 5 6 7 8 9 10 11 12 13 14 15 next >
Page 2 of 2Pollination 2000 - PG.10
6/13/2003http://www.beeculture.com/beeculture/pollination2000/pg10.htm
The Value of Honey Bees As Pollinators of U.S. Crops in 2000
< previous 1 2 3 4 5 6 7 8 9 10 11 12 13 14 15 next >
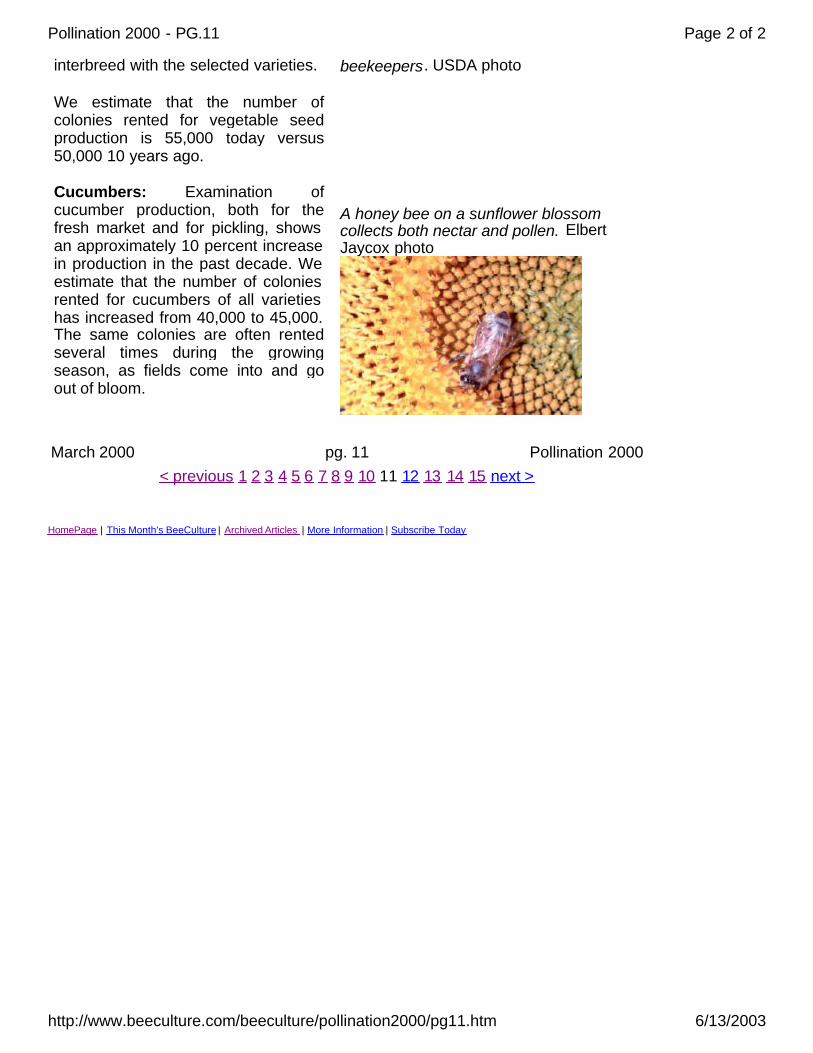
Figure 14. U.S. Cucumber Farm Acreage 1950-99c
report has not been updated or revised. We do have Burgett's 1998 Pacific Northwest Honey Bee Pollination Survey of Oregon and Washington, which estimates that 30,000 colonies were rented in those two states alone for the production of vegetable seeds and the production of seeds from radishes, squash and pumpkins and watermelons in that year, which are reported separately.
The northwestern states, especially northern California, Oregon, Washington and Idaho, will continue to dominate the vegetable seed production market. While new varieties are being bred and selected by the U. S. Department of Agriculture, at state colleges, and by private organizations across the country, the final seeds that are sold in commerce are, for the most part, grown in these northwestern states simply because they have good soil, the climate is dry with many non-cloudy days/year, they have control over the water supply and there is better control of weeds which reduces weed seed contamination of the final product, or in rare instances,
Figure 15. U.S. Pear Production 1950-98c
Pears: There has been little increase in pear production in this country in the past decade. Ten years ago we estimated that 50,000 colonies were used for pear pollination. We have left that figure unchanged.
Sunflowers: Sunflowers provide a copious supply of nectar. Beekeepers seek out apiary sites near fields where they are utilized for honey production, thus supplying free pollination. However, colonies are rented for the production of hybrid seed. In our 1989 paper, we estimated that 40,000 colonies were so employed. We estimate that figure is 45,000 today.
Cranberries : USDA statistics show that there has been a steady increase during the past decade in the number of acres of cranberries harvested. The total production, in terms of barrels harvested, has grown from 3.7 million in 1989 to 5.4 million in 1998, which is nearly
A sunflower field can be a boon for both bees and
Page 1 of 2Pollination 2000 - PG.11
6/13/2003http://www.beeculture.com/beeculture/pollination2000/pg11.htm
HomePage | This Month's BeeCulture | Archived Articles | More Information | Subscribe Today
interbreed with the selected varieties.
We estimate that the number of colonies rented for vegetable seed production is 55,000 today versus 50,000 10 years ago.
Cucumbers: Examination of cucumber production, both for the fresh market and for pickling, shows an approximately 10 percent increase in production in the past decade. We estimate that the number of colonies rented for cucumbers of all varieties has increased from 40,000 to 45,000. The same colonies are often rented several times during the growing season, as fields come into and go out of bloom.
beekeepers. USDA photo
A honey bee on a sunflower blossom collects both nectar and pollen. Elbert Jaycox photo
March 2000 pg. 11 Pollination 2000< previous 1 2 3 4 5 6 7 8 9 10 11 12 13 14 15 next >
Page 2 of 2Pollination 2000 - PG.11
6/13/2003http://www.beeculture.com/beeculture/pollination2000/pg11.htm
The Value of Honey Bees As Pollinators of U.S. Crops in 2000
< previous 1 2 3 4 5 6 7 8 9 10 11 12 13 14 15 next >
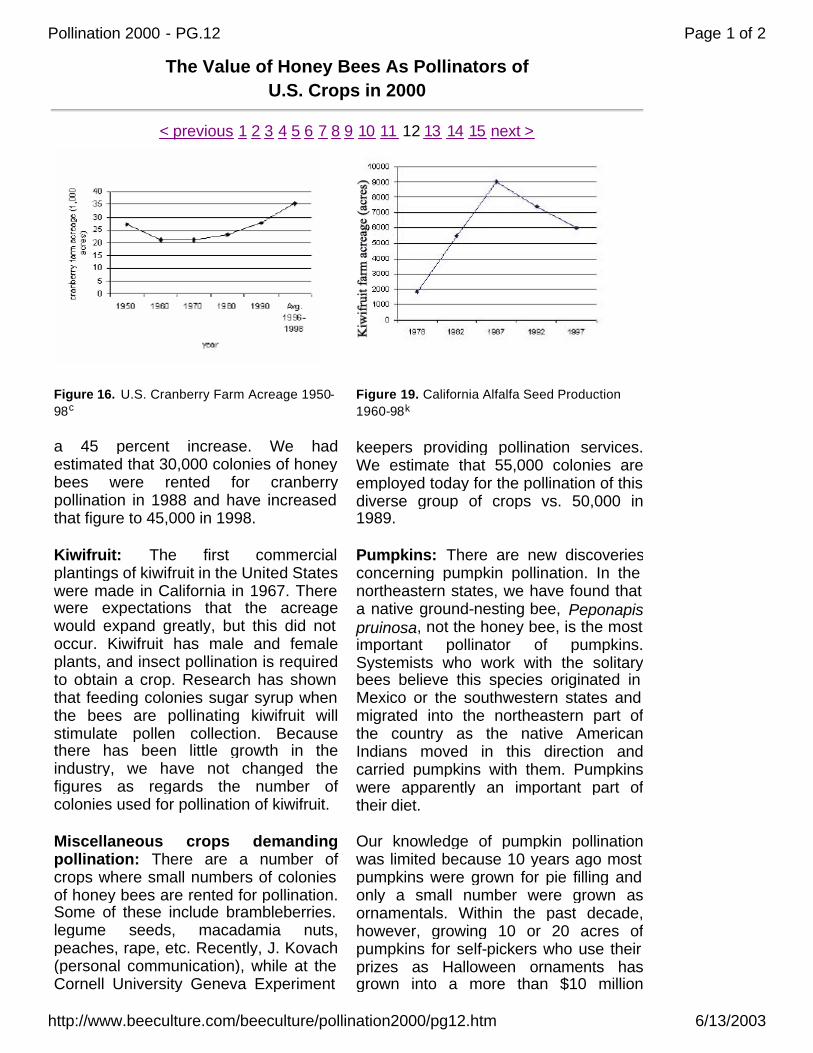
Figure 16. U.S. Cranberry Farm Acreage 1950-98c
a 45 percent increase. We had estimated that 30,000 colonies of honey bees were rented for cranberry pollination in 1988 and have increased that figure to 45,000 in 1998.
Kiwifruit: The first commercial plantings of kiwifruit in the United States were made in California in 1967. There were expectations that the acreage would expand greatly, but this did not occur. Kiwifruit has male and female plants, and insect pollination is required to obtain a crop. Research has shown that feeding colonies sugar syrup when the bees are pollinating kiwifruit will stimulate pollen collection. Because there has been little growth in the industry, we have not changed the figures as regards the number of colonies used for pollination of kiwifruit.
Miscellaneous crops demanding pollination: There are a number of crops where small numbers of colonies of honey bees are rented for pollination. Some of these include brambleberries. legume seeds, macadamia nuts, peaches, rape, etc. Recently, J. Kovach (personal communication), while at the Cornell University Geneva Experiment
Figure 19. California Alfalfa Seed Production 1960-98k
keepers providing pollination services. We estimate that 55,000 colonies are employed today for the pollination of this diverse group of crops vs. 50,000 in 1989.
Pumpkins: There are new discoveries concerning pumpkin pollination. In the northeastern states, we have found that a native ground-nesting bee, Peponapis pruinosa, not the honey bee, is the most important pollinator of pumpkins. Systemists who work with the solitary bees believe this species originated in Mexico or the southwestern states and migrated into the northeastern part of the country as the native American Indians moved in this direction and carried pumpkins with them. Pumpkins were apparently an important part of their diet.
Our knowledge of pumpkin pollination was limited because 10 years ago most pumpkins were grown for pie filling and only a small number were grown as ornamentals. Within the past decade, however, growing 10 or 20 acres of pumpkins for self-pickers who use their prizes as Halloween ornaments has grown into a more than $10 million
Page 1 of 2Pollination 2000 - PG.12
6/13/2003http://www.beeculture.com/beeculture/pollination2000/pg12.htm
HomePage | This Month's BeeCulture | Archived Articles | More Information | Subscribe Today
Station, reported that the weight of strawberries was greatly increased when honey bees were present. This may be an emerging market for bee
Cranberries are grown primarily in Wisconsin, New Jersey and
Massachusetts, but Maine and Oregon produce some also. Harvesting
cranberries is still a labor intensive job. USDA photo
industry in upstate New York alone. This new prominence for pumpkins caused us to look more closely at their pollinators, and we were surprised to find that the native ground-nesting bee was doing most of the work. However, since so little is known
Cane crops benefit from
honey bee visitation, and wise growers
rent colonies to increase yields.
Flottum photo
March 2000 pg. 12 Pollination 2000< previous 1 2 3 4 5 6 7 8 9 10 11 12 13 14 15 next >
Page 2 of 2Pollination 2000 - PG.12
6/13/2003http://www.beeculture.com/beeculture/pollination2000/pg12.htm

The Value of Honey Bees As Pollinators of U.S. Crops in 2000
< previous 1 2 3 4 5 6 7 8 9 10 11 12 13 14 15 next >
Figure 18. California Alfalfa Seed Farm Acreage 1960-98k
about the biology and abundance of this bee, we advise that colonies of honey bees be rented when more than about 10 acres of pumpkins are planted in a single field.
Calculation of the value of honey bees to crop pollination
In the 1989 paper, we pointed out that there has been an increasing demand for colonies of honey bees for pollination throughout the 20th century. However, most estimates have over-calculated the dollar value of honey bees to the agricultural community. In 1989, and in this paper, we have been concerned only with the increased production directly attributable to the use of honey bees. In other words, we have not assumed that honey bees are the only pollinators; instead, we have used only that portion of the increased production attributable to them. To that end, we used the following formula in 1989 and in this paper to determine the value of honey bees to American agriculture:
Red clover is
Figure 19. California Alfalfa Seed Production 1960-98k
The value of honey bees to agriculture = V x D x P where: V = an average of the last three years' value of the crop (from USDA statistics, usually 1996-1998) D = the dependency of the crop on insect pollination (the same as was cited in 1989) P = the proportion of the pollinators that are honey bees (the same as was cited in 1989 except for pumpkins)
It is apparent that as farms grow larger and management schemes become more intense most growers will depend less on solitary and semi-social ground and twig nesting bees. Honey bees continue to be the pollinator of choice because they are available throughout the growing season, because they pollinate such a wide variety of crops, and because they can be concentrated in large numbers whenever and wherever needed.
Strawberry growers
occasionally use honey
bees for crop
Page 1 of 2Pollination 2000 - PG.13
6/13/2003http://www.beeculture.com/beeculture/pollination2000/pg13.htm
HomePage | This Month's BeeCulture | Archived Articles | More Information | Subscribe Today
one of the many legumes honey bees pollinate, and make honey from. Flottum photo
yield. Flottum photo
March 2000 pg. 13 Pollination 2000< previous 1 2 3 4 5 6 7 8 9 10 11 12 13 14 15 next >
Page 2 of 2Pollination 2000 - PG.13
6/13/2003http://www.beeculture.com/beeculture/pollination2000/pg13.htm
The Value of Honey Bees As Pollinators of U.S. Crops in 2000
< previous 1 2 3 4 5 6 7 8 9 10 11 12 13 14 15 next >
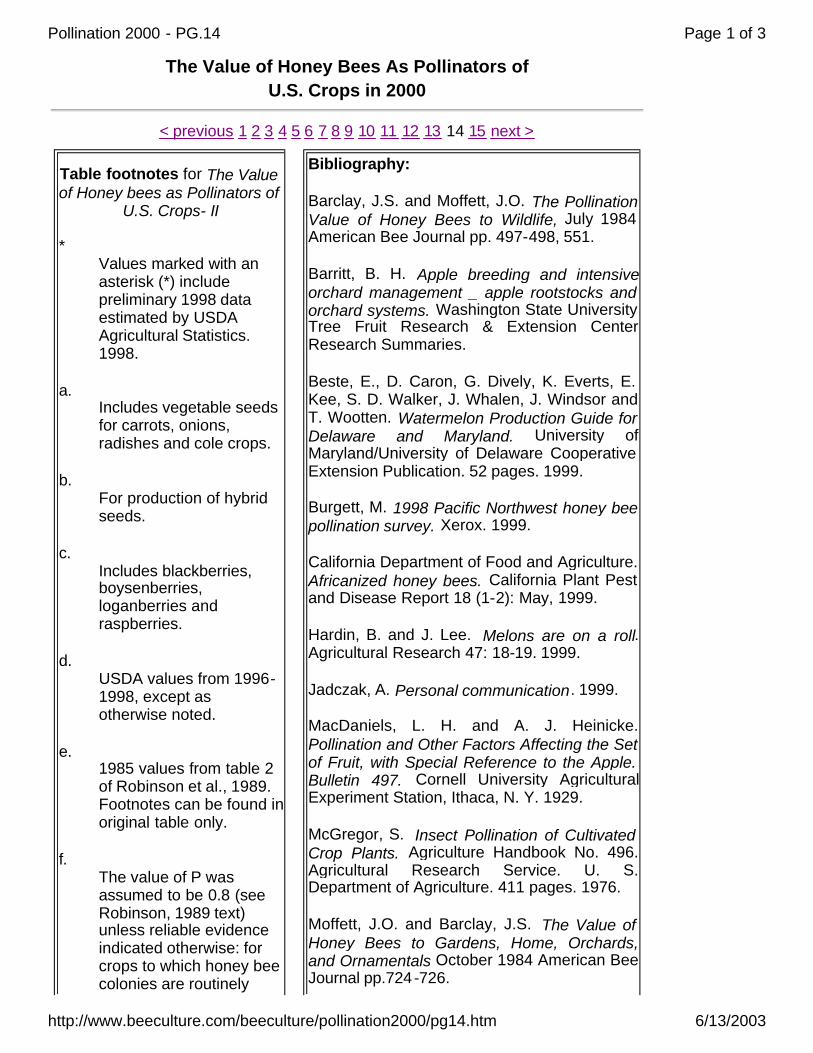
Table footnotes for The Value of Honey bees as Pollinators of
U.S. Crops- II
* Values marked with an asterisk (*) include preliminary 1998 data estimated by USDA Agricultural Statistics. 1998.
a. Includes vegetable seeds for carrots, onions, radishes and cole crops.
b. For production of hybrid seeds.
c. Includes blackberries, boysenberries, loganberries and raspberries.
d. USDA values from 1996-1998, except as otherwise noted.
e. 1985 values from table 2 of Robinson et al., 1989. Footnotes can be found in original table only.
f. The value of P was assumed to be 0.8 (see Robinson, 1989 text) unless reliable evidence indicated otherwise: for crops to which honey bee colonies are routinely
Bibliography:
Barclay, J.S. and Moffett, J.O. The Pollination Value of Honey Bees to Wildlife, July 1984 American Bee Journal pp. 497-498, 551.
Barritt, B. H. Apple breeding and intensive orchard management _ apple rootstocks and orchard systems. Washington State University Tree Fruit Research & Extension Center Research Summaries.
Beste, E., D. Caron, G. Dively, K. Everts, E. Kee, S. D. Walker, J. Whalen, J. Windsor and T. Wootten. Watermelon Production Guide for Delaware and Maryland. University of Maryland/University of Delaware Cooperative Extension Publication. 52 pages. 1999.
Burgett, M. 1998 Pacific Northwest honey bee pollination survey. Xerox. 1999.
California Department of Food and Agriculture. Africanized honey bees. California Plant Pest and Disease Report 18 (1-2): May, 1999.
Hardin, B. and J. Lee. Melons are on a roll. Agricultural Research 47: 18-19. 1999.
Jadczak, A. Personal communication. 1999.
MacDaniels, L. H. and A. J. Heinicke. Pollination and Other Factors Affecting the Set of Fruit, with Special Reference to the Apple. Bulletin 497. Cornell University Agricultural Experiment Station, Ithaca, N. Y. 1929.
McGregor, S. Insect Pollination of Cultivated Crop Plants. Agriculture Handbook No. 496. Agricultural Research Service. U. S. Department of Agriculture. 411 pages. 1976.
Moffett, J.O. and Barclay, J.S. The Value of Honey Bees to Gardens, Home, Orchards, and Ornamentals October 1984 American Bee Journal pp.724-726.
Page 1 of 3Pollination 2000 - PG.14
6/13/2003http://www.beeculture.com/beeculture/pollination2000/pg14.htm
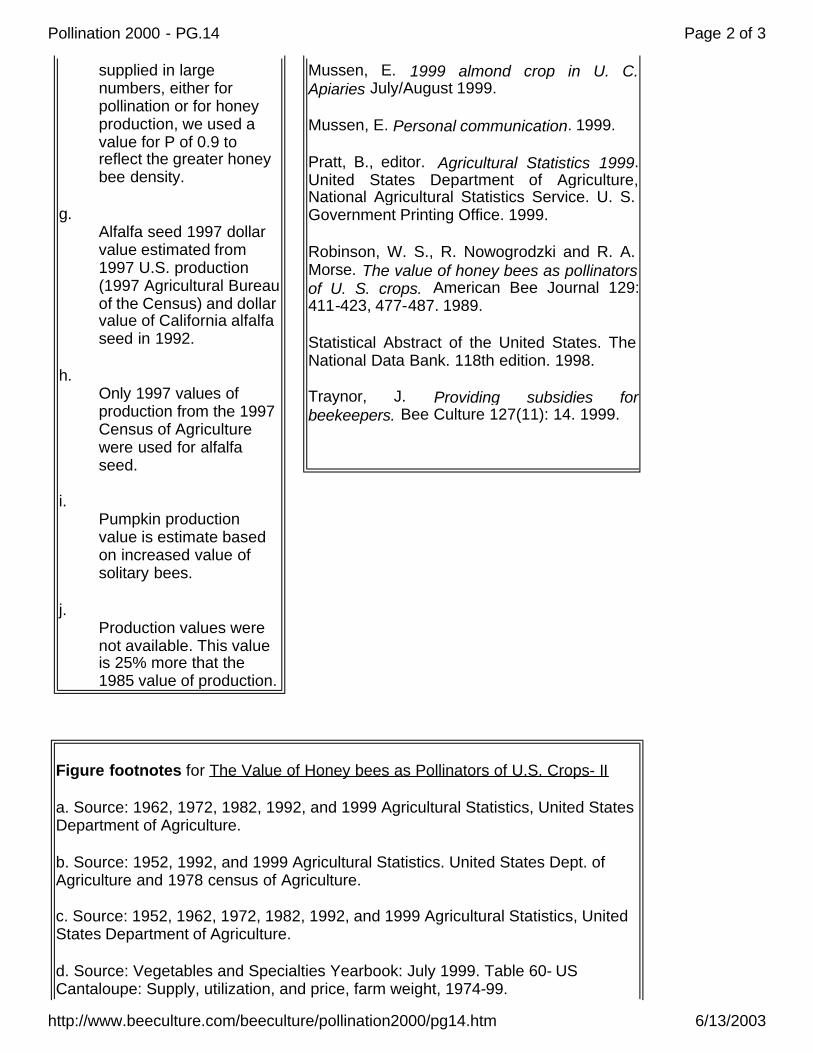
supplied in large numbers, either for pollination or for honey production, we used a value for P of 0.9 to reflect the greater honey bee density.
g. Alfalfa seed 1997 dollar value estimated from 1997 U.S. production (1997 Agricultural Bureau of the Census) and dollar value of California alfalfa seed in 1992.
h. Only 1997 values of production from the 1997 Census of Agriculture were used for alfalfa seed.
i. Pumpkin production value is estimate based on increased value of solitary bees.
j. Production values were not available. This value is 25% more that the 1985 value of production.
Mussen, E. 1999 almond crop in U. C. Apiaries July/August 1999.
Mussen, E. Personal communication. 1999.
Pratt, B., editor. Agricultural Statistics 1999. United States Department of Agriculture, National Agricultural Statistics Service. U. S. Government Printing Office. 1999.
Robinson, W. S., R. Nowogrodzki and R. A. Morse. The value of honey bees as pollinators of U. S. crops. American Bee Journal 129: 411-423, 477-487. 1989.
Statistical Abstract of the United States. The National Data Bank. 118th edition. 1998.
Traynor, J. Providing subsidies for beekeepers. Bee Culture 127(11): 14. 1999.
Figure footnotes for The Value of Honey bees as Pollinators of U.S. Crops- II
a. Source: 1962, 1972, 1982, 1992, and 1999 Agricultural Statistics, United States Department of Agriculture.
b. Source: 1952, 1992, and 1999 Agricultural Statistics. United States Dept. of Agriculture and 1978 census of Agriculture.
c. Source: 1952, 1962, 1972, 1982, 1992, and 1999 Agricultural Statistics, United States Department of Agriculture.
d. Source: Vegetables and Specialties Yearbook: July 1999. Table 60- US Cantaloupe: Supply, utilization, and price, farm weight, 1974-99.
Page 2 of 3Pollination 2000 - PG.14
6/13/2003http://www.beeculture.com/beeculture/pollination2000/pg14.htm
HomePage | This Month's BeeCulture | Archived Articles | More Information | Subscribe Today
e. Source: Vegetables and Specialties Yearbook: July 1999. Table 59- US Fresh honeydew: Supply, utilization, and price, farm weight, 1974-99.
f. Source: 1978, 1992, and 1997 values from the U.S. Census of Agriculture. 1952, 1962, 1972 values from Agricultural Statistics, United States Dept. of Agriculture and 1978 census of Agriculture.
g. Source: 1978, 1992, and 1997 values from the U.S. Census of Agriculture. 1950, 1960, and 1970 values from Agricultural Statistics, United States Dept. of Agriculture and 1978 census of Agriculture.
h. Source: Vegetables and Specialties Yearbook: July 1999. Table 61- US watermelon: Supply, utilization, and price, farm weight, 1974-99.
i. Source: 1978, 1982, 1987, 1992, and 1997 values from the U.S. Census of Agriculture.
j. Revised graph based on Figure 9 of Robinson et al., 1989.
k. Source: 1999, 1991, 1939-1981 California alfalfa seed statistics, California Agricultural Statistics Service, U.S.D.A.
March 2000 pg. 14 Pollination 2000< previous 1 2 3 4 5 6 7 8 9 10 11 12 13 14 15 next >
Page 3 of 3Pollination 2000 - PG.14
6/13/2003http://www.beeculture.com/beeculture/pollination2000/pg14.htm
The Value of Honey Bees As Pollinators of U.S. Crops in 2000
< previous 1 2 3 4 5 6 7 8 9 10 11 12 13 14
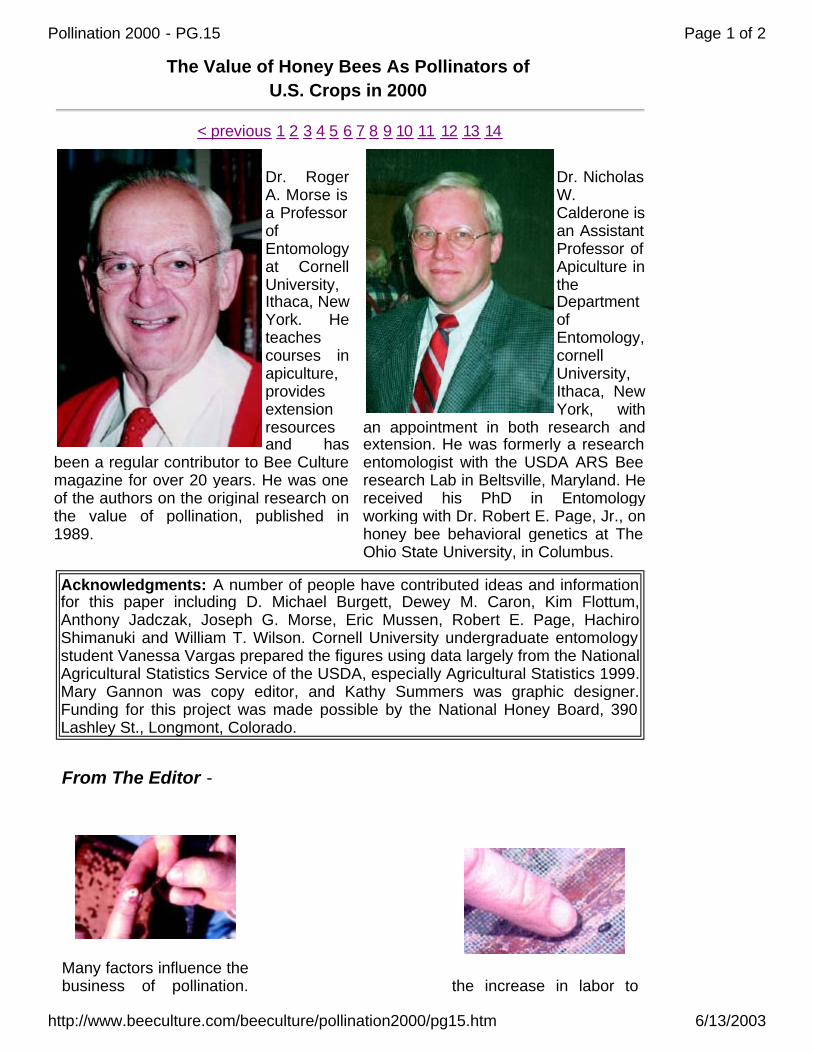
Dr. Roger A. Morse is a Professor of Entomology at Cornell University, Ithaca, New York. He teaches courses in apiculture, provides extension resources and has
been a regular contributor to Bee Culture magazine for over 20 years. He was one of the authors on the original research on the value of pollination, published in 1989.
Dr. Nicholas W. Calderone is an Assistant Professor of Apiculture in the Department of Entomology, cornell University, Ithaca, New York, with
an appointment in both research and extension. He was formerly a research entomologist with the USDA ARS Bee research Lab in Beltsville, Maryland. He received his PhD in Entomology working with Dr. Robert E. Page, Jr., on honey bee behavioral genetics at The Ohio State University, in Columbus.
Acknowledgments: A number of people have contributed ideas and information for this paper including D. Michael Burgett, Dewey M. Caron, Kim Flottum, Anthony Jadczak, Joseph G. Morse, Eric Mussen, Robert E. Page, Hachiro Shimanuki and William T. Wilson. Cornell University undergraduate entomology student Vanessa Vargas prepared the figures using data largely from the National Agricultural Statistics Service of the USDA, especially Agricultural Statistics 1999. Mary Gannon was copy editor, and Kathy Summers was graphic designer. Funding for this project was made possible by the National Honey Board, 390 Lashley St., Longmont, Colorado.
From The Editor -
Many factors influence the business of pollination.
the increase in labor to
Page 1 of 2Pollination 2000 - PG.15
6/13/2003http://www.beeculture.com/beeculture/pollination2000/pg15.htm
HomePage | This Month's BeeCulture | Archived Articles | More Information | Subscribe Today
For information on this article contact Bee Culture Magazine, 623 W. Liberty St., Medina, OH 44256. Call 800.289.7668, Ext. 3220, or email: [email protected].
Bee Culture Magazine, Published by the A.I. Root Company, Medina, OH, USA
Not least are the obvious costs - fuel, labor and the equipment required to manage and transport bees sometimes great distances, and for long periods of time on the road and away from home.
There are, however, other costs that are less obvious, but are as, or even more important to the business of pollination.
The first of these is the varroa mite, (photo on left) an invader that first appeared in the U.S. about a dozen years
ago. Left unchecked, varroa mites can kill an entire colony of honey bees in a matter of weeks. Controls are effective, but expensive to purchase and apply.
More recently, an invader from South Africa, the Small Hive Beetle (photo on right), has caused concern, and damage in pollination operations in the southern U. S. Controls are effective, but
apply them and cash to purchase them have removed yet more from the beekeeper's bottom line.
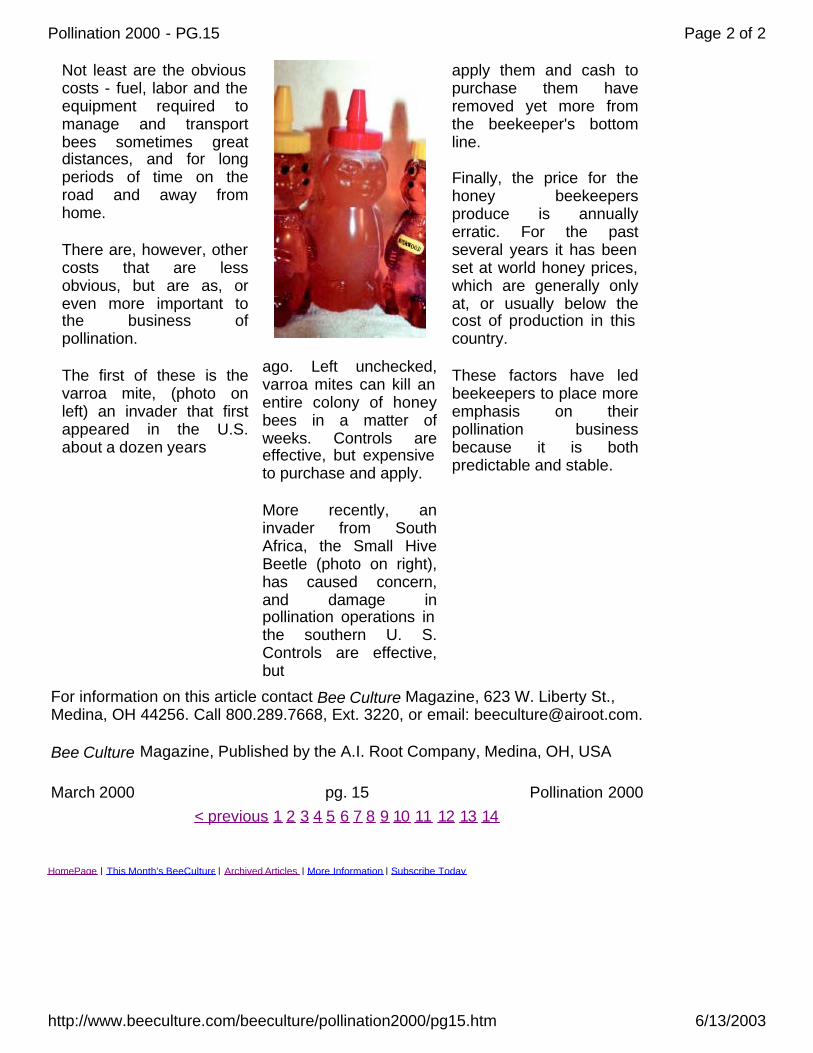
Finally, the price for the honey beekeepers produce is annually erratic. For the past several years it has been set at world honey prices, which are generally only at, or usually below the cost of production in this country.
These factors have led beekeepers to place more emphasis on their pollination business because it is both predictable and stable.
March 2000 pg. 15 Pollination 2000< previous 1 2 3 4 5 6 7 8 9 10 11 12 13 14
Page 2 of 2Pollination 2000 - PG.15
6/13/2003http://www.beeculture.com/beeculture/pollination2000/pg15.htm