The Value of Fire Protection in Buildings
36
Transcript of The Value of Fire Protection in Buildings

I
I
I I I
I I
I
I
I
I Scientific Research and Development Branc h
formerl y
SCIEN1IFIC ADViSORY BRANCH
RFPORT l778(reprinted as Pub ication 6983 )
FIRE RESFARCij
THE VALUF OF FIRF PP01ECTION IN BUILDINCS -SUMMAPY REPOPT
PRutEtein RACooke
I I SUMMAPY
Thi~ s~mary re~crt describes a Etudy of the value of s~rinklers detectors and structural fire resi~tance in reducing the fire carraq e in buildino~ of different occupancies The value is considered fr~ the national economy point of view and is determined by comparing the ccst cf providinq fire rrotection with the benefits of the ex~ected
I future reduction in fire darraqe The value of fire protecticn fro~ the firM~ ncint of view is alEo considered briefly
The methcd of analysi~ is outlined in this reoort and the rr2in results are presented Tables of the intermediate numerical result~ the nrcbebility of a fire occurring the average fire darrage in rrotected and unorctected buildinopound ana the fire loss per unit area of fire
I darrooe are included as an Appendix
Horseferry House Dean pyle Street London SW1P 2AW Noverrber 1978
~ Crown Copyright 1978
I
I
I
I CONTENTS PAGE
I 1 INTRODUCTION 1
11 The requirements of the study 12 The measurement of the value of fire protection
I 13 The aporoach to the problem
THE VALUE OF SPRINKLERS - ANALYSIS 4
I 21 The cost of a sprinkler system 22 The orobability of a fire occurring 23 The expected fire damage in an unprotected building 24 The expected fire damage in a building fitted with
sorinklers 25 The fire loss incurred 26 The estimated value of sprinklers
3 THE VALUE OF SPRINKLERS - RESULTS 7 31 The value of sprinklers to the national economy 32 The present provision of sprinklers 33 The value of sprinklers to the firm
4 THE VALUE OF DETECTORS - ANALYSIS 9 41 The cost of detectors 42 The estimated reduction in fire damage 43 The calculation of the value of detectors
5 THE VALUE Of DETECTORS - RESULTS 11 51 The value of detectors to the national economy 52 The present provision of automatic fire detection 53 The value of detectors to the firm 54 The reliability of detectors
6 THE EFFECT Of IMPROVED STRUCTURAL FIRE RESISTANCE 13
7 CONCLUSIONS 14
I
I
I
LIST OF FIGURES PAGE
I I Figure l The value of sprinklers in different occupancies 16
Figure 2 The value of direct line detectors in different occupancies 17
Fig ure 3 The val ue of local alarm detectors in different occupancies 18
APPENDIX - MAIN RESULTS OF THE STUDY
I
Table AI The cost of fire protection 20 Table A2 The probability of a fire occurring 21 Table 03 The estimated fire damage if only the minimum level
of fire protection is provided 22 Table M The average area of fire damage if sprinklers
are installed 23I Table AS The average direct loss per unit area of fire damage 24 Table 06 The es tima ted reduction in fire damage
due to detectors 25
I
I
I
I
I
I I
1 INTRODUCTION
The Home Office Fire Department is currently undertaking a wide-ranging review of fire and fire protection and the study reported here is one of this series of this particular study is
-to assess the value of sprinkdetection and structural fire refire losses in buildings
studies The objective
lers automatic fire sistance in reducing
of
Only the protection of property protection of life is the subject of
is a
considered here The separate study
This report contains a summary account of the study and includes an outline of the method of analysis as well as the main conclusions The main numerical results are included in the Appendix A full technical account of the study is given in Report l678The Value of Fire Protection in Buildings
11 The requirements of the study
The particular requirements of this study which have dictated our approach to the problem are as follows
1The value of the fire protection measures is considered from the national economy point of view The Home Office Fire middotOepartment as a Central Government department is concerned with the effects of fire and fire protection on the national economy In this study the costs of providing fire protection and the direct and consequential fire losses are therefore measured in terms of the national economic effects These costs and losses and particularly the consequential losses may be quite different from the costs and losses experienced by the owners or occupiers of the buildings
While the primary objective has been to consider the national economic effects the problem has also been considered briefly from the point of view of the owners or occupiers of the buildings
2In this study the value of the fire protection measures has been assessed in quantitative terms It was not sufficent to conclude for example that sprlnklers are very valuable The study was deSigned to provide estimates of the value of each fire protection measure in monetary terms
3The study was intended to provide an overall picture of the value of fire protection In order co provide this overall picture the analysis has been done for broad classes of buildings industrial buildings as a single group separate sectors of industry storage buildings and shops Other occupancies including offices schools hospitals and places of
1
assembly (public houses restaurants etc) have also been considered but the results for these occupancies may be less accurate because of the scarcity of relevant data The results of this analysis are therefore only applicable to each occupancy as a group or to the typical buildings in the group There may be many individual buildings in which the circumstances are different from the typical or average case and for which the results of the study do not hold However the objective of the study is the provision of an overall picture and general conclusions rather than to attempt to produce a universal formula which is detailed and accurate enough to apply to any and every individual building
12 The measurement of the value of fire protection
The value of fire protection is measured by comparing the costs of providing the protection with the reduction in fire losses resulting from the additional protection Because the costs are mainly incurred in the initial year and the benefits accrue (in probability) in future years the costs and benefits must be compared using the standard accounting technique of Discounted Cash Flow
If the initial cost of installing fire protection is C and the annual maintenance costs are c per year then discounting at 10 per cent over 20 years the total discounted cost of providing fire protection is
C + 936c
The expected reduction in fire losses in any year is Reduction in fire lossesmiddot
Probability of fire x (Fire loss if a fire occurs in an unprotected building
Fire loss if a fire occurs in a protected building)
The total discounted future benefits are equal to 936 times the expected annual reduction in fire loss
If the discounted benefits are greater than the discounted costs then the provision of fire protection is considered cost-effective
~~ The approach to the problem
In order to estimate the value of fire protectionthe costs and benefits must be calculated for each occupancy group The separate items in this calculation are
-the cost of providing fire protection -the probability of a fire occurring -the average amount of fire damage which would result if a fire occurred in an unprotected building -the average amount of fire damage which would result
2
I
I
I
I
if a fire occurred in a protected building
This proble~ has been tackled as a statistical eKercise The separate elements of the problem have been estimated from the available fire data and where data were not available additional data have been COllected A very important part of our study has been a special survey of fires In the fire survey a total of 600 fires were examined by a forensic scientist who has specialised in fire investigations accompanied by a senior Fire Prevention Officer About 100 of the fires were visited soon after the fire occurred the fire scene was examined and the officer in charge at the fire and other witnesses were questioned In the remaining fires in which the circumstances were simpler the fire report was examined and additional questions were asked of the officer in charge at the fire
The fire survey not only provided information which could not have been Obtained otherwise but also gave a clearer understanding of fire data generally and thus enabled better use to be made of the other fire data
Initially a fairly elaborate method of analysis was planned in order to produce the most accurate results and to avoid any misinterpretation of the fire data In the event it turned out that there were insufficient detailed data to support the more sophisticated methods and more importantly it could be shown that the more complex methOds would not make any significant difference to the answers The final results were derived using Simpler methods but the experience of attempting to use more complex models has given us more confidence in the final results
The analysis of the value of sprinkler protection is described in Sections 2 and 3 the analysis for detectors in Sections 4 and 5 and the effect of increased structural fire resistance is described briefly in Section 6 The final conclusions are summarised in Section 7
3
I
2 THE VALUE OF SPRINKLERS- ANALYSIS
The estimation of e~ch of the items in the calcul~tion (liEtec in Section 13) c~n be regardec as a separate problem E~ch of the items is discussed briefly in this section and the results are illustrated using the example of an industrial building with a floor ~rea of 1500 sauare metres The full results for other occupancies and building sizes ~re given in the Appendix
2~1 The cost of a sprinkler systew
The cost of the sprinkler heads and the associated pipework will depend on the size of the building which is to be protected There will also be a fixed cost for each systew for the control valves alarms and the connection to the mains The estimated cost of installing a sprinkler system in a building of simple open construction ~nd involving no special haz~rd and no additional water supplies is pound(2000 + 198 x Size of building(sam)) The costs of other sprinkler systems are given in Table Al
The maintenance cost in future years is estimated to be about 1 per cent of the initial capital cost
22 The probability of a fire occurring
The probability of a fire occurring will vary with the occupancy and the size of the building The probability is estimated by relating the number of fires which occur in buildings of a given size and occupancy to the number of buildings of that size and occupancy at risk The probability of a fire in a large building is greater than in a swall building of the same occupancy but the risk of a fire does not increase in direct proportion to the building size The probability of a fire is of the form
Probability z aB where B is the floorspace of the building and a and c are the estiwated parameters for each occupancy
The estimated probability of a fire in an industrial building is given by
Probability z 00017B0middot3 which is eaual to a probability of 0082 in a 1500 square metre building or on average one fire every 12 years
Table A2 shows the probabilitity of a fire in other occupancies
~~3 The expected fire damage in an unprotected building
The average area of fire damage which would occur in an unprotected building was estimated from an analysis of the fires in buildings which did not have sprinklers or detectors The average area of fire damage is the average of many small fires
4
anc ltl f e ~ 9 E fires o nc the ave rage de pends on the size of the building middotsimply because large fires cannot occur in small buildings The average area of fire damage is estimated in the form
Fire size dBmiddot bullE
where B is the building floorspace and d and e are estimated parameters For industrial buildings tE~ estimated fire size is
Fire size 2 25 r E
and the average fire size in an unprotected building of 1500 souare metres is therefore 60 souare metres
The estimated areas of fire damage in buildings of other occupancies are given in Table A3
I 1~4 The expected fire damage in a building fitted with sprinklers
I
The expected fire da~age if a fire breaks out in a building in which sprinklers are installed has been estimated by considering four separate situations which might arise There may be insufficient heat to activate the sprinkler heads the sprinklers may not operate because the system has been turned off or because of a mechanical defect the sprinklers might operate and control or extinguish the fire or the fire may grow very large despite the operation of the sprinklers These separate outcomes are not of interest in their own right but subdividing the problem in this way provides more insight and produces a more reliable result
For an industrial building of 1500 sauare metres the probabilities of each outcome and the average area of fire damage in each case are
Sprinkler not activated 57 S sqm Sprinkler failure 09S 130 sOm Satisfactory operation 41 IS sOm Fire middotout of control 09S SOO sqm
The average damage if sprinklers are installed is therefore 0S7xS + 0009Sx130 + 04lxlS + O009SxSOO = 16 sqm
Predicted performance in other occupancies is shown in Table A4
2S The fire loss incurred
The relationship between fire losses and the area of fire damage has been investigated and it has been shown that the fire loss can be estimated simply by multiplying the area of fire damage by an average unit loss For industrial buildings the direct loss (to the national economy) is estimated to be pound140sqm of fire
I damage (The direct loss as estimated by insurance companies may be about IS per cent higher) Direct losses in other occupancies are shown in Table AS
A study of conseouential losses has shown that for manufacturing industry such losses are from the national economy point of
I 5
view equ~l to ~bout 60 of direct losses although the consequenti~l losses to the firm may be considerably greater
~6 The estimated value of sprinklers
For the example of ~n industrial building of 1500 square metres the initi~l capit~l cost of ~ sprinkler system would be pound5000 ~nd the total discounted cost of providing sprinkler protection including future m~intenance costs pound5500
If a fire occurred ~nd the building were not protected the ~verage area of fire damage would be 60 square metres involving ~ direct loss of 60x140-pound8400 and ~ total loss of pound8400xl6-pound13400 If the building were sprinklered the ~verage are~ of fire dam~ge would be 16 square metres involving a direct loss of pound2300 and ~ total loss of pound3700 The provision of sprinklers will therefore have reduced the expected fire dam~ge by 73
The probability of a fire per ye~r is 0082 and the expected reduction in fire losses per ye~r is therefore 0082x(pound13400-3700)- pound800 The total discounted benefit due to the reduced fire loss is thus pound7400 which exceeds the (discounted) cost of providing the sprinklers The provision of sprinkler protection in these buildings is therefore cost-effective from the n~tional economy point of view
The v~lue of sprinklers can be calcul~ted in this way for buildings of other occupancies ~nd other sizes
6
I
3 THE VALUE OF SPRINKLERS - RESULTS
31 The value of sprinklers to the national economy
The value of sprinkler protection calculated from the national economy point of view has been estimated for buildings of different occupancies and different sizes and the results are summarised in a graohical form in Figure 1 Figure 1 shows the Net Present Value of sprinkler protection (the discounted benefits minus the discounted costs) in different occupancies Where the Net Present Value is greater than zero sprinkler protection can be said to be cost-effective
The results show that for the overall industrial group of buildings sprinklers are cost-effective in buildings larger than
I 800 sauare metres When the different sectors of industry are considered separately the minimum building size above which sprinklers are of value is between 300 and 1000 square metres for most of the industries The separate industries in which sprinklers appear to show the greatest economic value are Other Manufacturing (which includes rubber and plastic products) Chemicals Food Timber and Electrical Engineering It is estimated that sprinklers would be cost-effective in about 50 per cent of the buildings in manufacturing industry and these buildings account for about 90 oer cent of the total floorspace in manufacturing industry
Sprinklers also aopear to be of value in the larger shops Snrinklers do not aopear to be of value (at least when only property protection is considered) in hospitals offices schools and pubs and restaurants
I
One perhaps surprising result is that sprinklers do not appear to be cost-effective in storage buildings Although the fires in storage buildings are large on average and sprinklers are very effective in reducing this fire damage the probability of a fire occurrinq is low and the expected reduction in fire damage is therefore not sufficient to - offset the cost of providing sorinklers This result far all storage buildings considered as
I a single group hides the fact that the circumstances in
I different tyPes of storage buildings can be very different If the storage group is subdivided it can be shown that sprinklers will be of net value in high risk high value storage buildings
Although the results of this analysis show that sprinklers are cost-effective in larger hotels there is reason to suspect that because of the inadeQuacy of the data used in the analysis these results overestimate the value of sprinklers in reducing property damage in hotels
7 I
32 The present provision of sprinklers
The present provision of sprinkler protection in manufacturing industr y has been estimated by a survey of manufacturing industry The survey results show that 13 per cent of buildings have complete sprinkler protection anc a further 4 per cent have partial ~prinkler protection Sprinklers tend to be installed in the larger buildings and it is estimated that a total of about 3S per cent of the floorspace in manufacturing industry is protected by sprinklers
No estimates of the extent occupancies are available
of sprinkler protection in other
33 The value of sprinklers to the firm
The value of sprinklers briefly in this study
to the firm has only been considered
Firms may install fire protection because of their awareness of the risks of fire and their wish to reduce these risks or they may install protection mainly in order to secure more advantageous terms for fire insurance Estimates have been made of the financial incentives to the firm to install fire protection
Insurance companies offer premium discounts of between 60 per cent and 90 per cent for approved sprinkler systems By making some assumptions to compensate for the lack of detailed information about insurance rates it is possible to estimate the value to the firm of installing sprinklers in buildings of different sizes
The estimates of the value to the firm of providing sprinklers in industrial buildings show that the value to the firm is broadly similar to the value to the economy ie where sprinklers are of value to the economy there is a financial incentive to the firm to install this protection In development areas where capital grants are available to firms who install sprinklers the financial incentives to install sprinklers are much greater
8
4 THP VALUP ~p DETECTOPS - ANALYSIS
41 The cost of detectors
Jt is estim8ted that the cost of installing either heat or smoke detectors in 8 building of simple open construction is 8poroximately pound11 per square metre of floorspace In 8ddition there will be 8 cost of 8bout pound1500 for the control equipment If 8 direct line system is inst8lled there will 8lso be a connection ch8rge The initi8l costs 8nd the future m8intenance 8nd line rent81 ch8rges for local 8l8rm and direct line systems 8re given in Table Al
~ 2 The estimated reduction in fire d8m8ge
I
I Detectors reduce fire d8m8ge by giving e8rly w8rning of 8 fire 8nd thus 8llowing people to intervene e8rlier The effectiveness of detectors depends on where people 8re 8t the time the fire occurs how r8pidly the fire is growing how people respond when they hear the 8l8rm 8nd how cap8ble people 8re of de8ling with the fire when they first 8rrive on the scene The effectiveness of detectors is therefore much more difficult to predict
The b8sic f8ctors which determine the effect of detectors in reducing fire d8m8ge C8nnot be deduced from the main fire st8tistics and we h8ve therefore had to rely very he8vily in this p8rt of the 8n81ysis on the inform8tion derived in our own fire survey For e8ch of the fires eX8mined in our survey 8n 8ssessment W8S m8de of the 8mount of fire d8m8ge which might h8ve occurred if detectors h8d been inst8lled This 8ssessment W8S m8de in the light of the 8ctu81 circumst8nces of e8ch fire 8nd
I particu18rly the estim8ted r8te of development of the fire in its e8rly st8ges 8nd the 8ssumed 8bility of the people in the vicinity to respond to the 818rm 8nd deal with the fire
I This 8ssessment of the d8m8ge which might h8ve occurred together with the record of the fire d8m8ge which 8Ctu8l1y occurred could be used directly to estim8te the possible reduction in fire d8m8ge due to detectors However in order to widen the b8sis of the estim8te 8n 8ttempt h8S been made to gener8lise the survey results by reference to the complete s8mple of fires for which a K433SAF2 fire report W8S 8vai18ble The K433SAF2 fire reports include 8 record of the 10c8tion of the ne8rest person 8t the time of the fire The possible reduction in fire d8m8ge C8n be estim8ted 8S 8 function of the C8use of the fire b8sed on the det8iled experience of the fire survey
The estimation of the reduction in fire dam8ge from the b8sic fire st8tistics is not entirely s8tisf8ctory 8S it depends on 8 v8riety of 8ssumptions some of which 8re difficult to justify Nevertheless the gener8l 8nalysis h8S been used in this study bec8use even though it m8Y not provide 8n independent estimate it does provide 8 better underst8nding of the estim8te of the
9
I
I
I effectiveness of detectors
For the example of an industrial building of area 1500 square metres the estimated effect of direct line detectors is as follows
Proportion Damage Estimated of fires if unprotected reduction
Person in room 55 40 sqm 0 Person in bldg 18 50 sqm 65-85 Person not in 27 105 sqm 65-85 building All fires 100 60 sqm 40-55
The estimation of the reduction in damage due to direct line and local alarm detectors in buildings of different occupancies is shown in Table A6 This Table shows the estimates produced through the general analysis as well as the average assessed reduction in the fire survey The generalised estimates cover a range of values reflecting the degree of uncertainty in the estimation procedure and are generally lower than the survey estimates reflecting the cautionary nature of the generalised analysis
43 The calculation of the value of detectors
Taking the example of a 1500 square metre industrial building again the initial cost of a direct line detector system is about pound3400 and the future annual running costs are pound280 (see Table Al) The total discounted costs are thus pound6000
The average 1055 per fire in an unprotected building would be pound13400 (from Tables A2 and A3 and including consequential losses of 60 per cent) If the fire damage is reduced by 40 per cent by the installation of automatic fire detection (Table A6) then the expected annual benefits would be 0082x13400xO4-pound440 The discounted value of the total future benefits is then pound4100 In this case the cost of providing direct line detectors is greater than the expected benefits and from the national economy point of view the provision of detectors in these buildings is not cos t-effecti ve
10
5 THE VALUE OF DETECTORS - RESULTS
51 The value of detectors to the national economy
I The value of automatic fire detection calculated from the national economy point of view has been estimated for buildings of different sizes and different occupancies The results for
I direct line alarm systems are summarised in Figure 2 and the results for local alarm systems in Figure 3
In these Figures a range of values are shown for industrial buildings This range reflects the alternative range of estimates of the reduction in fire damage Only a single estimate of the economic value of detectors is shown for other occupancies in order to simplify the graphs The single line shown for the other occupancies is the mid-point of the range of values
In industrial buildings larger than about 2000 square metres (22 per cent of the buildings in manufacturing industry exceed this size) direct line detectors appear to be of economic value Somewhat surprisingly detection systems with local alarms appear to be of equal or greater economic value than systems with direct line alarms This result reflects the experience of the fire survey in which it was judged that in many cases a local alarm would have brought people to the fire promptly and that these people would have been able to extinguish or at least to contain the fire Although direct line systems can achieve a greater reduction in fire damage this additional benefit does not offset the higher cost of providing the direct line system
The only other occupancy in which detectors appear to be of economic value is shops and here it is the direct line systems which show the greater benefit
I 52 The present provision of automatic fire detection
The results of the survey of manufacturing industry show that detectors are installed in abou t 5 per cent of buildings covering a total of about 13 per cent of the total floorspace
The industr ies with the proportionately highest degree of automatic fire detection are Electrical Engineering and Chemicals
53 The value of detectors to the firm
Insurance companies offer discounts of up to 125 per cent for the installation of approved detector systems Because of the way in which premiums are calculated this is equivalent to a discount of up to about 20 per cent on the premium payable
Our estimates of the value to the firm of installing detectors
11
I
I I
suggest that even in the largest industrial buildings the costs of providing a detector system will exceed the benefits of the reduction in premiums (Although there may of course be individual cases where this generalisation development areas where government grants are for capital investment there may be a small to firms to install detectors in larger build
is not payable
financial ings
true) In to firms incentive
54 The reliability of detectors
Studies of the reliability of the present direct line fire detection systems have shown that for every genuine alarm signalled by the system there are more than 10 false and accidental alarms A false alarm rate as high as this could cause serious problems for fire brigades if there was widespread use of direct line detector systems However the technology is changing rapidly in this area and the reliability of automatic fire detection systems may improve in the future
12
I 6 THE EfFECT Of IMPROVED STRUCTURAL fIRE RESISTANCE
The effect of improved fire resistance in the internal structure of buildings can only be estimated from the information obtained in the examination of buildings in the fire survey At each building visited in the survey an assessment was aade of the amount of fire damage which might have occurred if all the internal surfaces (walls doors ceilings etc) had a minimum of 30 minutes fire resistance
I
Improved fire resistance would have reduced the amount of fire damage in some of the fires which spread beyond the room of origin The survey assessments take into account the fact that in some of the larger fires improved fire resistance would have had no effect because for example doors were left open or because the fire was so severe and had burned for so long that even the more resistant compartment wallS would have been penetrated
No estimate was made of the cost of bringing the structure up to the higher standard although it was clear that the cost would be substantial in many cases
In the survey it was estimated that increased structural fire resistance would have reduced the average amount of fire damageI by 45 per cent in industrial buildings 50 per cent in storage buildings and 55 per cent in shops
I
I
13
I I
7 CO~ CLUSI ONS
Before presenting any conclusions the limitations of the study should first be reiterated Firstly only the protection of property has been considered in this study and not the protection of life Secondly only complete sprinkler systems complete detector systems and complete upgrading of the internal structural fire resistance have been considered The value of partial fire protection systems (protecting only the most valuable parts of the building or the highest risks) or mixec systems (part sprinklers and part detectors) or other forms of fire protection (venting CO 2 flooding etc) have not been considered Thirdly a broad view of the problem has been taken ana results have been derived only for the major occupancy grcups There may well be many special cases or individual buildings for which the general results are not valid
The objective of this study was to derive an overall picture of the value of fire protection measures from the national economy point of view This overall picture is presented in Figures 1-3 The main findings of the study are as follows
1 Sprinklers are very effective in reducing fire damage and the reduction in dam~e is estimated to be 70-90 per cent in buildings of different sizes and occupancies When the cost of providing sprinklers is compared with the saving in fire losses the results of this study indicate that sprinklers are cost-effective in the medium and large industrial buildings in large shops and in high value high risk storage buildings
2 From the firms point of view there is a strong incentive to install sprinklers in order to benefit from the premium reductions offered by insurance companies However far fewer firms have actually taken advantage of these incentives than would benefit from doing so The question arises of why firms have been reluctant to take advantage of these financial incentives
3 It is estimated that automatic fire detection can reduce fire damage by about 50 per cent on average in industrial buildings and even more in other occupancies When these savings in fire losses are compared with the cost of providing detectors it appears that automatic fire detection is of economic value in the larger industrial buildings and the largest shops However if the present high false alarm rate is not improved wider use of direct line detectors might cause serious problems for fire brigades
It should be noted that the Fire Offices Committee representing fire insurers generally have reported that their own estimates of the reduction in fire damage effected by detectors is well below the figure quoted here Although the figures provided by FOC have not been supported by any detailed analysis they are
14
I bull
I nevertheless based on many years experience of underwriting fire risks Only further detailed study could resolve which of the two estimates is closer to the true value although the Home Office has no plans for such work to be carried out
4 From the firms point of view there is relatively little financial incentive to install detectors
5 It is estimated that improved structural fire resistance might reduce fire losses by about 50 per cent No estimate has been made of the cost of these structural improvements
I
I
I I
I I I
15
I
Figure 1 THE VALUE OF SPRINKLERS IN DIFFERENT OCCUPANCIES
8000
7000
6000
5000
4000
Cl) l iii 3000 gt c Cl) III Cl) a 2000 Cl)
Z
1000
o ~____L--+~____-L~__~____-L____~____~__~
- 1000
- 2000
Building size (m2)
Storage
Pubs Restaurants etc (7)
- 4000
16
-3000
I
I Figure 2 THE VALUE OF DIRECT LINE DETECTORS IN
I 7000
6000
5000
I 4000
Il l iii gt 3000 c Il ~ QI li 2000 z
I 1000
I 0
-1000
I -2000
-3000
- 4000
DIFFERENT OCCUPANCIES
Shops
75 Reduction
Storage 70 Reduction
Pubs etc
60~
SChoolS 70 Reduction~ Offices 55 Reduction
V
17
I
Figure 3 THE VALUE OF LOCAL ALARM DETECTORS IN DIFFERENT OCCUPANCIES
8000 r
7000
6000
5000
4000
Q)
J
~ 3000 c Q) Vl Q) -Cl 2000 Q)
Z
1000
o
- 1000
-2000
- 3000
-4000
50 Reduction
Shops 35 Reduction
Storage 50 Reduction
18
I
I I
APPEtWIX A
TABLES OF THE MAIN NUMERICAL RESULTS
I
I I I I I
19
I I
I
I I
I
I I I I I
I I
I I
TABLE A1 THE COST OF FIRE PROTECTION (1977 PRICES)
SPRINKLER SYSTEMS- in buildings of simple open construction not requiring pumps or additional water supplies
Initial cost
I Extra low hazard pound2000 + 083 x size of bUilding(m~) Ordinary hazard pound2000 + 198 x size of building(m )2Extra high hazard pound2000 + 267 x size of building(m )
Annual maintenance cost
Approximately 1 of initial cost
I I
AUTOMATIC DETECTION- in buildings of simple open construction
1nitial cost
Local alarm system pound1500 + 11 x size of bUilding(m~)
I Di rect line system pound1750 + 11 x size of building(m )
Annual maintenance and line rental costs
Local alarm system pound50 + 0025 x size of building(m~) Direct line system pound240 + 0025 x size of building(m )
I
I I I
20
I
TABLE A2 THE PROBABILITY OF A FI R OCC URRIlFu
OCCUPANCY (SIC ORDER)
1----------------------INDUSTRIAL BUILDINGS
PROBABILITY OF FIRE PER YEAR a BC PROBABILQY OF FIRE
IN 15OOm BUILDING
a -4-------
c
~------~------------~
Food drink and tobacco (Ill)
00011 OGc 0086
Chemicals and allied (V) 00069 046 021
bull Mechanical engineering (VII)
000011 075 0027
Electrical engineering (IX)
000061 059 0046
Vehicles (XI) 000012 086 0062
bull Metal goods not elseshyvhere specified (XII)
000158 054 0082
Textiles (XIII) 00075 055 0097
Timber furniture (XVII) 000057 077 010
Paper printing and publishing (XVIII)
0000069 0054
Other manufacturing (XIX)
00084 041 017
All manufacturing industry (Ill-XIX)
arHER OCCUPANCIES
00017 055 0082
Storage 000067 05 0026
Shops 0000066 10 0099
Offices 0000059 09 0043
Hotels etc 000008 10 012
Hospi tals etc 00007 075 017
bullbull Pubs restaurants etc (10) (01 )
Schools 00002 075 0048
Note Some of the fires vhich should be included in the Mechanical engineering sector may have been classified as Metal goods nes This vould result in an underestimate of the probability of fire for Mechanical engineering and an overestimate for Metal goods If the tvo groups are combined the estimated probabili ty of fire is 000086 1356 bull
middotValues for Assembly are assumed There vas insufficient information available to estimate the probability of fire in this occupancy group
21
I
TABLE A3 THE ESTIMATED FIRE DAMAGE IF ONLY THE MINIMUM LEVEL OF IRE PROTECTION IS PROVIDED
I I
I I I
I I
I I
OCCUPANCY (SIC O~vER) AVERAGE FIRE SIZE AS A rUNCTION OF BUILDING SIZE(m 2 )
SAMPLE SIZE
AVERAGE FIRE SIZE IN A B I~ NG 0 15(XluhlOORSPACE
INDUSTRIAL BUILDINGS
All industry 6496 60
Food drink amp tobacco (Ill)
313 73
Chemicals ampallied (V) 516 28
Mechanical engineering (VII )
248 44
Electrical engineering (IX )
174 64
Vehicles (XI) 080 g58 181
Metal goods not elseshywhere specified (XII)
64 jj23 561
Textiles (XIII ) 2 6 ~)9 399 45
Timber furniture (XVII ) 4 B21
2 2 393 112
Paper printing amp pUblishing (XVIII)
6 7 ~)6 198 93
Other manufacturing (XIX)
OTHER OCCUPANCIES
87 38
B 228 140
Storage 1398 157
Shops 50
095 B 2662 37
Offices 622 15
Hotels etc 22
B 973 27
Hospitals 20
936 5
Pubs restaurants etc 76 B 2908 33
Schools etc 28 57
B 906 42
22 I
~ABLE M IBE A VElUGE llE4 01 lIRE DAlIAGE IF SPRIIiKLERS ARE IIISTALLD
fRlfKirpi ~~ SPRlI)(L OPJAA[D ampPRIf~ I YtS SPF ~KIrnS rAI ur
~crIV JL SAl ]St AtTOR] U middotCOIIL er CO~i OCCUPIlCy (SIC CiWUl )
Aydllolteerll ~)PrYpn Prepn ~ dANr(~ ) PTopn h~(2) hdt(~ )Pr0in
It i middot~ITfd AL 31JlllNG
All induetr-J 13 p~ 8022I lt3 022x bullI(~955bull 3middot57 5 gt~ -66
a78Bmiddot~food dr~ toouCO ampJ OZb 2 0101 1 Illlt68bull bull (Ill ) -67
Bmiddot 1202h O 60 2 9t2looChellicil15 ampl11 02gt29~ 89 (V) -30
029 l 76rechmiddotnica elaquo1necriTf -2 961bullbull 580258 gtOOx~ (nl) -cn
B 7EhctriClll lr1n~r1Damp 1 02x~ )09 5 (96Bbullbull 5~ 01z53 (Il ) -ltgt69
tb1c1u (Xl) 87 62 E gtDUx 966x 3 9 01 3 -67
IMete roods cot l6Ishy gt 022z5C 6968 bull bull 58 0lx58 S3 0 bull 2l otltrtl ~lcihd (XlI) -072
uUl (XlII ) 2lt0Ux47 Efu-47 016bullbull475~I gt~55 middot-79I
t1~lgteT bull lUT~j tlJt (Xll) 0Z2z602 ~ S 96360 01bullbull 60 gt - B )6hpn Prictinf 022x60 9562060 019x6O B2 5publiahinl (nUl) -ltgt
B 02b )0Oth~r canufampetnr1n~ 70 290 06lO IV95x~ 30 (nxl -9
OHlI OCCtIPAN Ci rs 11 5lpoundtorace 0Z2z1(2 4bgt 9282076 050lt7pound (6
~O6
pound1ope 2 B 00022J 4555 Oh49sBx1t5 B2
(Off1e ) ( ) ( () )275 ( ( )) ( )) (
1WItela ~tc ( ( )) ( )106 ) ( -19 middot( )( ) ( ) )(
( ) ( ) ( ) ( ) )H04fIitala tc ( ( )) ( ()9
( 09 2 ) ( 0222o5~) 2 I(72oi (Q052oi gt5( ( )Pub_ atamplltampJl ete ) ( )) (9 middot ( ) ( ) ( ) )~19 ( ( ) ( ) ( ( )I
Sehoola ate ( ) ( ) ( ( )5middot5 bull )1 I ( ( )) 19 ( ) ( )
TABLE A5 THE AVERAGE DIRECT LOSS PER UNIT AREA OF FIRE DAMAGE
I I
I
I I
OCCUPANCY (SIC ORDER ) UNIT LOSS (poundsqm )
INDUSTRIAL BUILDINGS
All industry 140
Food drink amp tobacco ltrII)
Chemicals amp allied (V)
270
Mechanical engineering ( VII )
290
Electrical engineering (IX )
320
Vehicles (xI) 150
Metal goods not elseshywhere specified (XII)
240
Textiles (XIII) 210
Timber furniture (XVII) 130
Paper printing amp publishing (XVIII )
90
Other manufacturing (XIX )
OTHER OCCUPANCIES
120
Storage 120
Shops 160
Offices 150
Hotels etc 130
Hospitals etc 160
Pubs restaurants etc 100
Schools 110
24 I I
I TABLE J~ THE ESTIMATED REDUCTION IN FIRE DAMAGE DUE TO DETECTORS - ALL FIRES
Reduction in fire damage
Occupancy Survey
sample size lIith direct line alarm lIith local alarm
Estimated from Estimated Eetilllllted from Eetimated K433SAF2 in Survey K433SAF2 in Survey
Industry 210 -(40~55) -55 -(35-50) -50
Storage 30 -( 60-70) -80 - (45 55) -60
Shops 50 -( 65-75) -85 -(35-40) -4OJ~
Offices 17 -(55r~70) -45 not estimated -40
Hotels 12 -(55-65) -85 not estimated -85
Pubs restaurants 36 -(60-75) -55 not estimated -40
Schools 26 -(55-70) -90 not estimated -85
25
I
I I
I I
I I I I
I
I
I
I

I
I
I
I CONTENTS PAGE
I 1 INTRODUCTION 1
11 The requirements of the study 12 The measurement of the value of fire protection
I 13 The aporoach to the problem
THE VALUE OF SPRINKLERS - ANALYSIS 4
I 21 The cost of a sprinkler system 22 The orobability of a fire occurring 23 The expected fire damage in an unprotected building 24 The expected fire damage in a building fitted with
sorinklers 25 The fire loss incurred 26 The estimated value of sprinklers
3 THE VALUE OF SPRINKLERS - RESULTS 7 31 The value of sprinklers to the national economy 32 The present provision of sprinklers 33 The value of sprinklers to the firm
4 THE VALUE OF DETECTORS - ANALYSIS 9 41 The cost of detectors 42 The estimated reduction in fire damage 43 The calculation of the value of detectors
5 THE VALUE Of DETECTORS - RESULTS 11 51 The value of detectors to the national economy 52 The present provision of automatic fire detection 53 The value of detectors to the firm 54 The reliability of detectors
6 THE EFFECT Of IMPROVED STRUCTURAL FIRE RESISTANCE 13
7 CONCLUSIONS 14
I
I
I
LIST OF FIGURES PAGE
I I Figure l The value of sprinklers in different occupancies 16
Figure 2 The value of direct line detectors in different occupancies 17
Fig ure 3 The val ue of local alarm detectors in different occupancies 18
APPENDIX - MAIN RESULTS OF THE STUDY
I
Table AI The cost of fire protection 20 Table A2 The probability of a fire occurring 21 Table 03 The estimated fire damage if only the minimum level
of fire protection is provided 22 Table M The average area of fire damage if sprinklers
are installed 23I Table AS The average direct loss per unit area of fire damage 24 Table 06 The es tima ted reduction in fire damage
due to detectors 25
I
I
I
I
I
I I
1 INTRODUCTION
The Home Office Fire Department is currently undertaking a wide-ranging review of fire and fire protection and the study reported here is one of this series of this particular study is
-to assess the value of sprinkdetection and structural fire refire losses in buildings
studies The objective
lers automatic fire sistance in reducing
of
Only the protection of property protection of life is the subject of
is a
considered here The separate study
This report contains a summary account of the study and includes an outline of the method of analysis as well as the main conclusions The main numerical results are included in the Appendix A full technical account of the study is given in Report l678The Value of Fire Protection in Buildings
11 The requirements of the study
The particular requirements of this study which have dictated our approach to the problem are as follows
1The value of the fire protection measures is considered from the national economy point of view The Home Office Fire middotOepartment as a Central Government department is concerned with the effects of fire and fire protection on the national economy In this study the costs of providing fire protection and the direct and consequential fire losses are therefore measured in terms of the national economic effects These costs and losses and particularly the consequential losses may be quite different from the costs and losses experienced by the owners or occupiers of the buildings
While the primary objective has been to consider the national economic effects the problem has also been considered briefly from the point of view of the owners or occupiers of the buildings
2In this study the value of the fire protection measures has been assessed in quantitative terms It was not sufficent to conclude for example that sprlnklers are very valuable The study was deSigned to provide estimates of the value of each fire protection measure in monetary terms
3The study was intended to provide an overall picture of the value of fire protection In order co provide this overall picture the analysis has been done for broad classes of buildings industrial buildings as a single group separate sectors of industry storage buildings and shops Other occupancies including offices schools hospitals and places of
1
assembly (public houses restaurants etc) have also been considered but the results for these occupancies may be less accurate because of the scarcity of relevant data The results of this analysis are therefore only applicable to each occupancy as a group or to the typical buildings in the group There may be many individual buildings in which the circumstances are different from the typical or average case and for which the results of the study do not hold However the objective of the study is the provision of an overall picture and general conclusions rather than to attempt to produce a universal formula which is detailed and accurate enough to apply to any and every individual building
12 The measurement of the value of fire protection
The value of fire protection is measured by comparing the costs of providing the protection with the reduction in fire losses resulting from the additional protection Because the costs are mainly incurred in the initial year and the benefits accrue (in probability) in future years the costs and benefits must be compared using the standard accounting technique of Discounted Cash Flow
If the initial cost of installing fire protection is C and the annual maintenance costs are c per year then discounting at 10 per cent over 20 years the total discounted cost of providing fire protection is
C + 936c
The expected reduction in fire losses in any year is Reduction in fire lossesmiddot
Probability of fire x (Fire loss if a fire occurs in an unprotected building
Fire loss if a fire occurs in a protected building)
The total discounted future benefits are equal to 936 times the expected annual reduction in fire loss
If the discounted benefits are greater than the discounted costs then the provision of fire protection is considered cost-effective
~~ The approach to the problem
In order to estimate the value of fire protectionthe costs and benefits must be calculated for each occupancy group The separate items in this calculation are
-the cost of providing fire protection -the probability of a fire occurring -the average amount of fire damage which would result if a fire occurred in an unprotected building -the average amount of fire damage which would result
2
I
I
I
I
if a fire occurred in a protected building
This proble~ has been tackled as a statistical eKercise The separate elements of the problem have been estimated from the available fire data and where data were not available additional data have been COllected A very important part of our study has been a special survey of fires In the fire survey a total of 600 fires were examined by a forensic scientist who has specialised in fire investigations accompanied by a senior Fire Prevention Officer About 100 of the fires were visited soon after the fire occurred the fire scene was examined and the officer in charge at the fire and other witnesses were questioned In the remaining fires in which the circumstances were simpler the fire report was examined and additional questions were asked of the officer in charge at the fire
The fire survey not only provided information which could not have been Obtained otherwise but also gave a clearer understanding of fire data generally and thus enabled better use to be made of the other fire data
Initially a fairly elaborate method of analysis was planned in order to produce the most accurate results and to avoid any misinterpretation of the fire data In the event it turned out that there were insufficient detailed data to support the more sophisticated methods and more importantly it could be shown that the more complex methOds would not make any significant difference to the answers The final results were derived using Simpler methods but the experience of attempting to use more complex models has given us more confidence in the final results
The analysis of the value of sprinkler protection is described in Sections 2 and 3 the analysis for detectors in Sections 4 and 5 and the effect of increased structural fire resistance is described briefly in Section 6 The final conclusions are summarised in Section 7
3
I
2 THE VALUE OF SPRINKLERS- ANALYSIS
The estimation of e~ch of the items in the calcul~tion (liEtec in Section 13) c~n be regardec as a separate problem E~ch of the items is discussed briefly in this section and the results are illustrated using the example of an industrial building with a floor ~rea of 1500 sauare metres The full results for other occupancies and building sizes ~re given in the Appendix
2~1 The cost of a sprinkler systew
The cost of the sprinkler heads and the associated pipework will depend on the size of the building which is to be protected There will also be a fixed cost for each systew for the control valves alarms and the connection to the mains The estimated cost of installing a sprinkler system in a building of simple open construction ~nd involving no special haz~rd and no additional water supplies is pound(2000 + 198 x Size of building(sam)) The costs of other sprinkler systems are given in Table Al
The maintenance cost in future years is estimated to be about 1 per cent of the initial capital cost
22 The probability of a fire occurring
The probability of a fire occurring will vary with the occupancy and the size of the building The probability is estimated by relating the number of fires which occur in buildings of a given size and occupancy to the number of buildings of that size and occupancy at risk The probability of a fire in a large building is greater than in a swall building of the same occupancy but the risk of a fire does not increase in direct proportion to the building size The probability of a fire is of the form
Probability z aB where B is the floorspace of the building and a and c are the estiwated parameters for each occupancy
The estimated probability of a fire in an industrial building is given by
Probability z 00017B0middot3 which is eaual to a probability of 0082 in a 1500 square metre building or on average one fire every 12 years
Table A2 shows the probabilitity of a fire in other occupancies
~~3 The expected fire damage in an unprotected building
The average area of fire damage which would occur in an unprotected building was estimated from an analysis of the fires in buildings which did not have sprinklers or detectors The average area of fire damage is the average of many small fires
4
anc ltl f e ~ 9 E fires o nc the ave rage de pends on the size of the building middotsimply because large fires cannot occur in small buildings The average area of fire damage is estimated in the form
Fire size dBmiddot bullE
where B is the building floorspace and d and e are estimated parameters For industrial buildings tE~ estimated fire size is
Fire size 2 25 r E
and the average fire size in an unprotected building of 1500 souare metres is therefore 60 souare metres
The estimated areas of fire damage in buildings of other occupancies are given in Table A3
I 1~4 The expected fire damage in a building fitted with sprinklers
I
The expected fire da~age if a fire breaks out in a building in which sprinklers are installed has been estimated by considering four separate situations which might arise There may be insufficient heat to activate the sprinkler heads the sprinklers may not operate because the system has been turned off or because of a mechanical defect the sprinklers might operate and control or extinguish the fire or the fire may grow very large despite the operation of the sprinklers These separate outcomes are not of interest in their own right but subdividing the problem in this way provides more insight and produces a more reliable result
For an industrial building of 1500 sauare metres the probabilities of each outcome and the average area of fire damage in each case are
Sprinkler not activated 57 S sqm Sprinkler failure 09S 130 sOm Satisfactory operation 41 IS sOm Fire middotout of control 09S SOO sqm
The average damage if sprinklers are installed is therefore 0S7xS + 0009Sx130 + 04lxlS + O009SxSOO = 16 sqm
Predicted performance in other occupancies is shown in Table A4
2S The fire loss incurred
The relationship between fire losses and the area of fire damage has been investigated and it has been shown that the fire loss can be estimated simply by multiplying the area of fire damage by an average unit loss For industrial buildings the direct loss (to the national economy) is estimated to be pound140sqm of fire
I damage (The direct loss as estimated by insurance companies may be about IS per cent higher) Direct losses in other occupancies are shown in Table AS
A study of conseouential losses has shown that for manufacturing industry such losses are from the national economy point of
I 5
view equ~l to ~bout 60 of direct losses although the consequenti~l losses to the firm may be considerably greater
~6 The estimated value of sprinklers
For the example of ~n industrial building of 1500 square metres the initi~l capit~l cost of ~ sprinkler system would be pound5000 ~nd the total discounted cost of providing sprinkler protection including future m~intenance costs pound5500
If a fire occurred ~nd the building were not protected the ~verage area of fire damage would be 60 square metres involving ~ direct loss of 60x140-pound8400 and ~ total loss of pound8400xl6-pound13400 If the building were sprinklered the ~verage are~ of fire dam~ge would be 16 square metres involving a direct loss of pound2300 and ~ total loss of pound3700 The provision of sprinklers will therefore have reduced the expected fire dam~ge by 73
The probability of a fire per ye~r is 0082 and the expected reduction in fire losses per ye~r is therefore 0082x(pound13400-3700)- pound800 The total discounted benefit due to the reduced fire loss is thus pound7400 which exceeds the (discounted) cost of providing the sprinklers The provision of sprinkler protection in these buildings is therefore cost-effective from the n~tional economy point of view
The v~lue of sprinklers can be calcul~ted in this way for buildings of other occupancies ~nd other sizes
6
I
3 THE VALUE OF SPRINKLERS - RESULTS
31 The value of sprinklers to the national economy
The value of sprinkler protection calculated from the national economy point of view has been estimated for buildings of different occupancies and different sizes and the results are summarised in a graohical form in Figure 1 Figure 1 shows the Net Present Value of sprinkler protection (the discounted benefits minus the discounted costs) in different occupancies Where the Net Present Value is greater than zero sprinkler protection can be said to be cost-effective
The results show that for the overall industrial group of buildings sprinklers are cost-effective in buildings larger than
I 800 sauare metres When the different sectors of industry are considered separately the minimum building size above which sprinklers are of value is between 300 and 1000 square metres for most of the industries The separate industries in which sprinklers appear to show the greatest economic value are Other Manufacturing (which includes rubber and plastic products) Chemicals Food Timber and Electrical Engineering It is estimated that sprinklers would be cost-effective in about 50 per cent of the buildings in manufacturing industry and these buildings account for about 90 oer cent of the total floorspace in manufacturing industry
Sprinklers also aopear to be of value in the larger shops Snrinklers do not aopear to be of value (at least when only property protection is considered) in hospitals offices schools and pubs and restaurants
I
One perhaps surprising result is that sprinklers do not appear to be cost-effective in storage buildings Although the fires in storage buildings are large on average and sprinklers are very effective in reducing this fire damage the probability of a fire occurrinq is low and the expected reduction in fire damage is therefore not sufficient to - offset the cost of providing sorinklers This result far all storage buildings considered as
I a single group hides the fact that the circumstances in
I different tyPes of storage buildings can be very different If the storage group is subdivided it can be shown that sprinklers will be of net value in high risk high value storage buildings
Although the results of this analysis show that sprinklers are cost-effective in larger hotels there is reason to suspect that because of the inadeQuacy of the data used in the analysis these results overestimate the value of sprinklers in reducing property damage in hotels
7 I
32 The present provision of sprinklers
The present provision of sprinkler protection in manufacturing industr y has been estimated by a survey of manufacturing industry The survey results show that 13 per cent of buildings have complete sprinkler protection anc a further 4 per cent have partial ~prinkler protection Sprinklers tend to be installed in the larger buildings and it is estimated that a total of about 3S per cent of the floorspace in manufacturing industry is protected by sprinklers
No estimates of the extent occupancies are available
of sprinkler protection in other
33 The value of sprinklers to the firm
The value of sprinklers briefly in this study
to the firm has only been considered
Firms may install fire protection because of their awareness of the risks of fire and their wish to reduce these risks or they may install protection mainly in order to secure more advantageous terms for fire insurance Estimates have been made of the financial incentives to the firm to install fire protection
Insurance companies offer premium discounts of between 60 per cent and 90 per cent for approved sprinkler systems By making some assumptions to compensate for the lack of detailed information about insurance rates it is possible to estimate the value to the firm of installing sprinklers in buildings of different sizes
The estimates of the value to the firm of providing sprinklers in industrial buildings show that the value to the firm is broadly similar to the value to the economy ie where sprinklers are of value to the economy there is a financial incentive to the firm to install this protection In development areas where capital grants are available to firms who install sprinklers the financial incentives to install sprinklers are much greater
8
4 THP VALUP ~p DETECTOPS - ANALYSIS
41 The cost of detectors
Jt is estim8ted that the cost of installing either heat or smoke detectors in 8 building of simple open construction is 8poroximately pound11 per square metre of floorspace In 8ddition there will be 8 cost of 8bout pound1500 for the control equipment If 8 direct line system is inst8lled there will 8lso be a connection ch8rge The initi8l costs 8nd the future m8intenance 8nd line rent81 ch8rges for local 8l8rm and direct line systems 8re given in Table Al
~ 2 The estimated reduction in fire d8m8ge
I
I Detectors reduce fire d8m8ge by giving e8rly w8rning of 8 fire 8nd thus 8llowing people to intervene e8rlier The effectiveness of detectors depends on where people 8re 8t the time the fire occurs how r8pidly the fire is growing how people respond when they hear the 8l8rm 8nd how cap8ble people 8re of de8ling with the fire when they first 8rrive on the scene The effectiveness of detectors is therefore much more difficult to predict
The b8sic f8ctors which determine the effect of detectors in reducing fire d8m8ge C8nnot be deduced from the main fire st8tistics and we h8ve therefore had to rely very he8vily in this p8rt of the 8n81ysis on the inform8tion derived in our own fire survey For e8ch of the fires eX8mined in our survey 8n 8ssessment W8S m8de of the 8mount of fire d8m8ge which might h8ve occurred if detectors h8d been inst8lled This 8ssessment W8S m8de in the light of the 8ctu81 circumst8nces of e8ch fire 8nd
I particu18rly the estim8ted r8te of development of the fire in its e8rly st8ges 8nd the 8ssumed 8bility of the people in the vicinity to respond to the 818rm 8nd deal with the fire
I This 8ssessment of the d8m8ge which might h8ve occurred together with the record of the fire d8m8ge which 8Ctu8l1y occurred could be used directly to estim8te the possible reduction in fire d8m8ge due to detectors However in order to widen the b8sis of the estim8te 8n 8ttempt h8S been made to gener8lise the survey results by reference to the complete s8mple of fires for which a K433SAF2 fire report W8S 8vai18ble The K433SAF2 fire reports include 8 record of the 10c8tion of the ne8rest person 8t the time of the fire The possible reduction in fire d8m8ge C8n be estim8ted 8S 8 function of the C8use of the fire b8sed on the det8iled experience of the fire survey
The estimation of the reduction in fire dam8ge from the b8sic fire st8tistics is not entirely s8tisf8ctory 8S it depends on 8 v8riety of 8ssumptions some of which 8re difficult to justify Nevertheless the gener8l 8nalysis h8S been used in this study bec8use even though it m8Y not provide 8n independent estimate it does provide 8 better underst8nding of the estim8te of the
9
I
I
I effectiveness of detectors
For the example of an industrial building of area 1500 square metres the estimated effect of direct line detectors is as follows
Proportion Damage Estimated of fires if unprotected reduction
Person in room 55 40 sqm 0 Person in bldg 18 50 sqm 65-85 Person not in 27 105 sqm 65-85 building All fires 100 60 sqm 40-55
The estimation of the reduction in damage due to direct line and local alarm detectors in buildings of different occupancies is shown in Table A6 This Table shows the estimates produced through the general analysis as well as the average assessed reduction in the fire survey The generalised estimates cover a range of values reflecting the degree of uncertainty in the estimation procedure and are generally lower than the survey estimates reflecting the cautionary nature of the generalised analysis
43 The calculation of the value of detectors
Taking the example of a 1500 square metre industrial building again the initial cost of a direct line detector system is about pound3400 and the future annual running costs are pound280 (see Table Al) The total discounted costs are thus pound6000
The average 1055 per fire in an unprotected building would be pound13400 (from Tables A2 and A3 and including consequential losses of 60 per cent) If the fire damage is reduced by 40 per cent by the installation of automatic fire detection (Table A6) then the expected annual benefits would be 0082x13400xO4-pound440 The discounted value of the total future benefits is then pound4100 In this case the cost of providing direct line detectors is greater than the expected benefits and from the national economy point of view the provision of detectors in these buildings is not cos t-effecti ve
10
5 THE VALUE OF DETECTORS - RESULTS
51 The value of detectors to the national economy
I The value of automatic fire detection calculated from the national economy point of view has been estimated for buildings of different sizes and different occupancies The results for
I direct line alarm systems are summarised in Figure 2 and the results for local alarm systems in Figure 3
In these Figures a range of values are shown for industrial buildings This range reflects the alternative range of estimates of the reduction in fire damage Only a single estimate of the economic value of detectors is shown for other occupancies in order to simplify the graphs The single line shown for the other occupancies is the mid-point of the range of values
In industrial buildings larger than about 2000 square metres (22 per cent of the buildings in manufacturing industry exceed this size) direct line detectors appear to be of economic value Somewhat surprisingly detection systems with local alarms appear to be of equal or greater economic value than systems with direct line alarms This result reflects the experience of the fire survey in which it was judged that in many cases a local alarm would have brought people to the fire promptly and that these people would have been able to extinguish or at least to contain the fire Although direct line systems can achieve a greater reduction in fire damage this additional benefit does not offset the higher cost of providing the direct line system
The only other occupancy in which detectors appear to be of economic value is shops and here it is the direct line systems which show the greater benefit
I 52 The present provision of automatic fire detection
The results of the survey of manufacturing industry show that detectors are installed in abou t 5 per cent of buildings covering a total of about 13 per cent of the total floorspace
The industr ies with the proportionately highest degree of automatic fire detection are Electrical Engineering and Chemicals
53 The value of detectors to the firm
Insurance companies offer discounts of up to 125 per cent for the installation of approved detector systems Because of the way in which premiums are calculated this is equivalent to a discount of up to about 20 per cent on the premium payable
Our estimates of the value to the firm of installing detectors
11
I
I I
suggest that even in the largest industrial buildings the costs of providing a detector system will exceed the benefits of the reduction in premiums (Although there may of course be individual cases where this generalisation development areas where government grants are for capital investment there may be a small to firms to install detectors in larger build
is not payable
financial ings
true) In to firms incentive
54 The reliability of detectors
Studies of the reliability of the present direct line fire detection systems have shown that for every genuine alarm signalled by the system there are more than 10 false and accidental alarms A false alarm rate as high as this could cause serious problems for fire brigades if there was widespread use of direct line detector systems However the technology is changing rapidly in this area and the reliability of automatic fire detection systems may improve in the future
12
I 6 THE EfFECT Of IMPROVED STRUCTURAL fIRE RESISTANCE
The effect of improved fire resistance in the internal structure of buildings can only be estimated from the information obtained in the examination of buildings in the fire survey At each building visited in the survey an assessment was aade of the amount of fire damage which might have occurred if all the internal surfaces (walls doors ceilings etc) had a minimum of 30 minutes fire resistance
I
Improved fire resistance would have reduced the amount of fire damage in some of the fires which spread beyond the room of origin The survey assessments take into account the fact that in some of the larger fires improved fire resistance would have had no effect because for example doors were left open or because the fire was so severe and had burned for so long that even the more resistant compartment wallS would have been penetrated
No estimate was made of the cost of bringing the structure up to the higher standard although it was clear that the cost would be substantial in many cases
In the survey it was estimated that increased structural fire resistance would have reduced the average amount of fire damageI by 45 per cent in industrial buildings 50 per cent in storage buildings and 55 per cent in shops
I
I
13
I I
7 CO~ CLUSI ONS
Before presenting any conclusions the limitations of the study should first be reiterated Firstly only the protection of property has been considered in this study and not the protection of life Secondly only complete sprinkler systems complete detector systems and complete upgrading of the internal structural fire resistance have been considered The value of partial fire protection systems (protecting only the most valuable parts of the building or the highest risks) or mixec systems (part sprinklers and part detectors) or other forms of fire protection (venting CO 2 flooding etc) have not been considered Thirdly a broad view of the problem has been taken ana results have been derived only for the major occupancy grcups There may well be many special cases or individual buildings for which the general results are not valid
The objective of this study was to derive an overall picture of the value of fire protection measures from the national economy point of view This overall picture is presented in Figures 1-3 The main findings of the study are as follows
1 Sprinklers are very effective in reducing fire damage and the reduction in dam~e is estimated to be 70-90 per cent in buildings of different sizes and occupancies When the cost of providing sprinklers is compared with the saving in fire losses the results of this study indicate that sprinklers are cost-effective in the medium and large industrial buildings in large shops and in high value high risk storage buildings
2 From the firms point of view there is a strong incentive to install sprinklers in order to benefit from the premium reductions offered by insurance companies However far fewer firms have actually taken advantage of these incentives than would benefit from doing so The question arises of why firms have been reluctant to take advantage of these financial incentives
3 It is estimated that automatic fire detection can reduce fire damage by about 50 per cent on average in industrial buildings and even more in other occupancies When these savings in fire losses are compared with the cost of providing detectors it appears that automatic fire detection is of economic value in the larger industrial buildings and the largest shops However if the present high false alarm rate is not improved wider use of direct line detectors might cause serious problems for fire brigades
It should be noted that the Fire Offices Committee representing fire insurers generally have reported that their own estimates of the reduction in fire damage effected by detectors is well below the figure quoted here Although the figures provided by FOC have not been supported by any detailed analysis they are
14
I bull
I nevertheless based on many years experience of underwriting fire risks Only further detailed study could resolve which of the two estimates is closer to the true value although the Home Office has no plans for such work to be carried out
4 From the firms point of view there is relatively little financial incentive to install detectors
5 It is estimated that improved structural fire resistance might reduce fire losses by about 50 per cent No estimate has been made of the cost of these structural improvements
I
I
I I
I I I
15
I
Figure 1 THE VALUE OF SPRINKLERS IN DIFFERENT OCCUPANCIES
8000
7000
6000
5000
4000
Cl) l iii 3000 gt c Cl) III Cl) a 2000 Cl)
Z
1000
o ~____L--+~____-L~__~____-L____~____~__~
- 1000
- 2000
Building size (m2)
Storage
Pubs Restaurants etc (7)
- 4000
16
-3000
I
I Figure 2 THE VALUE OF DIRECT LINE DETECTORS IN
I 7000
6000
5000
I 4000
Il l iii gt 3000 c Il ~ QI li 2000 z
I 1000
I 0
-1000
I -2000
-3000
- 4000
DIFFERENT OCCUPANCIES
Shops
75 Reduction
Storage 70 Reduction
Pubs etc
60~
SChoolS 70 Reduction~ Offices 55 Reduction
V
17
I
Figure 3 THE VALUE OF LOCAL ALARM DETECTORS IN DIFFERENT OCCUPANCIES
8000 r
7000
6000
5000
4000
Q)
J
~ 3000 c Q) Vl Q) -Cl 2000 Q)
Z
1000
o
- 1000
-2000
- 3000
-4000
50 Reduction
Shops 35 Reduction
Storage 50 Reduction
18
I
I I
APPEtWIX A
TABLES OF THE MAIN NUMERICAL RESULTS
I
I I I I I
19
I I
I
I I
I
I I I I I
I I
I I
TABLE A1 THE COST OF FIRE PROTECTION (1977 PRICES)
SPRINKLER SYSTEMS- in buildings of simple open construction not requiring pumps or additional water supplies
Initial cost
I Extra low hazard pound2000 + 083 x size of bUilding(m~) Ordinary hazard pound2000 + 198 x size of building(m )2Extra high hazard pound2000 + 267 x size of building(m )
Annual maintenance cost
Approximately 1 of initial cost
I I
AUTOMATIC DETECTION- in buildings of simple open construction
1nitial cost
Local alarm system pound1500 + 11 x size of bUilding(m~)
I Di rect line system pound1750 + 11 x size of building(m )
Annual maintenance and line rental costs
Local alarm system pound50 + 0025 x size of building(m~) Direct line system pound240 + 0025 x size of building(m )
I
I I I
20
I
TABLE A2 THE PROBABILITY OF A FI R OCC URRIlFu
OCCUPANCY (SIC ORDER)
1----------------------INDUSTRIAL BUILDINGS
PROBABILITY OF FIRE PER YEAR a BC PROBABILQY OF FIRE
IN 15OOm BUILDING
a -4-------
c
~------~------------~
Food drink and tobacco (Ill)
00011 OGc 0086
Chemicals and allied (V) 00069 046 021
bull Mechanical engineering (VII)
000011 075 0027
Electrical engineering (IX)
000061 059 0046
Vehicles (XI) 000012 086 0062
bull Metal goods not elseshyvhere specified (XII)
000158 054 0082
Textiles (XIII) 00075 055 0097
Timber furniture (XVII) 000057 077 010
Paper printing and publishing (XVIII)
0000069 0054
Other manufacturing (XIX)
00084 041 017
All manufacturing industry (Ill-XIX)
arHER OCCUPANCIES
00017 055 0082
Storage 000067 05 0026
Shops 0000066 10 0099
Offices 0000059 09 0043
Hotels etc 000008 10 012
Hospi tals etc 00007 075 017
bullbull Pubs restaurants etc (10) (01 )
Schools 00002 075 0048
Note Some of the fires vhich should be included in the Mechanical engineering sector may have been classified as Metal goods nes This vould result in an underestimate of the probability of fire for Mechanical engineering and an overestimate for Metal goods If the tvo groups are combined the estimated probabili ty of fire is 000086 1356 bull
middotValues for Assembly are assumed There vas insufficient information available to estimate the probability of fire in this occupancy group
21
I
TABLE A3 THE ESTIMATED FIRE DAMAGE IF ONLY THE MINIMUM LEVEL OF IRE PROTECTION IS PROVIDED
I I
I I I
I I
I I
OCCUPANCY (SIC O~vER) AVERAGE FIRE SIZE AS A rUNCTION OF BUILDING SIZE(m 2 )
SAMPLE SIZE
AVERAGE FIRE SIZE IN A B I~ NG 0 15(XluhlOORSPACE
INDUSTRIAL BUILDINGS
All industry 6496 60
Food drink amp tobacco (Ill)
313 73
Chemicals ampallied (V) 516 28
Mechanical engineering (VII )
248 44
Electrical engineering (IX )
174 64
Vehicles (XI) 080 g58 181
Metal goods not elseshywhere specified (XII)
64 jj23 561
Textiles (XIII ) 2 6 ~)9 399 45
Timber furniture (XVII ) 4 B21
2 2 393 112
Paper printing amp pUblishing (XVIII)
6 7 ~)6 198 93
Other manufacturing (XIX)
OTHER OCCUPANCIES
87 38
B 228 140
Storage 1398 157
Shops 50
095 B 2662 37
Offices 622 15
Hotels etc 22
B 973 27
Hospitals 20
936 5
Pubs restaurants etc 76 B 2908 33
Schools etc 28 57
B 906 42
22 I
~ABLE M IBE A VElUGE llE4 01 lIRE DAlIAGE IF SPRIIiKLERS ARE IIISTALLD
fRlfKirpi ~~ SPRlI)(L OPJAA[D ampPRIf~ I YtS SPF ~KIrnS rAI ur
~crIV JL SAl ]St AtTOR] U middotCOIIL er CO~i OCCUPIlCy (SIC CiWUl )
Aydllolteerll ~)PrYpn Prepn ~ dANr(~ ) PTopn h~(2) hdt(~ )Pr0in
It i middot~ITfd AL 31JlllNG
All induetr-J 13 p~ 8022I lt3 022x bullI(~955bull 3middot57 5 gt~ -66
a78Bmiddot~food dr~ toouCO ampJ OZb 2 0101 1 Illlt68bull bull (Ill ) -67
Bmiddot 1202h O 60 2 9t2looChellicil15 ampl11 02gt29~ 89 (V) -30
029 l 76rechmiddotnica elaquo1necriTf -2 961bullbull 580258 gtOOx~ (nl) -cn
B 7EhctriClll lr1n~r1Damp 1 02x~ )09 5 (96Bbullbull 5~ 01z53 (Il ) -ltgt69
tb1c1u (Xl) 87 62 E gtDUx 966x 3 9 01 3 -67
IMete roods cot l6Ishy gt 022z5C 6968 bull bull 58 0lx58 S3 0 bull 2l otltrtl ~lcihd (XlI) -072
uUl (XlII ) 2lt0Ux47 Efu-47 016bullbull475~I gt~55 middot-79I
t1~lgteT bull lUT~j tlJt (Xll) 0Z2z602 ~ S 96360 01bullbull 60 gt - B )6hpn Prictinf 022x60 9562060 019x6O B2 5publiahinl (nUl) -ltgt
B 02b )0Oth~r canufampetnr1n~ 70 290 06lO IV95x~ 30 (nxl -9
OHlI OCCtIPAN Ci rs 11 5lpoundtorace 0Z2z1(2 4bgt 9282076 050lt7pound (6
~O6
pound1ope 2 B 00022J 4555 Oh49sBx1t5 B2
(Off1e ) ( ) ( () )275 ( ( )) ( )) (
1WItela ~tc ( ( )) ( )106 ) ( -19 middot( )( ) ( ) )(
( ) ( ) ( ) ( ) )H04fIitala tc ( ( )) ( ()9
( 09 2 ) ( 0222o5~) 2 I(72oi (Q052oi gt5( ( )Pub_ atamplltampJl ete ) ( )) (9 middot ( ) ( ) ( ) )~19 ( ( ) ( ) ( ( )I
Sehoola ate ( ) ( ) ( ( )5middot5 bull )1 I ( ( )) 19 ( ) ( )
TABLE A5 THE AVERAGE DIRECT LOSS PER UNIT AREA OF FIRE DAMAGE
I I
I
I I
OCCUPANCY (SIC ORDER ) UNIT LOSS (poundsqm )
INDUSTRIAL BUILDINGS
All industry 140
Food drink amp tobacco ltrII)
Chemicals amp allied (V)
270
Mechanical engineering ( VII )
290
Electrical engineering (IX )
320
Vehicles (xI) 150
Metal goods not elseshywhere specified (XII)
240
Textiles (XIII) 210
Timber furniture (XVII) 130
Paper printing amp publishing (XVIII )
90
Other manufacturing (XIX )
OTHER OCCUPANCIES
120
Storage 120
Shops 160
Offices 150
Hotels etc 130
Hospitals etc 160
Pubs restaurants etc 100
Schools 110
24 I I
I TABLE J~ THE ESTIMATED REDUCTION IN FIRE DAMAGE DUE TO DETECTORS - ALL FIRES
Reduction in fire damage
Occupancy Survey
sample size lIith direct line alarm lIith local alarm
Estimated from Estimated Eetilllllted from Eetimated K433SAF2 in Survey K433SAF2 in Survey
Industry 210 -(40~55) -55 -(35-50) -50
Storage 30 -( 60-70) -80 - (45 55) -60
Shops 50 -( 65-75) -85 -(35-40) -4OJ~
Offices 17 -(55r~70) -45 not estimated -40
Hotels 12 -(55-65) -85 not estimated -85
Pubs restaurants 36 -(60-75) -55 not estimated -40
Schools 26 -(55-70) -90 not estimated -85
25
I
I I
I I
I I I I
I
I
I
I

I
I
LIST OF FIGURES PAGE
I I Figure l The value of sprinklers in different occupancies 16
Figure 2 The value of direct line detectors in different occupancies 17
Fig ure 3 The val ue of local alarm detectors in different occupancies 18
APPENDIX - MAIN RESULTS OF THE STUDY
I
Table AI The cost of fire protection 20 Table A2 The probability of a fire occurring 21 Table 03 The estimated fire damage if only the minimum level
of fire protection is provided 22 Table M The average area of fire damage if sprinklers
are installed 23I Table AS The average direct loss per unit area of fire damage 24 Table 06 The es tima ted reduction in fire damage
due to detectors 25
I
I
I
I
I
I I
1 INTRODUCTION
The Home Office Fire Department is currently undertaking a wide-ranging review of fire and fire protection and the study reported here is one of this series of this particular study is
-to assess the value of sprinkdetection and structural fire refire losses in buildings
studies The objective
lers automatic fire sistance in reducing
of
Only the protection of property protection of life is the subject of
is a
considered here The separate study
This report contains a summary account of the study and includes an outline of the method of analysis as well as the main conclusions The main numerical results are included in the Appendix A full technical account of the study is given in Report l678The Value of Fire Protection in Buildings
11 The requirements of the study
The particular requirements of this study which have dictated our approach to the problem are as follows
1The value of the fire protection measures is considered from the national economy point of view The Home Office Fire middotOepartment as a Central Government department is concerned with the effects of fire and fire protection on the national economy In this study the costs of providing fire protection and the direct and consequential fire losses are therefore measured in terms of the national economic effects These costs and losses and particularly the consequential losses may be quite different from the costs and losses experienced by the owners or occupiers of the buildings
While the primary objective has been to consider the national economic effects the problem has also been considered briefly from the point of view of the owners or occupiers of the buildings
2In this study the value of the fire protection measures has been assessed in quantitative terms It was not sufficent to conclude for example that sprlnklers are very valuable The study was deSigned to provide estimates of the value of each fire protection measure in monetary terms
3The study was intended to provide an overall picture of the value of fire protection In order co provide this overall picture the analysis has been done for broad classes of buildings industrial buildings as a single group separate sectors of industry storage buildings and shops Other occupancies including offices schools hospitals and places of
1
assembly (public houses restaurants etc) have also been considered but the results for these occupancies may be less accurate because of the scarcity of relevant data The results of this analysis are therefore only applicable to each occupancy as a group or to the typical buildings in the group There may be many individual buildings in which the circumstances are different from the typical or average case and for which the results of the study do not hold However the objective of the study is the provision of an overall picture and general conclusions rather than to attempt to produce a universal formula which is detailed and accurate enough to apply to any and every individual building
12 The measurement of the value of fire protection
The value of fire protection is measured by comparing the costs of providing the protection with the reduction in fire losses resulting from the additional protection Because the costs are mainly incurred in the initial year and the benefits accrue (in probability) in future years the costs and benefits must be compared using the standard accounting technique of Discounted Cash Flow
If the initial cost of installing fire protection is C and the annual maintenance costs are c per year then discounting at 10 per cent over 20 years the total discounted cost of providing fire protection is
C + 936c
The expected reduction in fire losses in any year is Reduction in fire lossesmiddot
Probability of fire x (Fire loss if a fire occurs in an unprotected building
Fire loss if a fire occurs in a protected building)
The total discounted future benefits are equal to 936 times the expected annual reduction in fire loss
If the discounted benefits are greater than the discounted costs then the provision of fire protection is considered cost-effective
~~ The approach to the problem
In order to estimate the value of fire protectionthe costs and benefits must be calculated for each occupancy group The separate items in this calculation are
-the cost of providing fire protection -the probability of a fire occurring -the average amount of fire damage which would result if a fire occurred in an unprotected building -the average amount of fire damage which would result
2
I
I
I
I
if a fire occurred in a protected building
This proble~ has been tackled as a statistical eKercise The separate elements of the problem have been estimated from the available fire data and where data were not available additional data have been COllected A very important part of our study has been a special survey of fires In the fire survey a total of 600 fires were examined by a forensic scientist who has specialised in fire investigations accompanied by a senior Fire Prevention Officer About 100 of the fires were visited soon after the fire occurred the fire scene was examined and the officer in charge at the fire and other witnesses were questioned In the remaining fires in which the circumstances were simpler the fire report was examined and additional questions were asked of the officer in charge at the fire
The fire survey not only provided information which could not have been Obtained otherwise but also gave a clearer understanding of fire data generally and thus enabled better use to be made of the other fire data
Initially a fairly elaborate method of analysis was planned in order to produce the most accurate results and to avoid any misinterpretation of the fire data In the event it turned out that there were insufficient detailed data to support the more sophisticated methods and more importantly it could be shown that the more complex methOds would not make any significant difference to the answers The final results were derived using Simpler methods but the experience of attempting to use more complex models has given us more confidence in the final results
The analysis of the value of sprinkler protection is described in Sections 2 and 3 the analysis for detectors in Sections 4 and 5 and the effect of increased structural fire resistance is described briefly in Section 6 The final conclusions are summarised in Section 7
3
I
2 THE VALUE OF SPRINKLERS- ANALYSIS
The estimation of e~ch of the items in the calcul~tion (liEtec in Section 13) c~n be regardec as a separate problem E~ch of the items is discussed briefly in this section and the results are illustrated using the example of an industrial building with a floor ~rea of 1500 sauare metres The full results for other occupancies and building sizes ~re given in the Appendix
2~1 The cost of a sprinkler systew
The cost of the sprinkler heads and the associated pipework will depend on the size of the building which is to be protected There will also be a fixed cost for each systew for the control valves alarms and the connection to the mains The estimated cost of installing a sprinkler system in a building of simple open construction ~nd involving no special haz~rd and no additional water supplies is pound(2000 + 198 x Size of building(sam)) The costs of other sprinkler systems are given in Table Al
The maintenance cost in future years is estimated to be about 1 per cent of the initial capital cost
22 The probability of a fire occurring
The probability of a fire occurring will vary with the occupancy and the size of the building The probability is estimated by relating the number of fires which occur in buildings of a given size and occupancy to the number of buildings of that size and occupancy at risk The probability of a fire in a large building is greater than in a swall building of the same occupancy but the risk of a fire does not increase in direct proportion to the building size The probability of a fire is of the form
Probability z aB where B is the floorspace of the building and a and c are the estiwated parameters for each occupancy
The estimated probability of a fire in an industrial building is given by
Probability z 00017B0middot3 which is eaual to a probability of 0082 in a 1500 square metre building or on average one fire every 12 years
Table A2 shows the probabilitity of a fire in other occupancies
~~3 The expected fire damage in an unprotected building
The average area of fire damage which would occur in an unprotected building was estimated from an analysis of the fires in buildings which did not have sprinklers or detectors The average area of fire damage is the average of many small fires
4
anc ltl f e ~ 9 E fires o nc the ave rage de pends on the size of the building middotsimply because large fires cannot occur in small buildings The average area of fire damage is estimated in the form
Fire size dBmiddot bullE
where B is the building floorspace and d and e are estimated parameters For industrial buildings tE~ estimated fire size is
Fire size 2 25 r E
and the average fire size in an unprotected building of 1500 souare metres is therefore 60 souare metres
The estimated areas of fire damage in buildings of other occupancies are given in Table A3
I 1~4 The expected fire damage in a building fitted with sprinklers
I
The expected fire da~age if a fire breaks out in a building in which sprinklers are installed has been estimated by considering four separate situations which might arise There may be insufficient heat to activate the sprinkler heads the sprinklers may not operate because the system has been turned off or because of a mechanical defect the sprinklers might operate and control or extinguish the fire or the fire may grow very large despite the operation of the sprinklers These separate outcomes are not of interest in their own right but subdividing the problem in this way provides more insight and produces a more reliable result
For an industrial building of 1500 sauare metres the probabilities of each outcome and the average area of fire damage in each case are
Sprinkler not activated 57 S sqm Sprinkler failure 09S 130 sOm Satisfactory operation 41 IS sOm Fire middotout of control 09S SOO sqm
The average damage if sprinklers are installed is therefore 0S7xS + 0009Sx130 + 04lxlS + O009SxSOO = 16 sqm
Predicted performance in other occupancies is shown in Table A4
2S The fire loss incurred
The relationship between fire losses and the area of fire damage has been investigated and it has been shown that the fire loss can be estimated simply by multiplying the area of fire damage by an average unit loss For industrial buildings the direct loss (to the national economy) is estimated to be pound140sqm of fire
I damage (The direct loss as estimated by insurance companies may be about IS per cent higher) Direct losses in other occupancies are shown in Table AS
A study of conseouential losses has shown that for manufacturing industry such losses are from the national economy point of
I 5
view equ~l to ~bout 60 of direct losses although the consequenti~l losses to the firm may be considerably greater
~6 The estimated value of sprinklers
For the example of ~n industrial building of 1500 square metres the initi~l capit~l cost of ~ sprinkler system would be pound5000 ~nd the total discounted cost of providing sprinkler protection including future m~intenance costs pound5500
If a fire occurred ~nd the building were not protected the ~verage area of fire damage would be 60 square metres involving ~ direct loss of 60x140-pound8400 and ~ total loss of pound8400xl6-pound13400 If the building were sprinklered the ~verage are~ of fire dam~ge would be 16 square metres involving a direct loss of pound2300 and ~ total loss of pound3700 The provision of sprinklers will therefore have reduced the expected fire dam~ge by 73
The probability of a fire per ye~r is 0082 and the expected reduction in fire losses per ye~r is therefore 0082x(pound13400-3700)- pound800 The total discounted benefit due to the reduced fire loss is thus pound7400 which exceeds the (discounted) cost of providing the sprinklers The provision of sprinkler protection in these buildings is therefore cost-effective from the n~tional economy point of view
The v~lue of sprinklers can be calcul~ted in this way for buildings of other occupancies ~nd other sizes
6
I
3 THE VALUE OF SPRINKLERS - RESULTS
31 The value of sprinklers to the national economy
The value of sprinkler protection calculated from the national economy point of view has been estimated for buildings of different occupancies and different sizes and the results are summarised in a graohical form in Figure 1 Figure 1 shows the Net Present Value of sprinkler protection (the discounted benefits minus the discounted costs) in different occupancies Where the Net Present Value is greater than zero sprinkler protection can be said to be cost-effective
The results show that for the overall industrial group of buildings sprinklers are cost-effective in buildings larger than
I 800 sauare metres When the different sectors of industry are considered separately the minimum building size above which sprinklers are of value is between 300 and 1000 square metres for most of the industries The separate industries in which sprinklers appear to show the greatest economic value are Other Manufacturing (which includes rubber and plastic products) Chemicals Food Timber and Electrical Engineering It is estimated that sprinklers would be cost-effective in about 50 per cent of the buildings in manufacturing industry and these buildings account for about 90 oer cent of the total floorspace in manufacturing industry
Sprinklers also aopear to be of value in the larger shops Snrinklers do not aopear to be of value (at least when only property protection is considered) in hospitals offices schools and pubs and restaurants
I
One perhaps surprising result is that sprinklers do not appear to be cost-effective in storage buildings Although the fires in storage buildings are large on average and sprinklers are very effective in reducing this fire damage the probability of a fire occurrinq is low and the expected reduction in fire damage is therefore not sufficient to - offset the cost of providing sorinklers This result far all storage buildings considered as
I a single group hides the fact that the circumstances in
I different tyPes of storage buildings can be very different If the storage group is subdivided it can be shown that sprinklers will be of net value in high risk high value storage buildings
Although the results of this analysis show that sprinklers are cost-effective in larger hotels there is reason to suspect that because of the inadeQuacy of the data used in the analysis these results overestimate the value of sprinklers in reducing property damage in hotels
7 I
32 The present provision of sprinklers
The present provision of sprinkler protection in manufacturing industr y has been estimated by a survey of manufacturing industry The survey results show that 13 per cent of buildings have complete sprinkler protection anc a further 4 per cent have partial ~prinkler protection Sprinklers tend to be installed in the larger buildings and it is estimated that a total of about 3S per cent of the floorspace in manufacturing industry is protected by sprinklers
No estimates of the extent occupancies are available
of sprinkler protection in other
33 The value of sprinklers to the firm
The value of sprinklers briefly in this study
to the firm has only been considered
Firms may install fire protection because of their awareness of the risks of fire and their wish to reduce these risks or they may install protection mainly in order to secure more advantageous terms for fire insurance Estimates have been made of the financial incentives to the firm to install fire protection
Insurance companies offer premium discounts of between 60 per cent and 90 per cent for approved sprinkler systems By making some assumptions to compensate for the lack of detailed information about insurance rates it is possible to estimate the value to the firm of installing sprinklers in buildings of different sizes
The estimates of the value to the firm of providing sprinklers in industrial buildings show that the value to the firm is broadly similar to the value to the economy ie where sprinklers are of value to the economy there is a financial incentive to the firm to install this protection In development areas where capital grants are available to firms who install sprinklers the financial incentives to install sprinklers are much greater
8
4 THP VALUP ~p DETECTOPS - ANALYSIS
41 The cost of detectors
Jt is estim8ted that the cost of installing either heat or smoke detectors in 8 building of simple open construction is 8poroximately pound11 per square metre of floorspace In 8ddition there will be 8 cost of 8bout pound1500 for the control equipment If 8 direct line system is inst8lled there will 8lso be a connection ch8rge The initi8l costs 8nd the future m8intenance 8nd line rent81 ch8rges for local 8l8rm and direct line systems 8re given in Table Al
~ 2 The estimated reduction in fire d8m8ge
I
I Detectors reduce fire d8m8ge by giving e8rly w8rning of 8 fire 8nd thus 8llowing people to intervene e8rlier The effectiveness of detectors depends on where people 8re 8t the time the fire occurs how r8pidly the fire is growing how people respond when they hear the 8l8rm 8nd how cap8ble people 8re of de8ling with the fire when they first 8rrive on the scene The effectiveness of detectors is therefore much more difficult to predict
The b8sic f8ctors which determine the effect of detectors in reducing fire d8m8ge C8nnot be deduced from the main fire st8tistics and we h8ve therefore had to rely very he8vily in this p8rt of the 8n81ysis on the inform8tion derived in our own fire survey For e8ch of the fires eX8mined in our survey 8n 8ssessment W8S m8de of the 8mount of fire d8m8ge which might h8ve occurred if detectors h8d been inst8lled This 8ssessment W8S m8de in the light of the 8ctu81 circumst8nces of e8ch fire 8nd
I particu18rly the estim8ted r8te of development of the fire in its e8rly st8ges 8nd the 8ssumed 8bility of the people in the vicinity to respond to the 818rm 8nd deal with the fire
I This 8ssessment of the d8m8ge which might h8ve occurred together with the record of the fire d8m8ge which 8Ctu8l1y occurred could be used directly to estim8te the possible reduction in fire d8m8ge due to detectors However in order to widen the b8sis of the estim8te 8n 8ttempt h8S been made to gener8lise the survey results by reference to the complete s8mple of fires for which a K433SAF2 fire report W8S 8vai18ble The K433SAF2 fire reports include 8 record of the 10c8tion of the ne8rest person 8t the time of the fire The possible reduction in fire d8m8ge C8n be estim8ted 8S 8 function of the C8use of the fire b8sed on the det8iled experience of the fire survey
The estimation of the reduction in fire dam8ge from the b8sic fire st8tistics is not entirely s8tisf8ctory 8S it depends on 8 v8riety of 8ssumptions some of which 8re difficult to justify Nevertheless the gener8l 8nalysis h8S been used in this study bec8use even though it m8Y not provide 8n independent estimate it does provide 8 better underst8nding of the estim8te of the
9
I
I
I effectiveness of detectors
For the example of an industrial building of area 1500 square metres the estimated effect of direct line detectors is as follows
Proportion Damage Estimated of fires if unprotected reduction
Person in room 55 40 sqm 0 Person in bldg 18 50 sqm 65-85 Person not in 27 105 sqm 65-85 building All fires 100 60 sqm 40-55
The estimation of the reduction in damage due to direct line and local alarm detectors in buildings of different occupancies is shown in Table A6 This Table shows the estimates produced through the general analysis as well as the average assessed reduction in the fire survey The generalised estimates cover a range of values reflecting the degree of uncertainty in the estimation procedure and are generally lower than the survey estimates reflecting the cautionary nature of the generalised analysis
43 The calculation of the value of detectors
Taking the example of a 1500 square metre industrial building again the initial cost of a direct line detector system is about pound3400 and the future annual running costs are pound280 (see Table Al) The total discounted costs are thus pound6000
The average 1055 per fire in an unprotected building would be pound13400 (from Tables A2 and A3 and including consequential losses of 60 per cent) If the fire damage is reduced by 40 per cent by the installation of automatic fire detection (Table A6) then the expected annual benefits would be 0082x13400xO4-pound440 The discounted value of the total future benefits is then pound4100 In this case the cost of providing direct line detectors is greater than the expected benefits and from the national economy point of view the provision of detectors in these buildings is not cos t-effecti ve
10
5 THE VALUE OF DETECTORS - RESULTS
51 The value of detectors to the national economy
I The value of automatic fire detection calculated from the national economy point of view has been estimated for buildings of different sizes and different occupancies The results for
I direct line alarm systems are summarised in Figure 2 and the results for local alarm systems in Figure 3
In these Figures a range of values are shown for industrial buildings This range reflects the alternative range of estimates of the reduction in fire damage Only a single estimate of the economic value of detectors is shown for other occupancies in order to simplify the graphs The single line shown for the other occupancies is the mid-point of the range of values
In industrial buildings larger than about 2000 square metres (22 per cent of the buildings in manufacturing industry exceed this size) direct line detectors appear to be of economic value Somewhat surprisingly detection systems with local alarms appear to be of equal or greater economic value than systems with direct line alarms This result reflects the experience of the fire survey in which it was judged that in many cases a local alarm would have brought people to the fire promptly and that these people would have been able to extinguish or at least to contain the fire Although direct line systems can achieve a greater reduction in fire damage this additional benefit does not offset the higher cost of providing the direct line system
The only other occupancy in which detectors appear to be of economic value is shops and here it is the direct line systems which show the greater benefit
I 52 The present provision of automatic fire detection
The results of the survey of manufacturing industry show that detectors are installed in abou t 5 per cent of buildings covering a total of about 13 per cent of the total floorspace
The industr ies with the proportionately highest degree of automatic fire detection are Electrical Engineering and Chemicals
53 The value of detectors to the firm
Insurance companies offer discounts of up to 125 per cent for the installation of approved detector systems Because of the way in which premiums are calculated this is equivalent to a discount of up to about 20 per cent on the premium payable
Our estimates of the value to the firm of installing detectors
11
I
I I
suggest that even in the largest industrial buildings the costs of providing a detector system will exceed the benefits of the reduction in premiums (Although there may of course be individual cases where this generalisation development areas where government grants are for capital investment there may be a small to firms to install detectors in larger build
is not payable
financial ings
true) In to firms incentive
54 The reliability of detectors
Studies of the reliability of the present direct line fire detection systems have shown that for every genuine alarm signalled by the system there are more than 10 false and accidental alarms A false alarm rate as high as this could cause serious problems for fire brigades if there was widespread use of direct line detector systems However the technology is changing rapidly in this area and the reliability of automatic fire detection systems may improve in the future
12
I 6 THE EfFECT Of IMPROVED STRUCTURAL fIRE RESISTANCE
The effect of improved fire resistance in the internal structure of buildings can only be estimated from the information obtained in the examination of buildings in the fire survey At each building visited in the survey an assessment was aade of the amount of fire damage which might have occurred if all the internal surfaces (walls doors ceilings etc) had a minimum of 30 minutes fire resistance
I
Improved fire resistance would have reduced the amount of fire damage in some of the fires which spread beyond the room of origin The survey assessments take into account the fact that in some of the larger fires improved fire resistance would have had no effect because for example doors were left open or because the fire was so severe and had burned for so long that even the more resistant compartment wallS would have been penetrated
No estimate was made of the cost of bringing the structure up to the higher standard although it was clear that the cost would be substantial in many cases
In the survey it was estimated that increased structural fire resistance would have reduced the average amount of fire damageI by 45 per cent in industrial buildings 50 per cent in storage buildings and 55 per cent in shops
I
I
13
I I
7 CO~ CLUSI ONS
Before presenting any conclusions the limitations of the study should first be reiterated Firstly only the protection of property has been considered in this study and not the protection of life Secondly only complete sprinkler systems complete detector systems and complete upgrading of the internal structural fire resistance have been considered The value of partial fire protection systems (protecting only the most valuable parts of the building or the highest risks) or mixec systems (part sprinklers and part detectors) or other forms of fire protection (venting CO 2 flooding etc) have not been considered Thirdly a broad view of the problem has been taken ana results have been derived only for the major occupancy grcups There may well be many special cases or individual buildings for which the general results are not valid
The objective of this study was to derive an overall picture of the value of fire protection measures from the national economy point of view This overall picture is presented in Figures 1-3 The main findings of the study are as follows
1 Sprinklers are very effective in reducing fire damage and the reduction in dam~e is estimated to be 70-90 per cent in buildings of different sizes and occupancies When the cost of providing sprinklers is compared with the saving in fire losses the results of this study indicate that sprinklers are cost-effective in the medium and large industrial buildings in large shops and in high value high risk storage buildings
2 From the firms point of view there is a strong incentive to install sprinklers in order to benefit from the premium reductions offered by insurance companies However far fewer firms have actually taken advantage of these incentives than would benefit from doing so The question arises of why firms have been reluctant to take advantage of these financial incentives
3 It is estimated that automatic fire detection can reduce fire damage by about 50 per cent on average in industrial buildings and even more in other occupancies When these savings in fire losses are compared with the cost of providing detectors it appears that automatic fire detection is of economic value in the larger industrial buildings and the largest shops However if the present high false alarm rate is not improved wider use of direct line detectors might cause serious problems for fire brigades
It should be noted that the Fire Offices Committee representing fire insurers generally have reported that their own estimates of the reduction in fire damage effected by detectors is well below the figure quoted here Although the figures provided by FOC have not been supported by any detailed analysis they are
14
I bull
I nevertheless based on many years experience of underwriting fire risks Only further detailed study could resolve which of the two estimates is closer to the true value although the Home Office has no plans for such work to be carried out
4 From the firms point of view there is relatively little financial incentive to install detectors
5 It is estimated that improved structural fire resistance might reduce fire losses by about 50 per cent No estimate has been made of the cost of these structural improvements
I
I
I I
I I I
15
I
Figure 1 THE VALUE OF SPRINKLERS IN DIFFERENT OCCUPANCIES
8000
7000
6000
5000
4000
Cl) l iii 3000 gt c Cl) III Cl) a 2000 Cl)
Z
1000
o ~____L--+~____-L~__~____-L____~____~__~
- 1000
- 2000
Building size (m2)
Storage
Pubs Restaurants etc (7)
- 4000
16
-3000
I
I Figure 2 THE VALUE OF DIRECT LINE DETECTORS IN
I 7000
6000
5000
I 4000
Il l iii gt 3000 c Il ~ QI li 2000 z
I 1000
I 0
-1000
I -2000
-3000
- 4000
DIFFERENT OCCUPANCIES
Shops
75 Reduction
Storage 70 Reduction
Pubs etc
60~
SChoolS 70 Reduction~ Offices 55 Reduction
V
17
I
Figure 3 THE VALUE OF LOCAL ALARM DETECTORS IN DIFFERENT OCCUPANCIES
8000 r
7000
6000
5000
4000
Q)
J
~ 3000 c Q) Vl Q) -Cl 2000 Q)
Z
1000
o
- 1000
-2000
- 3000
-4000
50 Reduction
Shops 35 Reduction
Storage 50 Reduction
18
I
I I
APPEtWIX A
TABLES OF THE MAIN NUMERICAL RESULTS
I
I I I I I
19
I I
I
I I
I
I I I I I
I I
I I
TABLE A1 THE COST OF FIRE PROTECTION (1977 PRICES)
SPRINKLER SYSTEMS- in buildings of simple open construction not requiring pumps or additional water supplies
Initial cost
I Extra low hazard pound2000 + 083 x size of bUilding(m~) Ordinary hazard pound2000 + 198 x size of building(m )2Extra high hazard pound2000 + 267 x size of building(m )
Annual maintenance cost
Approximately 1 of initial cost
I I
AUTOMATIC DETECTION- in buildings of simple open construction
1nitial cost
Local alarm system pound1500 + 11 x size of bUilding(m~)
I Di rect line system pound1750 + 11 x size of building(m )
Annual maintenance and line rental costs
Local alarm system pound50 + 0025 x size of building(m~) Direct line system pound240 + 0025 x size of building(m )
I
I I I
20
I
TABLE A2 THE PROBABILITY OF A FI R OCC URRIlFu
OCCUPANCY (SIC ORDER)
1----------------------INDUSTRIAL BUILDINGS
PROBABILITY OF FIRE PER YEAR a BC PROBABILQY OF FIRE
IN 15OOm BUILDING
a -4-------
c
~------~------------~
Food drink and tobacco (Ill)
00011 OGc 0086
Chemicals and allied (V) 00069 046 021
bull Mechanical engineering (VII)
000011 075 0027
Electrical engineering (IX)
000061 059 0046
Vehicles (XI) 000012 086 0062
bull Metal goods not elseshyvhere specified (XII)
000158 054 0082
Textiles (XIII) 00075 055 0097
Timber furniture (XVII) 000057 077 010
Paper printing and publishing (XVIII)
0000069 0054
Other manufacturing (XIX)
00084 041 017
All manufacturing industry (Ill-XIX)
arHER OCCUPANCIES
00017 055 0082
Storage 000067 05 0026
Shops 0000066 10 0099
Offices 0000059 09 0043
Hotels etc 000008 10 012
Hospi tals etc 00007 075 017
bullbull Pubs restaurants etc (10) (01 )
Schools 00002 075 0048
Note Some of the fires vhich should be included in the Mechanical engineering sector may have been classified as Metal goods nes This vould result in an underestimate of the probability of fire for Mechanical engineering and an overestimate for Metal goods If the tvo groups are combined the estimated probabili ty of fire is 000086 1356 bull
middotValues for Assembly are assumed There vas insufficient information available to estimate the probability of fire in this occupancy group
21
I
TABLE A3 THE ESTIMATED FIRE DAMAGE IF ONLY THE MINIMUM LEVEL OF IRE PROTECTION IS PROVIDED
I I
I I I
I I
I I
OCCUPANCY (SIC O~vER) AVERAGE FIRE SIZE AS A rUNCTION OF BUILDING SIZE(m 2 )
SAMPLE SIZE
AVERAGE FIRE SIZE IN A B I~ NG 0 15(XluhlOORSPACE
INDUSTRIAL BUILDINGS
All industry 6496 60
Food drink amp tobacco (Ill)
313 73
Chemicals ampallied (V) 516 28
Mechanical engineering (VII )
248 44
Electrical engineering (IX )
174 64
Vehicles (XI) 080 g58 181
Metal goods not elseshywhere specified (XII)
64 jj23 561
Textiles (XIII ) 2 6 ~)9 399 45
Timber furniture (XVII ) 4 B21
2 2 393 112
Paper printing amp pUblishing (XVIII)
6 7 ~)6 198 93
Other manufacturing (XIX)
OTHER OCCUPANCIES
87 38
B 228 140
Storage 1398 157
Shops 50
095 B 2662 37
Offices 622 15
Hotels etc 22
B 973 27
Hospitals 20
936 5
Pubs restaurants etc 76 B 2908 33
Schools etc 28 57
B 906 42
22 I
~ABLE M IBE A VElUGE llE4 01 lIRE DAlIAGE IF SPRIIiKLERS ARE IIISTALLD
fRlfKirpi ~~ SPRlI)(L OPJAA[D ampPRIf~ I YtS SPF ~KIrnS rAI ur
~crIV JL SAl ]St AtTOR] U middotCOIIL er CO~i OCCUPIlCy (SIC CiWUl )
Aydllolteerll ~)PrYpn Prepn ~ dANr(~ ) PTopn h~(2) hdt(~ )Pr0in
It i middot~ITfd AL 31JlllNG
All induetr-J 13 p~ 8022I lt3 022x bullI(~955bull 3middot57 5 gt~ -66
a78Bmiddot~food dr~ toouCO ampJ OZb 2 0101 1 Illlt68bull bull (Ill ) -67
Bmiddot 1202h O 60 2 9t2looChellicil15 ampl11 02gt29~ 89 (V) -30
029 l 76rechmiddotnica elaquo1necriTf -2 961bullbull 580258 gtOOx~ (nl) -cn
B 7EhctriClll lr1n~r1Damp 1 02x~ )09 5 (96Bbullbull 5~ 01z53 (Il ) -ltgt69
tb1c1u (Xl) 87 62 E gtDUx 966x 3 9 01 3 -67
IMete roods cot l6Ishy gt 022z5C 6968 bull bull 58 0lx58 S3 0 bull 2l otltrtl ~lcihd (XlI) -072
uUl (XlII ) 2lt0Ux47 Efu-47 016bullbull475~I gt~55 middot-79I
t1~lgteT bull lUT~j tlJt (Xll) 0Z2z602 ~ S 96360 01bullbull 60 gt - B )6hpn Prictinf 022x60 9562060 019x6O B2 5publiahinl (nUl) -ltgt
B 02b )0Oth~r canufampetnr1n~ 70 290 06lO IV95x~ 30 (nxl -9
OHlI OCCtIPAN Ci rs 11 5lpoundtorace 0Z2z1(2 4bgt 9282076 050lt7pound (6
~O6
pound1ope 2 B 00022J 4555 Oh49sBx1t5 B2
(Off1e ) ( ) ( () )275 ( ( )) ( )) (
1WItela ~tc ( ( )) ( )106 ) ( -19 middot( )( ) ( ) )(
( ) ( ) ( ) ( ) )H04fIitala tc ( ( )) ( ()9
( 09 2 ) ( 0222o5~) 2 I(72oi (Q052oi gt5( ( )Pub_ atamplltampJl ete ) ( )) (9 middot ( ) ( ) ( ) )~19 ( ( ) ( ) ( ( )I
Sehoola ate ( ) ( ) ( ( )5middot5 bull )1 I ( ( )) 19 ( ) ( )
TABLE A5 THE AVERAGE DIRECT LOSS PER UNIT AREA OF FIRE DAMAGE
I I
I
I I
OCCUPANCY (SIC ORDER ) UNIT LOSS (poundsqm )
INDUSTRIAL BUILDINGS
All industry 140
Food drink amp tobacco ltrII)
Chemicals amp allied (V)
270
Mechanical engineering ( VII )
290
Electrical engineering (IX )
320
Vehicles (xI) 150
Metal goods not elseshywhere specified (XII)
240
Textiles (XIII) 210
Timber furniture (XVII) 130
Paper printing amp publishing (XVIII )
90
Other manufacturing (XIX )
OTHER OCCUPANCIES
120
Storage 120
Shops 160
Offices 150
Hotels etc 130
Hospitals etc 160
Pubs restaurants etc 100
Schools 110
24 I I
I TABLE J~ THE ESTIMATED REDUCTION IN FIRE DAMAGE DUE TO DETECTORS - ALL FIRES
Reduction in fire damage
Occupancy Survey
sample size lIith direct line alarm lIith local alarm
Estimated from Estimated Eetilllllted from Eetimated K433SAF2 in Survey K433SAF2 in Survey
Industry 210 -(40~55) -55 -(35-50) -50
Storage 30 -( 60-70) -80 - (45 55) -60
Shops 50 -( 65-75) -85 -(35-40) -4OJ~
Offices 17 -(55r~70) -45 not estimated -40
Hotels 12 -(55-65) -85 not estimated -85
Pubs restaurants 36 -(60-75) -55 not estimated -40
Schools 26 -(55-70) -90 not estimated -85
25
I
I I
I I
I I I I
I
I
I
I

I
I
I
I
I I
1 INTRODUCTION
The Home Office Fire Department is currently undertaking a wide-ranging review of fire and fire protection and the study reported here is one of this series of this particular study is
-to assess the value of sprinkdetection and structural fire refire losses in buildings
studies The objective
lers automatic fire sistance in reducing
of
Only the protection of property protection of life is the subject of
is a
considered here The separate study
This report contains a summary account of the study and includes an outline of the method of analysis as well as the main conclusions The main numerical results are included in the Appendix A full technical account of the study is given in Report l678The Value of Fire Protection in Buildings
11 The requirements of the study
The particular requirements of this study which have dictated our approach to the problem are as follows
1The value of the fire protection measures is considered from the national economy point of view The Home Office Fire middotOepartment as a Central Government department is concerned with the effects of fire and fire protection on the national economy In this study the costs of providing fire protection and the direct and consequential fire losses are therefore measured in terms of the national economic effects These costs and losses and particularly the consequential losses may be quite different from the costs and losses experienced by the owners or occupiers of the buildings
While the primary objective has been to consider the national economic effects the problem has also been considered briefly from the point of view of the owners or occupiers of the buildings
2In this study the value of the fire protection measures has been assessed in quantitative terms It was not sufficent to conclude for example that sprlnklers are very valuable The study was deSigned to provide estimates of the value of each fire protection measure in monetary terms
3The study was intended to provide an overall picture of the value of fire protection In order co provide this overall picture the analysis has been done for broad classes of buildings industrial buildings as a single group separate sectors of industry storage buildings and shops Other occupancies including offices schools hospitals and places of
1
assembly (public houses restaurants etc) have also been considered but the results for these occupancies may be less accurate because of the scarcity of relevant data The results of this analysis are therefore only applicable to each occupancy as a group or to the typical buildings in the group There may be many individual buildings in which the circumstances are different from the typical or average case and for which the results of the study do not hold However the objective of the study is the provision of an overall picture and general conclusions rather than to attempt to produce a universal formula which is detailed and accurate enough to apply to any and every individual building
12 The measurement of the value of fire protection
The value of fire protection is measured by comparing the costs of providing the protection with the reduction in fire losses resulting from the additional protection Because the costs are mainly incurred in the initial year and the benefits accrue (in probability) in future years the costs and benefits must be compared using the standard accounting technique of Discounted Cash Flow
If the initial cost of installing fire protection is C and the annual maintenance costs are c per year then discounting at 10 per cent over 20 years the total discounted cost of providing fire protection is
C + 936c
The expected reduction in fire losses in any year is Reduction in fire lossesmiddot
Probability of fire x (Fire loss if a fire occurs in an unprotected building
Fire loss if a fire occurs in a protected building)
The total discounted future benefits are equal to 936 times the expected annual reduction in fire loss
If the discounted benefits are greater than the discounted costs then the provision of fire protection is considered cost-effective
~~ The approach to the problem
In order to estimate the value of fire protectionthe costs and benefits must be calculated for each occupancy group The separate items in this calculation are
-the cost of providing fire protection -the probability of a fire occurring -the average amount of fire damage which would result if a fire occurred in an unprotected building -the average amount of fire damage which would result
2
I
I
I
I
if a fire occurred in a protected building
This proble~ has been tackled as a statistical eKercise The separate elements of the problem have been estimated from the available fire data and where data were not available additional data have been COllected A very important part of our study has been a special survey of fires In the fire survey a total of 600 fires were examined by a forensic scientist who has specialised in fire investigations accompanied by a senior Fire Prevention Officer About 100 of the fires were visited soon after the fire occurred the fire scene was examined and the officer in charge at the fire and other witnesses were questioned In the remaining fires in which the circumstances were simpler the fire report was examined and additional questions were asked of the officer in charge at the fire
The fire survey not only provided information which could not have been Obtained otherwise but also gave a clearer understanding of fire data generally and thus enabled better use to be made of the other fire data
Initially a fairly elaborate method of analysis was planned in order to produce the most accurate results and to avoid any misinterpretation of the fire data In the event it turned out that there were insufficient detailed data to support the more sophisticated methods and more importantly it could be shown that the more complex methOds would not make any significant difference to the answers The final results were derived using Simpler methods but the experience of attempting to use more complex models has given us more confidence in the final results
The analysis of the value of sprinkler protection is described in Sections 2 and 3 the analysis for detectors in Sections 4 and 5 and the effect of increased structural fire resistance is described briefly in Section 6 The final conclusions are summarised in Section 7
3
I
2 THE VALUE OF SPRINKLERS- ANALYSIS
The estimation of e~ch of the items in the calcul~tion (liEtec in Section 13) c~n be regardec as a separate problem E~ch of the items is discussed briefly in this section and the results are illustrated using the example of an industrial building with a floor ~rea of 1500 sauare metres The full results for other occupancies and building sizes ~re given in the Appendix
2~1 The cost of a sprinkler systew
The cost of the sprinkler heads and the associated pipework will depend on the size of the building which is to be protected There will also be a fixed cost for each systew for the control valves alarms and the connection to the mains The estimated cost of installing a sprinkler system in a building of simple open construction ~nd involving no special haz~rd and no additional water supplies is pound(2000 + 198 x Size of building(sam)) The costs of other sprinkler systems are given in Table Al
The maintenance cost in future years is estimated to be about 1 per cent of the initial capital cost
22 The probability of a fire occurring
The probability of a fire occurring will vary with the occupancy and the size of the building The probability is estimated by relating the number of fires which occur in buildings of a given size and occupancy to the number of buildings of that size and occupancy at risk The probability of a fire in a large building is greater than in a swall building of the same occupancy but the risk of a fire does not increase in direct proportion to the building size The probability of a fire is of the form
Probability z aB where B is the floorspace of the building and a and c are the estiwated parameters for each occupancy
The estimated probability of a fire in an industrial building is given by
Probability z 00017B0middot3 which is eaual to a probability of 0082 in a 1500 square metre building or on average one fire every 12 years
Table A2 shows the probabilitity of a fire in other occupancies
~~3 The expected fire damage in an unprotected building
The average area of fire damage which would occur in an unprotected building was estimated from an analysis of the fires in buildings which did not have sprinklers or detectors The average area of fire damage is the average of many small fires
4
anc ltl f e ~ 9 E fires o nc the ave rage de pends on the size of the building middotsimply because large fires cannot occur in small buildings The average area of fire damage is estimated in the form
Fire size dBmiddot bullE
where B is the building floorspace and d and e are estimated parameters For industrial buildings tE~ estimated fire size is
Fire size 2 25 r E
and the average fire size in an unprotected building of 1500 souare metres is therefore 60 souare metres
The estimated areas of fire damage in buildings of other occupancies are given in Table A3
I 1~4 The expected fire damage in a building fitted with sprinklers
I
The expected fire da~age if a fire breaks out in a building in which sprinklers are installed has been estimated by considering four separate situations which might arise There may be insufficient heat to activate the sprinkler heads the sprinklers may not operate because the system has been turned off or because of a mechanical defect the sprinklers might operate and control or extinguish the fire or the fire may grow very large despite the operation of the sprinklers These separate outcomes are not of interest in their own right but subdividing the problem in this way provides more insight and produces a more reliable result
For an industrial building of 1500 sauare metres the probabilities of each outcome and the average area of fire damage in each case are
Sprinkler not activated 57 S sqm Sprinkler failure 09S 130 sOm Satisfactory operation 41 IS sOm Fire middotout of control 09S SOO sqm
The average damage if sprinklers are installed is therefore 0S7xS + 0009Sx130 + 04lxlS + O009SxSOO = 16 sqm
Predicted performance in other occupancies is shown in Table A4
2S The fire loss incurred
The relationship between fire losses and the area of fire damage has been investigated and it has been shown that the fire loss can be estimated simply by multiplying the area of fire damage by an average unit loss For industrial buildings the direct loss (to the national economy) is estimated to be pound140sqm of fire
I damage (The direct loss as estimated by insurance companies may be about IS per cent higher) Direct losses in other occupancies are shown in Table AS
A study of conseouential losses has shown that for manufacturing industry such losses are from the national economy point of
I 5
view equ~l to ~bout 60 of direct losses although the consequenti~l losses to the firm may be considerably greater
~6 The estimated value of sprinklers
For the example of ~n industrial building of 1500 square metres the initi~l capit~l cost of ~ sprinkler system would be pound5000 ~nd the total discounted cost of providing sprinkler protection including future m~intenance costs pound5500
If a fire occurred ~nd the building were not protected the ~verage area of fire damage would be 60 square metres involving ~ direct loss of 60x140-pound8400 and ~ total loss of pound8400xl6-pound13400 If the building were sprinklered the ~verage are~ of fire dam~ge would be 16 square metres involving a direct loss of pound2300 and ~ total loss of pound3700 The provision of sprinklers will therefore have reduced the expected fire dam~ge by 73
The probability of a fire per ye~r is 0082 and the expected reduction in fire losses per ye~r is therefore 0082x(pound13400-3700)- pound800 The total discounted benefit due to the reduced fire loss is thus pound7400 which exceeds the (discounted) cost of providing the sprinklers The provision of sprinkler protection in these buildings is therefore cost-effective from the n~tional economy point of view
The v~lue of sprinklers can be calcul~ted in this way for buildings of other occupancies ~nd other sizes
6
I
3 THE VALUE OF SPRINKLERS - RESULTS
31 The value of sprinklers to the national economy
The value of sprinkler protection calculated from the national economy point of view has been estimated for buildings of different occupancies and different sizes and the results are summarised in a graohical form in Figure 1 Figure 1 shows the Net Present Value of sprinkler protection (the discounted benefits minus the discounted costs) in different occupancies Where the Net Present Value is greater than zero sprinkler protection can be said to be cost-effective
The results show that for the overall industrial group of buildings sprinklers are cost-effective in buildings larger than
I 800 sauare metres When the different sectors of industry are considered separately the minimum building size above which sprinklers are of value is between 300 and 1000 square metres for most of the industries The separate industries in which sprinklers appear to show the greatest economic value are Other Manufacturing (which includes rubber and plastic products) Chemicals Food Timber and Electrical Engineering It is estimated that sprinklers would be cost-effective in about 50 per cent of the buildings in manufacturing industry and these buildings account for about 90 oer cent of the total floorspace in manufacturing industry
Sprinklers also aopear to be of value in the larger shops Snrinklers do not aopear to be of value (at least when only property protection is considered) in hospitals offices schools and pubs and restaurants
I
One perhaps surprising result is that sprinklers do not appear to be cost-effective in storage buildings Although the fires in storage buildings are large on average and sprinklers are very effective in reducing this fire damage the probability of a fire occurrinq is low and the expected reduction in fire damage is therefore not sufficient to - offset the cost of providing sorinklers This result far all storage buildings considered as
I a single group hides the fact that the circumstances in
I different tyPes of storage buildings can be very different If the storage group is subdivided it can be shown that sprinklers will be of net value in high risk high value storage buildings
Although the results of this analysis show that sprinklers are cost-effective in larger hotels there is reason to suspect that because of the inadeQuacy of the data used in the analysis these results overestimate the value of sprinklers in reducing property damage in hotels
7 I
32 The present provision of sprinklers
The present provision of sprinkler protection in manufacturing industr y has been estimated by a survey of manufacturing industry The survey results show that 13 per cent of buildings have complete sprinkler protection anc a further 4 per cent have partial ~prinkler protection Sprinklers tend to be installed in the larger buildings and it is estimated that a total of about 3S per cent of the floorspace in manufacturing industry is protected by sprinklers
No estimates of the extent occupancies are available
of sprinkler protection in other
33 The value of sprinklers to the firm
The value of sprinklers briefly in this study
to the firm has only been considered
Firms may install fire protection because of their awareness of the risks of fire and their wish to reduce these risks or they may install protection mainly in order to secure more advantageous terms for fire insurance Estimates have been made of the financial incentives to the firm to install fire protection
Insurance companies offer premium discounts of between 60 per cent and 90 per cent for approved sprinkler systems By making some assumptions to compensate for the lack of detailed information about insurance rates it is possible to estimate the value to the firm of installing sprinklers in buildings of different sizes
The estimates of the value to the firm of providing sprinklers in industrial buildings show that the value to the firm is broadly similar to the value to the economy ie where sprinklers are of value to the economy there is a financial incentive to the firm to install this protection In development areas where capital grants are available to firms who install sprinklers the financial incentives to install sprinklers are much greater
8
4 THP VALUP ~p DETECTOPS - ANALYSIS
41 The cost of detectors
Jt is estim8ted that the cost of installing either heat or smoke detectors in 8 building of simple open construction is 8poroximately pound11 per square metre of floorspace In 8ddition there will be 8 cost of 8bout pound1500 for the control equipment If 8 direct line system is inst8lled there will 8lso be a connection ch8rge The initi8l costs 8nd the future m8intenance 8nd line rent81 ch8rges for local 8l8rm and direct line systems 8re given in Table Al
~ 2 The estimated reduction in fire d8m8ge
I
I Detectors reduce fire d8m8ge by giving e8rly w8rning of 8 fire 8nd thus 8llowing people to intervene e8rlier The effectiveness of detectors depends on where people 8re 8t the time the fire occurs how r8pidly the fire is growing how people respond when they hear the 8l8rm 8nd how cap8ble people 8re of de8ling with the fire when they first 8rrive on the scene The effectiveness of detectors is therefore much more difficult to predict
The b8sic f8ctors which determine the effect of detectors in reducing fire d8m8ge C8nnot be deduced from the main fire st8tistics and we h8ve therefore had to rely very he8vily in this p8rt of the 8n81ysis on the inform8tion derived in our own fire survey For e8ch of the fires eX8mined in our survey 8n 8ssessment W8S m8de of the 8mount of fire d8m8ge which might h8ve occurred if detectors h8d been inst8lled This 8ssessment W8S m8de in the light of the 8ctu81 circumst8nces of e8ch fire 8nd
I particu18rly the estim8ted r8te of development of the fire in its e8rly st8ges 8nd the 8ssumed 8bility of the people in the vicinity to respond to the 818rm 8nd deal with the fire
I This 8ssessment of the d8m8ge which might h8ve occurred together with the record of the fire d8m8ge which 8Ctu8l1y occurred could be used directly to estim8te the possible reduction in fire d8m8ge due to detectors However in order to widen the b8sis of the estim8te 8n 8ttempt h8S been made to gener8lise the survey results by reference to the complete s8mple of fires for which a K433SAF2 fire report W8S 8vai18ble The K433SAF2 fire reports include 8 record of the 10c8tion of the ne8rest person 8t the time of the fire The possible reduction in fire d8m8ge C8n be estim8ted 8S 8 function of the C8use of the fire b8sed on the det8iled experience of the fire survey
The estimation of the reduction in fire dam8ge from the b8sic fire st8tistics is not entirely s8tisf8ctory 8S it depends on 8 v8riety of 8ssumptions some of which 8re difficult to justify Nevertheless the gener8l 8nalysis h8S been used in this study bec8use even though it m8Y not provide 8n independent estimate it does provide 8 better underst8nding of the estim8te of the
9
I
I
I effectiveness of detectors
For the example of an industrial building of area 1500 square metres the estimated effect of direct line detectors is as follows
Proportion Damage Estimated of fires if unprotected reduction
Person in room 55 40 sqm 0 Person in bldg 18 50 sqm 65-85 Person not in 27 105 sqm 65-85 building All fires 100 60 sqm 40-55
The estimation of the reduction in damage due to direct line and local alarm detectors in buildings of different occupancies is shown in Table A6 This Table shows the estimates produced through the general analysis as well as the average assessed reduction in the fire survey The generalised estimates cover a range of values reflecting the degree of uncertainty in the estimation procedure and are generally lower than the survey estimates reflecting the cautionary nature of the generalised analysis
43 The calculation of the value of detectors
Taking the example of a 1500 square metre industrial building again the initial cost of a direct line detector system is about pound3400 and the future annual running costs are pound280 (see Table Al) The total discounted costs are thus pound6000
The average 1055 per fire in an unprotected building would be pound13400 (from Tables A2 and A3 and including consequential losses of 60 per cent) If the fire damage is reduced by 40 per cent by the installation of automatic fire detection (Table A6) then the expected annual benefits would be 0082x13400xO4-pound440 The discounted value of the total future benefits is then pound4100 In this case the cost of providing direct line detectors is greater than the expected benefits and from the national economy point of view the provision of detectors in these buildings is not cos t-effecti ve
10
5 THE VALUE OF DETECTORS - RESULTS
51 The value of detectors to the national economy
I The value of automatic fire detection calculated from the national economy point of view has been estimated for buildings of different sizes and different occupancies The results for
I direct line alarm systems are summarised in Figure 2 and the results for local alarm systems in Figure 3
In these Figures a range of values are shown for industrial buildings This range reflects the alternative range of estimates of the reduction in fire damage Only a single estimate of the economic value of detectors is shown for other occupancies in order to simplify the graphs The single line shown for the other occupancies is the mid-point of the range of values
In industrial buildings larger than about 2000 square metres (22 per cent of the buildings in manufacturing industry exceed this size) direct line detectors appear to be of economic value Somewhat surprisingly detection systems with local alarms appear to be of equal or greater economic value than systems with direct line alarms This result reflects the experience of the fire survey in which it was judged that in many cases a local alarm would have brought people to the fire promptly and that these people would have been able to extinguish or at least to contain the fire Although direct line systems can achieve a greater reduction in fire damage this additional benefit does not offset the higher cost of providing the direct line system
The only other occupancy in which detectors appear to be of economic value is shops and here it is the direct line systems which show the greater benefit
I 52 The present provision of automatic fire detection
The results of the survey of manufacturing industry show that detectors are installed in abou t 5 per cent of buildings covering a total of about 13 per cent of the total floorspace
The industr ies with the proportionately highest degree of automatic fire detection are Electrical Engineering and Chemicals
53 The value of detectors to the firm
Insurance companies offer discounts of up to 125 per cent for the installation of approved detector systems Because of the way in which premiums are calculated this is equivalent to a discount of up to about 20 per cent on the premium payable
Our estimates of the value to the firm of installing detectors
11
I
I I
suggest that even in the largest industrial buildings the costs of providing a detector system will exceed the benefits of the reduction in premiums (Although there may of course be individual cases where this generalisation development areas where government grants are for capital investment there may be a small to firms to install detectors in larger build
is not payable
financial ings
true) In to firms incentive
54 The reliability of detectors
Studies of the reliability of the present direct line fire detection systems have shown that for every genuine alarm signalled by the system there are more than 10 false and accidental alarms A false alarm rate as high as this could cause serious problems for fire brigades if there was widespread use of direct line detector systems However the technology is changing rapidly in this area and the reliability of automatic fire detection systems may improve in the future
12
I 6 THE EfFECT Of IMPROVED STRUCTURAL fIRE RESISTANCE
The effect of improved fire resistance in the internal structure of buildings can only be estimated from the information obtained in the examination of buildings in the fire survey At each building visited in the survey an assessment was aade of the amount of fire damage which might have occurred if all the internal surfaces (walls doors ceilings etc) had a minimum of 30 minutes fire resistance
I
Improved fire resistance would have reduced the amount of fire damage in some of the fires which spread beyond the room of origin The survey assessments take into account the fact that in some of the larger fires improved fire resistance would have had no effect because for example doors were left open or because the fire was so severe and had burned for so long that even the more resistant compartment wallS would have been penetrated
No estimate was made of the cost of bringing the structure up to the higher standard although it was clear that the cost would be substantial in many cases
In the survey it was estimated that increased structural fire resistance would have reduced the average amount of fire damageI by 45 per cent in industrial buildings 50 per cent in storage buildings and 55 per cent in shops
I
I
13
I I
7 CO~ CLUSI ONS
Before presenting any conclusions the limitations of the study should first be reiterated Firstly only the protection of property has been considered in this study and not the protection of life Secondly only complete sprinkler systems complete detector systems and complete upgrading of the internal structural fire resistance have been considered The value of partial fire protection systems (protecting only the most valuable parts of the building or the highest risks) or mixec systems (part sprinklers and part detectors) or other forms of fire protection (venting CO 2 flooding etc) have not been considered Thirdly a broad view of the problem has been taken ana results have been derived only for the major occupancy grcups There may well be many special cases or individual buildings for which the general results are not valid
The objective of this study was to derive an overall picture of the value of fire protection measures from the national economy point of view This overall picture is presented in Figures 1-3 The main findings of the study are as follows
1 Sprinklers are very effective in reducing fire damage and the reduction in dam~e is estimated to be 70-90 per cent in buildings of different sizes and occupancies When the cost of providing sprinklers is compared with the saving in fire losses the results of this study indicate that sprinklers are cost-effective in the medium and large industrial buildings in large shops and in high value high risk storage buildings
2 From the firms point of view there is a strong incentive to install sprinklers in order to benefit from the premium reductions offered by insurance companies However far fewer firms have actually taken advantage of these incentives than would benefit from doing so The question arises of why firms have been reluctant to take advantage of these financial incentives
3 It is estimated that automatic fire detection can reduce fire damage by about 50 per cent on average in industrial buildings and even more in other occupancies When these savings in fire losses are compared with the cost of providing detectors it appears that automatic fire detection is of economic value in the larger industrial buildings and the largest shops However if the present high false alarm rate is not improved wider use of direct line detectors might cause serious problems for fire brigades
It should be noted that the Fire Offices Committee representing fire insurers generally have reported that their own estimates of the reduction in fire damage effected by detectors is well below the figure quoted here Although the figures provided by FOC have not been supported by any detailed analysis they are
14
I bull
I nevertheless based on many years experience of underwriting fire risks Only further detailed study could resolve which of the two estimates is closer to the true value although the Home Office has no plans for such work to be carried out
4 From the firms point of view there is relatively little financial incentive to install detectors
5 It is estimated that improved structural fire resistance might reduce fire losses by about 50 per cent No estimate has been made of the cost of these structural improvements
I
I
I I
I I I
15
I
Figure 1 THE VALUE OF SPRINKLERS IN DIFFERENT OCCUPANCIES
8000
7000
6000
5000
4000
Cl) l iii 3000 gt c Cl) III Cl) a 2000 Cl)
Z
1000
o ~____L--+~____-L~__~____-L____~____~__~
- 1000
- 2000
Building size (m2)
Storage
Pubs Restaurants etc (7)
- 4000
16
-3000
I
I Figure 2 THE VALUE OF DIRECT LINE DETECTORS IN
I 7000
6000
5000
I 4000
Il l iii gt 3000 c Il ~ QI li 2000 z
I 1000
I 0
-1000
I -2000
-3000
- 4000
DIFFERENT OCCUPANCIES
Shops
75 Reduction
Storage 70 Reduction
Pubs etc
60~
SChoolS 70 Reduction~ Offices 55 Reduction
V
17
I
Figure 3 THE VALUE OF LOCAL ALARM DETECTORS IN DIFFERENT OCCUPANCIES
8000 r
7000
6000
5000
4000
Q)
J
~ 3000 c Q) Vl Q) -Cl 2000 Q)
Z
1000
o
- 1000
-2000
- 3000
-4000
50 Reduction
Shops 35 Reduction
Storage 50 Reduction
18
I
I I
APPEtWIX A
TABLES OF THE MAIN NUMERICAL RESULTS
I
I I I I I
19
I I
I
I I
I
I I I I I
I I
I I
TABLE A1 THE COST OF FIRE PROTECTION (1977 PRICES)
SPRINKLER SYSTEMS- in buildings of simple open construction not requiring pumps or additional water supplies
Initial cost
I Extra low hazard pound2000 + 083 x size of bUilding(m~) Ordinary hazard pound2000 + 198 x size of building(m )2Extra high hazard pound2000 + 267 x size of building(m )
Annual maintenance cost
Approximately 1 of initial cost
I I
AUTOMATIC DETECTION- in buildings of simple open construction
1nitial cost
Local alarm system pound1500 + 11 x size of bUilding(m~)
I Di rect line system pound1750 + 11 x size of building(m )
Annual maintenance and line rental costs
Local alarm system pound50 + 0025 x size of building(m~) Direct line system pound240 + 0025 x size of building(m )
I
I I I
20
I
TABLE A2 THE PROBABILITY OF A FI R OCC URRIlFu
OCCUPANCY (SIC ORDER)
1----------------------INDUSTRIAL BUILDINGS
PROBABILITY OF FIRE PER YEAR a BC PROBABILQY OF FIRE
IN 15OOm BUILDING
a -4-------
c
~------~------------~
Food drink and tobacco (Ill)
00011 OGc 0086
Chemicals and allied (V) 00069 046 021
bull Mechanical engineering (VII)
000011 075 0027
Electrical engineering (IX)
000061 059 0046
Vehicles (XI) 000012 086 0062
bull Metal goods not elseshyvhere specified (XII)
000158 054 0082
Textiles (XIII) 00075 055 0097
Timber furniture (XVII) 000057 077 010
Paper printing and publishing (XVIII)
0000069 0054
Other manufacturing (XIX)
00084 041 017
All manufacturing industry (Ill-XIX)
arHER OCCUPANCIES
00017 055 0082
Storage 000067 05 0026
Shops 0000066 10 0099
Offices 0000059 09 0043
Hotels etc 000008 10 012
Hospi tals etc 00007 075 017
bullbull Pubs restaurants etc (10) (01 )
Schools 00002 075 0048
Note Some of the fires vhich should be included in the Mechanical engineering sector may have been classified as Metal goods nes This vould result in an underestimate of the probability of fire for Mechanical engineering and an overestimate for Metal goods If the tvo groups are combined the estimated probabili ty of fire is 000086 1356 bull
middotValues for Assembly are assumed There vas insufficient information available to estimate the probability of fire in this occupancy group
21
I
TABLE A3 THE ESTIMATED FIRE DAMAGE IF ONLY THE MINIMUM LEVEL OF IRE PROTECTION IS PROVIDED
I I
I I I
I I
I I
OCCUPANCY (SIC O~vER) AVERAGE FIRE SIZE AS A rUNCTION OF BUILDING SIZE(m 2 )
SAMPLE SIZE
AVERAGE FIRE SIZE IN A B I~ NG 0 15(XluhlOORSPACE
INDUSTRIAL BUILDINGS
All industry 6496 60
Food drink amp tobacco (Ill)
313 73
Chemicals ampallied (V) 516 28
Mechanical engineering (VII )
248 44
Electrical engineering (IX )
174 64
Vehicles (XI) 080 g58 181
Metal goods not elseshywhere specified (XII)
64 jj23 561
Textiles (XIII ) 2 6 ~)9 399 45
Timber furniture (XVII ) 4 B21
2 2 393 112
Paper printing amp pUblishing (XVIII)
6 7 ~)6 198 93
Other manufacturing (XIX)
OTHER OCCUPANCIES
87 38
B 228 140
Storage 1398 157
Shops 50
095 B 2662 37
Offices 622 15
Hotels etc 22
B 973 27
Hospitals 20
936 5
Pubs restaurants etc 76 B 2908 33
Schools etc 28 57
B 906 42
22 I
~ABLE M IBE A VElUGE llE4 01 lIRE DAlIAGE IF SPRIIiKLERS ARE IIISTALLD
fRlfKirpi ~~ SPRlI)(L OPJAA[D ampPRIf~ I YtS SPF ~KIrnS rAI ur
~crIV JL SAl ]St AtTOR] U middotCOIIL er CO~i OCCUPIlCy (SIC CiWUl )
Aydllolteerll ~)PrYpn Prepn ~ dANr(~ ) PTopn h~(2) hdt(~ )Pr0in
It i middot~ITfd AL 31JlllNG
All induetr-J 13 p~ 8022I lt3 022x bullI(~955bull 3middot57 5 gt~ -66
a78Bmiddot~food dr~ toouCO ampJ OZb 2 0101 1 Illlt68bull bull (Ill ) -67
Bmiddot 1202h O 60 2 9t2looChellicil15 ampl11 02gt29~ 89 (V) -30
029 l 76rechmiddotnica elaquo1necriTf -2 961bullbull 580258 gtOOx~ (nl) -cn
B 7EhctriClll lr1n~r1Damp 1 02x~ )09 5 (96Bbullbull 5~ 01z53 (Il ) -ltgt69
tb1c1u (Xl) 87 62 E gtDUx 966x 3 9 01 3 -67
IMete roods cot l6Ishy gt 022z5C 6968 bull bull 58 0lx58 S3 0 bull 2l otltrtl ~lcihd (XlI) -072
uUl (XlII ) 2lt0Ux47 Efu-47 016bullbull475~I gt~55 middot-79I
t1~lgteT bull lUT~j tlJt (Xll) 0Z2z602 ~ S 96360 01bullbull 60 gt - B )6hpn Prictinf 022x60 9562060 019x6O B2 5publiahinl (nUl) -ltgt
B 02b )0Oth~r canufampetnr1n~ 70 290 06lO IV95x~ 30 (nxl -9
OHlI OCCtIPAN Ci rs 11 5lpoundtorace 0Z2z1(2 4bgt 9282076 050lt7pound (6
~O6
pound1ope 2 B 00022J 4555 Oh49sBx1t5 B2
(Off1e ) ( ) ( () )275 ( ( )) ( )) (
1WItela ~tc ( ( )) ( )106 ) ( -19 middot( )( ) ( ) )(
( ) ( ) ( ) ( ) )H04fIitala tc ( ( )) ( ()9
( 09 2 ) ( 0222o5~) 2 I(72oi (Q052oi gt5( ( )Pub_ atamplltampJl ete ) ( )) (9 middot ( ) ( ) ( ) )~19 ( ( ) ( ) ( ( )I
Sehoola ate ( ) ( ) ( ( )5middot5 bull )1 I ( ( )) 19 ( ) ( )
TABLE A5 THE AVERAGE DIRECT LOSS PER UNIT AREA OF FIRE DAMAGE
I I
I
I I
OCCUPANCY (SIC ORDER ) UNIT LOSS (poundsqm )
INDUSTRIAL BUILDINGS
All industry 140
Food drink amp tobacco ltrII)
Chemicals amp allied (V)
270
Mechanical engineering ( VII )
290
Electrical engineering (IX )
320
Vehicles (xI) 150
Metal goods not elseshywhere specified (XII)
240
Textiles (XIII) 210
Timber furniture (XVII) 130
Paper printing amp publishing (XVIII )
90
Other manufacturing (XIX )
OTHER OCCUPANCIES
120
Storage 120
Shops 160
Offices 150
Hotels etc 130
Hospitals etc 160
Pubs restaurants etc 100
Schools 110
24 I I
I TABLE J~ THE ESTIMATED REDUCTION IN FIRE DAMAGE DUE TO DETECTORS - ALL FIRES
Reduction in fire damage
Occupancy Survey
sample size lIith direct line alarm lIith local alarm
Estimated from Estimated Eetilllllted from Eetimated K433SAF2 in Survey K433SAF2 in Survey
Industry 210 -(40~55) -55 -(35-50) -50
Storage 30 -( 60-70) -80 - (45 55) -60
Shops 50 -( 65-75) -85 -(35-40) -4OJ~
Offices 17 -(55r~70) -45 not estimated -40
Hotels 12 -(55-65) -85 not estimated -85
Pubs restaurants 36 -(60-75) -55 not estimated -40
Schools 26 -(55-70) -90 not estimated -85
25
I
I I
I I
I I I I
I
I
I
I

I
I I
1 INTRODUCTION
The Home Office Fire Department is currently undertaking a wide-ranging review of fire and fire protection and the study reported here is one of this series of this particular study is
-to assess the value of sprinkdetection and structural fire refire losses in buildings
studies The objective
lers automatic fire sistance in reducing
of
Only the protection of property protection of life is the subject of
is a
considered here The separate study
This report contains a summary account of the study and includes an outline of the method of analysis as well as the main conclusions The main numerical results are included in the Appendix A full technical account of the study is given in Report l678The Value of Fire Protection in Buildings
11 The requirements of the study
The particular requirements of this study which have dictated our approach to the problem are as follows
1The value of the fire protection measures is considered from the national economy point of view The Home Office Fire middotOepartment as a Central Government department is concerned with the effects of fire and fire protection on the national economy In this study the costs of providing fire protection and the direct and consequential fire losses are therefore measured in terms of the national economic effects These costs and losses and particularly the consequential losses may be quite different from the costs and losses experienced by the owners or occupiers of the buildings
While the primary objective has been to consider the national economic effects the problem has also been considered briefly from the point of view of the owners or occupiers of the buildings
2In this study the value of the fire protection measures has been assessed in quantitative terms It was not sufficent to conclude for example that sprlnklers are very valuable The study was deSigned to provide estimates of the value of each fire protection measure in monetary terms
3The study was intended to provide an overall picture of the value of fire protection In order co provide this overall picture the analysis has been done for broad classes of buildings industrial buildings as a single group separate sectors of industry storage buildings and shops Other occupancies including offices schools hospitals and places of
1
assembly (public houses restaurants etc) have also been considered but the results for these occupancies may be less accurate because of the scarcity of relevant data The results of this analysis are therefore only applicable to each occupancy as a group or to the typical buildings in the group There may be many individual buildings in which the circumstances are different from the typical or average case and for which the results of the study do not hold However the objective of the study is the provision of an overall picture and general conclusions rather than to attempt to produce a universal formula which is detailed and accurate enough to apply to any and every individual building
12 The measurement of the value of fire protection
The value of fire protection is measured by comparing the costs of providing the protection with the reduction in fire losses resulting from the additional protection Because the costs are mainly incurred in the initial year and the benefits accrue (in probability) in future years the costs and benefits must be compared using the standard accounting technique of Discounted Cash Flow
If the initial cost of installing fire protection is C and the annual maintenance costs are c per year then discounting at 10 per cent over 20 years the total discounted cost of providing fire protection is
C + 936c
The expected reduction in fire losses in any year is Reduction in fire lossesmiddot
Probability of fire x (Fire loss if a fire occurs in an unprotected building
Fire loss if a fire occurs in a protected building)
The total discounted future benefits are equal to 936 times the expected annual reduction in fire loss
If the discounted benefits are greater than the discounted costs then the provision of fire protection is considered cost-effective
~~ The approach to the problem
In order to estimate the value of fire protectionthe costs and benefits must be calculated for each occupancy group The separate items in this calculation are
-the cost of providing fire protection -the probability of a fire occurring -the average amount of fire damage which would result if a fire occurred in an unprotected building -the average amount of fire damage which would result
2
I
I
I
I
if a fire occurred in a protected building
This proble~ has been tackled as a statistical eKercise The separate elements of the problem have been estimated from the available fire data and where data were not available additional data have been COllected A very important part of our study has been a special survey of fires In the fire survey a total of 600 fires were examined by a forensic scientist who has specialised in fire investigations accompanied by a senior Fire Prevention Officer About 100 of the fires were visited soon after the fire occurred the fire scene was examined and the officer in charge at the fire and other witnesses were questioned In the remaining fires in which the circumstances were simpler the fire report was examined and additional questions were asked of the officer in charge at the fire
The fire survey not only provided information which could not have been Obtained otherwise but also gave a clearer understanding of fire data generally and thus enabled better use to be made of the other fire data
Initially a fairly elaborate method of analysis was planned in order to produce the most accurate results and to avoid any misinterpretation of the fire data In the event it turned out that there were insufficient detailed data to support the more sophisticated methods and more importantly it could be shown that the more complex methOds would not make any significant difference to the answers The final results were derived using Simpler methods but the experience of attempting to use more complex models has given us more confidence in the final results
The analysis of the value of sprinkler protection is described in Sections 2 and 3 the analysis for detectors in Sections 4 and 5 and the effect of increased structural fire resistance is described briefly in Section 6 The final conclusions are summarised in Section 7
3
I
2 THE VALUE OF SPRINKLERS- ANALYSIS
The estimation of e~ch of the items in the calcul~tion (liEtec in Section 13) c~n be regardec as a separate problem E~ch of the items is discussed briefly in this section and the results are illustrated using the example of an industrial building with a floor ~rea of 1500 sauare metres The full results for other occupancies and building sizes ~re given in the Appendix
2~1 The cost of a sprinkler systew
The cost of the sprinkler heads and the associated pipework will depend on the size of the building which is to be protected There will also be a fixed cost for each systew for the control valves alarms and the connection to the mains The estimated cost of installing a sprinkler system in a building of simple open construction ~nd involving no special haz~rd and no additional water supplies is pound(2000 + 198 x Size of building(sam)) The costs of other sprinkler systems are given in Table Al
The maintenance cost in future years is estimated to be about 1 per cent of the initial capital cost
22 The probability of a fire occurring
The probability of a fire occurring will vary with the occupancy and the size of the building The probability is estimated by relating the number of fires which occur in buildings of a given size and occupancy to the number of buildings of that size and occupancy at risk The probability of a fire in a large building is greater than in a swall building of the same occupancy but the risk of a fire does not increase in direct proportion to the building size The probability of a fire is of the form
Probability z aB where B is the floorspace of the building and a and c are the estiwated parameters for each occupancy
The estimated probability of a fire in an industrial building is given by
Probability z 00017B0middot3 which is eaual to a probability of 0082 in a 1500 square metre building or on average one fire every 12 years
Table A2 shows the probabilitity of a fire in other occupancies
~~3 The expected fire damage in an unprotected building
The average area of fire damage which would occur in an unprotected building was estimated from an analysis of the fires in buildings which did not have sprinklers or detectors The average area of fire damage is the average of many small fires
4
anc ltl f e ~ 9 E fires o nc the ave rage de pends on the size of the building middotsimply because large fires cannot occur in small buildings The average area of fire damage is estimated in the form
Fire size dBmiddot bullE
where B is the building floorspace and d and e are estimated parameters For industrial buildings tE~ estimated fire size is
Fire size 2 25 r E
and the average fire size in an unprotected building of 1500 souare metres is therefore 60 souare metres
The estimated areas of fire damage in buildings of other occupancies are given in Table A3
I 1~4 The expected fire damage in a building fitted with sprinklers
I
The expected fire da~age if a fire breaks out in a building in which sprinklers are installed has been estimated by considering four separate situations which might arise There may be insufficient heat to activate the sprinkler heads the sprinklers may not operate because the system has been turned off or because of a mechanical defect the sprinklers might operate and control or extinguish the fire or the fire may grow very large despite the operation of the sprinklers These separate outcomes are not of interest in their own right but subdividing the problem in this way provides more insight and produces a more reliable result
For an industrial building of 1500 sauare metres the probabilities of each outcome and the average area of fire damage in each case are
Sprinkler not activated 57 S sqm Sprinkler failure 09S 130 sOm Satisfactory operation 41 IS sOm Fire middotout of control 09S SOO sqm
The average damage if sprinklers are installed is therefore 0S7xS + 0009Sx130 + 04lxlS + O009SxSOO = 16 sqm
Predicted performance in other occupancies is shown in Table A4
2S The fire loss incurred
The relationship between fire losses and the area of fire damage has been investigated and it has been shown that the fire loss can be estimated simply by multiplying the area of fire damage by an average unit loss For industrial buildings the direct loss (to the national economy) is estimated to be pound140sqm of fire
I damage (The direct loss as estimated by insurance companies may be about IS per cent higher) Direct losses in other occupancies are shown in Table AS
A study of conseouential losses has shown that for manufacturing industry such losses are from the national economy point of
I 5
view equ~l to ~bout 60 of direct losses although the consequenti~l losses to the firm may be considerably greater
~6 The estimated value of sprinklers
For the example of ~n industrial building of 1500 square metres the initi~l capit~l cost of ~ sprinkler system would be pound5000 ~nd the total discounted cost of providing sprinkler protection including future m~intenance costs pound5500
If a fire occurred ~nd the building were not protected the ~verage area of fire damage would be 60 square metres involving ~ direct loss of 60x140-pound8400 and ~ total loss of pound8400xl6-pound13400 If the building were sprinklered the ~verage are~ of fire dam~ge would be 16 square metres involving a direct loss of pound2300 and ~ total loss of pound3700 The provision of sprinklers will therefore have reduced the expected fire dam~ge by 73
The probability of a fire per ye~r is 0082 and the expected reduction in fire losses per ye~r is therefore 0082x(pound13400-3700)- pound800 The total discounted benefit due to the reduced fire loss is thus pound7400 which exceeds the (discounted) cost of providing the sprinklers The provision of sprinkler protection in these buildings is therefore cost-effective from the n~tional economy point of view
The v~lue of sprinklers can be calcul~ted in this way for buildings of other occupancies ~nd other sizes
6
I
3 THE VALUE OF SPRINKLERS - RESULTS
31 The value of sprinklers to the national economy
The value of sprinkler protection calculated from the national economy point of view has been estimated for buildings of different occupancies and different sizes and the results are summarised in a graohical form in Figure 1 Figure 1 shows the Net Present Value of sprinkler protection (the discounted benefits minus the discounted costs) in different occupancies Where the Net Present Value is greater than zero sprinkler protection can be said to be cost-effective
The results show that for the overall industrial group of buildings sprinklers are cost-effective in buildings larger than
I 800 sauare metres When the different sectors of industry are considered separately the minimum building size above which sprinklers are of value is between 300 and 1000 square metres for most of the industries The separate industries in which sprinklers appear to show the greatest economic value are Other Manufacturing (which includes rubber and plastic products) Chemicals Food Timber and Electrical Engineering It is estimated that sprinklers would be cost-effective in about 50 per cent of the buildings in manufacturing industry and these buildings account for about 90 oer cent of the total floorspace in manufacturing industry
Sprinklers also aopear to be of value in the larger shops Snrinklers do not aopear to be of value (at least when only property protection is considered) in hospitals offices schools and pubs and restaurants
I
One perhaps surprising result is that sprinklers do not appear to be cost-effective in storage buildings Although the fires in storage buildings are large on average and sprinklers are very effective in reducing this fire damage the probability of a fire occurrinq is low and the expected reduction in fire damage is therefore not sufficient to - offset the cost of providing sorinklers This result far all storage buildings considered as
I a single group hides the fact that the circumstances in
I different tyPes of storage buildings can be very different If the storage group is subdivided it can be shown that sprinklers will be of net value in high risk high value storage buildings
Although the results of this analysis show that sprinklers are cost-effective in larger hotels there is reason to suspect that because of the inadeQuacy of the data used in the analysis these results overestimate the value of sprinklers in reducing property damage in hotels
7 I
32 The present provision of sprinklers
The present provision of sprinkler protection in manufacturing industr y has been estimated by a survey of manufacturing industry The survey results show that 13 per cent of buildings have complete sprinkler protection anc a further 4 per cent have partial ~prinkler protection Sprinklers tend to be installed in the larger buildings and it is estimated that a total of about 3S per cent of the floorspace in manufacturing industry is protected by sprinklers
No estimates of the extent occupancies are available
of sprinkler protection in other
33 The value of sprinklers to the firm
The value of sprinklers briefly in this study
to the firm has only been considered
Firms may install fire protection because of their awareness of the risks of fire and their wish to reduce these risks or they may install protection mainly in order to secure more advantageous terms for fire insurance Estimates have been made of the financial incentives to the firm to install fire protection
Insurance companies offer premium discounts of between 60 per cent and 90 per cent for approved sprinkler systems By making some assumptions to compensate for the lack of detailed information about insurance rates it is possible to estimate the value to the firm of installing sprinklers in buildings of different sizes
The estimates of the value to the firm of providing sprinklers in industrial buildings show that the value to the firm is broadly similar to the value to the economy ie where sprinklers are of value to the economy there is a financial incentive to the firm to install this protection In development areas where capital grants are available to firms who install sprinklers the financial incentives to install sprinklers are much greater
8
4 THP VALUP ~p DETECTOPS - ANALYSIS
41 The cost of detectors
Jt is estim8ted that the cost of installing either heat or smoke detectors in 8 building of simple open construction is 8poroximately pound11 per square metre of floorspace In 8ddition there will be 8 cost of 8bout pound1500 for the control equipment If 8 direct line system is inst8lled there will 8lso be a connection ch8rge The initi8l costs 8nd the future m8intenance 8nd line rent81 ch8rges for local 8l8rm and direct line systems 8re given in Table Al
~ 2 The estimated reduction in fire d8m8ge
I
I Detectors reduce fire d8m8ge by giving e8rly w8rning of 8 fire 8nd thus 8llowing people to intervene e8rlier The effectiveness of detectors depends on where people 8re 8t the time the fire occurs how r8pidly the fire is growing how people respond when they hear the 8l8rm 8nd how cap8ble people 8re of de8ling with the fire when they first 8rrive on the scene The effectiveness of detectors is therefore much more difficult to predict
The b8sic f8ctors which determine the effect of detectors in reducing fire d8m8ge C8nnot be deduced from the main fire st8tistics and we h8ve therefore had to rely very he8vily in this p8rt of the 8n81ysis on the inform8tion derived in our own fire survey For e8ch of the fires eX8mined in our survey 8n 8ssessment W8S m8de of the 8mount of fire d8m8ge which might h8ve occurred if detectors h8d been inst8lled This 8ssessment W8S m8de in the light of the 8ctu81 circumst8nces of e8ch fire 8nd
I particu18rly the estim8ted r8te of development of the fire in its e8rly st8ges 8nd the 8ssumed 8bility of the people in the vicinity to respond to the 818rm 8nd deal with the fire
I This 8ssessment of the d8m8ge which might h8ve occurred together with the record of the fire d8m8ge which 8Ctu8l1y occurred could be used directly to estim8te the possible reduction in fire d8m8ge due to detectors However in order to widen the b8sis of the estim8te 8n 8ttempt h8S been made to gener8lise the survey results by reference to the complete s8mple of fires for which a K433SAF2 fire report W8S 8vai18ble The K433SAF2 fire reports include 8 record of the 10c8tion of the ne8rest person 8t the time of the fire The possible reduction in fire d8m8ge C8n be estim8ted 8S 8 function of the C8use of the fire b8sed on the det8iled experience of the fire survey
The estimation of the reduction in fire dam8ge from the b8sic fire st8tistics is not entirely s8tisf8ctory 8S it depends on 8 v8riety of 8ssumptions some of which 8re difficult to justify Nevertheless the gener8l 8nalysis h8S been used in this study bec8use even though it m8Y not provide 8n independent estimate it does provide 8 better underst8nding of the estim8te of the
9
I
I
I effectiveness of detectors
For the example of an industrial building of area 1500 square metres the estimated effect of direct line detectors is as follows
Proportion Damage Estimated of fires if unprotected reduction
Person in room 55 40 sqm 0 Person in bldg 18 50 sqm 65-85 Person not in 27 105 sqm 65-85 building All fires 100 60 sqm 40-55
The estimation of the reduction in damage due to direct line and local alarm detectors in buildings of different occupancies is shown in Table A6 This Table shows the estimates produced through the general analysis as well as the average assessed reduction in the fire survey The generalised estimates cover a range of values reflecting the degree of uncertainty in the estimation procedure and are generally lower than the survey estimates reflecting the cautionary nature of the generalised analysis
43 The calculation of the value of detectors
Taking the example of a 1500 square metre industrial building again the initial cost of a direct line detector system is about pound3400 and the future annual running costs are pound280 (see Table Al) The total discounted costs are thus pound6000
The average 1055 per fire in an unprotected building would be pound13400 (from Tables A2 and A3 and including consequential losses of 60 per cent) If the fire damage is reduced by 40 per cent by the installation of automatic fire detection (Table A6) then the expected annual benefits would be 0082x13400xO4-pound440 The discounted value of the total future benefits is then pound4100 In this case the cost of providing direct line detectors is greater than the expected benefits and from the national economy point of view the provision of detectors in these buildings is not cos t-effecti ve
10
5 THE VALUE OF DETECTORS - RESULTS
51 The value of detectors to the national economy
I The value of automatic fire detection calculated from the national economy point of view has been estimated for buildings of different sizes and different occupancies The results for
I direct line alarm systems are summarised in Figure 2 and the results for local alarm systems in Figure 3
In these Figures a range of values are shown for industrial buildings This range reflects the alternative range of estimates of the reduction in fire damage Only a single estimate of the economic value of detectors is shown for other occupancies in order to simplify the graphs The single line shown for the other occupancies is the mid-point of the range of values
In industrial buildings larger than about 2000 square metres (22 per cent of the buildings in manufacturing industry exceed this size) direct line detectors appear to be of economic value Somewhat surprisingly detection systems with local alarms appear to be of equal or greater economic value than systems with direct line alarms This result reflects the experience of the fire survey in which it was judged that in many cases a local alarm would have brought people to the fire promptly and that these people would have been able to extinguish or at least to contain the fire Although direct line systems can achieve a greater reduction in fire damage this additional benefit does not offset the higher cost of providing the direct line system
The only other occupancy in which detectors appear to be of economic value is shops and here it is the direct line systems which show the greater benefit
I 52 The present provision of automatic fire detection
The results of the survey of manufacturing industry show that detectors are installed in abou t 5 per cent of buildings covering a total of about 13 per cent of the total floorspace
The industr ies with the proportionately highest degree of automatic fire detection are Electrical Engineering and Chemicals
53 The value of detectors to the firm
Insurance companies offer discounts of up to 125 per cent for the installation of approved detector systems Because of the way in which premiums are calculated this is equivalent to a discount of up to about 20 per cent on the premium payable
Our estimates of the value to the firm of installing detectors
11
I
I I
suggest that even in the largest industrial buildings the costs of providing a detector system will exceed the benefits of the reduction in premiums (Although there may of course be individual cases where this generalisation development areas where government grants are for capital investment there may be a small to firms to install detectors in larger build
is not payable
financial ings
true) In to firms incentive
54 The reliability of detectors
Studies of the reliability of the present direct line fire detection systems have shown that for every genuine alarm signalled by the system there are more than 10 false and accidental alarms A false alarm rate as high as this could cause serious problems for fire brigades if there was widespread use of direct line detector systems However the technology is changing rapidly in this area and the reliability of automatic fire detection systems may improve in the future
12
I 6 THE EfFECT Of IMPROVED STRUCTURAL fIRE RESISTANCE
The effect of improved fire resistance in the internal structure of buildings can only be estimated from the information obtained in the examination of buildings in the fire survey At each building visited in the survey an assessment was aade of the amount of fire damage which might have occurred if all the internal surfaces (walls doors ceilings etc) had a minimum of 30 minutes fire resistance
I
Improved fire resistance would have reduced the amount of fire damage in some of the fires which spread beyond the room of origin The survey assessments take into account the fact that in some of the larger fires improved fire resistance would have had no effect because for example doors were left open or because the fire was so severe and had burned for so long that even the more resistant compartment wallS would have been penetrated
No estimate was made of the cost of bringing the structure up to the higher standard although it was clear that the cost would be substantial in many cases
In the survey it was estimated that increased structural fire resistance would have reduced the average amount of fire damageI by 45 per cent in industrial buildings 50 per cent in storage buildings and 55 per cent in shops
I
I
13
I I
7 CO~ CLUSI ONS
Before presenting any conclusions the limitations of the study should first be reiterated Firstly only the protection of property has been considered in this study and not the protection of life Secondly only complete sprinkler systems complete detector systems and complete upgrading of the internal structural fire resistance have been considered The value of partial fire protection systems (protecting only the most valuable parts of the building or the highest risks) or mixec systems (part sprinklers and part detectors) or other forms of fire protection (venting CO 2 flooding etc) have not been considered Thirdly a broad view of the problem has been taken ana results have been derived only for the major occupancy grcups There may well be many special cases or individual buildings for which the general results are not valid
The objective of this study was to derive an overall picture of the value of fire protection measures from the national economy point of view This overall picture is presented in Figures 1-3 The main findings of the study are as follows
1 Sprinklers are very effective in reducing fire damage and the reduction in dam~e is estimated to be 70-90 per cent in buildings of different sizes and occupancies When the cost of providing sprinklers is compared with the saving in fire losses the results of this study indicate that sprinklers are cost-effective in the medium and large industrial buildings in large shops and in high value high risk storage buildings
2 From the firms point of view there is a strong incentive to install sprinklers in order to benefit from the premium reductions offered by insurance companies However far fewer firms have actually taken advantage of these incentives than would benefit from doing so The question arises of why firms have been reluctant to take advantage of these financial incentives
3 It is estimated that automatic fire detection can reduce fire damage by about 50 per cent on average in industrial buildings and even more in other occupancies When these savings in fire losses are compared with the cost of providing detectors it appears that automatic fire detection is of economic value in the larger industrial buildings and the largest shops However if the present high false alarm rate is not improved wider use of direct line detectors might cause serious problems for fire brigades
It should be noted that the Fire Offices Committee representing fire insurers generally have reported that their own estimates of the reduction in fire damage effected by detectors is well below the figure quoted here Although the figures provided by FOC have not been supported by any detailed analysis they are
14
I bull
I nevertheless based on many years experience of underwriting fire risks Only further detailed study could resolve which of the two estimates is closer to the true value although the Home Office has no plans for such work to be carried out
4 From the firms point of view there is relatively little financial incentive to install detectors
5 It is estimated that improved structural fire resistance might reduce fire losses by about 50 per cent No estimate has been made of the cost of these structural improvements
I
I
I I
I I I
15
I
Figure 1 THE VALUE OF SPRINKLERS IN DIFFERENT OCCUPANCIES
8000
7000
6000
5000
4000
Cl) l iii 3000 gt c Cl) III Cl) a 2000 Cl)
Z
1000
o ~____L--+~____-L~__~____-L____~____~__~
- 1000
- 2000
Building size (m2)
Storage
Pubs Restaurants etc (7)
- 4000
16
-3000
I
I Figure 2 THE VALUE OF DIRECT LINE DETECTORS IN
I 7000
6000
5000
I 4000
Il l iii gt 3000 c Il ~ QI li 2000 z
I 1000
I 0
-1000
I -2000
-3000
- 4000
DIFFERENT OCCUPANCIES
Shops
75 Reduction
Storage 70 Reduction
Pubs etc
60~
SChoolS 70 Reduction~ Offices 55 Reduction
V
17
I
Figure 3 THE VALUE OF LOCAL ALARM DETECTORS IN DIFFERENT OCCUPANCIES
8000 r
7000
6000
5000
4000
Q)
J
~ 3000 c Q) Vl Q) -Cl 2000 Q)
Z
1000
o
- 1000
-2000
- 3000
-4000
50 Reduction
Shops 35 Reduction
Storage 50 Reduction
18
I
I I
APPEtWIX A
TABLES OF THE MAIN NUMERICAL RESULTS
I
I I I I I
19
I I
I
I I
I
I I I I I
I I
I I
TABLE A1 THE COST OF FIRE PROTECTION (1977 PRICES)
SPRINKLER SYSTEMS- in buildings of simple open construction not requiring pumps or additional water supplies
Initial cost
I Extra low hazard pound2000 + 083 x size of bUilding(m~) Ordinary hazard pound2000 + 198 x size of building(m )2Extra high hazard pound2000 + 267 x size of building(m )
Annual maintenance cost
Approximately 1 of initial cost
I I
AUTOMATIC DETECTION- in buildings of simple open construction
1nitial cost
Local alarm system pound1500 + 11 x size of bUilding(m~)
I Di rect line system pound1750 + 11 x size of building(m )
Annual maintenance and line rental costs
Local alarm system pound50 + 0025 x size of building(m~) Direct line system pound240 + 0025 x size of building(m )
I
I I I
20
I
TABLE A2 THE PROBABILITY OF A FI R OCC URRIlFu
OCCUPANCY (SIC ORDER)
1----------------------INDUSTRIAL BUILDINGS
PROBABILITY OF FIRE PER YEAR a BC PROBABILQY OF FIRE
IN 15OOm BUILDING
a -4-------
c
~------~------------~
Food drink and tobacco (Ill)
00011 OGc 0086
Chemicals and allied (V) 00069 046 021
bull Mechanical engineering (VII)
000011 075 0027
Electrical engineering (IX)
000061 059 0046
Vehicles (XI) 000012 086 0062
bull Metal goods not elseshyvhere specified (XII)
000158 054 0082
Textiles (XIII) 00075 055 0097
Timber furniture (XVII) 000057 077 010
Paper printing and publishing (XVIII)
0000069 0054
Other manufacturing (XIX)
00084 041 017
All manufacturing industry (Ill-XIX)
arHER OCCUPANCIES
00017 055 0082
Storage 000067 05 0026
Shops 0000066 10 0099
Offices 0000059 09 0043
Hotels etc 000008 10 012
Hospi tals etc 00007 075 017
bullbull Pubs restaurants etc (10) (01 )
Schools 00002 075 0048
Note Some of the fires vhich should be included in the Mechanical engineering sector may have been classified as Metal goods nes This vould result in an underestimate of the probability of fire for Mechanical engineering and an overestimate for Metal goods If the tvo groups are combined the estimated probabili ty of fire is 000086 1356 bull
middotValues for Assembly are assumed There vas insufficient information available to estimate the probability of fire in this occupancy group
21
I
TABLE A3 THE ESTIMATED FIRE DAMAGE IF ONLY THE MINIMUM LEVEL OF IRE PROTECTION IS PROVIDED
I I
I I I
I I
I I
OCCUPANCY (SIC O~vER) AVERAGE FIRE SIZE AS A rUNCTION OF BUILDING SIZE(m 2 )
SAMPLE SIZE
AVERAGE FIRE SIZE IN A B I~ NG 0 15(XluhlOORSPACE
INDUSTRIAL BUILDINGS
All industry 6496 60
Food drink amp tobacco (Ill)
313 73
Chemicals ampallied (V) 516 28
Mechanical engineering (VII )
248 44
Electrical engineering (IX )
174 64
Vehicles (XI) 080 g58 181
Metal goods not elseshywhere specified (XII)
64 jj23 561
Textiles (XIII ) 2 6 ~)9 399 45
Timber furniture (XVII ) 4 B21
2 2 393 112
Paper printing amp pUblishing (XVIII)
6 7 ~)6 198 93
Other manufacturing (XIX)
OTHER OCCUPANCIES
87 38
B 228 140
Storage 1398 157
Shops 50
095 B 2662 37
Offices 622 15
Hotels etc 22
B 973 27
Hospitals 20
936 5
Pubs restaurants etc 76 B 2908 33
Schools etc 28 57
B 906 42
22 I
~ABLE M IBE A VElUGE llE4 01 lIRE DAlIAGE IF SPRIIiKLERS ARE IIISTALLD
fRlfKirpi ~~ SPRlI)(L OPJAA[D ampPRIf~ I YtS SPF ~KIrnS rAI ur
~crIV JL SAl ]St AtTOR] U middotCOIIL er CO~i OCCUPIlCy (SIC CiWUl )
Aydllolteerll ~)PrYpn Prepn ~ dANr(~ ) PTopn h~(2) hdt(~ )Pr0in
It i middot~ITfd AL 31JlllNG
All induetr-J 13 p~ 8022I lt3 022x bullI(~955bull 3middot57 5 gt~ -66
a78Bmiddot~food dr~ toouCO ampJ OZb 2 0101 1 Illlt68bull bull (Ill ) -67
Bmiddot 1202h O 60 2 9t2looChellicil15 ampl11 02gt29~ 89 (V) -30
029 l 76rechmiddotnica elaquo1necriTf -2 961bullbull 580258 gtOOx~ (nl) -cn
B 7EhctriClll lr1n~r1Damp 1 02x~ )09 5 (96Bbullbull 5~ 01z53 (Il ) -ltgt69
tb1c1u (Xl) 87 62 E gtDUx 966x 3 9 01 3 -67
IMete roods cot l6Ishy gt 022z5C 6968 bull bull 58 0lx58 S3 0 bull 2l otltrtl ~lcihd (XlI) -072
uUl (XlII ) 2lt0Ux47 Efu-47 016bullbull475~I gt~55 middot-79I
t1~lgteT bull lUT~j tlJt (Xll) 0Z2z602 ~ S 96360 01bullbull 60 gt - B )6hpn Prictinf 022x60 9562060 019x6O B2 5publiahinl (nUl) -ltgt
B 02b )0Oth~r canufampetnr1n~ 70 290 06lO IV95x~ 30 (nxl -9
OHlI OCCtIPAN Ci rs 11 5lpoundtorace 0Z2z1(2 4bgt 9282076 050lt7pound (6
~O6
pound1ope 2 B 00022J 4555 Oh49sBx1t5 B2
(Off1e ) ( ) ( () )275 ( ( )) ( )) (
1WItela ~tc ( ( )) ( )106 ) ( -19 middot( )( ) ( ) )(
( ) ( ) ( ) ( ) )H04fIitala tc ( ( )) ( ()9
( 09 2 ) ( 0222o5~) 2 I(72oi (Q052oi gt5( ( )Pub_ atamplltampJl ete ) ( )) (9 middot ( ) ( ) ( ) )~19 ( ( ) ( ) ( ( )I
Sehoola ate ( ) ( ) ( ( )5middot5 bull )1 I ( ( )) 19 ( ) ( )
TABLE A5 THE AVERAGE DIRECT LOSS PER UNIT AREA OF FIRE DAMAGE
I I
I
I I
OCCUPANCY (SIC ORDER ) UNIT LOSS (poundsqm )
INDUSTRIAL BUILDINGS
All industry 140
Food drink amp tobacco ltrII)
Chemicals amp allied (V)
270
Mechanical engineering ( VII )
290
Electrical engineering (IX )
320
Vehicles (xI) 150
Metal goods not elseshywhere specified (XII)
240
Textiles (XIII) 210
Timber furniture (XVII) 130
Paper printing amp publishing (XVIII )
90
Other manufacturing (XIX )
OTHER OCCUPANCIES
120
Storage 120
Shops 160
Offices 150
Hotels etc 130
Hospitals etc 160
Pubs restaurants etc 100
Schools 110
24 I I
I TABLE J~ THE ESTIMATED REDUCTION IN FIRE DAMAGE DUE TO DETECTORS - ALL FIRES
Reduction in fire damage
Occupancy Survey
sample size lIith direct line alarm lIith local alarm
Estimated from Estimated Eetilllllted from Eetimated K433SAF2 in Survey K433SAF2 in Survey
Industry 210 -(40~55) -55 -(35-50) -50
Storage 30 -( 60-70) -80 - (45 55) -60
Shops 50 -( 65-75) -85 -(35-40) -4OJ~
Offices 17 -(55r~70) -45 not estimated -40
Hotels 12 -(55-65) -85 not estimated -85
Pubs restaurants 36 -(60-75) -55 not estimated -40
Schools 26 -(55-70) -90 not estimated -85
25
I
I I
I I
I I I I
I
I
I
I

I
I
I
if a fire occurred in a protected building
This proble~ has been tackled as a statistical eKercise The separate elements of the problem have been estimated from the available fire data and where data were not available additional data have been COllected A very important part of our study has been a special survey of fires In the fire survey a total of 600 fires were examined by a forensic scientist who has specialised in fire investigations accompanied by a senior Fire Prevention Officer About 100 of the fires were visited soon after the fire occurred the fire scene was examined and the officer in charge at the fire and other witnesses were questioned In the remaining fires in which the circumstances were simpler the fire report was examined and additional questions were asked of the officer in charge at the fire
The fire survey not only provided information which could not have been Obtained otherwise but also gave a clearer understanding of fire data generally and thus enabled better use to be made of the other fire data
Initially a fairly elaborate method of analysis was planned in order to produce the most accurate results and to avoid any misinterpretation of the fire data In the event it turned out that there were insufficient detailed data to support the more sophisticated methods and more importantly it could be shown that the more complex methOds would not make any significant difference to the answers The final results were derived using Simpler methods but the experience of attempting to use more complex models has given us more confidence in the final results
The analysis of the value of sprinkler protection is described in Sections 2 and 3 the analysis for detectors in Sections 4 and 5 and the effect of increased structural fire resistance is described briefly in Section 6 The final conclusions are summarised in Section 7
3
I
2 THE VALUE OF SPRINKLERS- ANALYSIS
The estimation of e~ch of the items in the calcul~tion (liEtec in Section 13) c~n be regardec as a separate problem E~ch of the items is discussed briefly in this section and the results are illustrated using the example of an industrial building with a floor ~rea of 1500 sauare metres The full results for other occupancies and building sizes ~re given in the Appendix
2~1 The cost of a sprinkler systew
The cost of the sprinkler heads and the associated pipework will depend on the size of the building which is to be protected There will also be a fixed cost for each systew for the control valves alarms and the connection to the mains The estimated cost of installing a sprinkler system in a building of simple open construction ~nd involving no special haz~rd and no additional water supplies is pound(2000 + 198 x Size of building(sam)) The costs of other sprinkler systems are given in Table Al
The maintenance cost in future years is estimated to be about 1 per cent of the initial capital cost
22 The probability of a fire occurring
The probability of a fire occurring will vary with the occupancy and the size of the building The probability is estimated by relating the number of fires which occur in buildings of a given size and occupancy to the number of buildings of that size and occupancy at risk The probability of a fire in a large building is greater than in a swall building of the same occupancy but the risk of a fire does not increase in direct proportion to the building size The probability of a fire is of the form
Probability z aB where B is the floorspace of the building and a and c are the estiwated parameters for each occupancy
The estimated probability of a fire in an industrial building is given by
Probability z 00017B0middot3 which is eaual to a probability of 0082 in a 1500 square metre building or on average one fire every 12 years
Table A2 shows the probabilitity of a fire in other occupancies
~~3 The expected fire damage in an unprotected building
The average area of fire damage which would occur in an unprotected building was estimated from an analysis of the fires in buildings which did not have sprinklers or detectors The average area of fire damage is the average of many small fires
4
anc ltl f e ~ 9 E fires o nc the ave rage de pends on the size of the building middotsimply because large fires cannot occur in small buildings The average area of fire damage is estimated in the form
Fire size dBmiddot bullE
where B is the building floorspace and d and e are estimated parameters For industrial buildings tE~ estimated fire size is
Fire size 2 25 r E
and the average fire size in an unprotected building of 1500 souare metres is therefore 60 souare metres
The estimated areas of fire damage in buildings of other occupancies are given in Table A3
I 1~4 The expected fire damage in a building fitted with sprinklers
I
The expected fire da~age if a fire breaks out in a building in which sprinklers are installed has been estimated by considering four separate situations which might arise There may be insufficient heat to activate the sprinkler heads the sprinklers may not operate because the system has been turned off or because of a mechanical defect the sprinklers might operate and control or extinguish the fire or the fire may grow very large despite the operation of the sprinklers These separate outcomes are not of interest in their own right but subdividing the problem in this way provides more insight and produces a more reliable result
For an industrial building of 1500 sauare metres the probabilities of each outcome and the average area of fire damage in each case are
Sprinkler not activated 57 S sqm Sprinkler failure 09S 130 sOm Satisfactory operation 41 IS sOm Fire middotout of control 09S SOO sqm
The average damage if sprinklers are installed is therefore 0S7xS + 0009Sx130 + 04lxlS + O009SxSOO = 16 sqm
Predicted performance in other occupancies is shown in Table A4
2S The fire loss incurred
The relationship between fire losses and the area of fire damage has been investigated and it has been shown that the fire loss can be estimated simply by multiplying the area of fire damage by an average unit loss For industrial buildings the direct loss (to the national economy) is estimated to be pound140sqm of fire
I damage (The direct loss as estimated by insurance companies may be about IS per cent higher) Direct losses in other occupancies are shown in Table AS
A study of conseouential losses has shown that for manufacturing industry such losses are from the national economy point of
I 5
view equ~l to ~bout 60 of direct losses although the consequenti~l losses to the firm may be considerably greater
~6 The estimated value of sprinklers
For the example of ~n industrial building of 1500 square metres the initi~l capit~l cost of ~ sprinkler system would be pound5000 ~nd the total discounted cost of providing sprinkler protection including future m~intenance costs pound5500
If a fire occurred ~nd the building were not protected the ~verage area of fire damage would be 60 square metres involving ~ direct loss of 60x140-pound8400 and ~ total loss of pound8400xl6-pound13400 If the building were sprinklered the ~verage are~ of fire dam~ge would be 16 square metres involving a direct loss of pound2300 and ~ total loss of pound3700 The provision of sprinklers will therefore have reduced the expected fire dam~ge by 73
The probability of a fire per ye~r is 0082 and the expected reduction in fire losses per ye~r is therefore 0082x(pound13400-3700)- pound800 The total discounted benefit due to the reduced fire loss is thus pound7400 which exceeds the (discounted) cost of providing the sprinklers The provision of sprinkler protection in these buildings is therefore cost-effective from the n~tional economy point of view
The v~lue of sprinklers can be calcul~ted in this way for buildings of other occupancies ~nd other sizes
6
I
3 THE VALUE OF SPRINKLERS - RESULTS
31 The value of sprinklers to the national economy
The value of sprinkler protection calculated from the national economy point of view has been estimated for buildings of different occupancies and different sizes and the results are summarised in a graohical form in Figure 1 Figure 1 shows the Net Present Value of sprinkler protection (the discounted benefits minus the discounted costs) in different occupancies Where the Net Present Value is greater than zero sprinkler protection can be said to be cost-effective
The results show that for the overall industrial group of buildings sprinklers are cost-effective in buildings larger than
I 800 sauare metres When the different sectors of industry are considered separately the minimum building size above which sprinklers are of value is between 300 and 1000 square metres for most of the industries The separate industries in which sprinklers appear to show the greatest economic value are Other Manufacturing (which includes rubber and plastic products) Chemicals Food Timber and Electrical Engineering It is estimated that sprinklers would be cost-effective in about 50 per cent of the buildings in manufacturing industry and these buildings account for about 90 oer cent of the total floorspace in manufacturing industry
Sprinklers also aopear to be of value in the larger shops Snrinklers do not aopear to be of value (at least when only property protection is considered) in hospitals offices schools and pubs and restaurants
I
One perhaps surprising result is that sprinklers do not appear to be cost-effective in storage buildings Although the fires in storage buildings are large on average and sprinklers are very effective in reducing this fire damage the probability of a fire occurrinq is low and the expected reduction in fire damage is therefore not sufficient to - offset the cost of providing sorinklers This result far all storage buildings considered as
I a single group hides the fact that the circumstances in
I different tyPes of storage buildings can be very different If the storage group is subdivided it can be shown that sprinklers will be of net value in high risk high value storage buildings
Although the results of this analysis show that sprinklers are cost-effective in larger hotels there is reason to suspect that because of the inadeQuacy of the data used in the analysis these results overestimate the value of sprinklers in reducing property damage in hotels
7 I
32 The present provision of sprinklers
The present provision of sprinkler protection in manufacturing industr y has been estimated by a survey of manufacturing industry The survey results show that 13 per cent of buildings have complete sprinkler protection anc a further 4 per cent have partial ~prinkler protection Sprinklers tend to be installed in the larger buildings and it is estimated that a total of about 3S per cent of the floorspace in manufacturing industry is protected by sprinklers
No estimates of the extent occupancies are available
of sprinkler protection in other
33 The value of sprinklers to the firm
The value of sprinklers briefly in this study
to the firm has only been considered
Firms may install fire protection because of their awareness of the risks of fire and their wish to reduce these risks or they may install protection mainly in order to secure more advantageous terms for fire insurance Estimates have been made of the financial incentives to the firm to install fire protection
Insurance companies offer premium discounts of between 60 per cent and 90 per cent for approved sprinkler systems By making some assumptions to compensate for the lack of detailed information about insurance rates it is possible to estimate the value to the firm of installing sprinklers in buildings of different sizes
The estimates of the value to the firm of providing sprinklers in industrial buildings show that the value to the firm is broadly similar to the value to the economy ie where sprinklers are of value to the economy there is a financial incentive to the firm to install this protection In development areas where capital grants are available to firms who install sprinklers the financial incentives to install sprinklers are much greater
8
4 THP VALUP ~p DETECTOPS - ANALYSIS
41 The cost of detectors
Jt is estim8ted that the cost of installing either heat or smoke detectors in 8 building of simple open construction is 8poroximately pound11 per square metre of floorspace In 8ddition there will be 8 cost of 8bout pound1500 for the control equipment If 8 direct line system is inst8lled there will 8lso be a connection ch8rge The initi8l costs 8nd the future m8intenance 8nd line rent81 ch8rges for local 8l8rm and direct line systems 8re given in Table Al
~ 2 The estimated reduction in fire d8m8ge
I
I Detectors reduce fire d8m8ge by giving e8rly w8rning of 8 fire 8nd thus 8llowing people to intervene e8rlier The effectiveness of detectors depends on where people 8re 8t the time the fire occurs how r8pidly the fire is growing how people respond when they hear the 8l8rm 8nd how cap8ble people 8re of de8ling with the fire when they first 8rrive on the scene The effectiveness of detectors is therefore much more difficult to predict
The b8sic f8ctors which determine the effect of detectors in reducing fire d8m8ge C8nnot be deduced from the main fire st8tistics and we h8ve therefore had to rely very he8vily in this p8rt of the 8n81ysis on the inform8tion derived in our own fire survey For e8ch of the fires eX8mined in our survey 8n 8ssessment W8S m8de of the 8mount of fire d8m8ge which might h8ve occurred if detectors h8d been inst8lled This 8ssessment W8S m8de in the light of the 8ctu81 circumst8nces of e8ch fire 8nd
I particu18rly the estim8ted r8te of development of the fire in its e8rly st8ges 8nd the 8ssumed 8bility of the people in the vicinity to respond to the 818rm 8nd deal with the fire
I This 8ssessment of the d8m8ge which might h8ve occurred together with the record of the fire d8m8ge which 8Ctu8l1y occurred could be used directly to estim8te the possible reduction in fire d8m8ge due to detectors However in order to widen the b8sis of the estim8te 8n 8ttempt h8S been made to gener8lise the survey results by reference to the complete s8mple of fires for which a K433SAF2 fire report W8S 8vai18ble The K433SAF2 fire reports include 8 record of the 10c8tion of the ne8rest person 8t the time of the fire The possible reduction in fire d8m8ge C8n be estim8ted 8S 8 function of the C8use of the fire b8sed on the det8iled experience of the fire survey
The estimation of the reduction in fire dam8ge from the b8sic fire st8tistics is not entirely s8tisf8ctory 8S it depends on 8 v8riety of 8ssumptions some of which 8re difficult to justify Nevertheless the gener8l 8nalysis h8S been used in this study bec8use even though it m8Y not provide 8n independent estimate it does provide 8 better underst8nding of the estim8te of the
9
I
I
I effectiveness of detectors
For the example of an industrial building of area 1500 square metres the estimated effect of direct line detectors is as follows
Proportion Damage Estimated of fires if unprotected reduction
Person in room 55 40 sqm 0 Person in bldg 18 50 sqm 65-85 Person not in 27 105 sqm 65-85 building All fires 100 60 sqm 40-55
The estimation of the reduction in damage due to direct line and local alarm detectors in buildings of different occupancies is shown in Table A6 This Table shows the estimates produced through the general analysis as well as the average assessed reduction in the fire survey The generalised estimates cover a range of values reflecting the degree of uncertainty in the estimation procedure and are generally lower than the survey estimates reflecting the cautionary nature of the generalised analysis
43 The calculation of the value of detectors
Taking the example of a 1500 square metre industrial building again the initial cost of a direct line detector system is about pound3400 and the future annual running costs are pound280 (see Table Al) The total discounted costs are thus pound6000
The average 1055 per fire in an unprotected building would be pound13400 (from Tables A2 and A3 and including consequential losses of 60 per cent) If the fire damage is reduced by 40 per cent by the installation of automatic fire detection (Table A6) then the expected annual benefits would be 0082x13400xO4-pound440 The discounted value of the total future benefits is then pound4100 In this case the cost of providing direct line detectors is greater than the expected benefits and from the national economy point of view the provision of detectors in these buildings is not cos t-effecti ve
10
5 THE VALUE OF DETECTORS - RESULTS
51 The value of detectors to the national economy
I The value of automatic fire detection calculated from the national economy point of view has been estimated for buildings of different sizes and different occupancies The results for
I direct line alarm systems are summarised in Figure 2 and the results for local alarm systems in Figure 3
In these Figures a range of values are shown for industrial buildings This range reflects the alternative range of estimates of the reduction in fire damage Only a single estimate of the economic value of detectors is shown for other occupancies in order to simplify the graphs The single line shown for the other occupancies is the mid-point of the range of values
In industrial buildings larger than about 2000 square metres (22 per cent of the buildings in manufacturing industry exceed this size) direct line detectors appear to be of economic value Somewhat surprisingly detection systems with local alarms appear to be of equal or greater economic value than systems with direct line alarms This result reflects the experience of the fire survey in which it was judged that in many cases a local alarm would have brought people to the fire promptly and that these people would have been able to extinguish or at least to contain the fire Although direct line systems can achieve a greater reduction in fire damage this additional benefit does not offset the higher cost of providing the direct line system
The only other occupancy in which detectors appear to be of economic value is shops and here it is the direct line systems which show the greater benefit
I 52 The present provision of automatic fire detection
The results of the survey of manufacturing industry show that detectors are installed in abou t 5 per cent of buildings covering a total of about 13 per cent of the total floorspace
The industr ies with the proportionately highest degree of automatic fire detection are Electrical Engineering and Chemicals
53 The value of detectors to the firm
Insurance companies offer discounts of up to 125 per cent for the installation of approved detector systems Because of the way in which premiums are calculated this is equivalent to a discount of up to about 20 per cent on the premium payable
Our estimates of the value to the firm of installing detectors
11
I
I I
suggest that even in the largest industrial buildings the costs of providing a detector system will exceed the benefits of the reduction in premiums (Although there may of course be individual cases where this generalisation development areas where government grants are for capital investment there may be a small to firms to install detectors in larger build
is not payable
financial ings
true) In to firms incentive
54 The reliability of detectors
Studies of the reliability of the present direct line fire detection systems have shown that for every genuine alarm signalled by the system there are more than 10 false and accidental alarms A false alarm rate as high as this could cause serious problems for fire brigades if there was widespread use of direct line detector systems However the technology is changing rapidly in this area and the reliability of automatic fire detection systems may improve in the future
12
I 6 THE EfFECT Of IMPROVED STRUCTURAL fIRE RESISTANCE
The effect of improved fire resistance in the internal structure of buildings can only be estimated from the information obtained in the examination of buildings in the fire survey At each building visited in the survey an assessment was aade of the amount of fire damage which might have occurred if all the internal surfaces (walls doors ceilings etc) had a minimum of 30 minutes fire resistance
I
Improved fire resistance would have reduced the amount of fire damage in some of the fires which spread beyond the room of origin The survey assessments take into account the fact that in some of the larger fires improved fire resistance would have had no effect because for example doors were left open or because the fire was so severe and had burned for so long that even the more resistant compartment wallS would have been penetrated
No estimate was made of the cost of bringing the structure up to the higher standard although it was clear that the cost would be substantial in many cases
In the survey it was estimated that increased structural fire resistance would have reduced the average amount of fire damageI by 45 per cent in industrial buildings 50 per cent in storage buildings and 55 per cent in shops
I
I
13
I I
7 CO~ CLUSI ONS
Before presenting any conclusions the limitations of the study should first be reiterated Firstly only the protection of property has been considered in this study and not the protection of life Secondly only complete sprinkler systems complete detector systems and complete upgrading of the internal structural fire resistance have been considered The value of partial fire protection systems (protecting only the most valuable parts of the building or the highest risks) or mixec systems (part sprinklers and part detectors) or other forms of fire protection (venting CO 2 flooding etc) have not been considered Thirdly a broad view of the problem has been taken ana results have been derived only for the major occupancy grcups There may well be many special cases or individual buildings for which the general results are not valid
The objective of this study was to derive an overall picture of the value of fire protection measures from the national economy point of view This overall picture is presented in Figures 1-3 The main findings of the study are as follows
1 Sprinklers are very effective in reducing fire damage and the reduction in dam~e is estimated to be 70-90 per cent in buildings of different sizes and occupancies When the cost of providing sprinklers is compared with the saving in fire losses the results of this study indicate that sprinklers are cost-effective in the medium and large industrial buildings in large shops and in high value high risk storage buildings
2 From the firms point of view there is a strong incentive to install sprinklers in order to benefit from the premium reductions offered by insurance companies However far fewer firms have actually taken advantage of these incentives than would benefit from doing so The question arises of why firms have been reluctant to take advantage of these financial incentives
3 It is estimated that automatic fire detection can reduce fire damage by about 50 per cent on average in industrial buildings and even more in other occupancies When these savings in fire losses are compared with the cost of providing detectors it appears that automatic fire detection is of economic value in the larger industrial buildings and the largest shops However if the present high false alarm rate is not improved wider use of direct line detectors might cause serious problems for fire brigades
It should be noted that the Fire Offices Committee representing fire insurers generally have reported that their own estimates of the reduction in fire damage effected by detectors is well below the figure quoted here Although the figures provided by FOC have not been supported by any detailed analysis they are
14
I bull
I nevertheless based on many years experience of underwriting fire risks Only further detailed study could resolve which of the two estimates is closer to the true value although the Home Office has no plans for such work to be carried out
4 From the firms point of view there is relatively little financial incentive to install detectors
5 It is estimated that improved structural fire resistance might reduce fire losses by about 50 per cent No estimate has been made of the cost of these structural improvements
I
I
I I
I I I
15
I
Figure 1 THE VALUE OF SPRINKLERS IN DIFFERENT OCCUPANCIES
8000
7000
6000
5000
4000
Cl) l iii 3000 gt c Cl) III Cl) a 2000 Cl)
Z
1000
o ~____L--+~____-L~__~____-L____~____~__~
- 1000
- 2000
Building size (m2)
Storage
Pubs Restaurants etc (7)
- 4000
16
-3000
I
I Figure 2 THE VALUE OF DIRECT LINE DETECTORS IN
I 7000
6000
5000
I 4000
Il l iii gt 3000 c Il ~ QI li 2000 z
I 1000
I 0
-1000
I -2000
-3000
- 4000
DIFFERENT OCCUPANCIES
Shops
75 Reduction
Storage 70 Reduction
Pubs etc
60~
SChoolS 70 Reduction~ Offices 55 Reduction
V
17
I
Figure 3 THE VALUE OF LOCAL ALARM DETECTORS IN DIFFERENT OCCUPANCIES
8000 r
7000
6000
5000
4000
Q)
J
~ 3000 c Q) Vl Q) -Cl 2000 Q)
Z
1000
o
- 1000
-2000
- 3000
-4000
50 Reduction
Shops 35 Reduction
Storage 50 Reduction
18
I
I I
APPEtWIX A
TABLES OF THE MAIN NUMERICAL RESULTS
I
I I I I I
19
I I
I
I I
I
I I I I I
I I
I I
TABLE A1 THE COST OF FIRE PROTECTION (1977 PRICES)
SPRINKLER SYSTEMS- in buildings of simple open construction not requiring pumps or additional water supplies
Initial cost
I Extra low hazard pound2000 + 083 x size of bUilding(m~) Ordinary hazard pound2000 + 198 x size of building(m )2Extra high hazard pound2000 + 267 x size of building(m )
Annual maintenance cost
Approximately 1 of initial cost
I I
AUTOMATIC DETECTION- in buildings of simple open construction
1nitial cost
Local alarm system pound1500 + 11 x size of bUilding(m~)
I Di rect line system pound1750 + 11 x size of building(m )
Annual maintenance and line rental costs
Local alarm system pound50 + 0025 x size of building(m~) Direct line system pound240 + 0025 x size of building(m )
I
I I I
20
I
TABLE A2 THE PROBABILITY OF A FI R OCC URRIlFu
OCCUPANCY (SIC ORDER)
1----------------------INDUSTRIAL BUILDINGS
PROBABILITY OF FIRE PER YEAR a BC PROBABILQY OF FIRE
IN 15OOm BUILDING
a -4-------
c
~------~------------~
Food drink and tobacco (Ill)
00011 OGc 0086
Chemicals and allied (V) 00069 046 021
bull Mechanical engineering (VII)
000011 075 0027
Electrical engineering (IX)
000061 059 0046
Vehicles (XI) 000012 086 0062
bull Metal goods not elseshyvhere specified (XII)
000158 054 0082
Textiles (XIII) 00075 055 0097
Timber furniture (XVII) 000057 077 010
Paper printing and publishing (XVIII)
0000069 0054
Other manufacturing (XIX)
00084 041 017
All manufacturing industry (Ill-XIX)
arHER OCCUPANCIES
00017 055 0082
Storage 000067 05 0026
Shops 0000066 10 0099
Offices 0000059 09 0043
Hotels etc 000008 10 012
Hospi tals etc 00007 075 017
bullbull Pubs restaurants etc (10) (01 )
Schools 00002 075 0048
Note Some of the fires vhich should be included in the Mechanical engineering sector may have been classified as Metal goods nes This vould result in an underestimate of the probability of fire for Mechanical engineering and an overestimate for Metal goods If the tvo groups are combined the estimated probabili ty of fire is 000086 1356 bull
middotValues for Assembly are assumed There vas insufficient information available to estimate the probability of fire in this occupancy group
21
I
TABLE A3 THE ESTIMATED FIRE DAMAGE IF ONLY THE MINIMUM LEVEL OF IRE PROTECTION IS PROVIDED
I I
I I I
I I
I I
OCCUPANCY (SIC O~vER) AVERAGE FIRE SIZE AS A rUNCTION OF BUILDING SIZE(m 2 )
SAMPLE SIZE
AVERAGE FIRE SIZE IN A B I~ NG 0 15(XluhlOORSPACE
INDUSTRIAL BUILDINGS
All industry 6496 60
Food drink amp tobacco (Ill)
313 73
Chemicals ampallied (V) 516 28
Mechanical engineering (VII )
248 44
Electrical engineering (IX )
174 64
Vehicles (XI) 080 g58 181
Metal goods not elseshywhere specified (XII)
64 jj23 561
Textiles (XIII ) 2 6 ~)9 399 45
Timber furniture (XVII ) 4 B21
2 2 393 112
Paper printing amp pUblishing (XVIII)
6 7 ~)6 198 93
Other manufacturing (XIX)
OTHER OCCUPANCIES
87 38
B 228 140
Storage 1398 157
Shops 50
095 B 2662 37
Offices 622 15
Hotels etc 22
B 973 27
Hospitals 20
936 5
Pubs restaurants etc 76 B 2908 33
Schools etc 28 57
B 906 42
22 I
~ABLE M IBE A VElUGE llE4 01 lIRE DAlIAGE IF SPRIIiKLERS ARE IIISTALLD
fRlfKirpi ~~ SPRlI)(L OPJAA[D ampPRIf~ I YtS SPF ~KIrnS rAI ur
~crIV JL SAl ]St AtTOR] U middotCOIIL er CO~i OCCUPIlCy (SIC CiWUl )
Aydllolteerll ~)PrYpn Prepn ~ dANr(~ ) PTopn h~(2) hdt(~ )Pr0in
It i middot~ITfd AL 31JlllNG
All induetr-J 13 p~ 8022I lt3 022x bullI(~955bull 3middot57 5 gt~ -66
a78Bmiddot~food dr~ toouCO ampJ OZb 2 0101 1 Illlt68bull bull (Ill ) -67
Bmiddot 1202h O 60 2 9t2looChellicil15 ampl11 02gt29~ 89 (V) -30
029 l 76rechmiddotnica elaquo1necriTf -2 961bullbull 580258 gtOOx~ (nl) -cn
B 7EhctriClll lr1n~r1Damp 1 02x~ )09 5 (96Bbullbull 5~ 01z53 (Il ) -ltgt69
tb1c1u (Xl) 87 62 E gtDUx 966x 3 9 01 3 -67
IMete roods cot l6Ishy gt 022z5C 6968 bull bull 58 0lx58 S3 0 bull 2l otltrtl ~lcihd (XlI) -072
uUl (XlII ) 2lt0Ux47 Efu-47 016bullbull475~I gt~55 middot-79I
t1~lgteT bull lUT~j tlJt (Xll) 0Z2z602 ~ S 96360 01bullbull 60 gt - B )6hpn Prictinf 022x60 9562060 019x6O B2 5publiahinl (nUl) -ltgt
B 02b )0Oth~r canufampetnr1n~ 70 290 06lO IV95x~ 30 (nxl -9
OHlI OCCtIPAN Ci rs 11 5lpoundtorace 0Z2z1(2 4bgt 9282076 050lt7pound (6
~O6
pound1ope 2 B 00022J 4555 Oh49sBx1t5 B2
(Off1e ) ( ) ( () )275 ( ( )) ( )) (
1WItela ~tc ( ( )) ( )106 ) ( -19 middot( )( ) ( ) )(
( ) ( ) ( ) ( ) )H04fIitala tc ( ( )) ( ()9
( 09 2 ) ( 0222o5~) 2 I(72oi (Q052oi gt5( ( )Pub_ atamplltampJl ete ) ( )) (9 middot ( ) ( ) ( ) )~19 ( ( ) ( ) ( ( )I
Sehoola ate ( ) ( ) ( ( )5middot5 bull )1 I ( ( )) 19 ( ) ( )
TABLE A5 THE AVERAGE DIRECT LOSS PER UNIT AREA OF FIRE DAMAGE
I I
I
I I
OCCUPANCY (SIC ORDER ) UNIT LOSS (poundsqm )
INDUSTRIAL BUILDINGS
All industry 140
Food drink amp tobacco ltrII)
Chemicals amp allied (V)
270
Mechanical engineering ( VII )
290
Electrical engineering (IX )
320
Vehicles (xI) 150
Metal goods not elseshywhere specified (XII)
240
Textiles (XIII) 210
Timber furniture (XVII) 130
Paper printing amp publishing (XVIII )
90
Other manufacturing (XIX )
OTHER OCCUPANCIES
120
Storage 120
Shops 160
Offices 150
Hotels etc 130
Hospitals etc 160
Pubs restaurants etc 100
Schools 110
24 I I
I TABLE J~ THE ESTIMATED REDUCTION IN FIRE DAMAGE DUE TO DETECTORS - ALL FIRES
Reduction in fire damage
Occupancy Survey
sample size lIith direct line alarm lIith local alarm
Estimated from Estimated Eetilllllted from Eetimated K433SAF2 in Survey K433SAF2 in Survey
Industry 210 -(40~55) -55 -(35-50) -50
Storage 30 -( 60-70) -80 - (45 55) -60
Shops 50 -( 65-75) -85 -(35-40) -4OJ~
Offices 17 -(55r~70) -45 not estimated -40
Hotels 12 -(55-65) -85 not estimated -85
Pubs restaurants 36 -(60-75) -55 not estimated -40
Schools 26 -(55-70) -90 not estimated -85
25
I
I I
I I
I I I I
I
I
I
I

I
2 THE VALUE OF SPRINKLERS- ANALYSIS
The estimation of e~ch of the items in the calcul~tion (liEtec in Section 13) c~n be regardec as a separate problem E~ch of the items is discussed briefly in this section and the results are illustrated using the example of an industrial building with a floor ~rea of 1500 sauare metres The full results for other occupancies and building sizes ~re given in the Appendix
2~1 The cost of a sprinkler systew
The cost of the sprinkler heads and the associated pipework will depend on the size of the building which is to be protected There will also be a fixed cost for each systew for the control valves alarms and the connection to the mains The estimated cost of installing a sprinkler system in a building of simple open construction ~nd involving no special haz~rd and no additional water supplies is pound(2000 + 198 x Size of building(sam)) The costs of other sprinkler systems are given in Table Al
The maintenance cost in future years is estimated to be about 1 per cent of the initial capital cost
22 The probability of a fire occurring
The probability of a fire occurring will vary with the occupancy and the size of the building The probability is estimated by relating the number of fires which occur in buildings of a given size and occupancy to the number of buildings of that size and occupancy at risk The probability of a fire in a large building is greater than in a swall building of the same occupancy but the risk of a fire does not increase in direct proportion to the building size The probability of a fire is of the form
Probability z aB where B is the floorspace of the building and a and c are the estiwated parameters for each occupancy
The estimated probability of a fire in an industrial building is given by
Probability z 00017B0middot3 which is eaual to a probability of 0082 in a 1500 square metre building or on average one fire every 12 years
Table A2 shows the probabilitity of a fire in other occupancies
~~3 The expected fire damage in an unprotected building
The average area of fire damage which would occur in an unprotected building was estimated from an analysis of the fires in buildings which did not have sprinklers or detectors The average area of fire damage is the average of many small fires
4
anc ltl f e ~ 9 E fires o nc the ave rage de pends on the size of the building middotsimply because large fires cannot occur in small buildings The average area of fire damage is estimated in the form
Fire size dBmiddot bullE
where B is the building floorspace and d and e are estimated parameters For industrial buildings tE~ estimated fire size is
Fire size 2 25 r E
and the average fire size in an unprotected building of 1500 souare metres is therefore 60 souare metres
The estimated areas of fire damage in buildings of other occupancies are given in Table A3
I 1~4 The expected fire damage in a building fitted with sprinklers
I
The expected fire da~age if a fire breaks out in a building in which sprinklers are installed has been estimated by considering four separate situations which might arise There may be insufficient heat to activate the sprinkler heads the sprinklers may not operate because the system has been turned off or because of a mechanical defect the sprinklers might operate and control or extinguish the fire or the fire may grow very large despite the operation of the sprinklers These separate outcomes are not of interest in their own right but subdividing the problem in this way provides more insight and produces a more reliable result
For an industrial building of 1500 sauare metres the probabilities of each outcome and the average area of fire damage in each case are
Sprinkler not activated 57 S sqm Sprinkler failure 09S 130 sOm Satisfactory operation 41 IS sOm Fire middotout of control 09S SOO sqm
The average damage if sprinklers are installed is therefore 0S7xS + 0009Sx130 + 04lxlS + O009SxSOO = 16 sqm
Predicted performance in other occupancies is shown in Table A4
2S The fire loss incurred
The relationship between fire losses and the area of fire damage has been investigated and it has been shown that the fire loss can be estimated simply by multiplying the area of fire damage by an average unit loss For industrial buildings the direct loss (to the national economy) is estimated to be pound140sqm of fire
I damage (The direct loss as estimated by insurance companies may be about IS per cent higher) Direct losses in other occupancies are shown in Table AS
A study of conseouential losses has shown that for manufacturing industry such losses are from the national economy point of
I 5
view equ~l to ~bout 60 of direct losses although the consequenti~l losses to the firm may be considerably greater
~6 The estimated value of sprinklers
For the example of ~n industrial building of 1500 square metres the initi~l capit~l cost of ~ sprinkler system would be pound5000 ~nd the total discounted cost of providing sprinkler protection including future m~intenance costs pound5500
If a fire occurred ~nd the building were not protected the ~verage area of fire damage would be 60 square metres involving ~ direct loss of 60x140-pound8400 and ~ total loss of pound8400xl6-pound13400 If the building were sprinklered the ~verage are~ of fire dam~ge would be 16 square metres involving a direct loss of pound2300 and ~ total loss of pound3700 The provision of sprinklers will therefore have reduced the expected fire dam~ge by 73
The probability of a fire per ye~r is 0082 and the expected reduction in fire losses per ye~r is therefore 0082x(pound13400-3700)- pound800 The total discounted benefit due to the reduced fire loss is thus pound7400 which exceeds the (discounted) cost of providing the sprinklers The provision of sprinkler protection in these buildings is therefore cost-effective from the n~tional economy point of view
The v~lue of sprinklers can be calcul~ted in this way for buildings of other occupancies ~nd other sizes
6
I
3 THE VALUE OF SPRINKLERS - RESULTS
31 The value of sprinklers to the national economy
The value of sprinkler protection calculated from the national economy point of view has been estimated for buildings of different occupancies and different sizes and the results are summarised in a graohical form in Figure 1 Figure 1 shows the Net Present Value of sprinkler protection (the discounted benefits minus the discounted costs) in different occupancies Where the Net Present Value is greater than zero sprinkler protection can be said to be cost-effective
The results show that for the overall industrial group of buildings sprinklers are cost-effective in buildings larger than
I 800 sauare metres When the different sectors of industry are considered separately the minimum building size above which sprinklers are of value is between 300 and 1000 square metres for most of the industries The separate industries in which sprinklers appear to show the greatest economic value are Other Manufacturing (which includes rubber and plastic products) Chemicals Food Timber and Electrical Engineering It is estimated that sprinklers would be cost-effective in about 50 per cent of the buildings in manufacturing industry and these buildings account for about 90 oer cent of the total floorspace in manufacturing industry
Sprinklers also aopear to be of value in the larger shops Snrinklers do not aopear to be of value (at least when only property protection is considered) in hospitals offices schools and pubs and restaurants
I
One perhaps surprising result is that sprinklers do not appear to be cost-effective in storage buildings Although the fires in storage buildings are large on average and sprinklers are very effective in reducing this fire damage the probability of a fire occurrinq is low and the expected reduction in fire damage is therefore not sufficient to - offset the cost of providing sorinklers This result far all storage buildings considered as
I a single group hides the fact that the circumstances in
I different tyPes of storage buildings can be very different If the storage group is subdivided it can be shown that sprinklers will be of net value in high risk high value storage buildings
Although the results of this analysis show that sprinklers are cost-effective in larger hotels there is reason to suspect that because of the inadeQuacy of the data used in the analysis these results overestimate the value of sprinklers in reducing property damage in hotels
7 I
32 The present provision of sprinklers
The present provision of sprinkler protection in manufacturing industr y has been estimated by a survey of manufacturing industry The survey results show that 13 per cent of buildings have complete sprinkler protection anc a further 4 per cent have partial ~prinkler protection Sprinklers tend to be installed in the larger buildings and it is estimated that a total of about 3S per cent of the floorspace in manufacturing industry is protected by sprinklers
No estimates of the extent occupancies are available
of sprinkler protection in other
33 The value of sprinklers to the firm
The value of sprinklers briefly in this study
to the firm has only been considered
Firms may install fire protection because of their awareness of the risks of fire and their wish to reduce these risks or they may install protection mainly in order to secure more advantageous terms for fire insurance Estimates have been made of the financial incentives to the firm to install fire protection
Insurance companies offer premium discounts of between 60 per cent and 90 per cent for approved sprinkler systems By making some assumptions to compensate for the lack of detailed information about insurance rates it is possible to estimate the value to the firm of installing sprinklers in buildings of different sizes
The estimates of the value to the firm of providing sprinklers in industrial buildings show that the value to the firm is broadly similar to the value to the economy ie where sprinklers are of value to the economy there is a financial incentive to the firm to install this protection In development areas where capital grants are available to firms who install sprinklers the financial incentives to install sprinklers are much greater
8
4 THP VALUP ~p DETECTOPS - ANALYSIS
41 The cost of detectors
Jt is estim8ted that the cost of installing either heat or smoke detectors in 8 building of simple open construction is 8poroximately pound11 per square metre of floorspace In 8ddition there will be 8 cost of 8bout pound1500 for the control equipment If 8 direct line system is inst8lled there will 8lso be a connection ch8rge The initi8l costs 8nd the future m8intenance 8nd line rent81 ch8rges for local 8l8rm and direct line systems 8re given in Table Al
~ 2 The estimated reduction in fire d8m8ge
I
I Detectors reduce fire d8m8ge by giving e8rly w8rning of 8 fire 8nd thus 8llowing people to intervene e8rlier The effectiveness of detectors depends on where people 8re 8t the time the fire occurs how r8pidly the fire is growing how people respond when they hear the 8l8rm 8nd how cap8ble people 8re of de8ling with the fire when they first 8rrive on the scene The effectiveness of detectors is therefore much more difficult to predict
The b8sic f8ctors which determine the effect of detectors in reducing fire d8m8ge C8nnot be deduced from the main fire st8tistics and we h8ve therefore had to rely very he8vily in this p8rt of the 8n81ysis on the inform8tion derived in our own fire survey For e8ch of the fires eX8mined in our survey 8n 8ssessment W8S m8de of the 8mount of fire d8m8ge which might h8ve occurred if detectors h8d been inst8lled This 8ssessment W8S m8de in the light of the 8ctu81 circumst8nces of e8ch fire 8nd
I particu18rly the estim8ted r8te of development of the fire in its e8rly st8ges 8nd the 8ssumed 8bility of the people in the vicinity to respond to the 818rm 8nd deal with the fire
I This 8ssessment of the d8m8ge which might h8ve occurred together with the record of the fire d8m8ge which 8Ctu8l1y occurred could be used directly to estim8te the possible reduction in fire d8m8ge due to detectors However in order to widen the b8sis of the estim8te 8n 8ttempt h8S been made to gener8lise the survey results by reference to the complete s8mple of fires for which a K433SAF2 fire report W8S 8vai18ble The K433SAF2 fire reports include 8 record of the 10c8tion of the ne8rest person 8t the time of the fire The possible reduction in fire d8m8ge C8n be estim8ted 8S 8 function of the C8use of the fire b8sed on the det8iled experience of the fire survey
The estimation of the reduction in fire dam8ge from the b8sic fire st8tistics is not entirely s8tisf8ctory 8S it depends on 8 v8riety of 8ssumptions some of which 8re difficult to justify Nevertheless the gener8l 8nalysis h8S been used in this study bec8use even though it m8Y not provide 8n independent estimate it does provide 8 better underst8nding of the estim8te of the
9
I
I
I effectiveness of detectors
For the example of an industrial building of area 1500 square metres the estimated effect of direct line detectors is as follows
Proportion Damage Estimated of fires if unprotected reduction
Person in room 55 40 sqm 0 Person in bldg 18 50 sqm 65-85 Person not in 27 105 sqm 65-85 building All fires 100 60 sqm 40-55
The estimation of the reduction in damage due to direct line and local alarm detectors in buildings of different occupancies is shown in Table A6 This Table shows the estimates produced through the general analysis as well as the average assessed reduction in the fire survey The generalised estimates cover a range of values reflecting the degree of uncertainty in the estimation procedure and are generally lower than the survey estimates reflecting the cautionary nature of the generalised analysis
43 The calculation of the value of detectors
Taking the example of a 1500 square metre industrial building again the initial cost of a direct line detector system is about pound3400 and the future annual running costs are pound280 (see Table Al) The total discounted costs are thus pound6000
The average 1055 per fire in an unprotected building would be pound13400 (from Tables A2 and A3 and including consequential losses of 60 per cent) If the fire damage is reduced by 40 per cent by the installation of automatic fire detection (Table A6) then the expected annual benefits would be 0082x13400xO4-pound440 The discounted value of the total future benefits is then pound4100 In this case the cost of providing direct line detectors is greater than the expected benefits and from the national economy point of view the provision of detectors in these buildings is not cos t-effecti ve
10
5 THE VALUE OF DETECTORS - RESULTS
51 The value of detectors to the national economy
I The value of automatic fire detection calculated from the national economy point of view has been estimated for buildings of different sizes and different occupancies The results for
I direct line alarm systems are summarised in Figure 2 and the results for local alarm systems in Figure 3
In these Figures a range of values are shown for industrial buildings This range reflects the alternative range of estimates of the reduction in fire damage Only a single estimate of the economic value of detectors is shown for other occupancies in order to simplify the graphs The single line shown for the other occupancies is the mid-point of the range of values
In industrial buildings larger than about 2000 square metres (22 per cent of the buildings in manufacturing industry exceed this size) direct line detectors appear to be of economic value Somewhat surprisingly detection systems with local alarms appear to be of equal or greater economic value than systems with direct line alarms This result reflects the experience of the fire survey in which it was judged that in many cases a local alarm would have brought people to the fire promptly and that these people would have been able to extinguish or at least to contain the fire Although direct line systems can achieve a greater reduction in fire damage this additional benefit does not offset the higher cost of providing the direct line system
The only other occupancy in which detectors appear to be of economic value is shops and here it is the direct line systems which show the greater benefit
I 52 The present provision of automatic fire detection
The results of the survey of manufacturing industry show that detectors are installed in abou t 5 per cent of buildings covering a total of about 13 per cent of the total floorspace
The industr ies with the proportionately highest degree of automatic fire detection are Electrical Engineering and Chemicals
53 The value of detectors to the firm
Insurance companies offer discounts of up to 125 per cent for the installation of approved detector systems Because of the way in which premiums are calculated this is equivalent to a discount of up to about 20 per cent on the premium payable
Our estimates of the value to the firm of installing detectors
11
I
I I
suggest that even in the largest industrial buildings the costs of providing a detector system will exceed the benefits of the reduction in premiums (Although there may of course be individual cases where this generalisation development areas where government grants are for capital investment there may be a small to firms to install detectors in larger build
is not payable
financial ings
true) In to firms incentive
54 The reliability of detectors
Studies of the reliability of the present direct line fire detection systems have shown that for every genuine alarm signalled by the system there are more than 10 false and accidental alarms A false alarm rate as high as this could cause serious problems for fire brigades if there was widespread use of direct line detector systems However the technology is changing rapidly in this area and the reliability of automatic fire detection systems may improve in the future
12
I 6 THE EfFECT Of IMPROVED STRUCTURAL fIRE RESISTANCE
The effect of improved fire resistance in the internal structure of buildings can only be estimated from the information obtained in the examination of buildings in the fire survey At each building visited in the survey an assessment was aade of the amount of fire damage which might have occurred if all the internal surfaces (walls doors ceilings etc) had a minimum of 30 minutes fire resistance
I
Improved fire resistance would have reduced the amount of fire damage in some of the fires which spread beyond the room of origin The survey assessments take into account the fact that in some of the larger fires improved fire resistance would have had no effect because for example doors were left open or because the fire was so severe and had burned for so long that even the more resistant compartment wallS would have been penetrated
No estimate was made of the cost of bringing the structure up to the higher standard although it was clear that the cost would be substantial in many cases
In the survey it was estimated that increased structural fire resistance would have reduced the average amount of fire damageI by 45 per cent in industrial buildings 50 per cent in storage buildings and 55 per cent in shops
I
I
13
I I
7 CO~ CLUSI ONS
Before presenting any conclusions the limitations of the study should first be reiterated Firstly only the protection of property has been considered in this study and not the protection of life Secondly only complete sprinkler systems complete detector systems and complete upgrading of the internal structural fire resistance have been considered The value of partial fire protection systems (protecting only the most valuable parts of the building or the highest risks) or mixec systems (part sprinklers and part detectors) or other forms of fire protection (venting CO 2 flooding etc) have not been considered Thirdly a broad view of the problem has been taken ana results have been derived only for the major occupancy grcups There may well be many special cases or individual buildings for which the general results are not valid
The objective of this study was to derive an overall picture of the value of fire protection measures from the national economy point of view This overall picture is presented in Figures 1-3 The main findings of the study are as follows
1 Sprinklers are very effective in reducing fire damage and the reduction in dam~e is estimated to be 70-90 per cent in buildings of different sizes and occupancies When the cost of providing sprinklers is compared with the saving in fire losses the results of this study indicate that sprinklers are cost-effective in the medium and large industrial buildings in large shops and in high value high risk storage buildings
2 From the firms point of view there is a strong incentive to install sprinklers in order to benefit from the premium reductions offered by insurance companies However far fewer firms have actually taken advantage of these incentives than would benefit from doing so The question arises of why firms have been reluctant to take advantage of these financial incentives
3 It is estimated that automatic fire detection can reduce fire damage by about 50 per cent on average in industrial buildings and even more in other occupancies When these savings in fire losses are compared with the cost of providing detectors it appears that automatic fire detection is of economic value in the larger industrial buildings and the largest shops However if the present high false alarm rate is not improved wider use of direct line detectors might cause serious problems for fire brigades
It should be noted that the Fire Offices Committee representing fire insurers generally have reported that their own estimates of the reduction in fire damage effected by detectors is well below the figure quoted here Although the figures provided by FOC have not been supported by any detailed analysis they are
14
I bull
I nevertheless based on many years experience of underwriting fire risks Only further detailed study could resolve which of the two estimates is closer to the true value although the Home Office has no plans for such work to be carried out
4 From the firms point of view there is relatively little financial incentive to install detectors
5 It is estimated that improved structural fire resistance might reduce fire losses by about 50 per cent No estimate has been made of the cost of these structural improvements
I
I
I I
I I I
15
I
Figure 1 THE VALUE OF SPRINKLERS IN DIFFERENT OCCUPANCIES
8000
7000
6000
5000
4000
Cl) l iii 3000 gt c Cl) III Cl) a 2000 Cl)
Z
1000
o ~____L--+~____-L~__~____-L____~____~__~
- 1000
- 2000
Building size (m2)
Storage
Pubs Restaurants etc (7)
- 4000
16
-3000
I
I Figure 2 THE VALUE OF DIRECT LINE DETECTORS IN
I 7000
6000
5000
I 4000
Il l iii gt 3000 c Il ~ QI li 2000 z
I 1000
I 0
-1000
I -2000
-3000
- 4000
DIFFERENT OCCUPANCIES
Shops
75 Reduction
Storage 70 Reduction
Pubs etc
60~
SChoolS 70 Reduction~ Offices 55 Reduction
V
17
I
Figure 3 THE VALUE OF LOCAL ALARM DETECTORS IN DIFFERENT OCCUPANCIES
8000 r
7000
6000
5000
4000
Q)
J
~ 3000 c Q) Vl Q) -Cl 2000 Q)
Z
1000
o
- 1000
-2000
- 3000
-4000
50 Reduction
Shops 35 Reduction
Storage 50 Reduction
18
I
I I
APPEtWIX A
TABLES OF THE MAIN NUMERICAL RESULTS
I
I I I I I
19
I I
I
I I
I
I I I I I
I I
I I
TABLE A1 THE COST OF FIRE PROTECTION (1977 PRICES)
SPRINKLER SYSTEMS- in buildings of simple open construction not requiring pumps or additional water supplies
Initial cost
I Extra low hazard pound2000 + 083 x size of bUilding(m~) Ordinary hazard pound2000 + 198 x size of building(m )2Extra high hazard pound2000 + 267 x size of building(m )
Annual maintenance cost
Approximately 1 of initial cost
I I
AUTOMATIC DETECTION- in buildings of simple open construction
1nitial cost
Local alarm system pound1500 + 11 x size of bUilding(m~)
I Di rect line system pound1750 + 11 x size of building(m )
Annual maintenance and line rental costs
Local alarm system pound50 + 0025 x size of building(m~) Direct line system pound240 + 0025 x size of building(m )
I
I I I
20
I
TABLE A2 THE PROBABILITY OF A FI R OCC URRIlFu
OCCUPANCY (SIC ORDER)
1----------------------INDUSTRIAL BUILDINGS
PROBABILITY OF FIRE PER YEAR a BC PROBABILQY OF FIRE
IN 15OOm BUILDING
a -4-------
c
~------~------------~
Food drink and tobacco (Ill)
00011 OGc 0086
Chemicals and allied (V) 00069 046 021
bull Mechanical engineering (VII)
000011 075 0027
Electrical engineering (IX)
000061 059 0046
Vehicles (XI) 000012 086 0062
bull Metal goods not elseshyvhere specified (XII)
000158 054 0082
Textiles (XIII) 00075 055 0097
Timber furniture (XVII) 000057 077 010
Paper printing and publishing (XVIII)
0000069 0054
Other manufacturing (XIX)
00084 041 017
All manufacturing industry (Ill-XIX)
arHER OCCUPANCIES
00017 055 0082
Storage 000067 05 0026
Shops 0000066 10 0099
Offices 0000059 09 0043
Hotels etc 000008 10 012
Hospi tals etc 00007 075 017
bullbull Pubs restaurants etc (10) (01 )
Schools 00002 075 0048
Note Some of the fires vhich should be included in the Mechanical engineering sector may have been classified as Metal goods nes This vould result in an underestimate of the probability of fire for Mechanical engineering and an overestimate for Metal goods If the tvo groups are combined the estimated probabili ty of fire is 000086 1356 bull
middotValues for Assembly are assumed There vas insufficient information available to estimate the probability of fire in this occupancy group
21
I
TABLE A3 THE ESTIMATED FIRE DAMAGE IF ONLY THE MINIMUM LEVEL OF IRE PROTECTION IS PROVIDED
I I
I I I
I I
I I
OCCUPANCY (SIC O~vER) AVERAGE FIRE SIZE AS A rUNCTION OF BUILDING SIZE(m 2 )
SAMPLE SIZE
AVERAGE FIRE SIZE IN A B I~ NG 0 15(XluhlOORSPACE
INDUSTRIAL BUILDINGS
All industry 6496 60
Food drink amp tobacco (Ill)
313 73
Chemicals ampallied (V) 516 28
Mechanical engineering (VII )
248 44
Electrical engineering (IX )
174 64
Vehicles (XI) 080 g58 181
Metal goods not elseshywhere specified (XII)
64 jj23 561
Textiles (XIII ) 2 6 ~)9 399 45
Timber furniture (XVII ) 4 B21
2 2 393 112
Paper printing amp pUblishing (XVIII)
6 7 ~)6 198 93
Other manufacturing (XIX)
OTHER OCCUPANCIES
87 38
B 228 140
Storage 1398 157
Shops 50
095 B 2662 37
Offices 622 15
Hotels etc 22
B 973 27
Hospitals 20
936 5
Pubs restaurants etc 76 B 2908 33
Schools etc 28 57
B 906 42
22 I
~ABLE M IBE A VElUGE llE4 01 lIRE DAlIAGE IF SPRIIiKLERS ARE IIISTALLD
fRlfKirpi ~~ SPRlI)(L OPJAA[D ampPRIf~ I YtS SPF ~KIrnS rAI ur
~crIV JL SAl ]St AtTOR] U middotCOIIL er CO~i OCCUPIlCy (SIC CiWUl )
Aydllolteerll ~)PrYpn Prepn ~ dANr(~ ) PTopn h~(2) hdt(~ )Pr0in
It i middot~ITfd AL 31JlllNG
All induetr-J 13 p~ 8022I lt3 022x bullI(~955bull 3middot57 5 gt~ -66
a78Bmiddot~food dr~ toouCO ampJ OZb 2 0101 1 Illlt68bull bull (Ill ) -67
Bmiddot 1202h O 60 2 9t2looChellicil15 ampl11 02gt29~ 89 (V) -30
029 l 76rechmiddotnica elaquo1necriTf -2 961bullbull 580258 gtOOx~ (nl) -cn
B 7EhctriClll lr1n~r1Damp 1 02x~ )09 5 (96Bbullbull 5~ 01z53 (Il ) -ltgt69
tb1c1u (Xl) 87 62 E gtDUx 966x 3 9 01 3 -67
IMete roods cot l6Ishy gt 022z5C 6968 bull bull 58 0lx58 S3 0 bull 2l otltrtl ~lcihd (XlI) -072
uUl (XlII ) 2lt0Ux47 Efu-47 016bullbull475~I gt~55 middot-79I
t1~lgteT bull lUT~j tlJt (Xll) 0Z2z602 ~ S 96360 01bullbull 60 gt - B )6hpn Prictinf 022x60 9562060 019x6O B2 5publiahinl (nUl) -ltgt
B 02b )0Oth~r canufampetnr1n~ 70 290 06lO IV95x~ 30 (nxl -9
OHlI OCCtIPAN Ci rs 11 5lpoundtorace 0Z2z1(2 4bgt 9282076 050lt7pound (6
~O6
pound1ope 2 B 00022J 4555 Oh49sBx1t5 B2
(Off1e ) ( ) ( () )275 ( ( )) ( )) (
1WItela ~tc ( ( )) ( )106 ) ( -19 middot( )( ) ( ) )(
( ) ( ) ( ) ( ) )H04fIitala tc ( ( )) ( ()9
( 09 2 ) ( 0222o5~) 2 I(72oi (Q052oi gt5( ( )Pub_ atamplltampJl ete ) ( )) (9 middot ( ) ( ) ( ) )~19 ( ( ) ( ) ( ( )I
Sehoola ate ( ) ( ) ( ( )5middot5 bull )1 I ( ( )) 19 ( ) ( )
TABLE A5 THE AVERAGE DIRECT LOSS PER UNIT AREA OF FIRE DAMAGE
I I
I
I I
OCCUPANCY (SIC ORDER ) UNIT LOSS (poundsqm )
INDUSTRIAL BUILDINGS
All industry 140
Food drink amp tobacco ltrII)
Chemicals amp allied (V)
270
Mechanical engineering ( VII )
290
Electrical engineering (IX )
320
Vehicles (xI) 150
Metal goods not elseshywhere specified (XII)
240
Textiles (XIII) 210
Timber furniture (XVII) 130
Paper printing amp publishing (XVIII )
90
Other manufacturing (XIX )
OTHER OCCUPANCIES
120
Storage 120
Shops 160
Offices 150
Hotels etc 130
Hospitals etc 160
Pubs restaurants etc 100
Schools 110
24 I I
I TABLE J~ THE ESTIMATED REDUCTION IN FIRE DAMAGE DUE TO DETECTORS - ALL FIRES
Reduction in fire damage
Occupancy Survey
sample size lIith direct line alarm lIith local alarm
Estimated from Estimated Eetilllllted from Eetimated K433SAF2 in Survey K433SAF2 in Survey
Industry 210 -(40~55) -55 -(35-50) -50
Storage 30 -( 60-70) -80 - (45 55) -60
Shops 50 -( 65-75) -85 -(35-40) -4OJ~
Offices 17 -(55r~70) -45 not estimated -40
Hotels 12 -(55-65) -85 not estimated -85
Pubs restaurants 36 -(60-75) -55 not estimated -40
Schools 26 -(55-70) -90 not estimated -85
25
I
I I
I I
I I I I
I
I
I
I

I I
suggest that even in the largest industrial buildings the costs of providing a detector system will exceed the benefits of the reduction in premiums (Although there may of course be individual cases where this generalisation development areas where government grants are for capital investment there may be a small to firms to install detectors in larger build
is not payable
financial ings
true) In to firms incentive
54 The reliability of detectors
Studies of the reliability of the present direct line fire detection systems have shown that for every genuine alarm signalled by the system there are more than 10 false and accidental alarms A false alarm rate as high as this could cause serious problems for fire brigades if there was widespread use of direct line detector systems However the technology is changing rapidly in this area and the reliability of automatic fire detection systems may improve in the future
12
I 6 THE EfFECT Of IMPROVED STRUCTURAL fIRE RESISTANCE
The effect of improved fire resistance in the internal structure of buildings can only be estimated from the information obtained in the examination of buildings in the fire survey At each building visited in the survey an assessment was aade of the amount of fire damage which might have occurred if all the internal surfaces (walls doors ceilings etc) had a minimum of 30 minutes fire resistance
I
Improved fire resistance would have reduced the amount of fire damage in some of the fires which spread beyond the room of origin The survey assessments take into account the fact that in some of the larger fires improved fire resistance would have had no effect because for example doors were left open or because the fire was so severe and had burned for so long that even the more resistant compartment wallS would have been penetrated
No estimate was made of the cost of bringing the structure up to the higher standard although it was clear that the cost would be substantial in many cases
In the survey it was estimated that increased structural fire resistance would have reduced the average amount of fire damageI by 45 per cent in industrial buildings 50 per cent in storage buildings and 55 per cent in shops
I
I
13
I I
7 CO~ CLUSI ONS
Before presenting any conclusions the limitations of the study should first be reiterated Firstly only the protection of property has been considered in this study and not the protection of life Secondly only complete sprinkler systems complete detector systems and complete upgrading of the internal structural fire resistance have been considered The value of partial fire protection systems (protecting only the most valuable parts of the building or the highest risks) or mixec systems (part sprinklers and part detectors) or other forms of fire protection (venting CO 2 flooding etc) have not been considered Thirdly a broad view of the problem has been taken ana results have been derived only for the major occupancy grcups There may well be many special cases or individual buildings for which the general results are not valid
The objective of this study was to derive an overall picture of the value of fire protection measures from the national economy point of view This overall picture is presented in Figures 1-3 The main findings of the study are as follows
1 Sprinklers are very effective in reducing fire damage and the reduction in dam~e is estimated to be 70-90 per cent in buildings of different sizes and occupancies When the cost of providing sprinklers is compared with the saving in fire losses the results of this study indicate that sprinklers are cost-effective in the medium and large industrial buildings in large shops and in high value high risk storage buildings
2 From the firms point of view there is a strong incentive to install sprinklers in order to benefit from the premium reductions offered by insurance companies However far fewer firms have actually taken advantage of these incentives than would benefit from doing so The question arises of why firms have been reluctant to take advantage of these financial incentives
3 It is estimated that automatic fire detection can reduce fire damage by about 50 per cent on average in industrial buildings and even more in other occupancies When these savings in fire losses are compared with the cost of providing detectors it appears that automatic fire detection is of economic value in the larger industrial buildings and the largest shops However if the present high false alarm rate is not improved wider use of direct line detectors might cause serious problems for fire brigades
It should be noted that the Fire Offices Committee representing fire insurers generally have reported that their own estimates of the reduction in fire damage effected by detectors is well below the figure quoted here Although the figures provided by FOC have not been supported by any detailed analysis they are
14
I bull
I nevertheless based on many years experience of underwriting fire risks Only further detailed study could resolve which of the two estimates is closer to the true value although the Home Office has no plans for such work to be carried out
4 From the firms point of view there is relatively little financial incentive to install detectors
5 It is estimated that improved structural fire resistance might reduce fire losses by about 50 per cent No estimate has been made of the cost of these structural improvements
I
I
I I
I I I
15
I
Figure 1 THE VALUE OF SPRINKLERS IN DIFFERENT OCCUPANCIES
8000
7000
6000
5000
4000
Cl) l iii 3000 gt c Cl) III Cl) a 2000 Cl)
Z
1000
o ~____L--+~____-L~__~____-L____~____~__~
- 1000
- 2000
Building size (m2)
Storage
Pubs Restaurants etc (7)
- 4000
16
-3000
I
I Figure 2 THE VALUE OF DIRECT LINE DETECTORS IN
I 7000
6000
5000
I 4000
Il l iii gt 3000 c Il ~ QI li 2000 z
I 1000
I 0
-1000
I -2000
-3000
- 4000
DIFFERENT OCCUPANCIES
Shops
75 Reduction
Storage 70 Reduction
Pubs etc
60~
SChoolS 70 Reduction~ Offices 55 Reduction
V
17
I
Figure 3 THE VALUE OF LOCAL ALARM DETECTORS IN DIFFERENT OCCUPANCIES
8000 r
7000
6000
5000
4000
Q)
J
~ 3000 c Q) Vl Q) -Cl 2000 Q)
Z
1000
o
- 1000
-2000
- 3000
-4000
50 Reduction
Shops 35 Reduction
Storage 50 Reduction
18
I
I I
APPEtWIX A
TABLES OF THE MAIN NUMERICAL RESULTS
I
I I I I I
19
I I
I
I I
I
I I I I I
I I
I I
TABLE A1 THE COST OF FIRE PROTECTION (1977 PRICES)
SPRINKLER SYSTEMS- in buildings of simple open construction not requiring pumps or additional water supplies
Initial cost
I Extra low hazard pound2000 + 083 x size of bUilding(m~) Ordinary hazard pound2000 + 198 x size of building(m )2Extra high hazard pound2000 + 267 x size of building(m )
Annual maintenance cost
Approximately 1 of initial cost
I I
AUTOMATIC DETECTION- in buildings of simple open construction
1nitial cost
Local alarm system pound1500 + 11 x size of bUilding(m~)
I Di rect line system pound1750 + 11 x size of building(m )
Annual maintenance and line rental costs
Local alarm system pound50 + 0025 x size of building(m~) Direct line system pound240 + 0025 x size of building(m )
I
I I I
20
I
TABLE A2 THE PROBABILITY OF A FI R OCC URRIlFu
OCCUPANCY (SIC ORDER)
1----------------------INDUSTRIAL BUILDINGS
PROBABILITY OF FIRE PER YEAR a BC PROBABILQY OF FIRE
IN 15OOm BUILDING
a -4-------
c
~------~------------~
Food drink and tobacco (Ill)
00011 OGc 0086
Chemicals and allied (V) 00069 046 021
bull Mechanical engineering (VII)
000011 075 0027
Electrical engineering (IX)
000061 059 0046
Vehicles (XI) 000012 086 0062
bull Metal goods not elseshyvhere specified (XII)
000158 054 0082
Textiles (XIII) 00075 055 0097
Timber furniture (XVII) 000057 077 010
Paper printing and publishing (XVIII)
0000069 0054
Other manufacturing (XIX)
00084 041 017
All manufacturing industry (Ill-XIX)
arHER OCCUPANCIES
00017 055 0082
Storage 000067 05 0026
Shops 0000066 10 0099
Offices 0000059 09 0043
Hotels etc 000008 10 012
Hospi tals etc 00007 075 017
bullbull Pubs restaurants etc (10) (01 )
Schools 00002 075 0048
Note Some of the fires vhich should be included in the Mechanical engineering sector may have been classified as Metal goods nes This vould result in an underestimate of the probability of fire for Mechanical engineering and an overestimate for Metal goods If the tvo groups are combined the estimated probabili ty of fire is 000086 1356 bull
middotValues for Assembly are assumed There vas insufficient information available to estimate the probability of fire in this occupancy group
21
I
TABLE A3 THE ESTIMATED FIRE DAMAGE IF ONLY THE MINIMUM LEVEL OF IRE PROTECTION IS PROVIDED
I I
I I I
I I
I I
OCCUPANCY (SIC O~vER) AVERAGE FIRE SIZE AS A rUNCTION OF BUILDING SIZE(m 2 )
SAMPLE SIZE
AVERAGE FIRE SIZE IN A B I~ NG 0 15(XluhlOORSPACE
INDUSTRIAL BUILDINGS
All industry 6496 60
Food drink amp tobacco (Ill)
313 73
Chemicals ampallied (V) 516 28
Mechanical engineering (VII )
248 44
Electrical engineering (IX )
174 64
Vehicles (XI) 080 g58 181
Metal goods not elseshywhere specified (XII)
64 jj23 561
Textiles (XIII ) 2 6 ~)9 399 45
Timber furniture (XVII ) 4 B21
2 2 393 112
Paper printing amp pUblishing (XVIII)
6 7 ~)6 198 93
Other manufacturing (XIX)
OTHER OCCUPANCIES
87 38
B 228 140
Storage 1398 157
Shops 50
095 B 2662 37
Offices 622 15
Hotels etc 22
B 973 27
Hospitals 20
936 5
Pubs restaurants etc 76 B 2908 33
Schools etc 28 57
B 906 42
22 I
~ABLE M IBE A VElUGE llE4 01 lIRE DAlIAGE IF SPRIIiKLERS ARE IIISTALLD
fRlfKirpi ~~ SPRlI)(L OPJAA[D ampPRIf~ I YtS SPF ~KIrnS rAI ur
~crIV JL SAl ]St AtTOR] U middotCOIIL er CO~i OCCUPIlCy (SIC CiWUl )
Aydllolteerll ~)PrYpn Prepn ~ dANr(~ ) PTopn h~(2) hdt(~ )Pr0in
It i middot~ITfd AL 31JlllNG
All induetr-J 13 p~ 8022I lt3 022x bullI(~955bull 3middot57 5 gt~ -66
a78Bmiddot~food dr~ toouCO ampJ OZb 2 0101 1 Illlt68bull bull (Ill ) -67
Bmiddot 1202h O 60 2 9t2looChellicil15 ampl11 02gt29~ 89 (V) -30
029 l 76rechmiddotnica elaquo1necriTf -2 961bullbull 580258 gtOOx~ (nl) -cn
B 7EhctriClll lr1n~r1Damp 1 02x~ )09 5 (96Bbullbull 5~ 01z53 (Il ) -ltgt69
tb1c1u (Xl) 87 62 E gtDUx 966x 3 9 01 3 -67
IMete roods cot l6Ishy gt 022z5C 6968 bull bull 58 0lx58 S3 0 bull 2l otltrtl ~lcihd (XlI) -072
uUl (XlII ) 2lt0Ux47 Efu-47 016bullbull475~I gt~55 middot-79I
t1~lgteT bull lUT~j tlJt (Xll) 0Z2z602 ~ S 96360 01bullbull 60 gt - B )6hpn Prictinf 022x60 9562060 019x6O B2 5publiahinl (nUl) -ltgt
B 02b )0Oth~r canufampetnr1n~ 70 290 06lO IV95x~ 30 (nxl -9
OHlI OCCtIPAN Ci rs 11 5lpoundtorace 0Z2z1(2 4bgt 9282076 050lt7pound (6
~O6
pound1ope 2 B 00022J 4555 Oh49sBx1t5 B2
(Off1e ) ( ) ( () )275 ( ( )) ( )) (
1WItela ~tc ( ( )) ( )106 ) ( -19 middot( )( ) ( ) )(
( ) ( ) ( ) ( ) )H04fIitala tc ( ( )) ( ()9
( 09 2 ) ( 0222o5~) 2 I(72oi (Q052oi gt5( ( )Pub_ atamplltampJl ete ) ( )) (9 middot ( ) ( ) ( ) )~19 ( ( ) ( ) ( ( )I
Sehoola ate ( ) ( ) ( ( )5middot5 bull )1 I ( ( )) 19 ( ) ( )
TABLE A5 THE AVERAGE DIRECT LOSS PER UNIT AREA OF FIRE DAMAGE
I I
I
I I
OCCUPANCY (SIC ORDER ) UNIT LOSS (poundsqm )
INDUSTRIAL BUILDINGS
All industry 140
Food drink amp tobacco ltrII)
Chemicals amp allied (V)
270
Mechanical engineering ( VII )
290
Electrical engineering (IX )
320
Vehicles (xI) 150
Metal goods not elseshywhere specified (XII)
240
Textiles (XIII) 210
Timber furniture (XVII) 130
Paper printing amp publishing (XVIII )
90
Other manufacturing (XIX )
OTHER OCCUPANCIES
120
Storage 120
Shops 160
Offices 150
Hotels etc 130
Hospitals etc 160
Pubs restaurants etc 100
Schools 110
24 I I
I TABLE J~ THE ESTIMATED REDUCTION IN FIRE DAMAGE DUE TO DETECTORS - ALL FIRES
Reduction in fire damage
Occupancy Survey
sample size lIith direct line alarm lIith local alarm
Estimated from Estimated Eetilllllted from Eetimated K433SAF2 in Survey K433SAF2 in Survey
Industry 210 -(40~55) -55 -(35-50) -50
Storage 30 -( 60-70) -80 - (45 55) -60
Shops 50 -( 65-75) -85 -(35-40) -4OJ~
Offices 17 -(55r~70) -45 not estimated -40
Hotels 12 -(55-65) -85 not estimated -85
Pubs restaurants 36 -(60-75) -55 not estimated -40
Schools 26 -(55-70) -90 not estimated -85
25
I
I I
I I
I I I I
I
I
I
I

I
I I
APPEtWIX A
TABLES OF THE MAIN NUMERICAL RESULTS
I
I I I I I
19
I I
I
I I
I
I I I I I
I I
I I
TABLE A1 THE COST OF FIRE PROTECTION (1977 PRICES)
SPRINKLER SYSTEMS- in buildings of simple open construction not requiring pumps or additional water supplies
Initial cost
I Extra low hazard pound2000 + 083 x size of bUilding(m~) Ordinary hazard pound2000 + 198 x size of building(m )2Extra high hazard pound2000 + 267 x size of building(m )
Annual maintenance cost
Approximately 1 of initial cost
I I
AUTOMATIC DETECTION- in buildings of simple open construction
1nitial cost
Local alarm system pound1500 + 11 x size of bUilding(m~)
I Di rect line system pound1750 + 11 x size of building(m )
Annual maintenance and line rental costs
Local alarm system pound50 + 0025 x size of building(m~) Direct line system pound240 + 0025 x size of building(m )
I
I I I
20
I
TABLE A2 THE PROBABILITY OF A FI R OCC URRIlFu
OCCUPANCY (SIC ORDER)
1----------------------INDUSTRIAL BUILDINGS
PROBABILITY OF FIRE PER YEAR a BC PROBABILQY OF FIRE
IN 15OOm BUILDING
a -4-------
c
~------~------------~
Food drink and tobacco (Ill)
00011 OGc 0086
Chemicals and allied (V) 00069 046 021
bull Mechanical engineering (VII)
000011 075 0027
Electrical engineering (IX)
000061 059 0046
Vehicles (XI) 000012 086 0062
bull Metal goods not elseshyvhere specified (XII)
000158 054 0082
Textiles (XIII) 00075 055 0097
Timber furniture (XVII) 000057 077 010
Paper printing and publishing (XVIII)
0000069 0054
Other manufacturing (XIX)
00084 041 017
All manufacturing industry (Ill-XIX)
arHER OCCUPANCIES
00017 055 0082
Storage 000067 05 0026
Shops 0000066 10 0099
Offices 0000059 09 0043
Hotels etc 000008 10 012
Hospi tals etc 00007 075 017
bullbull Pubs restaurants etc (10) (01 )
Schools 00002 075 0048
Note Some of the fires vhich should be included in the Mechanical engineering sector may have been classified as Metal goods nes This vould result in an underestimate of the probability of fire for Mechanical engineering and an overestimate for Metal goods If the tvo groups are combined the estimated probabili ty of fire is 000086 1356 bull
middotValues for Assembly are assumed There vas insufficient information available to estimate the probability of fire in this occupancy group
21
I
TABLE A3 THE ESTIMATED FIRE DAMAGE IF ONLY THE MINIMUM LEVEL OF IRE PROTECTION IS PROVIDED
I I
I I I
I I
I I
OCCUPANCY (SIC O~vER) AVERAGE FIRE SIZE AS A rUNCTION OF BUILDING SIZE(m 2 )
SAMPLE SIZE
AVERAGE FIRE SIZE IN A B I~ NG 0 15(XluhlOORSPACE
INDUSTRIAL BUILDINGS
All industry 6496 60
Food drink amp tobacco (Ill)
313 73
Chemicals ampallied (V) 516 28
Mechanical engineering (VII )
248 44
Electrical engineering (IX )
174 64
Vehicles (XI) 080 g58 181
Metal goods not elseshywhere specified (XII)
64 jj23 561
Textiles (XIII ) 2 6 ~)9 399 45
Timber furniture (XVII ) 4 B21
2 2 393 112
Paper printing amp pUblishing (XVIII)
6 7 ~)6 198 93
Other manufacturing (XIX)
OTHER OCCUPANCIES
87 38
B 228 140
Storage 1398 157
Shops 50
095 B 2662 37
Offices 622 15
Hotels etc 22
B 973 27
Hospitals 20
936 5
Pubs restaurants etc 76 B 2908 33
Schools etc 28 57
B 906 42
22 I
~ABLE M IBE A VElUGE llE4 01 lIRE DAlIAGE IF SPRIIiKLERS ARE IIISTALLD
fRlfKirpi ~~ SPRlI)(L OPJAA[D ampPRIf~ I YtS SPF ~KIrnS rAI ur
~crIV JL SAl ]St AtTOR] U middotCOIIL er CO~i OCCUPIlCy (SIC CiWUl )
Aydllolteerll ~)PrYpn Prepn ~ dANr(~ ) PTopn h~(2) hdt(~ )Pr0in
It i middot~ITfd AL 31JlllNG
All induetr-J 13 p~ 8022I lt3 022x bullI(~955bull 3middot57 5 gt~ -66
a78Bmiddot~food dr~ toouCO ampJ OZb 2 0101 1 Illlt68bull bull (Ill ) -67
Bmiddot 1202h O 60 2 9t2looChellicil15 ampl11 02gt29~ 89 (V) -30
029 l 76rechmiddotnica elaquo1necriTf -2 961bullbull 580258 gtOOx~ (nl) -cn
B 7EhctriClll lr1n~r1Damp 1 02x~ )09 5 (96Bbullbull 5~ 01z53 (Il ) -ltgt69
tb1c1u (Xl) 87 62 E gtDUx 966x 3 9 01 3 -67
IMete roods cot l6Ishy gt 022z5C 6968 bull bull 58 0lx58 S3 0 bull 2l otltrtl ~lcihd (XlI) -072
uUl (XlII ) 2lt0Ux47 Efu-47 016bullbull475~I gt~55 middot-79I
t1~lgteT bull lUT~j tlJt (Xll) 0Z2z602 ~ S 96360 01bullbull 60 gt - B )6hpn Prictinf 022x60 9562060 019x6O B2 5publiahinl (nUl) -ltgt
B 02b )0Oth~r canufampetnr1n~ 70 290 06lO IV95x~ 30 (nxl -9
OHlI OCCtIPAN Ci rs 11 5lpoundtorace 0Z2z1(2 4bgt 9282076 050lt7pound (6
~O6
pound1ope 2 B 00022J 4555 Oh49sBx1t5 B2
(Off1e ) ( ) ( () )275 ( ( )) ( )) (
1WItela ~tc ( ( )) ( )106 ) ( -19 middot( )( ) ( ) )(
( ) ( ) ( ) ( ) )H04fIitala tc ( ( )) ( ()9
( 09 2 ) ( 0222o5~) 2 I(72oi (Q052oi gt5( ( )Pub_ atamplltampJl ete ) ( )) (9 middot ( ) ( ) ( ) )~19 ( ( ) ( ) ( ( )I
Sehoola ate ( ) ( ) ( ( )5middot5 bull )1 I ( ( )) 19 ( ) ( )
TABLE A5 THE AVERAGE DIRECT LOSS PER UNIT AREA OF FIRE DAMAGE
I I
I
I I
OCCUPANCY (SIC ORDER ) UNIT LOSS (poundsqm )
INDUSTRIAL BUILDINGS
All industry 140
Food drink amp tobacco ltrII)
Chemicals amp allied (V)
270
Mechanical engineering ( VII )
290
Electrical engineering (IX )
320
Vehicles (xI) 150
Metal goods not elseshywhere specified (XII)
240
Textiles (XIII) 210
Timber furniture (XVII) 130
Paper printing amp publishing (XVIII )
90
Other manufacturing (XIX )
OTHER OCCUPANCIES
120
Storage 120
Shops 160
Offices 150
Hotels etc 130
Hospitals etc 160
Pubs restaurants etc 100
Schools 110
24 I I
I TABLE J~ THE ESTIMATED REDUCTION IN FIRE DAMAGE DUE TO DETECTORS - ALL FIRES
Reduction in fire damage
Occupancy Survey
sample size lIith direct line alarm lIith local alarm
Estimated from Estimated Eetilllllted from Eetimated K433SAF2 in Survey K433SAF2 in Survey
Industry 210 -(40~55) -55 -(35-50) -50
Storage 30 -( 60-70) -80 - (45 55) -60
Shops 50 -( 65-75) -85 -(35-40) -4OJ~
Offices 17 -(55r~70) -45 not estimated -40
Hotels 12 -(55-65) -85 not estimated -85
Pubs restaurants 36 -(60-75) -55 not estimated -40
Schools 26 -(55-70) -90 not estimated -85
25
I
I I
I I
I I I I
I
I
I
I

I I
I
I I
I
I I I I I
I I
I I
TABLE A1 THE COST OF FIRE PROTECTION (1977 PRICES)
SPRINKLER SYSTEMS- in buildings of simple open construction not requiring pumps or additional water supplies
Initial cost
I Extra low hazard pound2000 + 083 x size of bUilding(m~) Ordinary hazard pound2000 + 198 x size of building(m )2Extra high hazard pound2000 + 267 x size of building(m )
Annual maintenance cost
Approximately 1 of initial cost
I I
AUTOMATIC DETECTION- in buildings of simple open construction
1nitial cost
Local alarm system pound1500 + 11 x size of bUilding(m~)
I Di rect line system pound1750 + 11 x size of building(m )
Annual maintenance and line rental costs
Local alarm system pound50 + 0025 x size of building(m~) Direct line system pound240 + 0025 x size of building(m )
I
I I I
20
I
TABLE A2 THE PROBABILITY OF A FI R OCC URRIlFu
OCCUPANCY (SIC ORDER)
1----------------------INDUSTRIAL BUILDINGS
PROBABILITY OF FIRE PER YEAR a BC PROBABILQY OF FIRE
IN 15OOm BUILDING
a -4-------
c
~------~------------~
Food drink and tobacco (Ill)
00011 OGc 0086
Chemicals and allied (V) 00069 046 021
bull Mechanical engineering (VII)
000011 075 0027
Electrical engineering (IX)
000061 059 0046
Vehicles (XI) 000012 086 0062
bull Metal goods not elseshyvhere specified (XII)
000158 054 0082
Textiles (XIII) 00075 055 0097
Timber furniture (XVII) 000057 077 010
Paper printing and publishing (XVIII)
0000069 0054
Other manufacturing (XIX)
00084 041 017
All manufacturing industry (Ill-XIX)
arHER OCCUPANCIES
00017 055 0082
Storage 000067 05 0026
Shops 0000066 10 0099
Offices 0000059 09 0043
Hotels etc 000008 10 012
Hospi tals etc 00007 075 017
bullbull Pubs restaurants etc (10) (01 )
Schools 00002 075 0048
Note Some of the fires vhich should be included in the Mechanical engineering sector may have been classified as Metal goods nes This vould result in an underestimate of the probability of fire for Mechanical engineering and an overestimate for Metal goods If the tvo groups are combined the estimated probabili ty of fire is 000086 1356 bull
middotValues for Assembly are assumed There vas insufficient information available to estimate the probability of fire in this occupancy group
21
I
TABLE A3 THE ESTIMATED FIRE DAMAGE IF ONLY THE MINIMUM LEVEL OF IRE PROTECTION IS PROVIDED
I I
I I I
I I
I I
OCCUPANCY (SIC O~vER) AVERAGE FIRE SIZE AS A rUNCTION OF BUILDING SIZE(m 2 )
SAMPLE SIZE
AVERAGE FIRE SIZE IN A B I~ NG 0 15(XluhlOORSPACE
INDUSTRIAL BUILDINGS
All industry 6496 60
Food drink amp tobacco (Ill)
313 73
Chemicals ampallied (V) 516 28
Mechanical engineering (VII )
248 44
Electrical engineering (IX )
174 64
Vehicles (XI) 080 g58 181
Metal goods not elseshywhere specified (XII)
64 jj23 561
Textiles (XIII ) 2 6 ~)9 399 45
Timber furniture (XVII ) 4 B21
2 2 393 112
Paper printing amp pUblishing (XVIII)
6 7 ~)6 198 93
Other manufacturing (XIX)
OTHER OCCUPANCIES
87 38
B 228 140
Storage 1398 157
Shops 50
095 B 2662 37
Offices 622 15
Hotels etc 22
B 973 27
Hospitals 20
936 5
Pubs restaurants etc 76 B 2908 33
Schools etc 28 57
B 906 42
22 I
~ABLE M IBE A VElUGE llE4 01 lIRE DAlIAGE IF SPRIIiKLERS ARE IIISTALLD
fRlfKirpi ~~ SPRlI)(L OPJAA[D ampPRIf~ I YtS SPF ~KIrnS rAI ur
~crIV JL SAl ]St AtTOR] U middotCOIIL er CO~i OCCUPIlCy (SIC CiWUl )
Aydllolteerll ~)PrYpn Prepn ~ dANr(~ ) PTopn h~(2) hdt(~ )Pr0in
It i middot~ITfd AL 31JlllNG
All induetr-J 13 p~ 8022I lt3 022x bullI(~955bull 3middot57 5 gt~ -66
a78Bmiddot~food dr~ toouCO ampJ OZb 2 0101 1 Illlt68bull bull (Ill ) -67
Bmiddot 1202h O 60 2 9t2looChellicil15 ampl11 02gt29~ 89 (V) -30
029 l 76rechmiddotnica elaquo1necriTf -2 961bullbull 580258 gtOOx~ (nl) -cn
B 7EhctriClll lr1n~r1Damp 1 02x~ )09 5 (96Bbullbull 5~ 01z53 (Il ) -ltgt69
tb1c1u (Xl) 87 62 E gtDUx 966x 3 9 01 3 -67
IMete roods cot l6Ishy gt 022z5C 6968 bull bull 58 0lx58 S3 0 bull 2l otltrtl ~lcihd (XlI) -072
uUl (XlII ) 2lt0Ux47 Efu-47 016bullbull475~I gt~55 middot-79I
t1~lgteT bull lUT~j tlJt (Xll) 0Z2z602 ~ S 96360 01bullbull 60 gt - B )6hpn Prictinf 022x60 9562060 019x6O B2 5publiahinl (nUl) -ltgt
B 02b )0Oth~r canufampetnr1n~ 70 290 06lO IV95x~ 30 (nxl -9
OHlI OCCtIPAN Ci rs 11 5lpoundtorace 0Z2z1(2 4bgt 9282076 050lt7pound (6
~O6
pound1ope 2 B 00022J 4555 Oh49sBx1t5 B2
(Off1e ) ( ) ( () )275 ( ( )) ( )) (
1WItela ~tc ( ( )) ( )106 ) ( -19 middot( )( ) ( ) )(
( ) ( ) ( ) ( ) )H04fIitala tc ( ( )) ( ()9
( 09 2 ) ( 0222o5~) 2 I(72oi (Q052oi gt5( ( )Pub_ atamplltampJl ete ) ( )) (9 middot ( ) ( ) ( ) )~19 ( ( ) ( ) ( ( )I
Sehoola ate ( ) ( ) ( ( )5middot5 bull )1 I ( ( )) 19 ( ) ( )
TABLE A5 THE AVERAGE DIRECT LOSS PER UNIT AREA OF FIRE DAMAGE
I I
I
I I
OCCUPANCY (SIC ORDER ) UNIT LOSS (poundsqm )
INDUSTRIAL BUILDINGS
All industry 140
Food drink amp tobacco ltrII)
Chemicals amp allied (V)
270
Mechanical engineering ( VII )
290
Electrical engineering (IX )
320
Vehicles (xI) 150
Metal goods not elseshywhere specified (XII)
240
Textiles (XIII) 210
Timber furniture (XVII) 130
Paper printing amp publishing (XVIII )
90
Other manufacturing (XIX )
OTHER OCCUPANCIES
120
Storage 120
Shops 160
Offices 150
Hotels etc 130
Hospitals etc 160
Pubs restaurants etc 100
Schools 110
24 I I
I TABLE J~ THE ESTIMATED REDUCTION IN FIRE DAMAGE DUE TO DETECTORS - ALL FIRES
Reduction in fire damage
Occupancy Survey
sample size lIith direct line alarm lIith local alarm
Estimated from Estimated Eetilllllted from Eetimated K433SAF2 in Survey K433SAF2 in Survey
Industry 210 -(40~55) -55 -(35-50) -50
Storage 30 -( 60-70) -80 - (45 55) -60
Shops 50 -( 65-75) -85 -(35-40) -4OJ~
Offices 17 -(55r~70) -45 not estimated -40
Hotels 12 -(55-65) -85 not estimated -85
Pubs restaurants 36 -(60-75) -55 not estimated -40
Schools 26 -(55-70) -90 not estimated -85
25
I
I I
I I
I I I I
I
I
I
I

I I
TABLE A1 THE COST OF FIRE PROTECTION (1977 PRICES)
SPRINKLER SYSTEMS- in buildings of simple open construction not requiring pumps or additional water supplies
Initial cost
I Extra low hazard pound2000 + 083 x size of bUilding(m~) Ordinary hazard pound2000 + 198 x size of building(m )2Extra high hazard pound2000 + 267 x size of building(m )
Annual maintenance cost
Approximately 1 of initial cost
I I
AUTOMATIC DETECTION- in buildings of simple open construction
1nitial cost
Local alarm system pound1500 + 11 x size of bUilding(m~)
I Di rect line system pound1750 + 11 x size of building(m )
Annual maintenance and line rental costs
Local alarm system pound50 + 0025 x size of building(m~) Direct line system pound240 + 0025 x size of building(m )
I
I I I
20
I
TABLE A2 THE PROBABILITY OF A FI R OCC URRIlFu
OCCUPANCY (SIC ORDER)
1----------------------INDUSTRIAL BUILDINGS
PROBABILITY OF FIRE PER YEAR a BC PROBABILQY OF FIRE
IN 15OOm BUILDING
a -4-------
c
~------~------------~
Food drink and tobacco (Ill)
00011 OGc 0086
Chemicals and allied (V) 00069 046 021
bull Mechanical engineering (VII)
000011 075 0027
Electrical engineering (IX)
000061 059 0046
Vehicles (XI) 000012 086 0062
bull Metal goods not elseshyvhere specified (XII)
000158 054 0082
Textiles (XIII) 00075 055 0097
Timber furniture (XVII) 000057 077 010
Paper printing and publishing (XVIII)
0000069 0054
Other manufacturing (XIX)
00084 041 017
All manufacturing industry (Ill-XIX)
arHER OCCUPANCIES
00017 055 0082
Storage 000067 05 0026
Shops 0000066 10 0099
Offices 0000059 09 0043
Hotels etc 000008 10 012
Hospi tals etc 00007 075 017
bullbull Pubs restaurants etc (10) (01 )
Schools 00002 075 0048
Note Some of the fires vhich should be included in the Mechanical engineering sector may have been classified as Metal goods nes This vould result in an underestimate of the probability of fire for Mechanical engineering and an overestimate for Metal goods If the tvo groups are combined the estimated probabili ty of fire is 000086 1356 bull
middotValues for Assembly are assumed There vas insufficient information available to estimate the probability of fire in this occupancy group
21
I
TABLE A3 THE ESTIMATED FIRE DAMAGE IF ONLY THE MINIMUM LEVEL OF IRE PROTECTION IS PROVIDED
I I
I I I
I I
I I
OCCUPANCY (SIC O~vER) AVERAGE FIRE SIZE AS A rUNCTION OF BUILDING SIZE(m 2 )
SAMPLE SIZE
AVERAGE FIRE SIZE IN A B I~ NG 0 15(XluhlOORSPACE
INDUSTRIAL BUILDINGS
All industry 6496 60
Food drink amp tobacco (Ill)
313 73
Chemicals ampallied (V) 516 28
Mechanical engineering (VII )
248 44
Electrical engineering (IX )
174 64
Vehicles (XI) 080 g58 181
Metal goods not elseshywhere specified (XII)
64 jj23 561
Textiles (XIII ) 2 6 ~)9 399 45
Timber furniture (XVII ) 4 B21
2 2 393 112
Paper printing amp pUblishing (XVIII)
6 7 ~)6 198 93
Other manufacturing (XIX)
OTHER OCCUPANCIES
87 38
B 228 140
Storage 1398 157
Shops 50
095 B 2662 37
Offices 622 15
Hotels etc 22
B 973 27
Hospitals 20
936 5
Pubs restaurants etc 76 B 2908 33
Schools etc 28 57
B 906 42
22 I
~ABLE M IBE A VElUGE llE4 01 lIRE DAlIAGE IF SPRIIiKLERS ARE IIISTALLD
fRlfKirpi ~~ SPRlI)(L OPJAA[D ampPRIf~ I YtS SPF ~KIrnS rAI ur
~crIV JL SAl ]St AtTOR] U middotCOIIL er CO~i OCCUPIlCy (SIC CiWUl )
Aydllolteerll ~)PrYpn Prepn ~ dANr(~ ) PTopn h~(2) hdt(~ )Pr0in
It i middot~ITfd AL 31JlllNG
All induetr-J 13 p~ 8022I lt3 022x bullI(~955bull 3middot57 5 gt~ -66
a78Bmiddot~food dr~ toouCO ampJ OZb 2 0101 1 Illlt68bull bull (Ill ) -67
Bmiddot 1202h O 60 2 9t2looChellicil15 ampl11 02gt29~ 89 (V) -30
029 l 76rechmiddotnica elaquo1necriTf -2 961bullbull 580258 gtOOx~ (nl) -cn
B 7EhctriClll lr1n~r1Damp 1 02x~ )09 5 (96Bbullbull 5~ 01z53 (Il ) -ltgt69
tb1c1u (Xl) 87 62 E gtDUx 966x 3 9 01 3 -67
IMete roods cot l6Ishy gt 022z5C 6968 bull bull 58 0lx58 S3 0 bull 2l otltrtl ~lcihd (XlI) -072
uUl (XlII ) 2lt0Ux47 Efu-47 016bullbull475~I gt~55 middot-79I
t1~lgteT bull lUT~j tlJt (Xll) 0Z2z602 ~ S 96360 01bullbull 60 gt - B )6hpn Prictinf 022x60 9562060 019x6O B2 5publiahinl (nUl) -ltgt
B 02b )0Oth~r canufampetnr1n~ 70 290 06lO IV95x~ 30 (nxl -9
OHlI OCCtIPAN Ci rs 11 5lpoundtorace 0Z2z1(2 4bgt 9282076 050lt7pound (6
~O6
pound1ope 2 B 00022J 4555 Oh49sBx1t5 B2
(Off1e ) ( ) ( () )275 ( ( )) ( )) (
1WItela ~tc ( ( )) ( )106 ) ( -19 middot( )( ) ( ) )(
( ) ( ) ( ) ( ) )H04fIitala tc ( ( )) ( ()9
( 09 2 ) ( 0222o5~) 2 I(72oi (Q052oi gt5( ( )Pub_ atamplltampJl ete ) ( )) (9 middot ( ) ( ) ( ) )~19 ( ( ) ( ) ( ( )I
Sehoola ate ( ) ( ) ( ( )5middot5 bull )1 I ( ( )) 19 ( ) ( )
TABLE A5 THE AVERAGE DIRECT LOSS PER UNIT AREA OF FIRE DAMAGE
I I
I
I I
OCCUPANCY (SIC ORDER ) UNIT LOSS (poundsqm )
INDUSTRIAL BUILDINGS
All industry 140
Food drink amp tobacco ltrII)
Chemicals amp allied (V)
270
Mechanical engineering ( VII )
290
Electrical engineering (IX )
320
Vehicles (xI) 150
Metal goods not elseshywhere specified (XII)
240
Textiles (XIII) 210
Timber furniture (XVII) 130
Paper printing amp publishing (XVIII )
90
Other manufacturing (XIX )
OTHER OCCUPANCIES
120
Storage 120
Shops 160
Offices 150
Hotels etc 130
Hospitals etc 160
Pubs restaurants etc 100
Schools 110
24 I I
I TABLE J~ THE ESTIMATED REDUCTION IN FIRE DAMAGE DUE TO DETECTORS - ALL FIRES
Reduction in fire damage
Occupancy Survey
sample size lIith direct line alarm lIith local alarm
Estimated from Estimated Eetilllllted from Eetimated K433SAF2 in Survey K433SAF2 in Survey
Industry 210 -(40~55) -55 -(35-50) -50
Storage 30 -( 60-70) -80 - (45 55) -60
Shops 50 -( 65-75) -85 -(35-40) -4OJ~
Offices 17 -(55r~70) -45 not estimated -40
Hotels 12 -(55-65) -85 not estimated -85
Pubs restaurants 36 -(60-75) -55 not estimated -40
Schools 26 -(55-70) -90 not estimated -85
25
I
I I
I I
I I I I
I
I
I
I

I
TABLE A3 THE ESTIMATED FIRE DAMAGE IF ONLY THE MINIMUM LEVEL OF IRE PROTECTION IS PROVIDED
I I
I I I
I I
I I
OCCUPANCY (SIC O~vER) AVERAGE FIRE SIZE AS A rUNCTION OF BUILDING SIZE(m 2 )
SAMPLE SIZE
AVERAGE FIRE SIZE IN A B I~ NG 0 15(XluhlOORSPACE
INDUSTRIAL BUILDINGS
All industry 6496 60
Food drink amp tobacco (Ill)
313 73
Chemicals ampallied (V) 516 28
Mechanical engineering (VII )
248 44
Electrical engineering (IX )
174 64
Vehicles (XI) 080 g58 181
Metal goods not elseshywhere specified (XII)
64 jj23 561
Textiles (XIII ) 2 6 ~)9 399 45
Timber furniture (XVII ) 4 B21
2 2 393 112
Paper printing amp pUblishing (XVIII)
6 7 ~)6 198 93
Other manufacturing (XIX)
OTHER OCCUPANCIES
87 38
B 228 140
Storage 1398 157
Shops 50
095 B 2662 37
Offices 622 15
Hotels etc 22
B 973 27
Hospitals 20
936 5
Pubs restaurants etc 76 B 2908 33
Schools etc 28 57
B 906 42
22 I
~ABLE M IBE A VElUGE llE4 01 lIRE DAlIAGE IF SPRIIiKLERS ARE IIISTALLD
fRlfKirpi ~~ SPRlI)(L OPJAA[D ampPRIf~ I YtS SPF ~KIrnS rAI ur
~crIV JL SAl ]St AtTOR] U middotCOIIL er CO~i OCCUPIlCy (SIC CiWUl )
Aydllolteerll ~)PrYpn Prepn ~ dANr(~ ) PTopn h~(2) hdt(~ )Pr0in
It i middot~ITfd AL 31JlllNG
All induetr-J 13 p~ 8022I lt3 022x bullI(~955bull 3middot57 5 gt~ -66
a78Bmiddot~food dr~ toouCO ampJ OZb 2 0101 1 Illlt68bull bull (Ill ) -67
Bmiddot 1202h O 60 2 9t2looChellicil15 ampl11 02gt29~ 89 (V) -30
029 l 76rechmiddotnica elaquo1necriTf -2 961bullbull 580258 gtOOx~ (nl) -cn
B 7EhctriClll lr1n~r1Damp 1 02x~ )09 5 (96Bbullbull 5~ 01z53 (Il ) -ltgt69
tb1c1u (Xl) 87 62 E gtDUx 966x 3 9 01 3 -67
IMete roods cot l6Ishy gt 022z5C 6968 bull bull 58 0lx58 S3 0 bull 2l otltrtl ~lcihd (XlI) -072
uUl (XlII ) 2lt0Ux47 Efu-47 016bullbull475~I gt~55 middot-79I
t1~lgteT bull lUT~j tlJt (Xll) 0Z2z602 ~ S 96360 01bullbull 60 gt - B )6hpn Prictinf 022x60 9562060 019x6O B2 5publiahinl (nUl) -ltgt
B 02b )0Oth~r canufampetnr1n~ 70 290 06lO IV95x~ 30 (nxl -9
OHlI OCCtIPAN Ci rs 11 5lpoundtorace 0Z2z1(2 4bgt 9282076 050lt7pound (6
~O6
pound1ope 2 B 00022J 4555 Oh49sBx1t5 B2
(Off1e ) ( ) ( () )275 ( ( )) ( )) (
1WItela ~tc ( ( )) ( )106 ) ( -19 middot( )( ) ( ) )(
( ) ( ) ( ) ( ) )H04fIitala tc ( ( )) ( ()9
( 09 2 ) ( 0222o5~) 2 I(72oi (Q052oi gt5( ( )Pub_ atamplltampJl ete ) ( )) (9 middot ( ) ( ) ( ) )~19 ( ( ) ( ) ( ( )I
Sehoola ate ( ) ( ) ( ( )5middot5 bull )1 I ( ( )) 19 ( ) ( )
TABLE A5 THE AVERAGE DIRECT LOSS PER UNIT AREA OF FIRE DAMAGE
I I
I
I I
OCCUPANCY (SIC ORDER ) UNIT LOSS (poundsqm )
INDUSTRIAL BUILDINGS
All industry 140
Food drink amp tobacco ltrII)
Chemicals amp allied (V)
270
Mechanical engineering ( VII )
290
Electrical engineering (IX )
320
Vehicles (xI) 150
Metal goods not elseshywhere specified (XII)
240
Textiles (XIII) 210
Timber furniture (XVII) 130
Paper printing amp publishing (XVIII )
90
Other manufacturing (XIX )
OTHER OCCUPANCIES
120
Storage 120
Shops 160
Offices 150
Hotels etc 130
Hospitals etc 160
Pubs restaurants etc 100
Schools 110
24 I I
I TABLE J~ THE ESTIMATED REDUCTION IN FIRE DAMAGE DUE TO DETECTORS - ALL FIRES
Reduction in fire damage
Occupancy Survey
sample size lIith direct line alarm lIith local alarm
Estimated from Estimated Eetilllllted from Eetimated K433SAF2 in Survey K433SAF2 in Survey
Industry 210 -(40~55) -55 -(35-50) -50
Storage 30 -( 60-70) -80 - (45 55) -60
Shops 50 -( 65-75) -85 -(35-40) -4OJ~
Offices 17 -(55r~70) -45 not estimated -40
Hotels 12 -(55-65) -85 not estimated -85
Pubs restaurants 36 -(60-75) -55 not estimated -40
Schools 26 -(55-70) -90 not estimated -85
25
I
I I
I I
I I I I
I
I
I
I
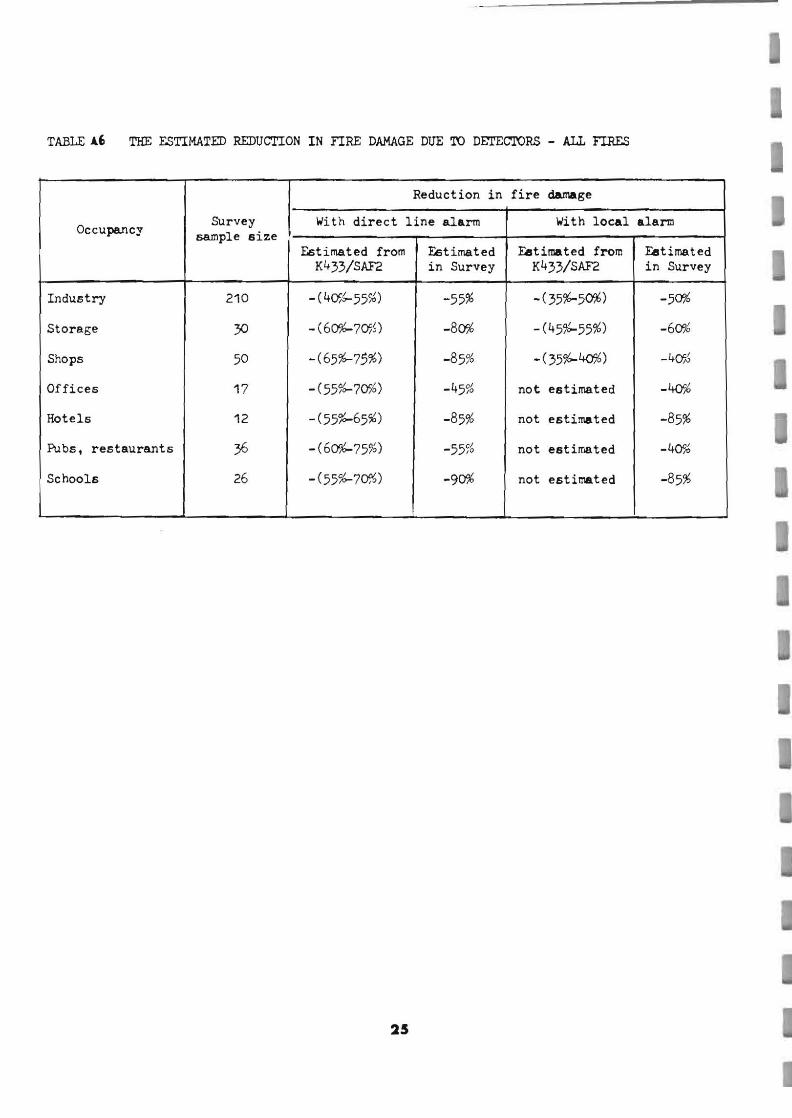
I I
I I
I I I I
I
I
I
I