The value of cultural heritage sites in Southeast Asia – a … · 2015-07-29 · The value of...
35
The value of cultural heritage sites in Southeast Asia – a comparison of values and discussion of the difficulties of benefits transfer Study report Submitted to EEPSEA By TRAN HUU TUAN College of Economics – Hue University 100 Phung Hung Street Hue City, Vietnam. [email protected] UDOMSAK SEENPRACHAWONG School of Development Economics National Institute of Development Administration Bangkok 10240, Thailand [email protected] July 30, 2007
Transcript of The value of cultural heritage sites in Southeast Asia – a … · 2015-07-29 · The value of...

The value of cultural heritage sites in Southeast Asia – a comparison of values
and discussion of the difficulties of benefits transfer
Study report
Submitted to EEPSEA
By
TRAN HUU TUAN
College of Economics – Hue University
100 Phung Hung Street
Hue City, Vietnam.
UDOMSAK SEENPRACHAWONG
School of Development Economics
National Institute of Development Administration
Bangkok 10240, Thailand
July 30, 2007

Table of contents
LIST OF TABLES.......................................................................................................................... 3
LIST OF FIGURES ........................................................................................................................ 3
LIST OF APPENDICES................................................................................................................. 3
EXECUTIVE SUMMARY ............................................................................................................ 4
1. Introduction................................................................................................................................. 6
2. The surveys and data................................................................................................................... 8
2.1 The Thailand survey – historic temples in the central region of Thailand ........................... 8
2.2 The Vietnam survey – Temples of the World Heritage Site My Son................................. 10
2.3 A comparison of the two surveys........................................................................................ 11
3. Results....................................................................................................................................... 15
3.1 Public perceptions of the preservation of cultural heritages............................................... 15
3.2 Determinants of the WTP ................................................................................................... 16
3.3 Mean WTP and WTP as a fraction of income .................................................................... 18
3.4 Analysis of the income elasticity of WTP .......................................................................... 21
3.5 Tests of benefit transfer ...................................................................................................... 22
3.5.1 Equality of unit value transfers and functional transfers ............................................ 22
3.5.2 Transfer errors............................................................................................................. 23
4. Discussion of the possibilities and difficulties of benefits transfer .......................................... 26
5. Conclusions............................................................................................................................... 28
References..................................................................................................................................... 29
Appendices.................................................................................................................................... 33
2

LIST OF TABLES Table 1. A comparison of characteristics of the goods being valued in the two surveys ............. 11
Table 2. A comparison of population characteristics of the two surveys ..................................... 12
Table 3. A comparison of methodological characteristics of the two surveys ............................. 14
Table 4. List of factors that are expected to affect the WTP results in the two surveys............... 14
Table 5. Respondent’s attitudes towards the importance of cultural heritage .............................. 16
Table 6. Estimated parameters of the logit models....................................................................... 17
Table 7. Bids and proportions of yes response in the Thailand survey ........................................ 18
Table 8. Bids and proportions of yes response in the Vietnam survey......................................... 19
Table 9. Mean WTP estimates (US$) ........................................................................................... 20
Table 10. Outcome of the validity testing based on the t-test and LR test ................................... 23
Table 11. Results of benefit transfers in terms of the transfer errors (TE) ................................... 24
Table 12. Calculations of income elasticities of WTP when transfer error equals zero............... 25
LIST OF FIGURES
Figure 1. The Bid Curve of the Thailand survey ......................................................................... 19
Figure 2. The Bid Curve of the Vietnam survey........................................................................... 20
LIST OF APPENDICES
Appendix A .................................................................................................................................... 33
Appendix B .................................................................................................................................... 34
3
EXECUTIVE SUMMARY
A large number of cultural heritage sites can be found in many countries of Southeast Asia. These sites attract an increasing number of tourists and income to these countries. Unfortunately, due to lack of money or resources to sufficiently protect these sites, many of them are in poor condition or deteriorating (Glover 2005; 2006; Tuan and Navrud 2007). Therefore, there is a need to put a price tag on these cultural heritages in order to justify the costs of preservation and conservation programs.
The idea of putting an economic value on the preservation of cultural heritages is not new (e.g. Navrud et al. 1992; Navrud and Ready 2002; Noonan 2002, Noonan 2003). However, very few valuation studies of cultural heritages exist in developing countries in general and in Southeast Asia in particularly (see Carson et al 1997; Tuan and Navrud 2007). To our knowledge, there have been three valuation studies on cultural heritages1 found in the Southeast Asian countries up to date. These include Seenprachawong (2006) used contingent valuation (CV) and choice experiments (CE) to estimate the economic values of historic temples in the central region of Thailand, Tuan (2006) applied both CV and CE to assess the economic benefits of preservation of My Son World Cultural Heritage Site in the Central Vietnam, and Thannakvaro de Lopez et al. (2006) examined the entrance revenues from the rapid expansion of tourism at the Angkor Wat temples in Cambodia2.
Among these three studies, Seenprachawong (2006) and Tuan (2006) use stated preference methods to estimate non-market values of historical temples (generally these goods are considered as high intrinsic non-use values). These studies find that these cultural heritage sites would produce more than enough money to finance preservation and conservation programs. Thannakvaro de Lopez et al. (2006) uses revealed data to assess use values derived from visitors visiting the Angkor Wat temples. This study finds that revenues from entrance fees represent a unique opportunity to restore Angkor to a thriving city.
This study has two main objectives. The first objective is to compare results of two CV surveys from the two research projects: “Economic Valuation of Cultural Heritage: a Case Study of Historic Temples in Thailand” (Seenprachawong 2006) and “Valuing the Economic Benefits of Preserving Cultural Heritage: the World Heritage Site, My Son Sanctuary in Vietnam” (Tuan 2006). These two research projects are carried out almost independently in terms of research objectives, survey designs, and data analyses. However, for CV sections in these two research studies, we follow the same principles in design and, therefore, to some extent there are some similar features such as scenario description, bid design, payment vehicle, and elicitation method. More specifically, we will compare the two CV surveys in the following aspects: compare characteristics of the goods being valued in the two surveys; compare characteristics of the two markets (including socio-economic characteristics of the respondents); compare 1 These studies are all funded by the Economy and Environment Program for Southeast Asia (EEPSEA).
2 This study investigates the social, environmental, and financial aspects of preserving Angkok Wat cultural heritages.
4
methodological characteristics of the two surveys; compare attitudinal variables; compare the factors affecting WTP; compare mean WTP and WTP as a fraction of income; examine and compare income elasticity of WTP between the two studies.
The second objective of the study is to discuss the pitfalls of benefit transfer in cultural heritages. In order to obtain this objective, we start by pointing out the challenges of benefit transfer with cultural heritage goods. Then we naively conduct tests of reliability of different benefits transfer techniques (i.e. naïve unit value transfer, unit value transfer with PPP adjustment, and functional transfer) in terms of transfer errors when transferring WTP estimates between the two sites. Finally, we use the transfer error range of these benefit transfer tests to discuss the possibilities and difficulties of using benefit transfer with implications for policy uses in the field of cultural resources.
Results of the study show that, with respect to socio-economic characteristics, the Thai sample was younger; more educated and had much higher income than the Vietnamese sample. Referring to respondent’s attitudes, results from the two surveys are quite similar. We found the following similar patterns in terms of factors explaining WTP in the two surveys: (i) increasing bid amounts decrease in the probability of saying yes to pay; (ii) a respondent with higher household income has a higher probability of answering yes to pay; (iii) a respondent with higher education has a higher probability of paying; and (iv) a respondent with a positive attitude towards the importance of cultural heritages has a positive relationship with the respondents’ saying yes to pay. Mean WTP with PPP-adjusted exchange rate, was US$16.03 and US$19.72 for two and ten temple sites in the Thai survey, respectively; and US$13.39 for the My Son temples in Vietnam. WTP as a fraction of household income was 0.05% (for two temples) and 0.07% (for ten temples) in the Thai sample; and 0.32% in the Vietnamese sample. The income elasticities of WTP were 0.28 and 3.67 for the Thai and Vietnamese surveys respectively, when calculated income elasticities at the absolute income in each country. The income elasticities were 0.27 for Thailand and 1.62 in the case of Vietnam, if we calculated elasticities at a common income level.
We find that the error in transferring unadjusted mean WTP is from 46% to 129%. Adjustments for differences in purchase power parity (PPP), income level and income elasticity between the sites in many cases substantially increase rather than decrease transfer errors. Function transfer does not perform better than unadjusted unit transfer. These results are contrary to both theoretical expectations and experiences from benefit transfer of environmental goods and environmentally related health impacts. The results suggest that there are other physical, cultural and institutional factors which can explain differences in WTP for cultural heritage than income and other socio-economic variables usually captured in contingent valuation studies. Until we are able to identify and measure the impacts of these factors, the potential policy use of benefit transfer for cultural heritage goods is rather limited.
5

1. Introduction
This study is a part of two research projects funded by EEPSEA. The first project is conducted by Udomsak Seenprachawong with entitled of “Economic Valuation of Cultural Heritage: a Case Study of Historic Temples in Thailand”. Seenprachawong (2006) used both contingent valuation (CV) and choice experiments (CE) to estimate the economic values of historic temples in the central region of Thailand. The second research project is carried out by Tran Huu Tuan with the name of “Valuing the Economic Benefits of Preserving Cultural Heritage: the World Heritage Site, My Son Sanctuary in Vietnam”. Tuan (2006) also applied both CV and CE to assess the economic benefits of preservation of My Son cultural heritage in Quangnam province, in the Central Vietnam. These two research projects are carried out almost independently in terms of research objectives, survey designs, and data analyses. However, for CV sections in these two research studies, we have followed the same principles in design and, therefore, to some extent there are some similar features such as scenario description, bid design, payment vehicle, and elicitation method.
The aim of this study is to compare cultural heritage values from two CV studies conducted in Thailand and Vietnam, respectively, in order to provide discussions on possibilities and difficulties in benefit transfer of cultural heritage goods.
Benefit transfer is a mean to transfer values and other information from an existing study (study site) to a new study (policy site). Due to the high costs and time required to perform primary valuation studies, there is potentially high policy interest in using benefit transfer to estimate values for unvalued sites. Benefit transfer has been increasingly applied to environmental goods and services using CV estimates in the literature. These benefit transfer studies address a wide variety of environmental goods and services. Bergland et al. (1995) and Muthke et al. (2004) tested benefit transfers related to water resources. Alberini and Krupnick (1997) conducted a benefit transfer study dealing with air pollution and acute respiratory illness. Brouwer and Spanknings (1999) estimated and compared the benefits of agricultural wildlife management on peat meadow land. Barton and Mourato (2003) conducted the benefit transfer of avoided health effects from water pollution. Ready et al. (2004) measured and compared the benefits of health impacts related to air and water quality. Brouwer and Bateman (2005) transferred the WTP for health-risk reductions. Krupnick et al. (2006) tested the benefit transfer of mortality risk valuation. Abou-Ali and Belhaj (2006) transferred the WTP for air pollution reduction caused by road traffic.
Benefit transfer studies in the field of cultural resources, however, are rare (Riganti and Nijkamp 2005; Eftec 2005). Errors in benefit transfer of these public goods could be potentially large due to differences between the study site and policy site (including the definition of the good itself, the extent to which it will change, and whether the good is of local, regional, national or global significance), differences in market characteristics (e.g. the size of the affected populations and population characteristics, socio-economic and attitudinal characteristics), differences in methodological variables (e.g. elicitation format and payment vehicle in CV surveys, survey mode, response rate, and sample size), and other differences in cultural and political contexts (Eftec 2005; Ready and Navrud 2006).
6
Due to the unique nature of cultural heritage goods, possibilities for benefit transfers seem to be limited. Eftec (2005) argued that economic values associated with cultural heritage assets are likely to be highly site and good-specific. They pointed out that geographical location is an important consideration in assessing the appropriateness of a study for transfer purposes. For instance, similar assets may be distinctly different between different countries due to different cultural and historical associations. Another feature which is important for benefit transfer is whether the cultural heritage site is of national or international importance (which determines both the level of WTP per households and the number of households affected by a change in quality/quantity of the good) (Eftec 2005; Ready and Navrud 2006).
Market characteristics between two cultural heritage goods are normally different. It is unlikely that the populations affected by the goods at the study site and the policy site have identical characteristics. This is related to the size of affected population as well as demographic characteristics of the population (Loomis and Rosenberger 2006). Socio-economic characteristics are often different between countries, particularly when comparing a developing country to a more developed country (Eftec 2005; Ready and Navrud 2006). Other issues associated with population and population characteristics that may have an impact on benefits transfer are the validity of transferring per household or per person values, the distinction between users and non-users values, and distance from the good. For example, unit WTP estimates for users of cultural heritage assets are higher than those for non-users (Pearce et al. 2002). Bateman et al. (2006) argued that where some resource site generates use value, the density of such users will be higher near to that site. Furthermore, as users typically hold higher values than nonusers, then we would expect average values to decay with increasing distance from that site.
From economic theory, one would expect that individuals with higher income have higher WTP than individuals with low income. When using a Dichotomous Choice (DC) elicitation format in a CV study, we also expect the share of respondents willing to pay (and probability of a respondent saying yes to pay) a particular price to decrease (increase) as the price they are asked to pay increases (decreases). From an economic viewpoint, we would also expect that respondents would be willing to pay more for a larger amount of a desired good. This is referred to as a scope test, as we observe how WTP changes when the size or scope of good changes (Carson et al. 2001).
It might be expected that respondents with positive attitude towards the goods would be willing to pay more for it. However, respondents with positive attitudes may still refuse to pay due to strategic reasons; budget constraints etc. (see Jorgensen and Syme 2000).
CV studies employ different methodologies in terms of e.g. elicitation format, payment vehicle, survey mode, response rate, per individual or per household WTP, which can lead to different WTP results. Meta-analytical reviews of the valuation literature reveal some methodological patterns such as DC elicitation format produce higher WTP values than Open-Ended (OE) or Payment Card (PC) formats, since the DC format may incur a “yea-saying”3 problem (Blamey et al. 1999; Cameron et al. 2002). One would expect that voluntary payment yields higher WTP estimate than compulsory payments like taxes, since the voluntary payment could lead to free 3 The tendency of some respondents to agree with an interviewer’s request regardless of their true views (Mitchell and Carson 1989).
7

riding behavior (Murphy et al. 2005). Survey modes could also influence WTP estimates (Boyle 2003), but results from empirical comparisons of mail and in-person surveys are mixed. With regard to choice of payment vehicle, one would expect that one-time payment provides lower WTP estimates than (the present value of) annual or monthly payments, due to human discounting errors (Rabin 1998). It is generally assumed that the higher response rates, the lower the mean WTP estimates, since the survey then captured more respondents which are less interested and have lower WTP (Lindhjem 2007). Results are mixed when comparing per person and per household WTP (Bateman and Munro 2005), but Quiggin (1998) finds that, under strict conditions, household WTP is higher than individual WTP.
Noonan (2003) conducts a meta-analysis of 65 CV studies in order to assess systematic patterns in the WTP estimates for cultural resources. He finds that studies in the cultural field are generally consistent with expectations. Characteristics of the goods being valued, as well as features of the survey methods, influence WTP estimates; e.g. the distribution of WTP estimates is influenced by survey design features, familiarity with the good, and whether the scenario involves more abstract goods.
Contextual factors such as differences in cultural and institutional settings between countries also influence WTP. Thus, benefit transfer of cultural heritage goods could lead to potentially large errors.
The structure of the study is as follows. Section 2 presents the two surveys and data, and compares them. Section 3 describes the results in terms of respondents’ attitudes and WTP for preservation of cultural heritage, factors that affect their WTP, and transfer errors of validity tests. Section 4 discusses the possibilities and difficulties of benefits transfer in cultural heritages. Section 5 concludes the study with implications for policy use of transferred values.
2. The surveys and data
Two CV surveys have been conducted to estimate the economic benefits of preserving and restoring historic temple sites in Thailand and Vietnam, respectively. The two surveys have many similar design features, including asking the same attitudinal questions, using the same valuation scenario description; bid design; payment vehicle; and elicitation method; in order to isolate the effect on WTP from differences between the sites and the affected population.
In the following sections, we describe in details the characteristics of each survey, present primary results from the two surveys, and identify the similarities and differences between them.
2.1 The Thailand survey – historic temples in the central region of Thailand
The Thailand survey (Seenprachawong 2006) was designed to investigate the preferences of individuals in the Bangkok Metropolitan Area (BMA) towards the preservation and restoration of historic temples in the central region of Thailand. These temples are considered to be the finest examples of the ancient cultural structures in Thailand. The survey selected ten historic temples at risk of deterioration as the good to be valued. Text and photos were used to describe the current state of the historic temples. This was followed by a description of the proposed
8

program to preserve and restore these temples. Photographs were used to illustrate the effect of the preservation program, which is the good that respondents were asked to value. Finally, respondents were asked whether they were willing to pay for this preservation program in terms of voting yes or no to pay a stated amount that was varied among sub-samples. After this referendum type DC CV question, respondents who were not willing to pay anything were asked to state their reasons for doing so. The questionnaire also included extensive sections with attitudinal and demographic questions.
Two payment vehicles were used; a one-time surcharge in income tax and a one-time voluntary donation. To overcome the incentive incompatibility of the voluntary contribution payment vehicle, a matching grant was included in the hypothetical scenario. In addition, the questionnaire followed the approach of Cummings and Taylor 1999, and included an explicit discussion on the hypothetical bias problem to reduce this bias (i.e. a “cheap talk” script). A secret ballot was used to reduce enumerator bias. Each respondent received a card that specified a predetermined amount of WTP to which he/she was asked to answer yes or no. The card was then put in a sealed envelope to prevent the interviewer from knowing the respondent’s answer. The survey sample was split into four sub-samples, in order to test for the effect on WTP from different payment vehicles (tax vs. donation), and to test for the scope effect (two temples vs. ten temples).
The survey was conducted in the BMA because it offered logistical advantages, and residents in BMA could be assumed (based on general income and education levels) to have knowledge and attitudes that would be representative of other provinces in the central region of Thailand. In-person interviews were administered from January to February 2005. The number of households in the BMA was 1,703,128. With the help of the National Statistical Office, a stratified random sample was obtained from the Socio-Economic Status Survey population in BMA. BMA is divided into 48 strata. Each stratum is homogenous in the sense that it belongs to a specific district that includes similar surrounding environments. The 48 strata were used to select a list of 800 households for the survey. A simple random sample of 10-25 households was chosen from each stratum. A total of 800 households were selected for interviews from these 48 strata. For a proper comparison with the voluntary payment vehicle, this study screened out households that did not pay income tax (approximately 18%) by inserting an income tax payment section in the questionnaire.
Out of the total of 800 households, 237 households could not be located and 43 households refused to answer. Thus, 520 respondents were interviewed: 280 households were asked to pay for ten temples and 240 households were asked to pay for two temples. Half of the respondents in each of these two groups were asked for a one-time surcharge on their income taxes, and the other half for a one-time donation to the trust fund.
Results showed that the survey did pass the scope test, indicating that respondents would be willing to pay more for a greater number of temples. The payment vehicle test showed that there was no significant difference in WTP between these two payments, indicating that it does not matter if the payment vehicle is in the form of income tax or a donation. Therefore we pooled the
9

data of these two sub-samples when calculating mean WTP, which were 204 Baht4 (US$5.09) and 251 Baht (US $6.27) for two and ten temples, respectively.
2.2 The Vietnam survey – Temples of the World Heritage Site My Son
The Vietnam survey (Tuan 2006) was designed to estimate the economic benefits of preserving temples at My Son, a UNESCO world heritage site, located in Quangnam province in the central region of Vietnam. This is a large complex of religious temples, originally consisting of more than 70 temples out of which 25 temples remain today. According to GHF (2002), this unique site is now in a state of significant disrepair, and urgently requires restoration and preservation.
The questionnaire began with a series of questions posed to obtain information about respondents’ perception and attitudes towards the My Son temples. These attitudinal questions were identical to the Thailand questionnaire. Then respondents were presented with the valuation scenario of My Son temples, consisting of a description of the site in terms of text, maps, and photos. Respondents were provided with background information on the current condition of the site and a status quo scenario where the deterioration would continue due to insufficient resources for preservation. Then, the proposed preservation plan and its effect were presented. The respondents were told that the plan would improve the condition of the My Son temples and preserve the site for the future.
A one-time increase in tax was used as the payment vehicle. Since Vietnamese respondents were not familiar with the referendum type format5, we used a special DC format we found to work well in Vietnam (see appendix C for details). As in the Thai instrument, four price levels of local currencies were used; details are presented in the next section. After the valuation section, debriefing questions were asked in order to determine what motivated respondents’ WTP or refusal to pay. The questionnaire also included socio-economic data such as gender, age, education, employment status, and income.
The survey was administered in Quangnam province in the central region of Vietnam. In-person interviews were conducted in the August 2005. We selected a stratified sample consisting of 250 households; representative of households in the Quangnam province (see Tuan and Navrud (in press) for details of the selection procedure). 9 respondents refused to be interviewed which gives a net sample of 241 respondents.
Results showed that mean WTP for preserving of My Son temples was 43,495 VND6 (US$2.74).
4 Exchange rates in February 2006 US$: 1US$ =40 Thai baht.
5 In the past 60 years, no referendum has been conducted in Vietnam (Tuoitre 2006).
6 Exchange rates in February 2006 US$: 1US$ = 15,900 VND.
10

2.3 A comparison of the two surveys
In a DC CV study, a general valuation function would be in the form of:
εβββββββ +++++++= ssiii QMSACXpaytoyesob 6543210)__.(Pr
where Prob. (yes_to_pay) is the probability of saying yes to pay the bid (amount) X, here it depends on: Xi = the bid amount the respondent i is asked; Ci = socio-economic characteristics of the respondent i (including income), Ai = attitudes of the respondent i, S = availability and quality of substitute sites, Ms = methodological characteristics of the survey s, Qs = site characteristics of the good being valued in survey s, βj (j = 0, 6) are sets of parameters, and ε is the random error. In stated preference surveys like CV only the first three categories of variables are usually included in the valuation function. However, when performing benefit transfer we also need to consider the last two categories of variables.
Tables 1, 2, and 3 summarize and compare the two surveys with respect to these groups of variables; organized in characteristics of the goods, characteristics of the two markets, and methodological variables of the two surveys, respectively.
As shown in table 1, the characteristics of the two goods are not exactly identical. The differences include the public good itself and the geographical level of significance. In the Thailand survey, the good being valued is ten (and two) historic temples at risk of deterioration and these temples are located in different provinces in the central region of Thailand. While in the Vietnam survey, My Son is a large complex of temples, 25 of these temples remain today, and located in a small area. With respect to the level of significance, the temples in Thailand can be considered as a national public good, while the My Son temples in Vietnam are both a national and global public good (since My Son is on the UNESCO list of World Heritage Sites).
Table 1. A comparison of characteristics of the goods being valued in the two surveys
Selection criteria
Thailand survey Vietnam survey
Description of the good
This survey selected ten historic temples at risk of deterioration as the good to be valued. Located in different provinces in the central region of Thailand.
My Son is a complex of religious temples, out of which 25 temples remain today. Located in Quangnam province in the central region of Vietnam.
Valuation scenario
From the status quo (i.e. the current state of historic temples at risk of deterioration) to a proposed preservation program to preserve and restore these temples.
From the status quo (i.e. the current condition in that the deterioration continues) to a proposed preservation plan to preserve and restore the site.
Level of significance
A national public good (these historic temples are considered to be the finest examples of ancient cultural structures in Thailand).
A national and global public good (a UNESCO’s world heritage site).
11

Table 2 compares characteristics of the two markets. In the Thailand survey, we asked Bangkok residents about their WTP for preservation of historic temples in the central region of Thailand, while in Vietnam we asked people in Quangnam province about their WTP for preservation of temples in the same province. This means that the populations selected for these two surveys are different with respect to the geographical extent.
Table 2. A comparison of population characteristics of the two surveys
Selection criteria Thailand survey Vietnam survey
Respondents Non-local residents (Bangkok residents),
household survey
Local residents (residents of Quangnam province),
household survey
Distance from the site About 300km Within 100km
Sex (1 for male, sex = 0 for female); Mean (std.dev)
0.49 (0.50)
0.49 (0.50)
Age (the respondents’ age in years); Mean (std.dev)
34.06 (12.32)
43.18 (11.09)
Education (the respondent’s number of years at school ); Mean (std.dev)
13.54 (4.25)
9.14 (3.51)
Income (reported monthly household income in US$); Mean (std.dev)
782.45 (628.83)
71.37 (47.47)
Adjusted income (PPP-adjusted at national average exchange ratea; monthly household income; US$)
2,462 349
Adjusted income at city specific (PPP-adjusted at city specific exchange rateb; monthly household income; US$)
6,757 122
Number of respondents (N) 520 241
Note: a GDP/capita in 2005 for Thailand and Vietnam are US$8,368 and US$3,025, respectively. Nominal GDP/capita in 2005 for Thailand and Vietnam are US$2,659 and US$618, respectively (sources: IMF 2005). Thus the adjustment factors (equal to PPP-adjusted GDP per capita/ Nominal GDP per capita) are 3.15 and 4.89 for Thailand and Vietnam, respectively. Monthly household income in PPP adjusted exchange rate is calculated by multiplying the reported monthly household income with the adjustment factors. bPPP- adjusted exchange rate at city-specific levels with GDP/capita of Bangkok in 2005 is 2.74 times higher than that of Thailand national average (source: www.nesdb.go.th.); GDP/capita of Quangnam in 2005 is equal 0.35 time of the Vietnam national average (source: Vietnam Statistical Yearbook 2005).
Regarding the distance from the goods, the Thailand survey asked respondents in Bangkok which was about 300km away from the good being valued. In the Vietnam survey, respondents
12

in the same local province were asked. If there is a distance decay effect, one would expect the Vietnam survey to yield higher estimates than the Thailand survey, ceteris paribus.
Table 2 also presents socio-economic characteristics of the respondents7. The Thailand sample was younger; more educated and had much higher reported income than the Vietnam sample. Reported household monthly income (converted into a common currency, US$) of Thai respondents is nearly eleven times higher than that of Vietnamese respondents. If we use the Purchasing Power Parity (PPP) to adjust income levels in the two countries (i.e. at the national average level), the difference is reduced to about seven times. However, if we use the PPP-adjusted at city specific exchange rate, the difference is considerably increased up to fifty five times. The difference in absolute income levels between the two samples coupled with other differences in the socio-economic characteristics of the two surveys could significantly affect WTP results and the accuracy of benefit transfer between the two goods.
Table 3 compares the study design of the two surveys. In Thailand both tax and donation were used as payment vehicles, but results shown that there was no significant difference in WTP between these two payment vehicles. In Vietnam all respondents were asked their WTP in terms of a tax.
In Thailand we asked an individual respondent if he himself would be willing to pay, while in Vietnam we asked a household head if his household would be willing to pay. One would expect that WTP per individual is lower than WTP per household. Thus, using individual WTP to predict household WTP would be expected to yield an underestimate.
As elicitation format, the Thailand survey used a referendum DC format, while in Vietnam we used a special DC question based on the dissonance-minimizing (DM) format8 proposed by Blamey et al. (1999). Thus, the difference in political context between the two countries (where Vietnamese are not used to referenda) affected the choice of using the elicitation format.
With respect to the sensitivity to scope, only the Thailand survey tests this and finds that WTP is significantly higher for ten than for two temples. The next question is whether the complex of 25 temples at the My Son site is more comparable to two temples at two sites in Thailand, or ten temples at ten different sites in Thailand?
7 With socio-economic characteristics, we are short of data to make a direct comparison between our samples with sample of Quangnam region in the case of Vietnam and the appropriate region in Thailand. For the Vietnam study, Tuan and Navrud (in press) compared this sample with the population of Quangnam province and find that variables of the sample such as gender, attending school, unemployment and percentage of surveyed households living in urban areas are not significantly different from the Quangnam province. However, respondents’ age is higher and respondents’ income is lower than the average population. For the Thailand sample, our socio-economic characteristics are very similar to results of other CV surveys conducted in Bangkok region. For example, the CV survey on WTP for sea turtle conducted in Bangkok show that the respondent’s years at schooling is 14 years, the respondent’s household monthly income is US$630, and the respondent’s age is 39 (Nabangchang et al. 2006).
8 As in Blamey et al. (1999), results of the WTP question (as seen in the appendix C) were coded as: option 1 = ‘yes’, otherwise = ‘no’.
13

Table 3. A comparison of methodological characteristics of the two surveys
Selection criteria Thailand survey Vietnam survey
Payment vehicle Increase in income tax, and voluntary donation in split sample
Increase in income tax
Choice mechanism Individual decision to vote ‘yes’ or ‘no’ (individual’s WTP).
Family decision to choose option ‘yes’ or ‘no’ (household’s WTP)
Financial mechanism
Special fund solely for the preservation of temples at risk in the central region of Thailand.
Special fund solely for the preservation of My Son temples.
Time of payment One-time payment One-time payment
Elicitation format DC (binary, discrete choice) DM (coded as binary, discrete choice)
Stated prices in local currencies
50; 100; 200; and 500 Thai baht (4 amounts)
5,000; 20,000; 50,000; and 100,000 VND (4 amounts)
US$ equivalence 1.25; 2.5; 5.0; 12.5 0.31; 1.26; 3.14; 6.29
PPP-adjusted US$ 3.93; 7.87; 15.74; 39.34 1.52; 6.17; 15.37; 30.79
Scope test Yes; 2 temples versus 10 temples at different sites
No; One site with complex of temples
On the other hand, there are some similar features between the two surveys. These include scenario description (from the status quo to a proposed preservation program), property rights (WTP for an improvement), tax payment vehicle, financial mechanism (special fund solely for the preservation of temples in question), time of payment (one-off payment), elicitation method (coded as binary, discrete choice), and number of price levels (4 amounts), see table 1, 2 and 3.
In table 4, we list factors that differ between the two surveys, and show how they are expected to affect the WTP. The net effects of these differences are, however, difficult to predict as we do not know the magnitudes of the expected positive and negative effects on WTP, and for some effects we cannot even predict the direction of the effect.
Table 4. List of factors that are expected to affect the WTP results in the two surveys
1. Factors that could give higher WTP in the Thailand than in the Vietnam survey
- Income (both actual and PPP adjusted).
- Education (which could be proxies for income and knowledge/interest in cultural heritage).
- Referendum DC vs. DM format (as Blamey et al. [8] argued, the DM format can reduce the yea-saying problem that may occur in the DC format, and provide lower WTP).
2. Factors that could give lower WTP in the Thailand than in the Vietnam survey
- Level of significance (a national public goods vs. a global public goods)
- Distance from the site (about 300 km vs. within 100km), i.e. distance decay in WTP
14

- Availability of substitute cultural heritage sites
- Choice of mechanism (individual’s WTP vs. household’s WTP)
3. Factors with unknown direction of effect on WTP
- Knowledge and attitude characteristics
- Other socio-economic characteristics (gender, age)
If we perform a benefit transfer between these two cultural heritage goods without accounting for these differences, the transferred WTP estimate could potentially be non-informative. However, correcting for only a few of these factors might not provide a more accurate estimate as other factors remain. Thus, it could well be that in a naïve transfer without any corrections, factors affecting WTP in different directions could cancel out, and provide lower transfer errors.
In the following sections, we will compare results of these two surveys and perform tests of benefit transfer between the two goods.
3. Results
3.1 Public perceptions of the preservation of cultural heritages
Table 5 presents the responses to a number of attitudinal statements, sought to discover respondents’ underlying motives for supporting the preservation of cultural heritages.
The first question asked respondents how important it was to have cultural heritage so that they and their family could visit them at the present time. This question was intended to reveal whether respondents had any direct use of these temples. There are 79% and 89% of respondents agree with this statement for the Thailand survey and Vietnam survey, respectively.
Another probing question on the importance of non-use values to respondents was in the form of a statement: “It is important to have these temples so that other people can visit them now”. Agreement with this statement would suggest that a historic temple was recognized for its non-use values (option and existence/altruistic values). A majority of respondents agreed with this statement.
Bequest value is a type of non-use value, which captures the belief that even if we do not use cultural heritage now, we have a duty to pass on these cultural assets to our children so that they can benefit from them. A very high percentage of respondents, 98 and 99 percent for the Thailand survey and Vietnam survey, agreed with this statement. This implies that the respondents believe that these temples are of value because of the benefits they can provide to future generations.
Statements 4 and 5 sought to reveal whether respondents felt that historic temples had ‘existence value’ and therefore, that we had a duty to protect them. A majority of respondents did agree that we do have such a moral duty. The responses given to the last two attitudinal questions appear to be consistent with one another.
15

Table 5. Respondent’s attitudes towards the importance of cultural heritage
Variables Description Thailand Mean
std.dev)
Vietnam Mean
(std.dev)
T-test (p-value)
Attitude1
(use value)
It is important to have these sites so that you and your family can visit them now (1 = yes, 0 = no).
0.79
(0.40)
0.89
(0.31) 0.000
Attitude2
(non-use)
It is important to have these temples so that other people can visit them now (1 = yes, 0 = no).
0.99
(0.10)
0.97
(0.18) 0.077
Attitude3 (bequest)
It is important to have these sites so that future generations can visit them (1 = yes, 0 = no).
0.98
(0.14)
0.99
(0.09) 0.213
Attitude4 (existence)
It is important to have these sites because they inspire pride in our heritage (1 = yes, 0 = no).
0.98
(0.12)
0.97
(0.18) 0.537
Attitude5 (existence)
It is important to have these sites to remember events in history (1 = yes, 0 = no).
0.97 (0.16)
0.98 (0.11) 0.230
It is worth noting that among these five attitude statements, nearly all respondents agree with the last four statements in both Thailand and Vietnam (and there are no significant differences in these statements between the two surveys). Note, however, that a lower percentage of Thai than Vietnamese respondents agreed to the first statement (and there is significant difference in this statement between the two surveys), which reflects use values of the temples.
This significant difference could be explained by the Thai respondents having more substitute sites they could visit than the Vietnamese respondents. Thai respondents are people in Bangkok, far away from historical temples in the central region of Thailand. Thus, they have more cultural heritage sites than just historical temples in the central region they could visit. On the contrary, the Vietnamese respondents are local people, quite close to My Son temples. Thus, a visit to My Son may be the first priority in their decision to visit cultural heritage sites. The difference in availability of substitute sites would lead to higher WTP in the Vietnam than the Thailand survey, ceteris paribus.
3.2 Determinants of the WTP
Respondents’ WTP was modeled using logistic regression with the bid amounts and socio-economic variables as the explanatory variables for whether people said yes or no to paying the stated amount. This is the common approach in CV studies to test the validity of WTP results by examining how well the model corresponds to economic theory where individuals with higher income are expected to have a higher WTP than those with lower income. Table 6 reports results of the logit models.
16

As expected, the relationships between WTP responses and some socio-economic characteristics of respondents shown by the models were logical and in line with economic theory. The bid variable is negative and significant in all models, indicating that the probability of saying yes to pay decreases as the amount stated (i.e. price) increases. Income is positive and significant in all models, suggesting that a respondent with higher income has a higher probability of answering yes to pay. Education is positive in all models and significant in Vietnam and pooled models (at 10% level), implying that the probability of yes responses increases for a respondent with 12 years of schooling or more. Education might be a proxy of income, but also for increased knowledge about and interest in cultural heritage sites.
Table 6. Estimated parameters of the logit models
Variables Description Thailand Coeff.
(p-value)
Vietnam Coeff.
(p-value)
Pooled Coeff.
(p-value)
Constant 0.109 (.859)
-8.030 (.000)
0.342 (.467)
Bids Bid amounts -0.068 (.000)
-0.126 (.000)
-0.075 (.000)
Male If respondent is male -0.240 (.230)
0.263 (.647)
-0.055 (.737)
Age The respondents’ age -0.010 (.274)
0.015 (.616)
-0.005 (.512)
Education Years of schooling (edu ≥ 12) 0.423 (.158)
1.318 (.062)
0.404 (.060)
Income The respondent’s household monthly income
0.0002 (.000)
0.019 (.000)
0.0002 (.000)
Attitude The respondent’s attitude towards the importance of cultural heritages
0.529 (.209)
1.646 (.104)
0.258 (.422)
Summary statistics
Log-likelihood -303.63 -64.04 -438.19
Pseudo-R2 0.16 0.61 0.17
Chi-squared 113.38 233.55 161.24
Number of obs. 520 231 751
Note: The LR test is used to see whether the two surveys originate from one and the same underlying sample. To this purpose, the two datasets are pooled and the lobit model is estimated for the data set as a whole. The outcome of the LR test statistic leads us to the rejection of the null hypothesis that data from the two surveys can be pooled into the same model. However, we
17

include this model in our study because this pooled model is used to reject/accept the null hypothesis of equality of function transfer (Hypothesis 3), as described in the appendix B.
Results show that the respondents’ attitude is positive, but significant (at 10% level) only in the Vietnam survey.
Other socio-economic variables such as sex and age are not significant.
3.3 Mean WTP and WTP as a fraction of income
As presented above, the Thailand survey performed two methodological tests: the payment vehicle test and scope test. We failed to reject the null hypothesis of equality between tax and donation payment, and therefore we pooled the data of these two sub-samples for further analyses. Respondents would pay significantly more for ten than for two temples, and thus passed this between-sample scope test.
Table 7 shows bid amount and proportion of yes responses for the Thailand survey.
Table 7. Bids and proportions of yes response in the Thailand survey
Two temples Ten temples Bids (Baht)
Bids (US$)
Bids (PPP-adjusted,
US$) N % yes N % yes
50 0.62 3.93 60 0.62 70 0.69
100 0.47 7.87 60 0.47 70 0.61
200 0.42 15.74 60 0.42 70 0.59
500 0.15 39.34 60 0.15 70 0.16
240 280
Figures 1 plots the relative frequencies of acceptance of the offered bids (the bids are converted into US$ with PPP-adjusted exchange rate).
18

Figure 1. The Bid Curve of the Thailand survey
Proportions of yes response for the Thailand survey
0.62
0.470.42
0.15
0.690.61 0.59
0.16
0.000.100.200.300.400.500.600.700.80
3.93 7.87 15.74 39.34
Bids ($)
% y
es 2 temples10 temples
Table 8 reports bid amounts and proportions of yes responses for the Vietnam survey.
Table 8. Bids and proportions of yes response in the Vietnam survey
Bids (‘000VND)
Bids (US$)
Bids (PPP-adjusted,
US$)
N % yes
5 0.31 1.52 55 0.76
20 1.26 6.17 58 0.52
50 3.14 15.37 60 0.47
100 6.29 30.79 58 0.12
231
Figure 2 plots the bid curve of the Vietnam survey with PPP-adjusted exchange rate.
19

Figure 2. The Bid Curve of the Vietnam survey
Proportions of yes response for the Vietnam survey
0.76
0.520.47
0.12
0.000.100.200.300.400.500.600.700.800.90
1.52 6.17 15.37 30.79
Bids ($)
% y
es
As expected, as the bid amounts increase the proportions of yes responses decrease in both surveys.
Table 9 reports WTP estimates from the two surveys. Mean WTP values are computed using the sample means of all variables in the logit models.
Table 9. Mean WTP estimates (US$)
Thailand
2 temples 10 temples
Vietnam
Mean WTP (Non-adjusted exchange rate; US$) 5.09 6.27 2.74
Mean WTP (PPP-adjusted exchange rate; US$) 16.03 19.72 13.39
WTP as a fraction of household income (%) 0.05 0.07 0.32
Results show that WTP constitutes of 0.05% (for two temples) to 0.07% (for ten temples) of household annual income in the Thailand survey, and 0.32% of household annual income in the Vietnamese survey, taking into account that the goods are not exactly identical. It is worth noting that during the interviews we asked an individual’s WTP and household’s WTP in the Thailand and Vietnam survey, respectively. The WTP constitutes a much smaller part of annual household annual income in the Thailand survey could be due to the fact that the Thailand survey asked for individual WTP whereas the Vietnam survey asked for household WTP.
20
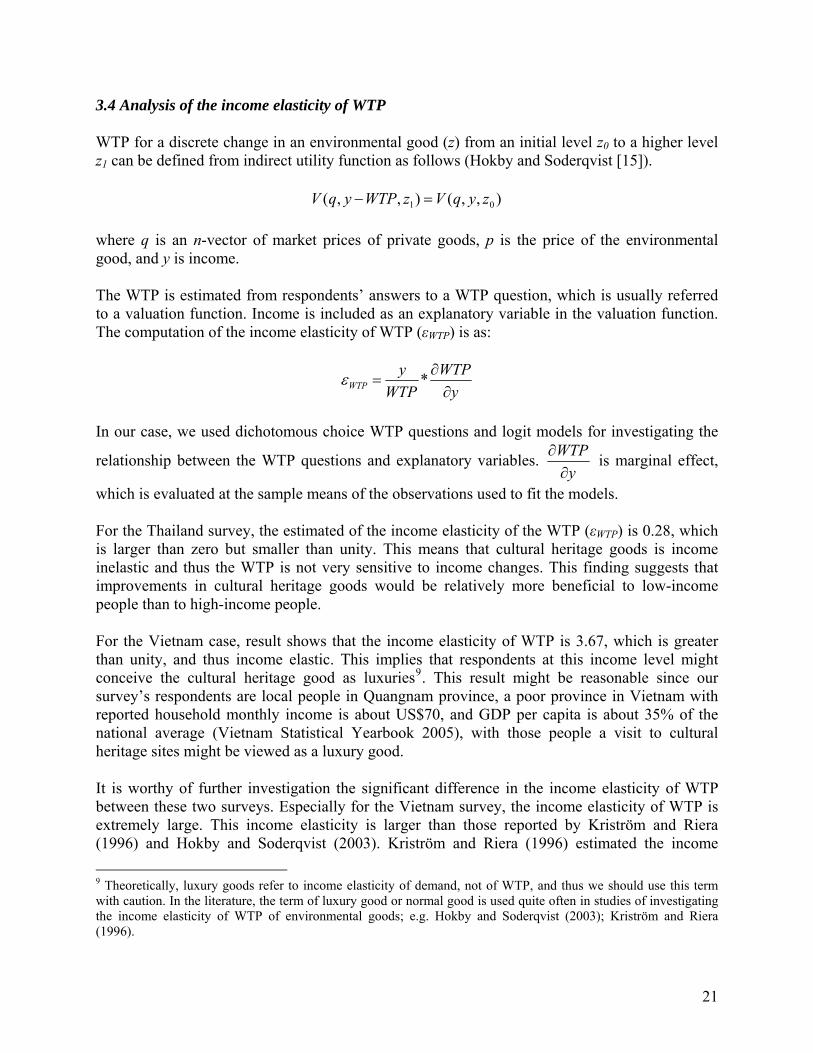
3.4 Analysis of the income elasticity of WTP
WTP for a discrete change in an environmental good (z) from an initial level z0 to a higher level z1 can be defined from indirect utility function as follows (Hokby and Soderqvist [15]).
),,(),,( 01 zyqVzWTPyqV =−
where q is an n-vector of market prices of private goods, p is the price of the environmental good, and y is income.
The WTP is estimated from respondents’ answers to a WTP question, which is usually referred to a valuation function. Income is included as an explanatory variable in the valuation function. The computation of the income elasticity of WTP (εWTP) is as:
yWTP
WTPy
WTP ∂∂
= *ε
In our case, we used dichotomous choice WTP questions and logit models for investigating the
relationship between the WTP questions and explanatory variables. y
WTP∂
∂ is marginal effect,
which is evaluated at the sample means of the observations used to fit the models.
For the Thailand survey, the estimated of the income elasticity of the WTP (εWTP) is 0.28, which is larger than zero but smaller than unity. This means that cultural heritage goods is income inelastic and thus the WTP is not very sensitive to income changes. This finding suggests that improvements in cultural heritage goods would be relatively more beneficial to low-income people than to high-income people.
For the Vietnam case, result shows that the income elasticity of WTP is 3.67, which is greater than unity, and thus income elastic. This implies that respondents at this income level might conceive the cultural heritage good as luxuries9. This result might be reasonable since our survey’s respondents are local people in Quangnam province, a poor province in Vietnam with reported household monthly income is about US$70, and GDP per capita is about 35% of the national average (Vietnam Statistical Yearbook 2005), with those people a visit to cultural heritage sites might be viewed as a luxury good.
It is worthy of further investigation the significant difference in the income elasticity of WTP between these two surveys. Especially for the Vietnam survey, the income elasticity of WTP is extremely large. This income elasticity is larger than those reported by Kriström and Riera (1996) and Hokby and Soderqvist (2003). Kriström and Riera (1996) estimated the income 9 Theoretically, luxury goods refer to income elasticity of demand, not of WTP, and thus we should use this term with caution. In the literature, the term of luxury good or normal good is used quite often in studies of investigating the income elasticity of WTP of environmental goods; e.g. Hokby and Soderqvist (2003); Kriström and Riera (1996).
21

elasticity of environmental improvements for a number of European datasets. They found that the income elasticity is consistently less than one, with few exceptions. Hokby and Soderqvist (2003) presented 21 estimates of the income elasticity of environmental services in Sweden with ranging between –0.71 and 2.83. However, this elasticity is closed to results of Navrud and Vondolia (2005), especially with results of the local resident group. This study finds that the income elasticity of WTP for environmental protection can be very high for poor local residents in Ghana (1.77- 2.99) and below unity (0.17- 0.84) for a high income population (in this case foreign tourists).
The above income elasticities of WTP for Vietnam and Thailand are calculated at mean income in each country. Since the income level in the two countries is very different, this could explain the difference in elasticities. We therefore calculate and compare elasticities at a common income level10, which means a somewhat lower and much higher income level than average income for the Thailand and Vietnam samples, respectively. Using a common income level, we find that the income elasticities of WTP are 0.27 and 1.62 for the Thailand and Vietnam surveys, respectively. This means that even if the income elasticity of Vietnam is much smaller at this higher, common income level, and also within the range of elasticities found in other studies, there is still a large difference between the two countries. Thus, there must be other factors than income level that may explain the difference in elasticities. This also suggests that benefit transfer with adjustments for differences income level only, which is common in practice, will not be sufficient to avoid large transfer errors in cultural heritage benefit transfers.
3.5 Tests of benefit transfer
In this section, we conduct tests of validity and reliability of different benefits transfer techniques (i.e. unit value transfer and functional transfer) when transferring WTP estimates between the two sites. Validity tests investigate the extent to which the WTP values and functions are transferable from a statistical view of point (also termed as statistical tests). Reliability refers to the extent to which the predicted values and original values are the same, which is measured in terms of transfer errors; see Brouwer and Bateman (2000); Krupnick et al. (2006).
3.5.1 Equality of unit value transfers and functional transfers
We use t-test to examine whether mean WTP values are the same between the two surveys. The likelihood ratio (LR) test is used to investigate the equivalency of the coefficients of the estimated functions, as presented in appendix B.
For unit value transfers, results in table 10 show that mean WTP with PPP-adjusted exchange rate are not significantly different when we transfer values from Vietnam to Thailand (with two temples) and vice versa. However, mean WTP values in the other cases are significantly different.
10 A common income level is the range of income (converted into US$ with PPP-adjusted exchange rate) that observations/ respondents of the two surveys have income in this range. In order to obtain the common income level, we remove observations with income that are out of this range from the two surveys.
22
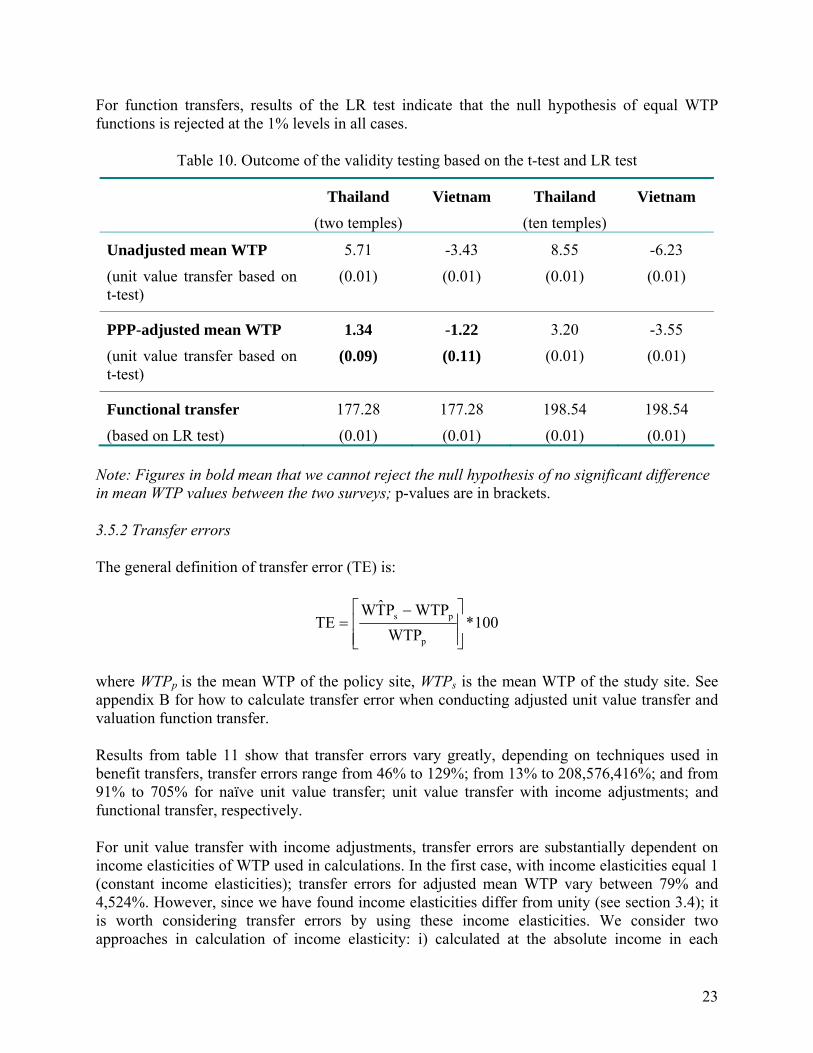
For function transfers, results of the LR test indicate that the null hypothesis of equal WTP functions is rejected at the 1% levels in all cases.
Table 10. Outcome of the validity testing based on the t-test and LR test
Thailand (two temples)
Vietnam
Thailand (ten temples)
Vietnam
Unadjusted mean WTP (unit value transfer based on t-test)
5.71
(0.01)
-3.43
(0.01)
8.55
(0.01)
-6.23
(0.01)
PPP-adjusted mean WTP (unit value transfer based on t-test)
1.34
(0.09)
-1.22
(0.11)
3.20
(0.01)
-3.55
(0.01)
Functional transfer (based on LR test)
177.28
(0.01)
177.28
(0.01)
198.54
(0.01)
198.54
(0.01)
Note: Figures in bold mean that we cannot reject the null hypothesis of no significant difference in mean WTP values between the two surveys; p-values are in brackets.
3.5.2 Transfer errors
The general definition of transfer error (TE) is:
100*WTP
WTPPT̂WTE
p
ps
⎥⎥⎦
⎤
⎢⎢⎣
⎡ −=
where WTPp is the mean WTP of the policy site, WTPs is the mean WTP of the study site. See appendix B for how to calculate transfer error when conducting adjusted unit value transfer and valuation function transfer.
Results from table 11 show that transfer errors vary greatly, depending on techniques used in benefit transfers, transfer errors range from 46% to 129%; from 13% to 208,576,416%; and from 91% to 705% for naïve unit value transfer; unit value transfer with income adjustments; and functional transfer, respectively.
For unit value transfer with income adjustments, transfer errors are substantially dependent on income elasticities of WTP used in calculations. In the first case, with income elasticities equal 1 (constant income elasticities); transfer errors for adjusted mean WTP vary between 79% and 4,524%. However, since we have found income elasticities differ from unity (see section 3.4); it is worth considering transfer errors by using these income elasticities. We consider two approaches in calculation of income elasticity: i) calculated at the absolute income in each
23

country (i.e. 0.28 and 3.67 for the Thailand and Vietnam surveys, respectively) and ii) calculated at a common income level (which equal 0.27 for the Thailand and 1.62 for the Vietnam survey). We also investigate the effects of using income elasticities at the study site as well as at the policy site. Even though in most real benefit transfer exercises only the elasticity at the study site would be known, the policy site elasticity could be a better predictor of how WTP would change at the policy site, and especially if this elasticity is calculated at the same income level as the study site that the WTP is transferred from.
Table 11. Results of benefit transfers in terms of the transfer errors (TE)
2 temples 10 temples Transfer methods Policy site TE (%) TE (%)
Thailand -46 -56Unadjusted mean WTP (Naïve unit value transfers) Vietnam 86 129
Thailand- NAERa 489 379
Vietnam- NAER -83 -79
Thailand- CSER b 4,524 3,659
Adjusted mean WTP (Unit value transfers with income elasticities equals 1)
Vietnam- CSER -98 -97
Thailand- NAER 108,143 87,888
Vietnam- NAER -31 -15
Thailand- CSER 208,576,416 169,547,646
Adjusted mean WTP (Unit value transfers with income elasticity calculated at mean income in each country (0.28, 3.67); using income elasticity at the study site) Vietnam- CSER -61 -52
Thailand- NAER 1,885 1,514
Vietnam- NAER -29 -13
Thailand- CSER 56,109 45,592
Adjusted mean WTP (Unit value transfers with income elasticity calculated at a common income level (0.27, 1.62); using income elasticity at the study site)
Vietnam- CSER -59 -50
Thailand- NAER 44 17
Vietnam- NAER -100 -100
Thailand- CSER 157 109
Adjusted mean WTP (Unit value transfers with income elasticity calculated at mean income in each country (0.28, 3.67); using income elasticity at the policy site) Vietnam- CSER -100 -100
Thailand- NAER 41 14
Vietnam- NAER -95 -94
Thailand- CSER 144 98
Adjusted mean WTP (Unit value transfers with income elasticity calculated at a common income level (0.27, 1.62); using income elasticity at the policy site)
Vietnam- CSER -100 -100
24

Thailand 705 554Function transfer Vietnam -91 -91
aPPP-adjusted exchange rate at the national average (NAER); bPPP- adjusted exchange rate at city-specific levels (CSER) with GDP/capita of Bangkok in 2005 is 2.74 times higher than that of Thailand national average (source: www.nesdb.go.th.); GDP/capita of Quangnam in 2005 is equal 0.35 time of the Vietnam national average (source: Vietnam Statistical Yearbook 2005).
Using income elasticities at the study site, results show that transfer errors are substantially reduced when using elasticities calculated at a common income level compared to elasticities calculated at the absolute income in each country. The same is true for the cases where we use income elasticities at the policy site, but the transfer error reduction is lower; and lowest when using income elasticities from the policy site calculated at a common income level. Thus, our expectations in terms of reductions in transfer errors are supported. This transfer technique also gives lower transfer errors in 3 out of 4 cases compared to the naïve unit value transfer, but in cases only small reductions in transfer errors compared to this simple approach is achieved. Unexpectedly, exchange rates with national PPP-adjustments provide lower transfer errors than city-specific PPP–adjusted exchange rates.
We also calculate income elasticities of WTP that makes a perfect prediction of WTP between the study and policy site (i.e. zero transfer error).
Results from table 12 show that income elasticities of WTP varies in-between of 0.04 and 0.16, depending on WTP estimates derived from the sub-sample of two or ten temples; and whether we calculate PPP-adjusted exchange rate at national average or city-specific levels. This means that if the income elasticities of the two sites are close to zero and the difference in income elasticities between the two surveys is small, we could obtain a perfect transfer of WTP between the study site and the policy site. This also shows that the naïve unit value transfer (which implicitly assumes zero income elasticity) is a simple and in many cases more reliable value transfer techniques than the more advanced unit value transfers described above; especially compared to those based on income elasticities at the study sites which are commonly used in benefit transfers.
Table 12. Calculations of income elasticities of WTP when transfer error equals zero
2 temples 10 temples Policy site
Income elasticities Income elasticities
Thailand- NAER a 0.08 0.16
Vietnam- NAER 0.08 0.16
Thailand- CSER b 0.04 0.10
Vietnam- CSER 0.04 0.10
25

aPPP-adjusted exchange rate at the national average (NAER); bPPP- adjusted exchange rate at city-specific levels (CSER).
The results shown that transfer errors clearly reduce when we move from using the income elasticities at the study site to using the income elasticities at the policy site. Thus, if we use the income elasticities at the study site when doing a benefit transfer, this could lead to serious biases in transferred estimates. If the income elasticities of the two sites had been closer, the income elasticities of the study site would have been a good predictor for the income elasticities at the policy site.
A comparison between unit value transfer and function transfers show that unit value transfer of unadjusted mean WTP and adjusted mean WTP with using income elasticities at the policy site provides lower transfer errors than functional transfer. Unit value transfer of adjusted mean WTP with unity income elasticities and income elasticities of the study site provides substantially higher transfer errors than function transfer.
The overall range of transfer errors in this study is considerably higher in comparison with results from benefit transfer validity studies of health impacts. Several studies have tested the validity of cross-country benefit transfer in a context of developing countries. Alberini et al. (1997) transferred U.S. estimates to Taiwan to avoid an episode of ill health, the average transfer error across four different possible transfers was 34% (calculated by Ready and Navrud 2006). Chestnut et al. (1997) transferred the U.S. estimates of median WTP to Bangkok, Thailand, the transfer errors ranged from 18% to 35%, depending on the ill-health episode valued (cited in Ready and Navrud 2006). Barton and Mourato (2003) found transfer errors of 87% to 130% when comparing WTP values to avoid ill health episodes from Portugal to Costa Rica. About-Ali and Belhaj (2006) transferred WTP for air quality improvements between Morocco and Egypt and found transfer errors of 60 to 220%.
Ready and Navrud (2006) reviewed cross-country benefit transfer studies conducted to date and found that the average transfer error for cross-country benefit transfers was in the range of 20% to 40%, but individual transfer error was as high as 100–200%. Thus, the lowest transfer errors observed in our study on cultural heritage are of the same magnitude as those found in cross-country benefit transfer in Europe and the U.S. for environmental goods and health impacts.
4. Discussion of the possibilities and difficulties of benefits transfer
The overall range of transfer errors found in our study is significantly larger than transfer errors found in benefit transfer studies for environmental goods and environmentally health impacts. Two hypotheses that benefit transfer studies in the field of environmental economics generally support are those (1) the more similar between the study site and policy site, the higher the validity of a benefit transfer; (2) the more information is being used in benefit transfer, the better it will predict value at the policy site (Navrud and Ready 2007). The former refers to as the similarity in terms of the definition of the good itself, the level of its provision, the extent to which it will change, and the affected population. The latter advocates the use of functional transfers as opposed to unit value transfers. Rosenberger and Phipps (2007) argue that functional transfers can reduce generalization errors compared to unit value transfers. This is due to
26

functional transfers enable the calibration of the function to differences between the study site and the policy site.
As Eftec (2005) argued, cultural heritage goods are highly heterogeneous; it is unlikely to find out two cultural heritage sites that are exactly identical. Each cultural heritage site has its own distinctive features or uniqueness in terms of physical characteristics. It is unlikely that a perfect match can be made between a study site to a policy site. In addition, the body of literature of valuation studies in cultural heritage goods is limited (about 60 valuation studies on very different cultural heritage goods, see Tuan and Navrud (2007)).
This study finds that there is a significant difference in income elasticity of WTP between the two countries. Some of this difference is due to differences in income level. In other words, if the income levels in the two countries are similar, the difference in income elasticities of WTP is smaller but still large. Thus, there are other factors than income that explain the difference in WTP. This makes it difficult to conduct a benefit transfer between countries as income is the one variable that we usually have statistics on at the policy site and can adjust for.
We also find that using the income elasticities at the study site when transferring lead to serious biases in transferred WTP estimates. This is a weakness of benefit transfer, since in practical benefit transfers (where we had not have a primary valuation study at the policy site), we would only have and use the income elasticities observed at the study site (or unity income elasticities) when we transfer, while the theoretically correct one would be the income elasticities at the policy site. Mean WTPs with PPP-adjusted (at the national average level) for differences in income level and using income elasticities at policy site yield much lower transfer errors than using the study site elasticities, but only slightly lower errors compared to the unadjusted WTP. Thus, in practical transfers, when income elasticities at the policy site are not available, unadjusted unit transfer would be the best method. Especially, since we also find that function transfers have larger transfer errors than these two unit transfer methods. This latter result implies that, the more information is being used in benefit transfers, the less robustness the validity of results. This is inconsistent with results observed in benefit transfer studies of environmental economics. Loomis (1992); Parsons and Kealy (1994); Brouwer and Spaninks (1997); and VanderBerg et al. (2003) find that functional transfers outperform unit value transfers. A feasible explanation for this is due to considerable differences in physical characteristics between the two sites as well as differences between the two markets. Physical differences across sites are a typical challenge for benefit transfers of cultural heritage goods. In environmental goods, as Rosenberger and Phipps (2007) argued, a gain in accuracy of functional transfers compared to unit value transfers may be more a function of similarities of the sites than the calibration of site characteristics in the functional transfers. This is because WTP functions from valuation studies usually include only variables measuring socio-economic characteristics of the respondents (including income) and not physical characteristics of the site (i.e. because these characteristics are constant in individual models). However these physical characteristics are important for calibrating values across sites; see Rosenberger and Phipps (2007).
As this study have discussed, physical differences across cultural heritage goods are likely to be larger than for both environmental related health impacts and environmental goods. This makes it more difficult to capture these physical differences in benefit function transfers of cultural
27

heritage goods. Thus, even if we make more corrections for differences in income and socio-economic characteristics, transfer errors are not reduced but could rather increase since we are not at the same time correcting for important physical, cultural and institutional differences between sites.
5. Conclusions
This study analyzes and compares results of two CV surveys on cultural heritage sites conducted in Thailand and Vietnam, tests the validity and reliability of benefit transfer between the two sites, and discusses possibilities and difficulties in such transfers.
Results of the study show that, with respect to socio-economic characteristics, the Thai respondents were younger; more educated and had much higher income than the Vietnamese respondents. Referring to respondent’s attitudes, results from the two surveys are quite similar. We found the following similar patterns in terms of factors explaining WTP in the two surveys: (i) increasing bid amounts decrease in the probability of saying yes to pay; (ii) a respondent with higher household income has a higher probability of answering yes to pay; (iii) a respondent with higher education has a higher probability of paying; and (iv) a respondent with a positive attitude towards the importance of cultural heritages has a positive relationship with the respondent’s agree to pay. Mean WTP with PPP-adjusted exchange rate, was US$16.03 and US$19.72 for two and ten temple sites in the Thai survey, respectively; and US$13.39 for the My Son temples in Vietnam. WTP as a fraction of household income was 0.05% (for two temples) and 0.07% (for ten temples) in the Thai sample; and 0.32% in the Vietnamese sample. The income elasticities of WTP were 0.28 and 3.67 for the Thai and Vietnamese surveys respectively, when calculated income elasticities at the absolute income in each country. The income elasticities were 0.27 for Thailand and 1.62 in the case of Vietnam, if we calculated elasticities at a common income level.
Benefit transfer with implicitly assuming that these two cultural heritage goods are the same, shows that transfer errors of mean WTP vary from 13% to 208,576,416%. This range of transfer errors is considerably larger than transfer errors found in benefit transfer validity studies of environmental goods and health. We find that a naïve unit value transfer yields more accurate WTP estimates than a unit value transfer with adjusted mean WTP and functional transfer. We also find that using the income elasticities at the study site (or constant income elasticities) leads to serious biases in transferred WTP estimates.
In conclusion, benefit transfer of cultural heritage could be highly unreliable due to lack of knowledge about which factors affects WTP for the heterogeneous group of cultural heritage goods, and data on factors we know influence WTP (i.e. income elasticity of WTP at the policy site). If one still decides to perform transfers, our results suggest that he could do just as well (or bad) by performing a simple unadjusted unit value transfer than more complex benefit transfer methods. The result of this study implies that benefit transfer will not provide accurate WTP estimates for cultural heritage goods to be used in cost-benefit analysis and other policy analyses until we have performed more primary valuation studies designed to gain more knowledge about factors that determine WTP for these goods and which we can find data on at the policy site.
28

References
Abou-Ali H. and Belhaj M., (2006). A multicountry analysis of the consistency of benefit transfer, Paper presented at the Third World Congress of Environmental and Natural recourses economics, Kyoto 2006.
Alberini A. and Krupnick A., (1997) Air pollution and acute respiratory illness: evidence from Taiwan and Los Angeles, American Journal of Agricultural Economics 79 1620–1624.
Alberini A., Cropper M., Krupnick A. and Simon N., (2004). Does the Value of Statistical Life Vary with Age and Health Status? Evidence from the U.S. and Canada, Journal of Environmental Economics and Management 48 769-792.
Alberini A., Hunt A. And Markandya A., (forthcoming). Willingness to Pay to Reduce Mortality Risks: Evidence from a Three-country Contingent Valuation Study, Environmental and Resource Economics.
Barton D.N. and Mourato S., (2003). Transferring the benefits of avoided health effects from water pollution between Portugal and Costa Rica, Environment and Development Economics 8 351-371.
Bateman, I. and Munro, A., (2005). Household vs. Individual Valuation: What’s the Difference? European Association of Environmental and Resource Economics, Bremen.
Bateman, I.J., Day B.H., Georgiou S. and Lake I., (2006). The aggregation of environmental benefit values: Welfare measures, distance decay and total WTP, Ecological Economics 60 450–460.
Bergland O., Magnussen K. and Navrud S., (1995). Benefit transfer: testing for accuracy and reliability, Discussion Paper, #D-03/1995, Department of Economics and Social Sciences, Agricultural University of Norway
Blamey, R.K., Bennett, J.W. and Morrison, M.D., (1999). Yes-saying in contingent valuation surveys, Land Economics 75, 126–141.
Boyle, K.J., (2003). Contingent valuation in practice. In: Champ, P.A., Boyle, K.J., Brown, T.C. (Eds.), A Primer on Nonmarket Valuation. Kluwer Academic Publishers, Dordrecht.
Brouwer R., Spaninks F.A., (1999). The validity of environmental benefit transfer: further empirical testing, Environmental and Resource Economics 14 95-117.
Brouwer R. and Bateman, I.J., (2000). A comparison of the social benefits of reducing sunbathing health risks in low and high risk countries: further empirical testing of the validity and reliability of benefits transfer, CSERGE Global Environmental Change, Working Paper GEC2000-17.
29

Brouwer R., Bateman I. (2005). Transfer of Willingness to Pay Estimates and Functions for Health-Risk Reductions: A Cross-Country Study, Journal of Health Economics 24 591-611.
Cameron, T.A., Poe, G.L., Ethier, R.G. and Schulze, W.D., (2002). Alternative non-market value-elicitation methods: are the underlying preferences the same? Journal of Environmental Economics and Management 44 (3) 391–425
Carson, R.T, R.C. Mitchell, M.B. Conaway and S. Navrud (1997). Non-Moroccan Values for Rehabilitating the Fes Medina (Valuing cultural heritage objects). Report to the World Bank on the Fes Cultural Heritage Rehabilitation Project. August 21, 1997.
Carson, R.T., Flores, N.E. and Meade, N.F., (2001). Contingent Valuation: Controversies and Evidence, Environmental and Resource Economics 19: 173–210, 2001.
Chestnut, L., Ostro, B., Vicit-Vadakan, N., (1997). Transferability of air pollution control health benefits estimates from the United States to developing countries: evidence from the Bangkok study, American Journal of Agricultural Economics 79, 1630–1635.
Cummings R.G. and Taylor L.O., (1999). Unbiased Value Estimates for Environmental Goods: A Cheap Talk Design for the Contingent Valuation Method, The American Economic Review 89 649-665.
Downing M. and Ozuna T., (1996). Testing the Reliability of the Benefit Transfer Approach, Journal of Environmental Economics and Management 30 316–322.
Eftec, 2005. Valuation of the Historic Environment - the scope for using results of valuation studies in the appraisal and assessment of heritage-related projects and programs, Final Report, Report to English Heritage, the Heritage Lottery Fund, the Department for Culture, Media and Sport and the Department for Transport.
GHF, (2002). Global Heritage Fund 2002 Nominations, paper is available at http://www.globalheritagefund.org/where/myson_scroller.html (20/2/2005).
Glover D., (2005). Saving Thailand's Temples: How much are people willing to pay? EEPSEA Policy Brief, No2005 - PB12.
Glover D., (2006). How much for World Heritage?: The value of temple preservation in Vietnam, EEPSEA Policy Brief, No2006 – PB6.
Hokby S. and Soderqvist T., (2003). Elasticities of Demand and Willingness to Pay for Environmental Services in Sweden, Environmental and Resource Economics 26 361–383.
Jorgensen, B.S. and G.J. Syme, (2000). Protest responses and willingness to pay: attitude toward paying for stormwater pollution abatement Ecological Economics 33 251–265
30

Kirchhoff S., Colby B.G., LaFrance J.T., (1997). Evaluating the performance of benefit transfer: an empirical inquiry, Water Resources Research 33 75-93.
Kristofersson D. and Navrud S., (2005). Validity Tests of Benefit Transfer – Are We Performing the Wrong Tests? Environmental and Resource Economics 30 279–286.
Kriström B. and Riera P., (1996). Is the Income Elasticity of Environmental Improvements Less Than One? Environmental and Resource Economics 7 45-55.
Krupnick A., Bhattacharya S., Alberini A. and Veronesi M., (2006). Mortality Risk Valuation in Six Countries: Testing Benefit-Transfer Approaches, Paper presented at the Third World Congress of Environmental and Natural recourses economics, Kyoto 2006.
Lindhjem, H., (2007). 20 years of stated preference valuation of non-timber benefits from Fennoscandian forests: A meta-analysis, Journal of Forest Economics 12 251-277.
Loomis J.B. and Rosenberger R.S., (2006). Reducing barriers in future benefit transfers: Needed improvements in primary study design and reporting, Ecological Economics 60 343–350.
Mitchell, R.C. and Carson, R.T., (1989). Using Surveys to Value Public Goods: The Contingent Valuation Method, Resources for the Future, Washington, DC, 1989.
Murphy, J.J., Allen, P.G., Stevens, T.H., Weatherhead, D., (2005). A meta-analysis of hypothetical bias in stated preference valuation, Environmental and Resource Economics 30 313–325
Muthke T. and Karin H-M., (2004). National and International Benefit Transfer Testing with a Rigorous Test Procedure, Environmental and Resource Economics, 29 323-36.
Nabangchang, O., J. Jianjun, A. Indab, T.D. Thuy, D. Harder and R. Subade (2006). WTP for Marine Turtle Conservation: A Cross-country Comparison in Asia. Paper presented at the Third World Congress of Environmental and Natural recourses economics, Kyoto 2006
Navrud S., P.E. Pedersen and J. Strand, (1992). Valuing our cultural heritage: a contingent valuation survey, Center for research in economics and business administration, University of Oslo, Norway, 1992.
Navrud, S. and R. C. Ready (2002). Valuing cultural heritage: Applying Environmental Valuation Techniques to Historic Buildings, Monuments and Artefacts. Northampton, MA: Edward Elgar Publishing.
Navrud, S. and G. K. Vondolia 2005: Using contingent valuation to price ecotourism sites in developing countries, Tourism, 53 (2); 115-125.
Noonan, D.S. (2002). Contingent Valuation Studies in the Arts and Culture: An Annotated Bibliography’. http://culturalpolicy.uchicago.edu/CVMpapers/Noonan.html
31
Noonan, D.S. (2003). Contingent valuation and Cultural resources: a meta-analytic review of literature, Journal of Cultural Economics 27, 159-176.
Pearce D.W., Mourato S., Navrud S. and Ready R., (2002). Review of existing studies, their policy use and future research needs, In Navrud, S. and Ready, R. (eds) Valuing Cultural Heritage: Applying Environmental Valuation Techniques to Historic Buildings, Monuments and Artefacts, Edward Elgar, Cheltenham, UK.
Quiggin, J., (1998). Individual and household willingness to pay for public goods, American Journal of Agricultural Economics 80 58–63.
Rabin, M., (1998). Psychology and Economics, Journal of Economic Literature XXXVI, 11–46
Ready R., Navrud S., Day B., Dubourg R., Machado F., Mourato S., Spanninks F., Vázquez Rodriquez M.X., (2004). Benefit transfer in Europe: How reliable are transfers between countries? Environmental and Resource Economics 29 67-82.
Ready R. and Navrud S., (2006). International benefit transfer: Methods and validity tests, Ecological economics 60 (2006) 429-434.
Riganti P. and Nijkamp P., (2005). Benefit transfers of cultural heritage values: How far can we go? Paper presented at the 45th congress of the European regional science association "Land Use and Water Management in a Sustainable Network Society" Vrije Universiteit Amsterdam, August 2005.
Thanakvaro de Lopez et al., (2006). Towards Sustainable Development in Angkor, Cambodia: Social, Environmental and Financial Aspects of Conserving Cultural Heritage, Research report 2006-RR5.
Tuan T.H., (2006). Valuing the economic benefits of preserving cultural heritage: the World Heritage Site, My Son Sanctuary in Vietnam, Research Report No. 2006-RR6 EEPSEA, Singapore, November 2006.
Tuan T.H. and Navrud S., (2007). Valuing cultural heritage in developing countries: comparing and pooling contingent valuation and choice modeling estimates, Environmental and Resource Economics, 38 (1): 51‐69.
Tuan T.H. and Navrud S., (in press). Capturing the benefits of preserving cultural heritage, paper is forthcoming on Journal of Cultural Heritage.
Tuoitre, (2006). Trung cau dan y (referendum), paper is available at http://www.tuoitre.com.vn/Tianyon/Index.aspx?ArticleID=128151&ChannelID=3 (18/03/06)
Seenprachawong U., (2006). Economic Valuation of Cultural Heritage: A Case Study of Historic Temples in Thailand, Research report No. 2005-RR12, EEPSEA, February, 2006, available at: http://eepsea.org/en/ev-108098-201-1-DO_TOPIC.html (20/03/2007).
32
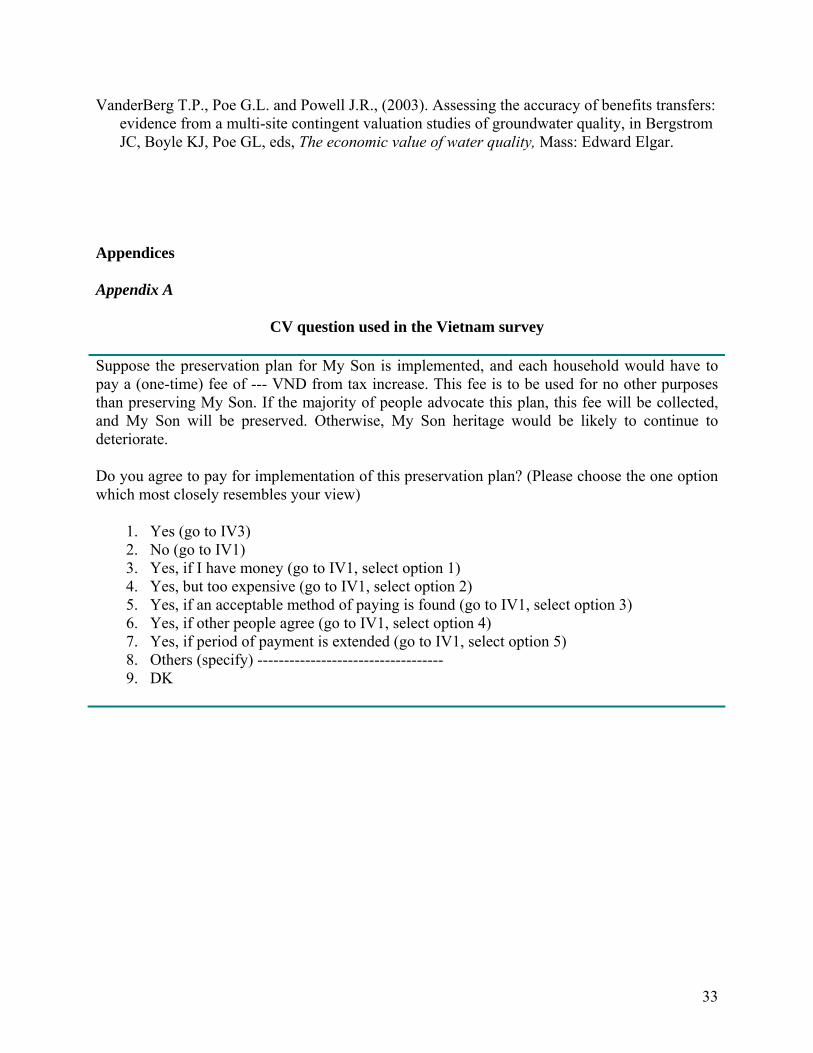
VanderBerg T.P., Poe G.L. and Powell J.R., (2003). Assessing the accuracy of benefits transfers: evidence from a multi-site contingent valuation studies of groundwater quality, in Bergstrom JC, Boyle KJ, Poe GL, eds, The economic value of water quality, Mass: Edward Elgar.
Appendices
Appendix A
CV question used in the Vietnam survey
Suppose the preservation plan for My Son is implemented, and each household would have to pay a (one-time) fee of --- VND from tax increase. This fee is to be used for no other purposes than preserving My Son. If the majority of people advocate this plan, this fee will be collected, and My Son will be preserved. Otherwise, My Son heritage would be likely to continue to deteriorate.
Do you agree to pay for implementation of this preservation plan? (Please choose the one option which most closely resembles your view)
1. Yes (go to IV3) 2. No (go to IV1) 3. Yes, if I have money (go to IV1, select option 1) 4. Yes, but too expensive (go to IV1, select option 2) 5. Yes, if an acceptable method of paying is found (go to IV1, select option 3) 6. Yes, if other people agree (go to IV1, select option 4) 7. Yes, if period of payment is extended (go to IV1, select option 5) 8. Others (specify) ----------------------------------- 9. DK
33

Appendix B
Procedures of testing the validity and reliability of benefit transfer
The validity and reliability of estimates are statistically tested by two main approaches: unit value transfers and function transfers.
1. Unit Value transfers: both unadjusted and adjusted unit value transfers are performed. The statistical hypotheses tested are:
Hypothesis 1: Equality of unadjusted mean WTP sp WTPWTPH∧
=:0
Hypothesis 2: Equality of adjusted mean WTP pspsp PTWYYPTWWTP ~)/(ˆ:H0 == ε
where WTPp is the mean WTP of the policy site, WTPs is the mean WTP of the study site, pPTW ~ is the mean WTP estimated at the policy site using income adjustments, Yp is the average income of the policy site, Ys is the average income of the study site, ε is the income elasticity of WTP.
The transfer errors were calculated by using the formula bellow.
100*ˆ
⎥⎥⎦
⎤
⎢⎢⎣
⎡ −=
p
psunadjusted WTP
WTPPTWTE
100*~
⎥⎥⎦
⎤
⎢⎢⎣
⎡ −=
p
ppadjusted WTP
WTPPTWTE
2. Function transfers: this approach transfers the entire value function estimated for the study site to the policy site. The statistical hypothesis is then:
Hypothesis 3: Equality of WTP functions
spH ββ ˆ~:0 =
spH 220 ˆ~: σσ =
where β is the vector of coefficients and σ2 is the variance-covariance matrix.
The transfer errors are computed using the following formula.
34

100*ˆˆ~
⎥⎥⎦
⎤
⎢⎢⎣
⎡ −=
p
ppadjusted PTW
PTWPTWTE
Where pssp XPTW *ˆˆ~ βα +=
where is the estimated mean WTP of the policy site, pPTW ˆpPTW ~ is the predicted mean WTP of
the policy site based on the estimated WTP function ( sα̂ and ) at the study site, and sβ̂ pX is the vector of mean values for the explanatory variables at the policy site.
The first and second hypothesis can be tested by t-test or Z-test. The t-test assumes that the underlying distribution of the population sample is normal, while the test statistic has a student distribution. For large samples, the test statistic for these two tests is the same
nsPTWWTP
Zt sp
/)ˆ( −
==
where WTPp is the estimated mean WTP value at the policy site, is the estimated mean WTP value at the study site, s refers to the standard deviation of estimator, n is the number of observations and n-1 is the degrees of freedom.
sPTW ˆ
Hypothesis 3 can be tested by the Likelihood Ratio (LR) test as
))((2 21 LLLLLLLR pooled +−−=
where LLpooled is the outcome of the log-likelihood function, the subscripts ‘1’ and ‘2’ refer to the Thailand sample and Vietnam sample respectively, and the subscript ‘pooled’ refers to the pool of these two samples. The degrees of freedom are equal to the number of restrictions imposed.
35