By: Erik Vanyo. 15 years old Play lots of sports Love being around my family & friends.
The Value of Benchmarking:Wastewater Treatment
Jon Vanyo C.E.M.Minnesota Technical Assistance Program

Overview
MnTAP Background
Value of Benchmarking
Types of Benchmarks
Energy Savings Strategies

MnTAP Background
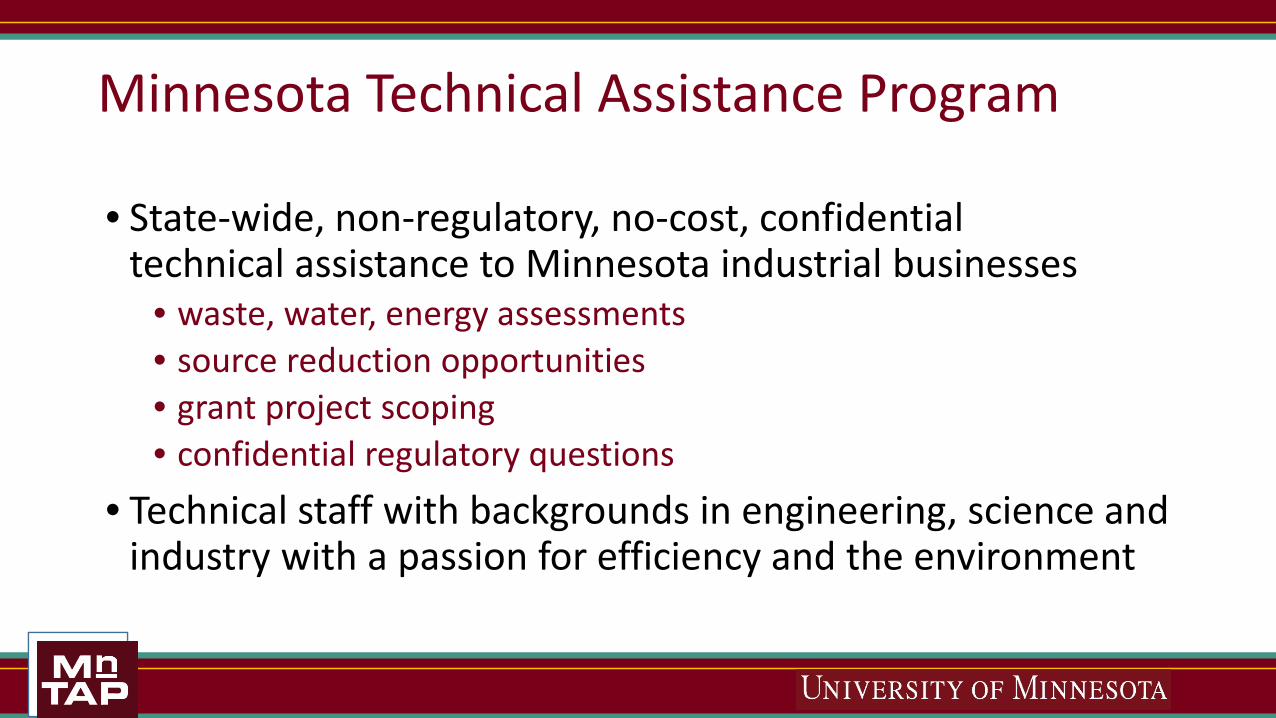
• State-wide, non-regulatory, no-cost, confidential technical assistance to Minnesota industrial businesses
• waste, water, energy assessments• source reduction opportunities• grant project scoping• confidential regulatory questions
• Technical staff with backgrounds in engineering, science and industry with a passion for efficiency and the environment
Minnesota Technical Assistance Program
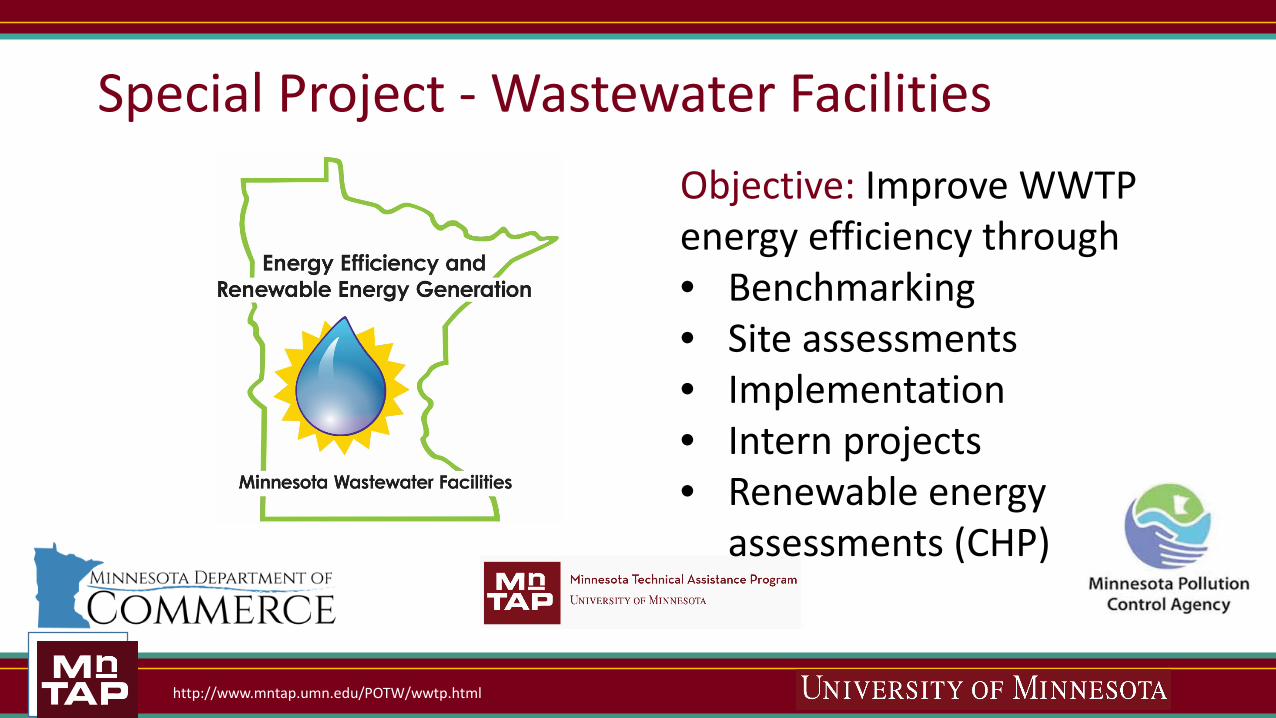
Special Project - Wastewater FacilitiesObjective: Improve WWTP energy efficiency through• Benchmarking• Site assessments• Implementation• Intern projects• Renewable energy
assessments (CHP)
http://www.mntap.umn.edu/POTW/wwtp.html
Value of Benchmarking
Benchmarking makes energy efficiency known.
Benchmarking makes energy efficiency visible.

High benchmark scores are deserving of recognition.
Low scores can justify efficiency improvements.

High or low...
You can leverage your score to benefit your facility.
Benchmarking results in cost savings;
MnTAP’s energy assessments averaged implemented savings of $13,000 per plant per year.
Benchmark scores help, but plant operators and managers are the efficiency champions.
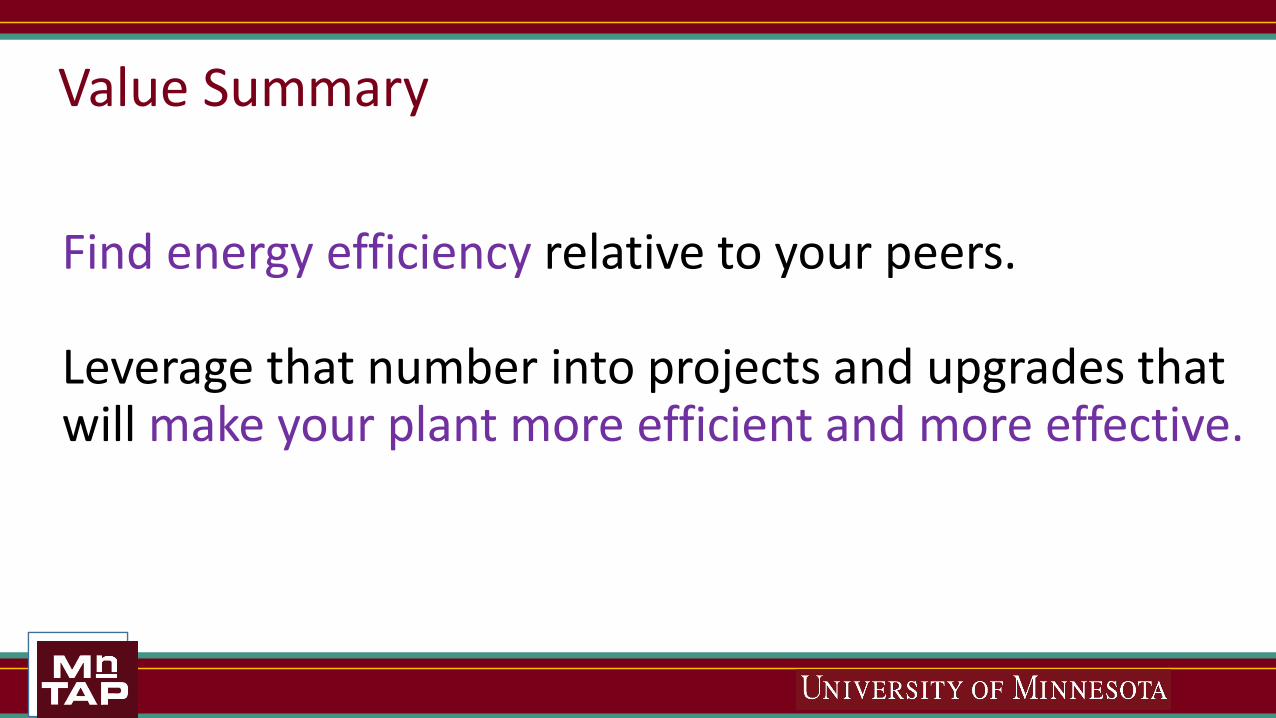
Find energy efficiency relative to your peers.
Leverage that number into projects and upgrades that will make your plant more efficient and more effective.
Value Summary

Types of Benchmarks
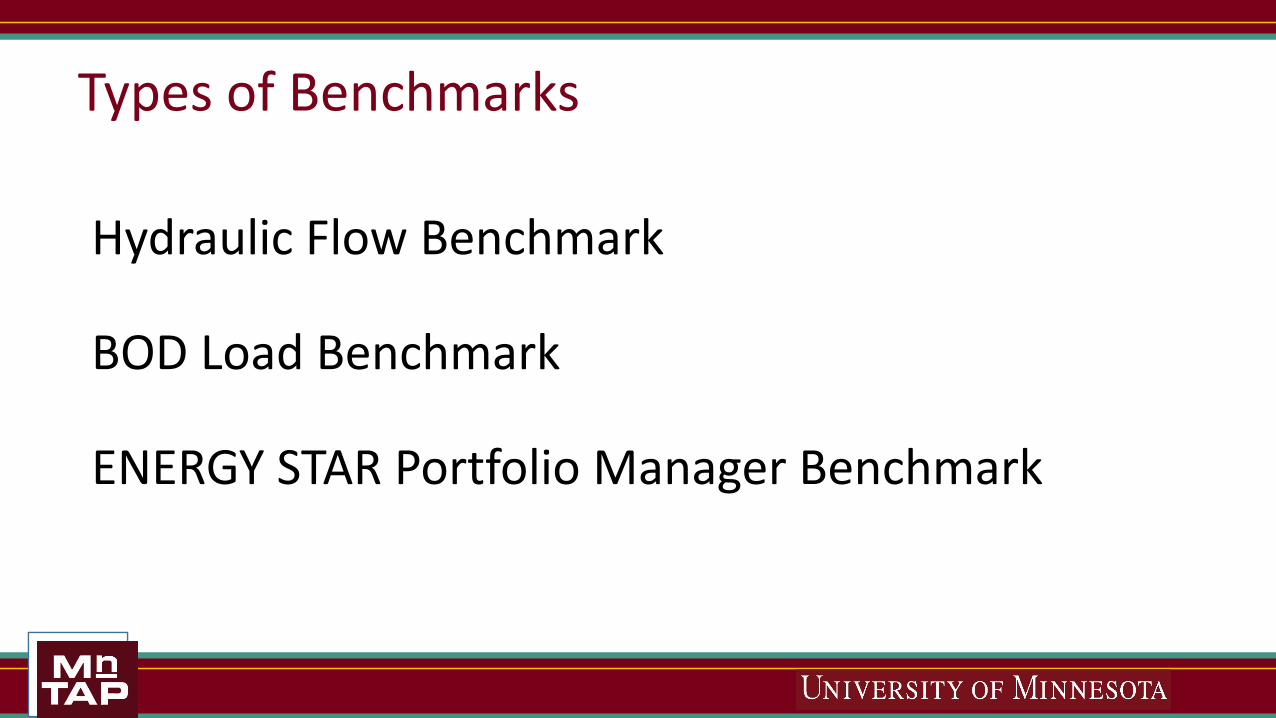
Hydraulic Flow Benchmark
BOD Load Benchmark
ENERGY STAR Portfolio Manager Benchmark
Types of Benchmarks
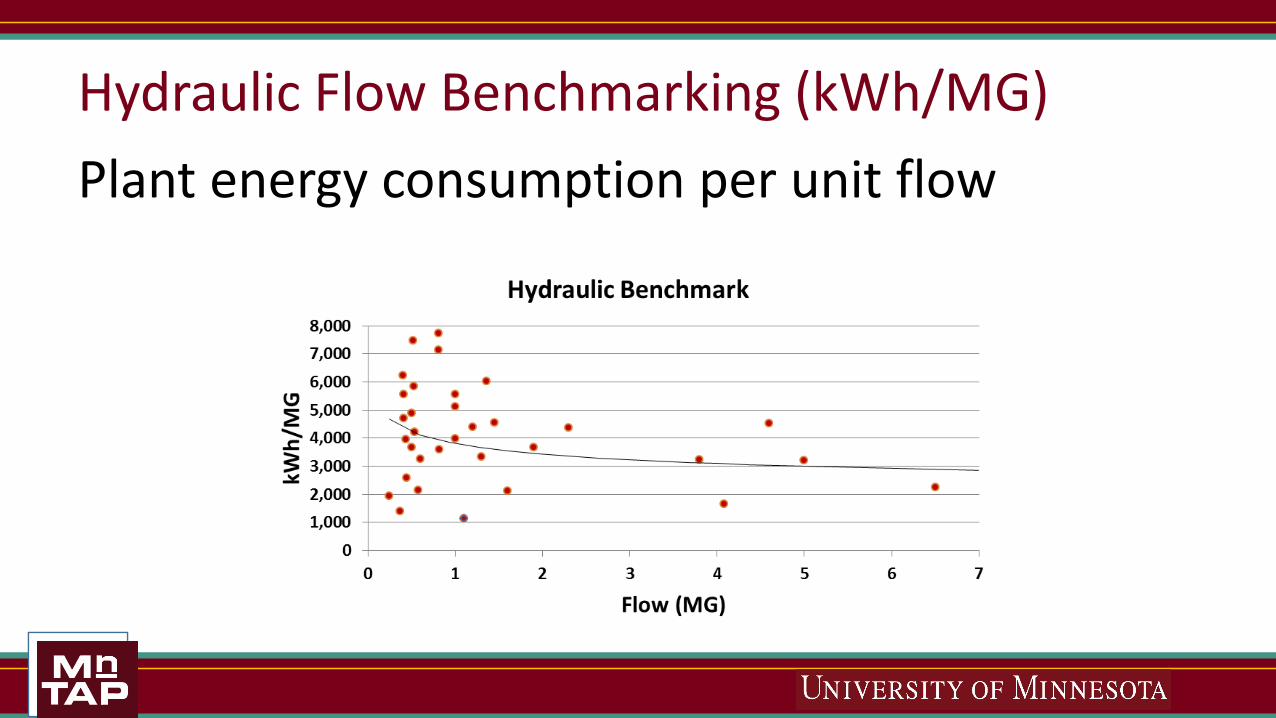
Hydraulic Flow Benchmarking (kWh/MG)Plant energy consumption per unit flow
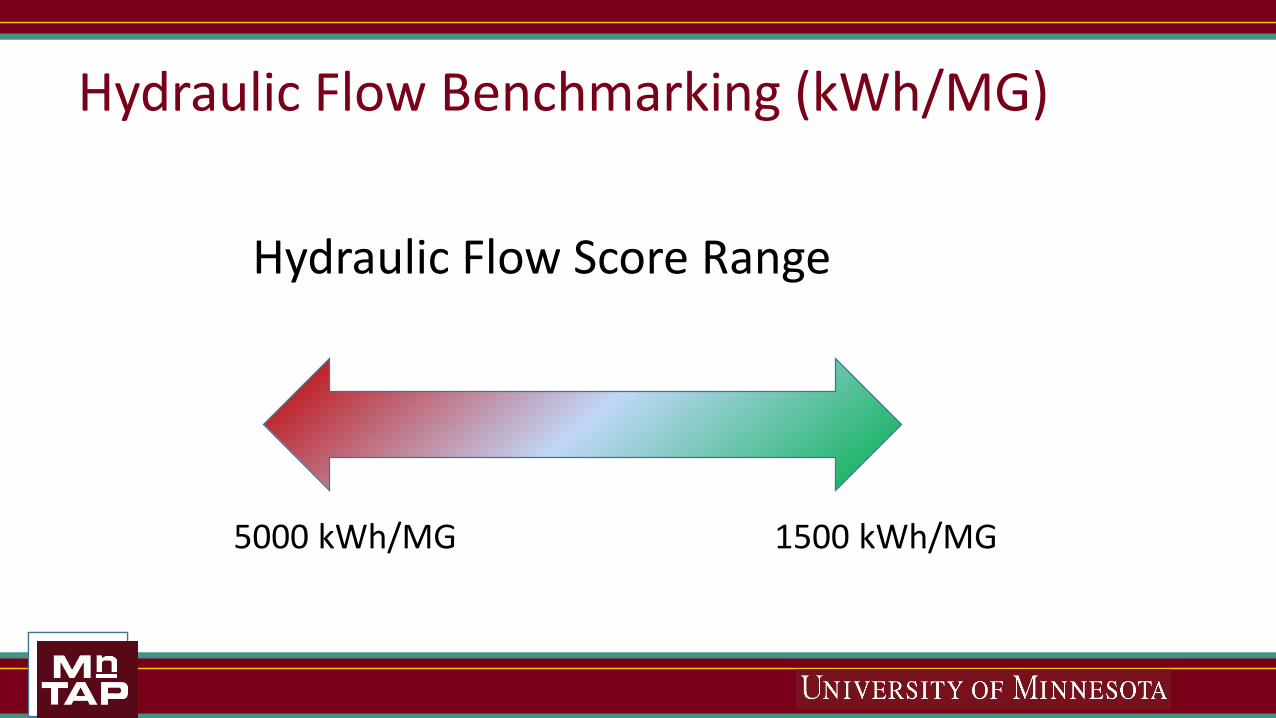
Hydraulic Flow Benchmarking (kWh/MG)
1500 kWh/MG5000 kWh/MG
Hydraulic Flow Score Range
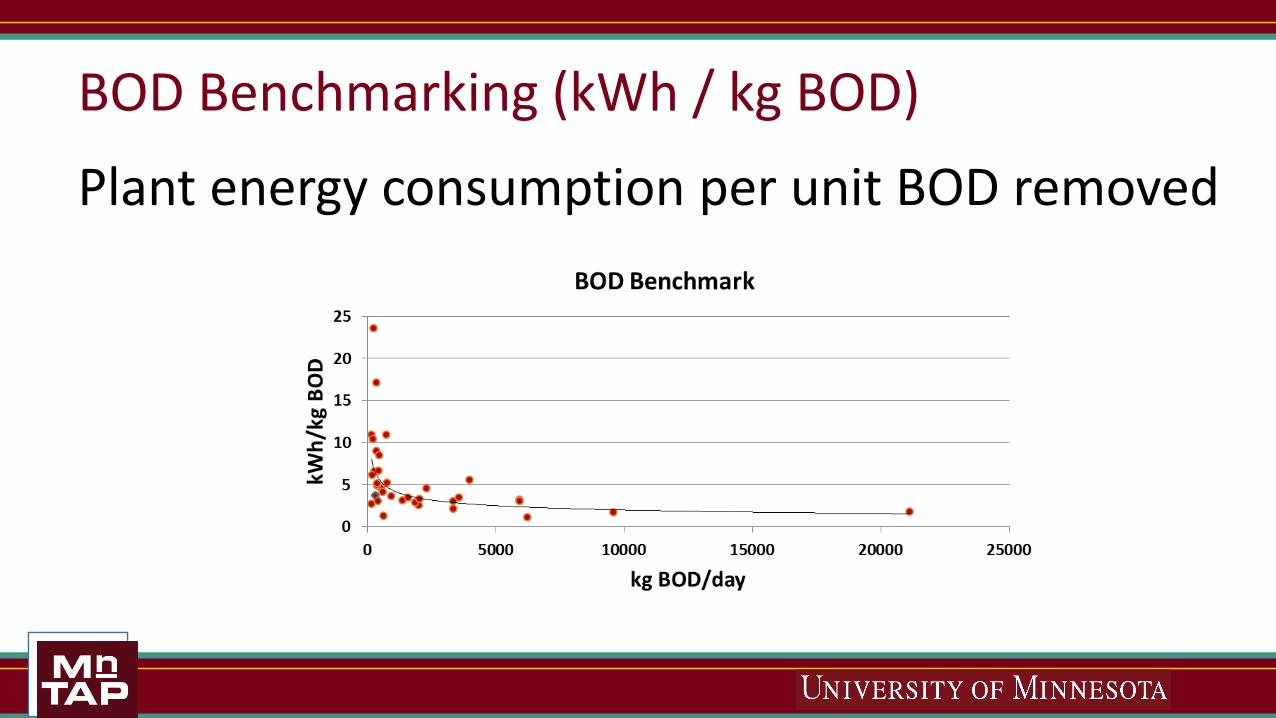
BOD Benchmarking (kWh / kg BOD)
Plant energy consumption per unit BOD removed
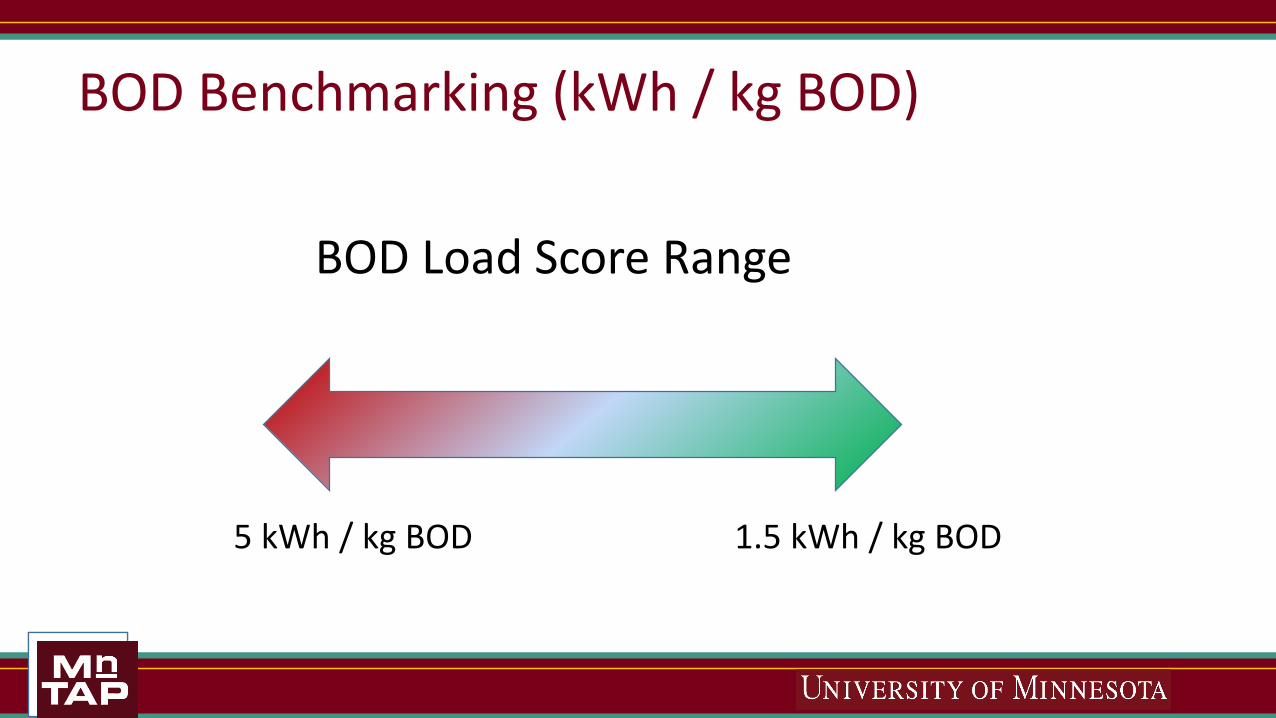
BOD Benchmarking (kWh / kg BOD)
1.5 kWh / kg BOD5 kWh / kg BOD
BOD Load Score Range
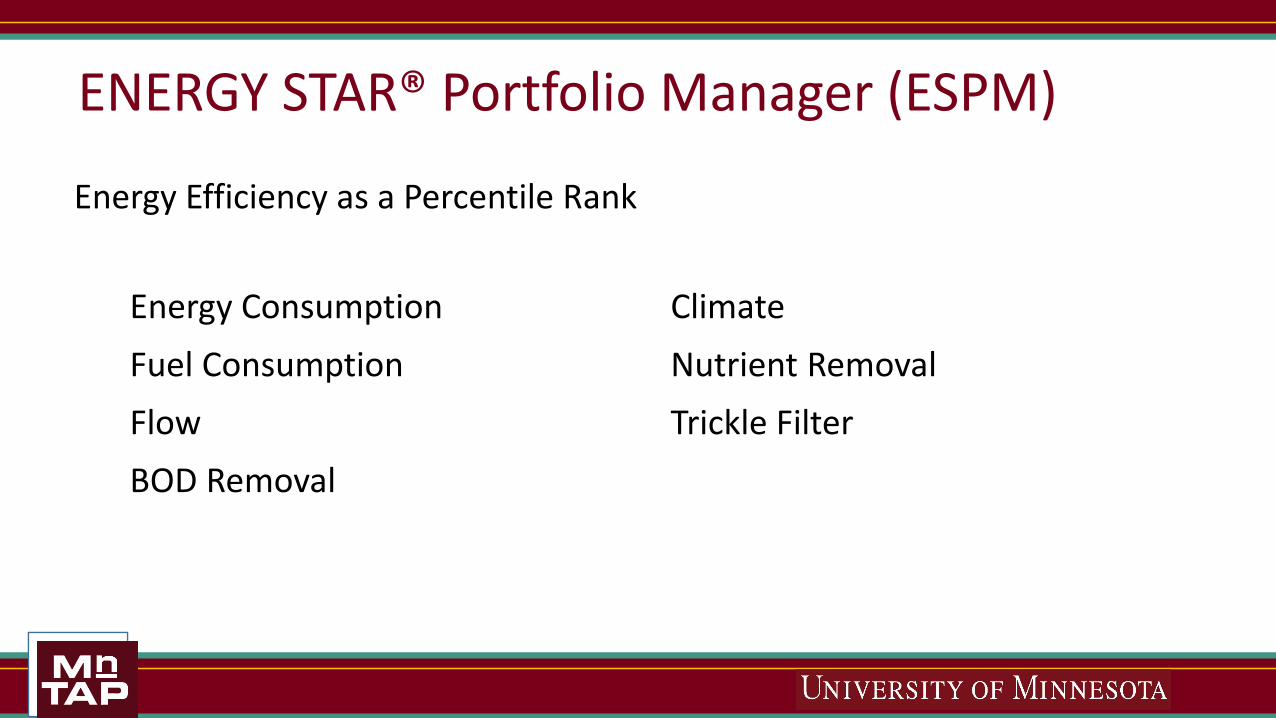
ENERGY STAR® Portfolio Manager (ESPM)
Energy ConsumptionFuel ConsumptionFlowBOD Removal
ClimateNutrient RemovalTrickle Filter
Energy Efficiency as a Percentile Rank
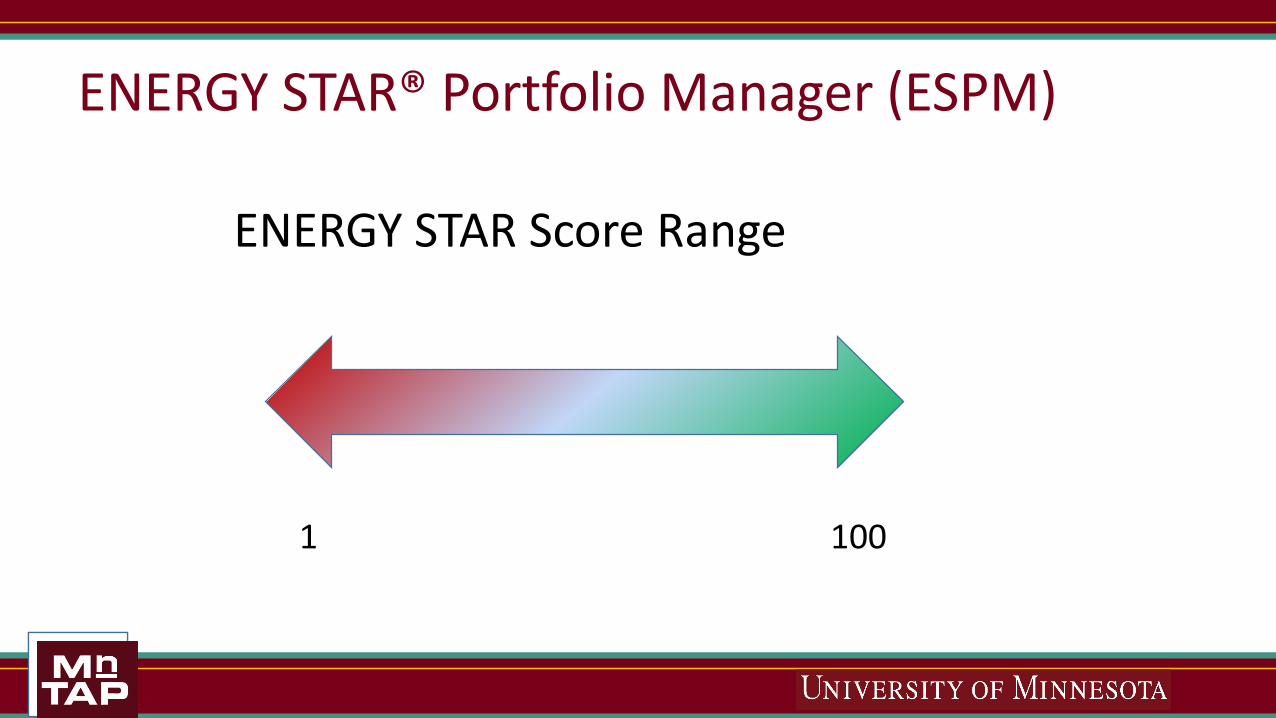
ENERGY STAR® Portfolio Manager (ESPM)
1001
ENERGY STAR Score Range
ENERGY STAR® Portfolio Manager (ESPM)
ENERGY STAR scores were developed using data from plants with flows over .6 MGD.
Smaller plants can calculate unofficial scores which are useful, but less accurate.

Energy Savings Strategies
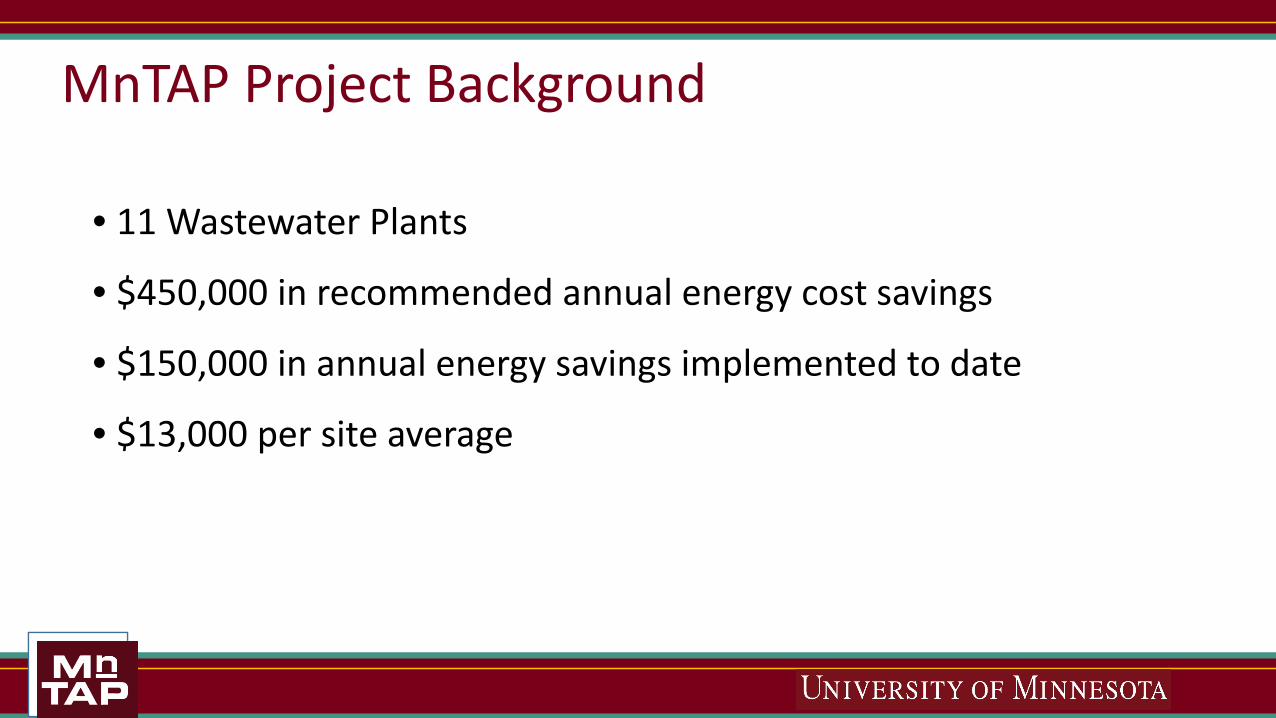
• 11 Wastewater Plants
• $450,000 in recommended annual energy cost savings
• $150,000 in annual energy savings implemented to date
• $13,000 per site average
MnTAP Project Background
Is your secondary aeration basin running at over 2 ppm DO?
Secondary Aeration DO
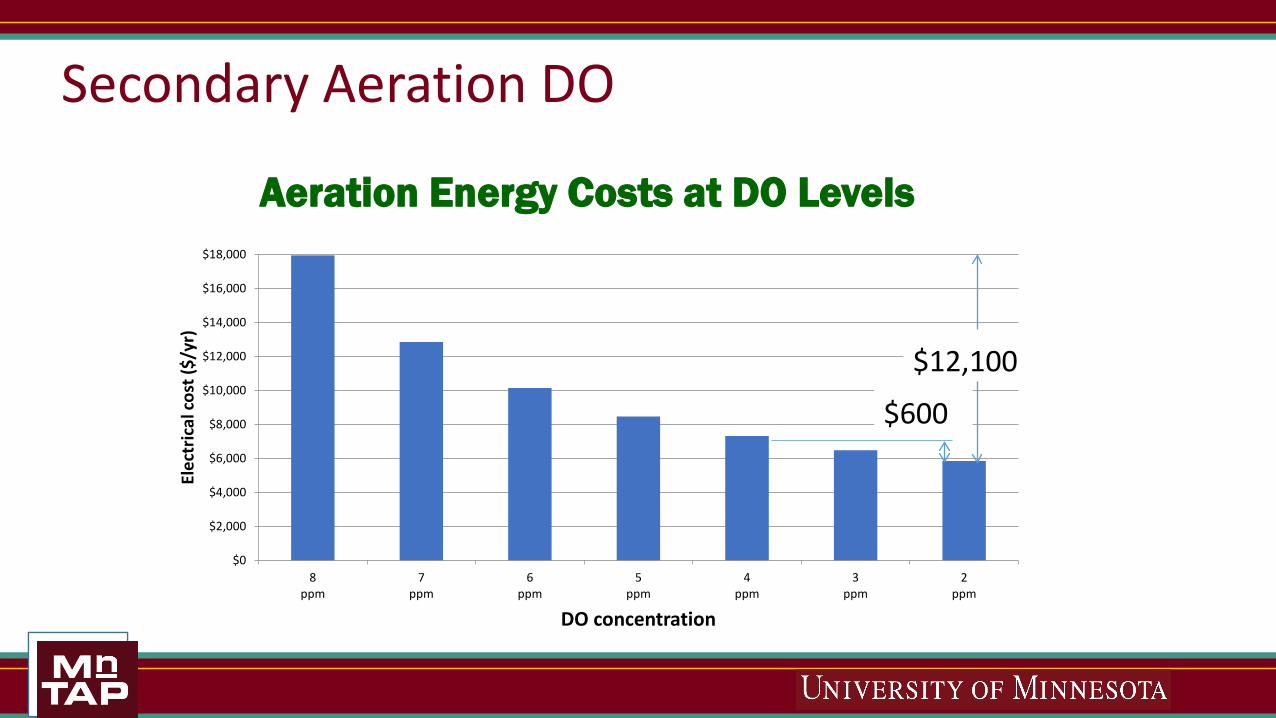
Secondary Aeration DO
$0
$2,000
$4,000
$6,000
$8,000
$10,000
$12,000
$14,000
$16,000
$18,000
8ppm
7ppm
6ppm
5ppm
4ppm
3ppm
2ppm
Elec
tric
al co
st ($
/yr)
DO concentration
Aeration Energy Costs at DO Levels
$12,100
$600
Reduce blower speed by reducing VFD frequency (if possible).
Cycle equipment on and off to reduce average aeration
(using mixers during off time as needed).
Get a smaller blower that can efficiently maintain lower DO.
Secondary Aeration DO
Aerobic Digester Aeration
Is there opportunity to reduce aerobic digester aeration?
Aerobic Digester Aeration
The Ten State Standards recommends
30 scfm / 1000 ft3.
Many sites can run even lower.
Aerobic Digester AerationReduce blower speed by reducing VFD frequency (if possible).
Cycle equipment on and off to reduce average aeration.
Get a smaller blower that can efficiently meet air requirements.
Aerobic Digester Detention Time
Is there opportunity to reduce
aerobic digester detention time?
Aerobic Digester Detention Time
Ten State Standards mentions a
27 day detention time basis.
Some sites can run lower than this.
Aerobic Digester Detention Time
Ensure waste is stabilized with SOUR testing.
Reducing detention time will also reduce aeration requirements, allowing you to use less energy.
Anaerobic Digester
Consider Combined Heat and Power (CHP)
This study found simple payback periods ranging from 4-10 years.
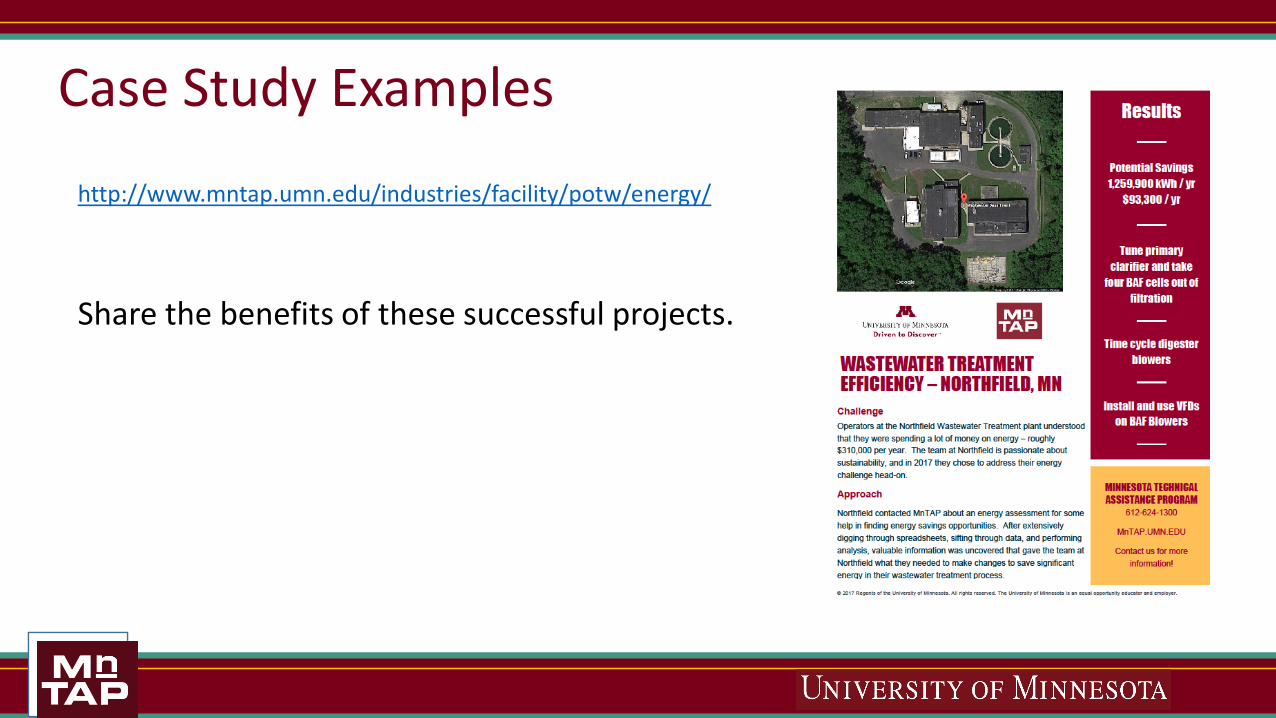
http://www.mntap.umn.edu/industries/facility/potw/energy/
Share the benefits of these successful projects.
Case Study Examples

The magnitude of these opportunities is expected to correlate with benchmark score.

Jon Vanyo C.E.M.Associate EngineerMinnesota Technical Assistance Program612-624-4683, [email protected]
Benchmarking is the first step towardsefficient wastewater infrastructure.