The Value of Architecture · effort. Process Flow ... Tracker System Functions Passive Cuer /...
22
NDIA 11 NDIA 11 th th Annual Systems Engineering Annual Systems Engineering Conference Conference “ “ The Value of Architecture The Value of Architecture ” ” October, 2008 October, 2008 Frank Salvatore High Performance Technologies, inc. 3159 Schrader Road Dover NJ, 07801 (973) 442-6436 ext 249 [email protected]
Transcript of The Value of Architecture · effort. Process Flow ... Tracker System Functions Passive Cuer /...

NDIA 11NDIA 11thth Annual Systems Engineering Annual Systems Engineering ConferenceConference
““The Value of ArchitectureThe Value of Architecture””
October, 2008October, 2008
Frank SalvatoreHigh Performance Technologies, inc.3159 Schrader RoadDover NJ, 07801(973) 442-6436 ext [email protected]

OutlineOutline
ArchitectureOperational ViewGoal HierarchyProcess Flow7.0 Identify and Define Alternatives Tools ArchitectureSummary

ArchitectureArchitecture
During the systems engineering process architectures are generated to better describe and understand the systemArchitectures provide a description of how subsystems join together to form a system.
The Functional Architecture identifies and structures the allocated functional and performance requirements. The Physical Architecture depicts the system product by showing how it is broken down into subsystems and components. The System Architecture identifies all the products (including enabling products) that are necessaryOperational Views provide a frame of reference that the project work can be related to.

Operational ViewOperational View
Identify, define, and evaluate potential Universal (Objective) Active Protection System (APS) approaches for the Future Combat System (FCS).
Provide decision makers the tools/data to help identify RDECOM’s Science and Technology investments needed to get to an objective APS system.
An Operational View was key. It gave everyone a common frame ofreference to work from when executing their part of the analysis.

Goal HierarchyGoal Hierarchy
This was the Goal Hierarchy. Essentially an Arhcitecture. Without it we were not focused on what was important to consider in the trade study
effort.

Process FlowProcess Flow
Trade Study Process Flow Diagram was the Process Architecture used. It kept the team aligned and was a central communication tool
1.0 Identify Requirements
2.0 Identify Goals
3.0 Define Criteria
4.0 Collect Component
Data based on Criteria
5.0 Define Utility & Weight Factors
7.0 Identify & Define
Alternatives
6.0 Define Uncertainty
Factors 8.0 Evaluate/Score
Alternatives
9.0 Performance Values/Utilities
10.0 Analyze & Publish Trade
Results

7.0 Identify & Define Alternatives7.0 Identify & Define Alternatives
Evaluate Candidates
7.2
Candidate Systems
7.1
DefineAlternatives
7.3
• List Systems/Components• Previous Trades• Component Data• Requirements
• Existing Systems • Analysis Method,Tools• System Assumptions
• System Alternatives• System ID
• Integrate System Candidates• Organize Component Data• ID Functional Architectures
•Analyze System Candidate Potential• Timeline• Accuracy• Component Compatibility
System and Technology Architectures Required!!!!!
4 8
Reach Consensus
• ID System Alternatives• System Configuration• Architecture Definition• Theory of Operation• Physical Description

7.1 Candidate Systems 7.1 Candidate Systems (Physical Architecture)(Physical Architecture)
Evaluate Candidates10080 Systems
13Cueing
Technologies
13Tracker
Technologies
6Launcher
Technologies
14Interceptor
Technologies
The Physical Architecture was core to understanding the basic construct of an Active Protection System. All 10,080 Systems Evaluate had the same Physical Architectures

7.2 Evaluate Candidates7.2 Evaluate Candidates(Functional Analysis and Allocation)(Functional Analysis and Allocation)
Major component of the trade study was the Functional Analysis and Allocation (FAA).
It allowed for a better understanding of what the technologies could and had to be able to do to satisfy the performance requirements of the system, in what ways they could do it, and to some extent, the priorities and conflicts associated with lower-level functions.It provided information essential to optimizing physical solutions. Key tools were Functional Flow Block Diagrams, and the Time Line Analysis

7.2 Evaluate Candidates 7.2 Evaluate Candidates (System Functions)(System Functions)
Measure and report what the persistent object is either by class or specific type/item.
Classify
Final designation of launch tube in fixed system and launch an interceptor loaded with any required flight path, terminal guidance, and fuzing information
Final Tube Selection & Fire Control
Initial slew of launcher to launch position using fire control solution based on coarse track
Initial Slew
Slew launcher to final position and launch an interceptor loaded with any required flight path, terminal guidance, and fuzing information
Fine Slew & Fire Control
Measure and report a target to enable calculation of a fire control solutionFine Track
Initial designation of launch tube or tubes in fixed system that need to be “warmed up” using fire control solution based on coarse track
Initial Tube Selection
Measure and report an object and determine that it’s trajectory point of closest approach to our platform is threatening. Classify and coarse track may be based on the same measured data set and completed at the same time
Coarse Track
Measure and report an persistent object that should be trackedDeclare
Measure and report an event not due to ambient noiseDetect, Acquire
DefinitionFunction
Established a common vocabulary for understanding and describing how each for the systems studies operated.

7.2 Evaluate Candidates 7.2 Evaluate Candidates System Functions (cont.)System Functions (cont.)
Target negationWarhead Effect
Orient (focus) the warhead to produce the desired effect & initiate the effect at the prescribed time and / or the prescribed distance from target
Terminal Guidance & Fuze
Measure and report a target trajectory to provide terminal guidance & fuzing updates to an interceptor
Terminal Track
Propulsion to change flight path of interceptorIn-Flight Guidance
“No operation” - used to designate function not performedNo-Op
Measure and report a target trajectory to provide in-flight guidance to an interceptor
In-Flight Track
DefinitionFunction
Established a common vocabulary for understanding and describing how each for the systems studies operated.

7.2 Evaluate Candidates 7.2 Evaluate Candidates Functional Flow Block Diagram (Unguided Interceptor)Functional Flow Block Diagram (Unguided Interceptor)
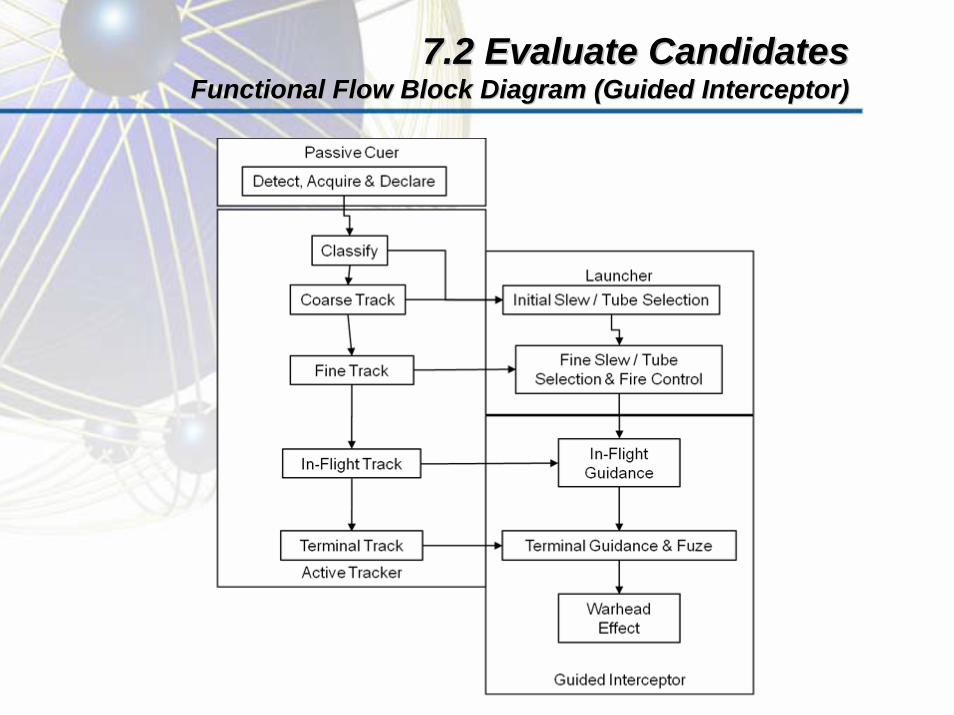
7.2 Evaluate Candidates 7.2 Evaluate Candidates Functional Flow Block Diagram (Guided Interceptor)Functional Flow Block Diagram (Guided Interceptor)

7.2 Evaluate Candidates 7.2 Evaluate Candidates ((Functional to Physical Allocation)Functional to Physical Allocation)
Functional allocation to physical components provided context for data provided on specific components and was critical in both the Timeline and Accuracy Analysis.
U1 U2 U3 U4 G1 G2 G3 G4
Detect, Acquire & Declare Passive Cuer Passive Cuer Passive Cuer Passive Cuer
Classify
Coarse Track
Initial Slew / Tube Selection
Launcher Launcher Launcher Launcher Launcher Launcher Launcher Launcher
Fine Track Active TrackerActive Fine
TrackerActive Fine
TrackerActive Cuer /
TrackerActive Tracker
Active Fine Tracker
Active Fine Tracker
Active Cuer / Tracker
Final Slew / Tube Selection & Fire Control
Launcher Launcher Launcher Launcher Launcher Launcher Launcher Launcher
In-Flight Track Active TrackerActive Fine
TrackerActive Fine
TrackerActive Cuer /
Tracker
In-Flight GuidanceGuided
InterceptorGuided
InterceptorGuided
InterceptorGuided
Interceptor
Terminal Track Active TrackerActive Fine
TrackerActive Fine
TrackerActive Cuer /
Tracker
Terminal Guidance & Fuze
Warhead Effect
Active TrackerPassive or
Active Coarse Tracker
Active Cuer / Tracker
Passive Cuer / Coarse Tracker
System Functions
Passive Cuer / Coarse Tracker
Active Cuer / Tracker
Passive or Active Coarse
TrackerActive Tracker
Unguided Interceptor
Unguided Interceptor
Unguided Interceptor
Unguided Interceptor
Architectures for Unguided Interceptors Architectures for Guided Interceptors
Guided Interceptor
Guided Interceptor
Guided Interceptor
Guided Interceptor
None None None None

7.2 Evaluate Candidates 7.2 Evaluate Candidates Timeline AnalysisTimeline Analysis
Thre
atIn
terc
epto
r
The results of the Functional Analysis and Allocation effort provided the basis for how time was to be calculated for each of the 10K plus systems to be evaluated.

7.2 Evaluate Candidates 7.2 Evaluate Candidates Interface Compatibility AnalysisInterface Compatibility Analysis
Physical to Functional Allocations helped in determining what the interfaces would be and gave us a way to make subjective evaluations of their maturity

7.3 Define Alternatives7.3 Define Alternatives
Physical to Functional Allocation allowed us to define the system configuration, system architecture, and principle of operation of each system analyzed.

Tools ArchitectureTools Architecture
Abstract ArchitectureSchematic Block Diagrams
Physical ArchitectureInterfacesData FlowEasy to ReadHard to Maintain
Formal ArchitectureIDEF0, FFBD, EFFBD, Hierarchy
Physical ArchitectureFunctional ArchitectureInterfacesData FlowEasy to MaintainHard to Read

Schematic Block DiagramSchematic Block Diagram
Analysis Tools [Tool Users]
OTA
PS Simulation
Performance
Timeline
Integration
Accuracy
Goals (Performance, Cost, Risk)
Scorecard
Fratricide
Eval
uatio
n C
riter
ia
Threat Data Component Data
Report
[Threat Community] [S&T Community]
[SI C
omm
unity
]
Home
Timeline
Accuracy
Integration
OTAPS Simulation
Scorecard
Goal
Fratricide
Threat Data
Component Data
Evaluation Criteria
Report

Perform APS Analysis Perform APS Analysis Functional Flow Block Diagram (FFBD)Functional Flow Block Diagram (FFBD)
E.1
Provide ThreatData
E.2
ProvideComponent Data
E.3
ProvideEvaluation Criteria
AND AND
1
Contain ThreatData
2
ContainComponent Data
3
ContainEvaluation Criteria
AND AND
OR
4
ContainsComposedSystems
AND
5
Calculate SystemTimeline
Performance
6
Calculate SystemAccuracy
Performance
7
DetermineCompatibility
8
PopulateScorecard
AND
10
Simulate OTAPS
OR
9
Analyze Fratricide AND
11
Calculate GoalAchievement
E.5
Report Results
The FFBD (Function Flow Block Diagram) of the APS Tool shows the sequencing and control flow of the functions of
the integrated set of trade study tools

Hierarchy DiagramHierarchy Diagram
0
APS Analysis Tool
Component
1
Threat Workbook
Component
2
ComponentWorkbook
Component
3
TimelineWorkbook
Component
3.1
Timeline RawData File
Component
4
AccuracyWorkbooks
Component
4.1
Slewed UnguidedSystems Workb...
Component
4.2
Slewed GuidedSystems Workb...
Component
4.3
Fixed GuidedSystems Workb...
Component
4.4
Fixed UnguidedSystems Workb...
Component
4.5
Vertical GuidedSystems Workb...
Component
5
CompatibilityWorkbook
Component
6
ScorecardWorkbook
Component
7
FratricideWorkbook
Component
8
OTAPS Simulation
Component
9
Goal Workbook
Component
The Hierarchy Diagram was a quick way to quickly capture all the Trade Study Tools and their Hierarchical relationships. These ultimately became the configuration items
that were kept under version control.

SummarySummary
Use of Business Process Models helped everyone to understand the trade study approach that was being used.Using Hierarchy Diagrams helped the trade study team stay focused on the goals and criteria being evaluated.Physical Architecture, Functional Architectures provided the trade study team and the rest of industry a common language to work from. It also was core to defining systems, organizing dataFunctional Flow Block Diagrams and Functional To Physical Allocation was instrumental to establishing rules used to automating the evaluation of 10K plus system alternatives. More importantly it allowed the entire APS community to agree it was being done correctly in all 10k plus cases.Capturing System Architectures was essential to understand how to model system time function and communicate it to the community.Structured Physical and Functional decomposition made establishing a System ID scheme simple.Tool Architecture helped to communicate how each tool was used in the trade study process
many tool interface gaps were identified and fixed.