The Value Management for shareholders and managers ... · JAMAR Vol. 1 · Number 1 · 2002 51 The...
21
JAMAR Vol. 1 · Number 1 · 2002 51 The Value Management Process: A Proposal for Linkage Between Shareholders and Managers Fábio Frezatti University of São Paulo (Brazil) Abstract Market Value Added (MVA ) 1 is an important metric for business in the global environment. Although it is probably the most complex metric available in attempting to provide a linkage between an entity and its performance in value management, there is nevertheless room to improve the usefulness of MVA , and to gain its attendant benefits. The business world is very careful in assessing the cost/benefit trade-off of any management tool. This paper sets out to demonstrate that, in addition to current and long-term financial indicators adopted by an organization, MVA also can be added as an important tool. MVA , however, is still not well understood. Consequently, it is neither well tested nor widely adopted. To improve such understanding, this paper identifies different profiles of a company’s MVA at different times. By combining MVA and market value at any given time, four different profiles (or “corners” in a model) are proposed. These are conceptually defined and analyzed. To provide a reasonable perception of the figures, a combination of trend and sign is considered in the four selected “corners”. The classif ication of an organization’s results under any of these four alternatives contributes to a better understanding of the metric and provides useful information ) The author wants to register his gratitude for the support provided by CNPq and FIPECAFI for the project that originated this paper. for shareholders and managers. Because this information is so important for companies—both as an indicator of management performance and as external information for stakeholders and managers—this paper advocates that it must be added to the traditional kit of financial statements (such as balance sheets, profit-and-loss statements, and cash- flow analyses). Key words Management Performance, Market Value, MVA ® Introduction Finance classics have emphasized the importance of value management in companies. Van Horne (1995:2) defined value as that which “ … is represented by the market price of the company’s common stock, which, in turn, is a function of the firm’s investment, financing and dividend decisions”. All things considered, entity value is the main objective of management—not only in the short and medium terms, but also in the long term— and it is important that such entity value is in accordance with shareholder expectations. In pursuing this objective, a question arises as to the nature of business decisions required by a company to improve value. In general, the answer is that appropriate decisions are those that the market takes note of, and from which the market concludes that additional cash flow will result (as systematically indicated by the income computed). Anticipation of the expected future value of a company is a valuable part of the de cision-making process. This is true in both of the following situations:
Transcript of The Value Management for shareholders and managers ... · JAMAR Vol. 1 · Number 1 · 2002 51 The...

JAMAR Vol. 1 · Number 1 · 2002
51
The Value Management Process: A Proposal for Linkage Between Shareholders and Managers
Fábio Frezatti University of São Paulo (Brazil)
Abstract Market Value Added (MVA )1 is an important metric for business in the global environment. Although it is probably the most complex metric available in attempting to provide a linkage between an entity and its performance in value management, there is nevertheless room to improve the usefulness of MVA, and to gain its attendant benefits. The business world is very careful in assessing the cost/benefit trade-off of any management tool. This paper sets out to demonstrate that, in addition to current and long -term financial indicators adopted by an organization, MVA also can be added as an important tool. MVA, however, is still not well understood. Consequently, it is neither well tested nor widely adopted. To improve such understanding, this paper identifies different profiles of a company’s MVA at different times. By combining MVA and market value at any given time, four different profiles (or “corners” in a model) are proposed. These are conceptually defined and analyzed. To provide a reasonable perception of the figures, a combination of trend and sign is considered in the four selected “corners”. The classif ication of an organization’s results under any of these four alternatives contributes to a better understanding of the metric and provides useful information ) The author wants to register his gratitude for the support provided by CNPq and FIPECAFI for the project that originated this paper.
for shareholders and managers. Because this information is so important for companies—both as an indicator of management performance and as external information for stakeholders and managers —this paper advocates that it must be added to the traditional kit of financial statements (such as balance sheets, profit-and-loss statements, and cash -flow analyses).
Key words Management Performance, Market Value, MVA®
Introduction
Finance classics have emphasized the importance of value management in companies. Van Horne (1995:2) defined value as that which “ … is represented by the market price of the company’s common stock, which, in turn, is a function of the firm’s investment, financing and dividend decisions”. All things considered, entity value is the main objective of management—not only in the short and medium terms, but also in the long term—and it is important that such entity value is in accordance with shareholder expectations. In pursuing this objective, a question arises as to the nature of business decisions required by a company to improve value. In general, the answer is that appropriate decisions are those that the market takes note of, and from which the market concludes that additional cash flow will result (as systematically indicated by the income computed). Anticipation of the expected future value of a company is a valuable part of the decision-making process. This is true in both of the following situations:

JAMAR Vol. 1 · Number 1 · 2002
52
• when the entity is being considered as a potential asset sale vis-à-vis other alternatives; or*
• when the entity is being considered in terms of its utility within an ongoing value-management process (irrespective of any immediate or remote possibility of being sold), with the focus therefore being on the process of value increase.
In the first alternative, the important issue is to identify the situation in which the asset is to be sold, and to ensure that the potential buyer perceives the future value as being higher than the seller’s price. In the second alternative, with no immediate selling perspective, value management will allow the owners to keep control of the entity, not only in terms of operational control but, more importantly, in terms of ownership control . In both cases, although value is partially dependent on past decisions, it is more dependent on future performance. In this way, the concept of value is closely linked to the concept of performance when considering companies negotiated on the stock exchange. As Solomon and Pringle (1981: 33) observed: “ … in the long term, the management’s proper decisions will be recognized and will be reflected in the market price”. In addition, the framework of fundamental analysis estimates the results of the entity into the future. This is as a natural complement to an assessment of past performance, and is based on accounting tools, not only with a view to capturing actual information, but also with a view to projecting into the future. The following steps are required to accomplish this task (Iudícibus, 1997: 20): • provide a clear definition of the
objective function to be maximized;
* MVA® and EVA® are Stern Stewart trademarks
• collect and evaluate the information used in the past for maximizing this function; and
• provide a predictive model that will facilitate a decision on objective function maximization.
In undertaking this approach, those variables which are linked to the market and to technology are critical for the future of a business and, consequently, critical to assessing its value. The decisions made in the past must be considered from the perspective of value identification, thus allowing fundamental analysis, as it attempts to ascertain the future, to assess scenarios and their variables with a view to judging how these will translate into financial results. This is certainly a major aspect of the management accounting mission. The success of this effort depends on a strategic and technical planning vision that should discipline the process, thus producing the actions required to preserve or improve the value of the entity. As Van Horne (1995) observed:
The idea is to acquire assets and invest in new products and services where expected return exceeds their cost, to finance those instruments where there is particular advantage, tax or otherwise, and to undertake a meaningful dividend policy for shareholders.
This is essentially what value creation is. It is one approach followed by a company when it pursues the identification and computation of its intrinsic value in order to reach its objectives. It does not necessarily mean new actions that differ from those assessed in a traditional framework. The difference lies in the hierarchy and focus of the tool. The stock market works on the concept of value, and each analyst feels responsible when anticipating entity value and giving advice for a proper decision at any given moment. By acting in this way, the analyst affects the market, and the market confirms the value. Although this
JAMAR Vol. 1 · Number 1 · 2002
53
discussion treats complex macro questions in an extremely simplified way, the rationale described here can be linked with what have been described as “auto-realized prophecies” (Simon, 1976). Because of such auto-realized prophecies, it is extremely important to understand how the analyst developed his or her rationale, and in which situations this can take place. The value framework must therefore be refined and clarified. One instrument proposed by Stewart (1990) is Market Value Added (MVA). This indicator promises to meet the challenge of linking internal performance with entity value in the market. It is clear that both the market value of the entity and its MVA are important, but reliance cannot be placed on either one alone. The market value might rise with no relation between this event and the performance of the company. The reverse can also occur, with the market value dropping even though management worked hard and did its best. The ideal is to deal with both an internal and external perspective, and this paper takes the perspective that market value and MVA are correlated, although they can behave differently.
The Research Question
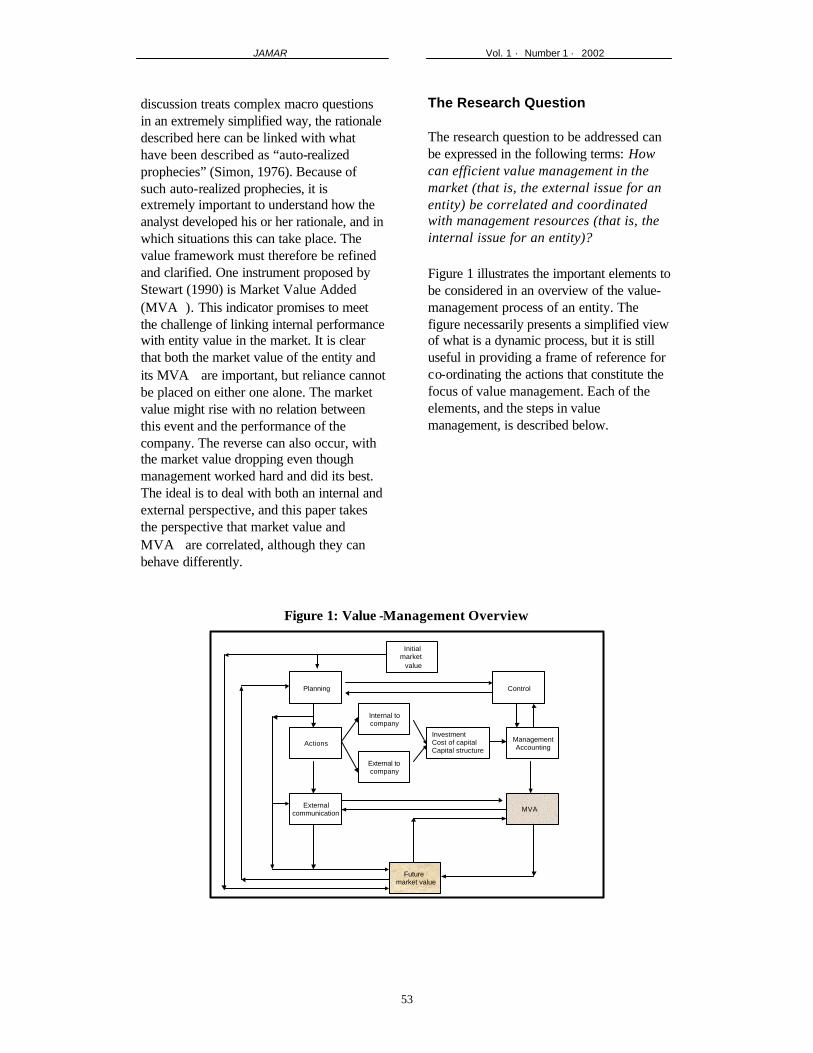
The research question to be addressed can be expressed in the following terms: How can efficient value management in the market (that is, the external issue for an entity) be correlated and coordinated with management resources (that is, the internal issue for an entity)? Figure 1 illustrates the important elements to be considered in an overview of the value-management process of an entity. The figure necessarily presents a simplified view of what is a dynamic process, but it is still useful in providing a frame of reference for co-ordinating the actions that constitute the focus of value management. Each of the elements, and the steps in value management, is described below.
Figure 1: Value -Management Overview
Initialmarket
value
Planning
Actions
Future market value
Internal tocompany
External tocompany
InvestmentCost of capitalCapital structure
Externalcommunication
ManagementAccounting
Control
MVA
JAMAR Vol. 1 · Number 1 · 2002
54
The initial market value is established by considering the entity at its value starting point. This means that long-term goals are defined, and that resources are identified and made available such that they can be dealt with according to a strategic view of the technology, management skills, and physical and human structure of the entity—evaluated in accordance with the monetary language of fundamental analysis theory. Future market value is the status of the entity after the planning process has been developed, taking account of the actions decided upon to effect change in areas internal and external to the entity. Plans must consider the level of investments to be made during a defined period of time. These include investments in fixed assets and investments in working capital, and the corresponding cost of capital related to the required financial resources. The role of management accounting is to capture economic information and provide managers and stakeholders with useful information for decision-making. The control of business requires that pertinent information is available as required. The future expectation of the entity value should be clear in the relationship between shareholders and the management team, and must be flexible within the hierarchical structure through specific feasible goals in accordance with reality and timing. The range of tolerance for deviation depends on the maturity of the investors, but an awareness of the business figures is important to provide consistency and reliability to the actions of management. To guide the actions that will allow the entity to reach its future value goal, the long-term financial metric must be part of the management team’s plans and commitment. This will happen through an appropriate business planning process over the long, medium, and short terms. The actions determined in such a business plan will require resources (investments, money, and so on). Capital structure management is
thus very important for the model, to ensure that resources produce a return higher than the cost of capital. In addition, actions also refer to other kinds of structure—such as organization, team profile, technology management, and so on). In the long term, external communication (with market, clients, technology suppliers, and so on) must provide information in a consistent and coherent way, thus influencing investors in relation to the projected intrinsic price for the entity. This communication is a continuous process, and must be initiated as soon as actions are decided on. The stock price reference depends on the price level decided on by the shareholders and followed by the management team. Both shareholders and managers need an indicator to judge the overall performance of the entity. The improvement of market value is one such important indicator because it is the essence of the shareholder’s concerns. From the management perspective, the level of efficiency of the entity is important, and affects several aspects of its operations, like risk and return and value. The Conceptual Framework
The use of MVA® in value management requires some definitions. Stewart (1990) is the researcher most cited in this field, although other researchers have dealt with the issue, including Copeland, Koller and Murrin (1994), Rappaport (1998), Yook and McCabe (2001), and Sheikholeslami (2001). According to Stewart (1990), MVA® is the excess of the value of resources committed to the enterprise. He considers that it might be one of the many external tools that uses financial accounting and the stock market to provide data. Notwithstanding Stewart’s emphasis on the external applications of MVA® , the approach of the present paper is to view the instrument as essentially being a support for
JAMAR Vol. 1 · Number 1 · 2002
55
the management team (and its management accounting process), rather than limiting its application to agents external to the entity. According to Copeland, Koller and Murrin (1994, p. 15) a change in MVA is “ … the change in the difference between the market and book value of the equity over a given period of time”. This simplified understanding of MVA will be followed in the present field study. Stewart (1990, p. 180), addressing the same issue in more detailed terms, noted that: “Market Value Added, or MVA is the difference between a company’s fair market value, as reflected primarily in its stock price, and the economic book value of capital employed”. Stewart (1990, p. 743) recognized that book value includes equity reserves and that market value is “an approximation of the fair market value of a company’s entire debt and equity capitalisation” . According to Stewart (1990), this market value is computed in the following manner:
1. The actual market value of common
equity (approximated by taking the closing stock price as of (say) December 31 times the number of shares outstanding for the quarter end closest to December 31);
2. Plus the book value (as of the fiscal reporting date closest to December 31) of:
a. preferred stock; b. minority interests; c. long-term non-interest-bearing
liabilities (except the deferred income tax reserve);
d. all interest-bearing liabilities and capitalized leases; and
e. the present value of noncapitalized leases (estimated by discounting the minimum rents projected for the next years by x%);
3. Less the book value of the marketable securities and of construction in progress (because these items also are subtracted from capital, there is no effect on MVA; the intent is to produce more accurate measures of returns earned in active business activities).
According to Stewart (1990): “Book value was used to approximate the market value of all items except common equity due to absence of broad availability of quoted prices”. Stewart’s suggestion for the market value computation thus includes not only the common and preferred stocks, but also other items as included in the capital invested, which annuls their effects. Another way of computing MVA® is “by multiplying the number of shares outstanding by the spread between stock price and economic book value per share” (Stewart, 1990, p. 181). Thus, in a simplified way, MVA® can be computed as follows: MVA
® = market value – economic equity
As a consequence of the earlier description: MVA
® = market value – capital invested
(or employed) Thus, economic equity = capital invested To avoid misunderstanding, the traditional MVA® approach will be referred to as “Stewart’s MVA®” (1990: 174), the computation of which can be described as follows: MVA
® = market value – capital invested
MVA®
= present value of all future EVA®
For the purpose of this paper, Economic Value Added (or EVA®) and residual income will be used interchangeably. Capital invested represents the amounts required to cope with the operations. According to Stewart (1990, pp. 105–7), it includes net working capital plus fixed assets.

JAMAR Vol. 1 · Number 1 · 2002
56
Another term worthy of consideration in this discussion is “intrinsic” MVA®. The word “intrinsic” implies that there exists a basis for economic support in the future. In this way, the intrinsic MVA®, is one that might be foreseen by an agent who could consistently project future economic results as presented in Figure 2. The computation of intrinsic MVA® begins with the capital invested, which comes from the entity’s balance sheet with some adjustments. The second step is to project the future benefits that are to be obtained. Adding the intrinsic MVA® to the capital invested, the intrinsic value of the entity is obtained, and this information can be useful for companies with and without stocks in the market. This approach is not new, and several aspects of it are in line with Rappaport’s view (1998, pp. 119–33). Such an approach is useful in the planning process. Alternatively, it can be computed at the same time Stewart’s MVA® is computed. If both are computed for the entity, it is possible to perceive the situation that should exist and the gap between the two. Stewart (1990) recommended EVA® as the proper way to project the future results of the entity. Intrinsic MVA® is computed by adding the net present value of the future EVA®’s to other out of book elements.
The comparison between intrinsic MVA® and Stewart’s MVA® (as shown in Figure 3) is only possible for companies with stocks negotiated in the market. The possible alternatives are noted below.
Figure 2: Intrinsic and MVA® Components
C a p i t a l I n v e s t e d
I n t r i n s i c M V A ® S t e w a r t ’ s M V A ®
P r e s e n t v a l u e o f fu tu res bene f i t s
In t r ins ic Va lue
O u t o f b o o k se l e m e n t s
+
+
=
M a r k e t V a l u e
-
=
C a p i t a l I n v e s t e d
S t e w a r t ’s M V A ®
M V A ®

JAMAR Vol. 1 · Number 1 · 2002
57
Figure 3: Comparison of Intrinsic MVA® and Stewart’s MVA ®
Alternative 1 shows an intrinsic MVA®
higher than Stewart’s MVA®—which implies a negative perception of the market against economic projections. In other words, the investors have not validated (or understood or perceived) the planned actions, and this is reflected in the market value. Practically speaking, the issue is complex, and it is common for investors’ expectations to differ, producing different intrinsic MVAs®. The entity’s communication process with the external agents must be involved in an ongoing process of improvement to produce a more appropriate and viable perception. Alternative 2 shows an intrinsic MVA® lower than Stewart’s MVA® . Although alternative 2 is desirable and important in the short term, it might produce some consternation because, in the long term, it can have a negative effect on the asset if a lack of economic rationale for the generation of future benefits is perceived. In view of the fact that the model supposes that the intrinsic MVA® is a result of management projection, the business plan should be reconsidered. In this way, the two versions of MVA® (Stewart’s and intrinsic) are required, depending on the perspective adopted. From the planning perspective, the intrinsic MVA® is required, whereas, from the point of view of control, Stewart’s version is necessary.
Some strengths and weaknesses of the use of MVA® can now be identified:
Strengths
1. Considered on its own, the stock price does not provide support for evaluating an entity’s efficiency. The information on capital invested provides additional data, and the shareholder might make decisions on whether investments are being managed efficiently or not from the market perspective. In other words, if the market value of one entity drops by $30 and the capital invested drops by $50, MVA® effectively rises by $20. This means that, although the external perspective projects an unfavorable performance, the final result is, in fact, favorable (with an improvement in MVA®) due to internal management.
2. In using MVA® , the management team
has defined efficiency to be its focus of attention, not only according to internal standards but also according to external standards. An important part of this is the communication process, which allows the management team not only to be efficient but also to be seen as efficient. In this way, the effort to provide and distribute relevant information is critical and must be prioritized.
3. In those cases in which it is not possible
to provide a more favorable value for the entity by improving external
I n t r i n s i c V a l u e
N e g a t i v e P e r c e p t i o n
P o s i t i v eP e r c e p t i o n
A l t e r n a t i v e 1 A l t e r n a t i v e 2
S t e w a r t ’ s M V A
I n t r i n s i c V a l u e
S t e w a r t M V A

JAMAR Vol. 1 · Number 1 · 2002
58
performance, the reduction of investments might convert available resources to useful purposes. Going back to the owners, such resources can be invested in another alternative. The use of intrinsic MVA® as part of the planning process might provide this benefit. By using MVA® , the entities will provide the investors with relative assurance—in that conversion of investments is clearly a real focus of management, and that unused resources will come back to the investors as dividends payment.
Weaknesses:
1. In some respects, the framework is complex and still in a maturation process. In addition, compared with other financial statements and indicators, there is no doubt that MVA® is more complex to understand, obtain, and implement.
2. It is possible, in the short term, that
there is no linkage between MVA® and accounting results (positive and negative MVA® versus income). This might be observed in companies that have unfavorable results (accounting losses) but still possess a positive MVA® . The converse can also apply. In both cases, these phenomena can be explained in terms of the investors’ long-term perception of the market, which allows for the use of MVA® as a value-management efficiency indicator.
In the past two decades, many papers have been written on EVA® with the specific goal of attacking or defending its use—often with a high level of passion. However, specific papers on the use of MVA® are less frequent. This seems to be a result of the fact that MVA® has been treated as something of a complement to EVA® . This is not the view of this paper, which treats EVA® as a part of the whole system, aimed at providing the intrinsic version of MVA® .
The Conceptual Proposal
A positive MVA® is definitely the most desirable result from the shareholders’ point of view. However, when looking at the issue as a going concern, this is not direct and simple. Value can rise as a result of management performance (effort of people) and/or economic trends (macro movements that are more properly attributed to factors other than management). If the reasons for performance cannot be clearly identified, the reaction might not be appropriate. For example, MVA® might be positive as a result of a great effort to reduce the inventory of investments. In this case, it is expected that such action was committed, planned, and followed according to internal procedures. On the other hand, MVA® might be negative due to an expenditure in fixed assets that will produce benefit in the future, but which is only partly recognized by the investor. Different understandings produce different reactions and, in order to provide better information, the complementary nature of the two factors (market value of the entity and its MVA®) cannot be ignored. Both are significant in value management. One perspective, which is the one chosen in this paper, treats the issues as shown in Figure 4. The market value of an entity can be considered from the perspective of a trend (that is, a change from one period to another). This might increase or decrease its value. This makes sense because the shareholder wants a price rise and this must be monitored. From this perspective, management has no control over market value, but management might act in a way that affects investor perception, consequently affecting market value. In this way, a positive change (increase) means a favorable performance in ma rket value, whereas a negative change produces an unfavorable picture (decrease). The limit of this dimension is zero. Rather than considering such a trend, MVA® can be viewed as an instantaneous

JAMAR Vol. 1 · Number 1 · 2002
59
figure. In this view, MVA® does not capture trends over time (like market value) but rather captures specific moments (that is, the sign is the focus). Note that the computed data might contain negative or positive signs. The more positive the result and the more continuously it is kept, the better the performanc e will be. At first sight, the negative result has an unfavorable connotation, which will be better understood only after combining it with the market value.

JAMAR Vol. 1 · Number 1 · 2002
60
Figure 4 Market Value and MVA® "Corners”
Looked at in isolation, both market value and MVA® have limitations, and they can induce managers to a certain bias. As an
example, Table 1 compares the trend in market value (increasing or decreasing) and the MVA® sign ( + or – ):
Table 1: Trend and Sign Comparison
In assessing Table 1, column 0 represents the starting point for the example. Market value was obtained and, by deducting the capital invested, Stewart’s MVA® was computed. In column 1, market value shows an increase in the value of stocks, whereas the capital invested is still the same. This might cause us to conclude (simplistically, before a deeper analysis is necessary) that
there is no performance merit in the change. However, in this case, the MVA® rose, and it is clear that factors external to the entity produced the positive change in MVA® . Continuing the examination of Table 1, column 2 represents a situation similar to that just described. The market value rose when compared with the starting point (column 0). However, the capital invested rose to an even greater extent, thus producing a negative MVA® . From the
Market Va lue
Posi t ive MVA®
C O R N E R 2
Market Value increasea n d
Negative MVA ®
C O R N E R 1
M a r k e t V a l u e i n c r e a s e
a n d
P o s i t i v e M V A ®
C O R N E R 3
M a r k e t V a l u e d e c r e a s e
a n d
N e g a t i v e M V A ®
C O R N E R 4
M a r k e t V a l u e d e c r e a s e
a n d
P o s i t i v e M V A ®
Negative MVA®
0 1 2 3 4Market value Market value Market value Market value
In $ Basic version increase increase decrease decreaseMarket value (a) 100 140 140 60 60Capital invested (b) 70 70 150 70 30
MVA amount (a-b) 30 70 -10 -10 30MVA change 40 -40 -40 0
Impact:Market value Increased Increased Decreased DecreasedMVA Positive Negative Negative PositiveCorner 1 2 3 4

JAMAR Vol. 1 · Number 1 · 2002
61
performance point of view, this means that, at the time it was measured, the investment was perceived as being greater than the likely future benefit. In column 3, the drop in market value produced a negative MVA®. Looking at the figures, it is clear that this is due to external factors, which could mean a “less controllable” part of the business (because the capital invested remained the same). A consideration of column 4 shows a drop in market value combined with a drop in capital invested, producing the same MVA®
as the one obtained at the starting point. One explanation for this might be that management offsets the external unfavorable trend with a higher performance standard.
Each of the above columns can be presented as part of a square. The proposed model (Figure 4) is a combination of the two ranges, arranged into four “corners”. A vertical line represents market value and a horizontal line represents the MVA® . As an example of the “real world”, but without all the conditions of the perspective of management accountability, Table 2 provides a sample of eight US companies from different sectors in order to identify them by their appropriate “corner” (Figure 4), considering both the trends in market value (increasing or decreasing) and the MVA® sign (+ or –). All figures represent the market value and MVAs® as of December 31, 2001:
Table 2: Trend and Sign Comparison: USA Companies
US$ millions Market Value December 31 MVA ® 2001 2000 Change
Amount
Chubb 12,651 11,992 659 4,576 Chevron 95,382 56,929 38,453 44,006 Aetna 5,486 5,287 199 –6,105 Safeco 4,280 3,215 1,065 –453 Solectron 7,068 13,551 –6,483 –3,415 Delta Airlines 4,354 5,015 –661 –7,954 Walt Disney 47,925 58,369 –10,444 15,484 Boeing 38,007 46,809 8,802 14,917
Source: Fortune, April 16, 2001 and Fortune, April 15, 2002
In addition, some ratios were proposed to provide support to the analytical process. These were built up in accordance with both perspectives—the trend outside the entity (market) and the internal point of view (intrinsic figures). These ratios thus cover an area from the relatively less controllable to the relatively more controllable for any agent. The ratios can be explained as follows:
• The ratio of MVA®
/market value (expressed as a percentage) demonstrates the relationship between the MVA® and the market value perspective. The higher the percentage, the higher will be the optimism of the investor in relation to the entity.
• The ratio of present value of future
benefits/market value (expressed as a percentage) is an indication of how the investor’s view might be supported by

JAMAR Vol. 1 · Number 1 · 2002
62
the economic rationale. Under normal conditions, the first ratio noted above (MVA®/market value) is in line with this one. The higher the ratio of present value of future benefits/market value, the more consistent and less risky will be the expectation of the market in relation to the entity.
• The ratio of present value of future
benefits/MVA® (expressed as a
percentage) indicates the relationship between intrinsic and market figures. A percentage lower than 100% indicates a “super-evaluation” situation, in which the investor has attributed more value to the entity than the economic projection would suggest. In contrast, if the percentage is higher than 100%, the investor accepts less than the economic projection. The challenge is to keep the magnitude of the effect within a certain range.
• The ratio of present value of future
benefits/capital invested (expressed as a percentage) indicates the level of future return provided by the investment made in working capital and in fixed assets. The higher the ratio, the better will be the performance obtained.
To achieve a better understanding of the purpose, each “corner” (Figure 4) will be treated as one numerical example. There is no intention of producing a complete example in such a wide variety of situations. On the contrary, the general idea is to identify some possible situations that could occur and explain how the figures should reflect on the conceptual model.
“Corner” 1: Market Value Increase and Positive MVA®
This “corner” (of Figure 4) shows an increase in the market value with a positive MVA® , thus improving the wealth of shareholders. This is the “perfect corner”—the dream of shareholders. It represents the best balance among investment, risk, and return. The final effect on MVA® might be caused simply by a higher market value (in an extreme situation offsetting an increase in capital invested) or it might be a combination of higher market value and lower capital invested. Having this information to hand, investors might develop a performance appraisal, identify responsibility, and take proper decisions— thus looking at the effects from a wider perspective than merely within the borders of the entity. An example of this is shown in Table 3.

JAMAR Vol. 1 · Number 1 · 2002
63
Table 3: Capital Invested Computation for “Corner” 1 (of Figure 4)
In Table 3, the capital invested was computed from both the operational and
financial points of view, reaching the same amount ($70 for both periods).
Balance sheet in 31/12 Capital Invested Operational Financial
In $ 1000 Períod 0 Períod 1 Períod 0 Períod 1 Períod 0 Períod 1Assets
Cash 0 0 0 0Investment in the financial market 2 2 2 2Receivables 11 11 11 11- Bad debt provision -2 -2 -2 -2Net inventories 15 15 15 15Other assets 1 1 1 1Total short term assets 27 27 27 27
Other long-term assets 1 1 1 1
Net fixed assets 70 70 70 70
Total Assets 98 98 98 98
Liabilities & Stockholder's EquitySuppliers 11 11 11 11Short-term borrows 0 0 0 0Other accounting payables 0 0 0 0Accruals 8 8 8 8Taxes 7 7 7 7Other liabilities 2 2 2 2Total short-term liabilities 28 28 28 28 0 0
Other long-term liabilities - non financial 0 0 0 0Other long-term liabilities - financial 20 20 20 20
Stockholder's equity 50 50 50 50
Total Liabilities and Equity 98 98
Total Capital Invested 70 70 70 70

JAMAR Vol. 1 · Number 1 · 2002
64
Table 4 MVA® Computation—“Corner” 1 (of Figure 4)
In $ 1000 Períod 0 Períod 1 Variation Management areas
+ Market value 100 140 40 (-) Capital invested 70 70 0=MVA®
30 70 40
Capital Invested details:+Cash and financial investments 2 2 0 Liquidity management (treasury)+Receivables 11 11 0 Operational working capital +Inventories 15 15 0 Operational working capital +Fixed assets 70 70 0 Operational Investment-Suppliers 11 11 0 Operational Investment+Other assets net -17 -17 0 OthersTotal 70 70 0
+ MVA® 30 70 40 - Intrinsic MVA® 80 90 10= Perception variation -50 -20 30
Present value of future benefits 80 90 10Residual Income for the period (present value) 5 5 0
Ratios:% of MVA
® / Market value 30.0% 50.0% 20.0%
% of Present value of future benefits/Market value 80.0% 64.3% -15.7%% of Present value of future benefits/MVA
® 266.7% 128.6% -138.1%
% of Present value of future benefits/Capital Invested 114.3% 128.6% 14.3% As a consequence of Table 4, certain observations can be made regarding the ratios described above. • With respect to the ratio of
MVA®
/market value (expressed as a percentage), it is possible to identify different ranges of relationships in different business sectors. Under normal conditions, e-business, for example, is expected to have a higher percentage for this ratio than, say, the shipping industry. Reasons for different ranges are related not only to the assets involved, but also to the market perspective of the activity. Despite these inter-sectoral variations, it is important to follow the trend of the percentage and, in the example, it is significantly positive and rising.
• With respect to the ratio of present
value of future benefits/market value (expressed as a percentage), this ratio indicates that the investors consider a reasonable percentage of economic support to the market perception as
being important in the long term. In the example, a decrease in the percentage is produced due to a rise in the market value (and is not due to a drop in expected future results).
• With respect to the ratio of present
value of future benefits/MVA® (expressed as a percentage), the relationship between intrinsic MVA® and Stewart’s MVA® strongly expresses an undervaluation of the benefits of the entity. Possible actions include an improvement in communication to convince investors that an improvement in stock price is reasonable. On the other hand, internal pressure to improve the level of capital invested might be considered. Although higher than 100%, the ratio is more balanced than in the previous year, which means that communication with investors was a partial success.
• With respect to the ratio of present
value of future benefits/capital investment (expressed as a

JAMAR Vol. 1 · Number 1 · 2002
65
percentage), from the perspective of management performance, this ratio is positive, significant, and higher than in the previous period.
It is clear that a significant part of capital invested refers to fixed assets, which indicates that future benefits are part of the expectation of investors. In general, all ratios indicated good performance for the entity. Considering the group of USA companies analysed in Table 2, it is possible to classify two of them in “corner” 1 (of Figure 4). See Table 5.
The relationship between MVA® and market value is: 36.2% (Chubb) and 46.1% (Chevron)—which is reasonably significant in a long-term perspective.
Table 5: USA Companies Examples for “Corner” 1 (of Figure 4)
US$ million
s
Market Value December 31 MVA®
2001 2000 Change Amount
Chubb 12,651 11,992 659 4,576
Chevron 95,382 56,929 38,453 44,006
“Corner” 2: Market Value Increase and Negative MVA®
The only situation that could produce a negative MVA® profile in the presence of an increased market value is if the capital invested is higher than the entity’s market value. To understand this, it is necessary to evaluate the requirement for incentives and corrections. Looking at the details of capital invested, it is clear that the main reasons for the investment rise ($74 in $80 of change)
are contained within an analysis of operational working capital. This was made up as follows: • receivables: + $9; • inventories: + $35; and • fixed assets: + $30 The entity is expected to invest in order to produce a higher future cash flow. The market reaction might be delayed and differ in magnitude from that suggested in the accounting books. If the analyst wants to come to a conclusion about the profile, the information must be analyzed in some depth. The rise in investment can have several causes. It might be due to: • an increase in sales with a direct effect
on receivables and an overall positive result for the entity;
• an increase in receivables due to uncollected amounts, thus producing an unfavorable effect on the bottom line;
• an increase in receivables for business reasons—perhaps because it is the right moment for commercial investment to maintain client loyalty;
• an increase in inventories due to future plans for sales increase;
• an increase in inventories due to a lower performance logistically; and
• an increase in fixed assets due to new investment in capacity.
It is evident from these examples, that the figures alone are insufficient to provide answers. It is therefore suggested that the elements that produce the MVA® changes be examined in detail, and that reasons for a change in MVA® be sought. In a fluid business market, “corner” 2 is ideal for an agent who seeks to identify a hostile takeover.

JAMAR Vol. 1 · Number 1 · 2002
66
Table 6: MVA® Computation—“Corner” 2 (of Figure 4)
An important question emerges. If the entity’s performance was exactly equal to “corner” 1 in terms of the present value of future benefits, why did the value have a different behavior to that of "corner" 1? The results were different due to the fact that the external investors interpreted the communication about the capability to deal with goals and challenges in a different manner. In this way, as distinct from other ratios and indicators, the relationship between market value and internal performance shows the real world of the management team and the owners. The classification in “corner” 2 might be transitory due to the interval between the planning time and its execution, which has to be communicated to the market, and perceived by the market, if it is understood as adequate. As a consequence, the ratios have become distorted: As a consequence of Table 6, certain observations can be made regarding the ratios described above.
• With respect to the ratio of MVA
®/market value (expressed as a
percentage), because the MVA® is negative, the percentage indicates value destruction from the perspective of the investors.
• With respect to the ratio of present
value of future benefit/market value (expressed as a percentage), this indicates that the entity is in good health because there is support for the market value. The percentage increase reflects that there is room for better communication with the market;
• With respect to the ratio of present
value of future benefit/MVA®
(expressed as a percentage), because the MVA® is negative, the ratio indicates that, although intrinsic value is positive, investors are not recognizing it.
• With respect to the ratio of present
value of future benefit/capital
In $ 1000 Períod 0 Períod 1 Variation Management areas
+ Market value 100 140 40 (-) Capital invested 70 150 80=MVA® 30 -10 -40
Capital Invested details:+Cash and financial investments 2 7 5 Liquidity management (treasury)+Receivables 11 20 9 Operational working capital +Inventories 15 50 35 Operational working capital +Fixed assets 70 100 30 Operational Investment-Suppliers 11 11 0 Operational Investment+Other assets net -17 -16 1 OthersTotal 70 150 80
+ MVA® 30 -10 -40 - Intrinsic MVA® 80 90 90= Perception variation -50 -100 -130
Present value of future benefits 80 90 10Residual Income for the period (present value) 5 5 0
Ratios:% of MVA® / Market value 30.0% -7.1% -37.1%% of Present value of future benefits/Market value 80.0% 64.3% -15.7%% of Present value of future benefits/MVA® 266.7% -900.0% -1166.7%% of Present value of future benefits/Capital Invested 114.3% 60.0% -54.3%
JAMAR Vol. 1 · Number 1 · 2002
67
invested (expressed as a percentage), the decrease in the ratio reflects the increase in the investments, not matured in the short term.
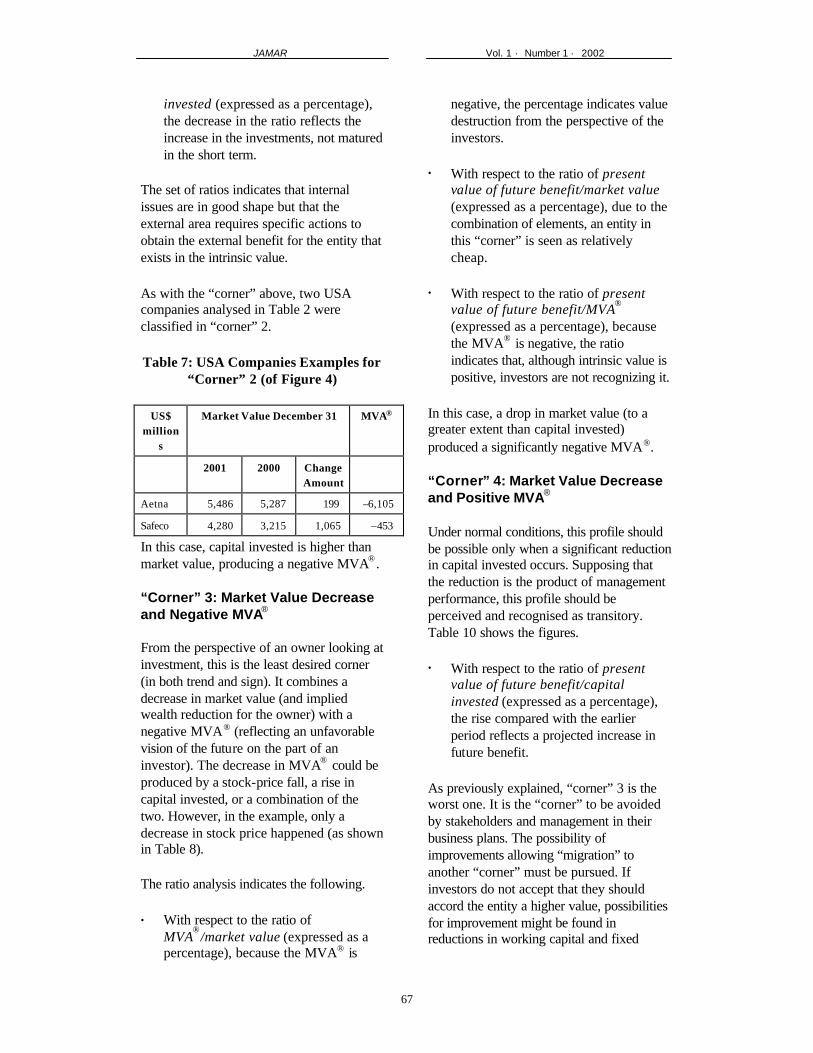
The set of ratios indicates that internal issues are in good shape but that the external area requires specific actions to obtain the external benefit for the entity that exists in the intrinsic value. As with the “corner” above, two USA companies analysed in Table 2 were classified in “corner” 2. Table 7: USA Companies Examples for
“Corner” 2 (of Figure 4)
US$ million
s
Market Value December 31 MVA®
2001 2000 Change Amount
Aetna 5,486 5,287 199 –6,105
Safeco 4,280 3,215 1,065 –453
In this case, capital invested is higher than market value, producing a negative MVA® . “Corner” 3: Market Value Decrease and Negative MVA®
From the perspective of an owner looking at investment, this is the least desired corner (in both trend and sign). It combines a decrease in market value (and implied wealth reduction for the owner) with a negative MVA® (reflecting an unfavorable vision of the future on the part of an investor). The decrease in MVA® could be produced by a stock-price fall, a rise in capital invested, or a combination of the two. However, in the example, only a decrease in stock price happened (as shown in Table 8). The ratio analysis indicates the following. • With respect to the ratio of
MVA®
/market value (expressed as a percentage), because the MVA® is
negative, the percentage indicates value destruction from the perspective of the investors.
• With respect to the ratio of present
value of future benefit/market value (expressed as a percentage), due to the combination of elements, an entity in this “corner” is seen as relatively cheap.
• With respect to the ratio of present
value of future benefit/MVA®
(expressed as a percentage), because the MVA® is negative, the ratio indicates that, although intrinsic value is positive, investors are not recognizing it.
In this case, a drop in market value (to a greater extent than capital invested) produced a significantly negative MVA®.
“Corner” 4: Market Value Decrease and Positive MVA®
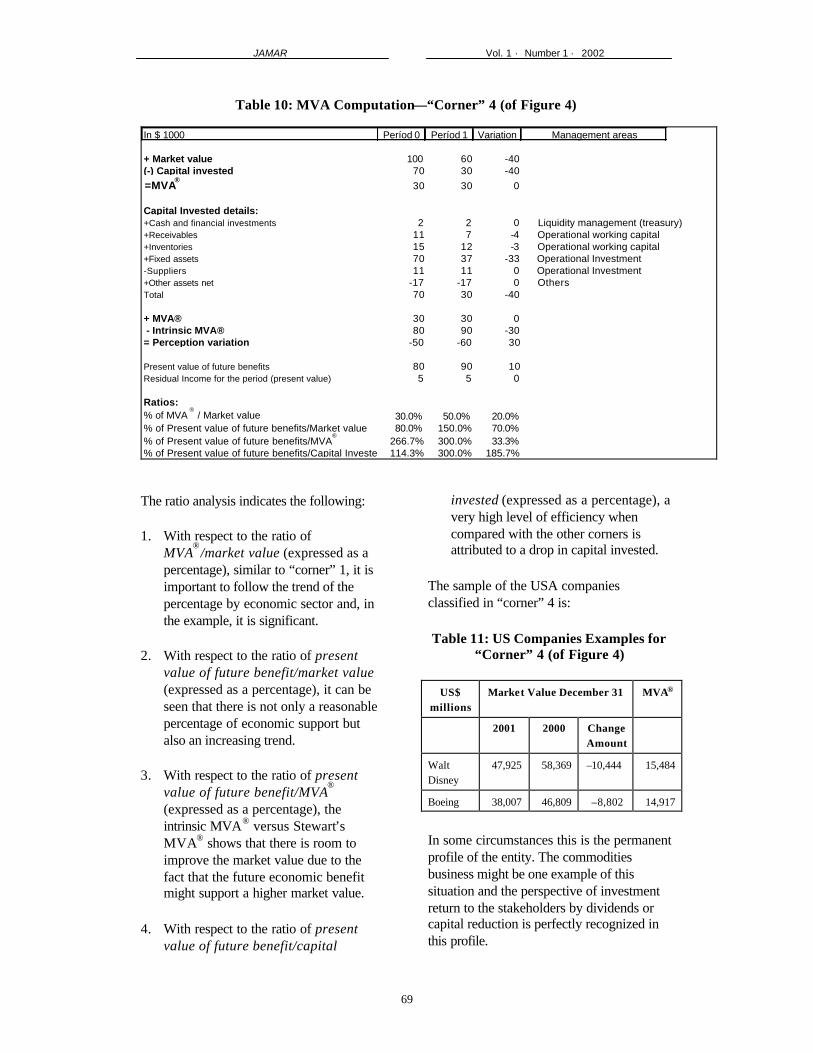
Under normal conditions, this profile should be possible only when a significant reduction in capital invested occurs. Supposing that the reduction is the product of management performance, this profile should be perceived and recognised as transitory. Table 10 shows the figures. • With respect to the ratio of present
value of future benefit/capital invested (expressed as a percentage), the rise compared with the earlier period reflects a projected increase in future benefit.
As previously explained, “corner” 3 is the worst one. It is the “corner” to be avoided by stakeholders and management in their business plans. The possibility of improvements allowing “migration” to another “corner” must be pursued. If investors do not accept that they should accord the entity a higher value, possibilities for improvement might be found in reductions in working capital and fixed

JAMAR Vol. 1 · Number 1 · 2002
68
assets (in situations in which these actions are not offset by a higher reduction in the future benefits).
In the group of USA companies analysed in Table 2, two were found to be in “corner” 3.
Table 8: MVA Computation—“Corner” 3 (of Figure 4)
Table 9: USA Companies Examples for “Corner” 3 (of Figure 4)
In $ 1000 Períod 0 Períod 1 Variation Management areas
+ Market value 100 60 -40 (-) Capital invested 70 70 0=MVA® 30 -10 -40
Capital Invested details:+Cash and financial investments 2 2 0 Liquidity management (treasury)+Receivables 11 11 0 Operational working capital +Inventories 15 15 0 Operational working capital +Fixed assets 70 70 0 Operational Investment-Suppliers 11 11 0 Operational Investment+Other assets net -17 -17 0 OthersTotal 70 70 0
+ MVA® 30 -10 -40 - Intrinsic MVA® 80 90 10= Perception variation -50 -100 -50
Present value of future benefits 80 90 10Residual Income for the period (present value) 5 5 0
Ratios:% of MVA ® / Market value 30.0% -16.7% -46.7%% of Present value of future benefits/Market value 80.0% 150.0% 70.0%% of Present value of future benefits/MVA
® 266.7% -900.0% -1166.7%
% of Present value of future benefits/Capital Invested 114.3% 128.6% 14.3%
US$ millions
Market Value December 31
MVA®
2001 2000 Change amount
Solectron 7,068 13,551 –6,483 –3,415
Delta Airlines
4,354 5,015 –661 –7,954
JAMAR Vol. 1 · Number 1 · 2002
69
Table 10: MVA Computation—“Corner” 4 (of Figure 4) In $ 1000 Períod 0 Períod 1 Variation Management areas
+ Market value 100 60 -40 (-) Capital invested 70 30 -40=MVA
® 30 30 0
Capital Invested details:+Cash and financial investments 2 2 0 Liquidity management (treasury)+Receivables 11 7 -4 Operational working capital +Inventories 15 12 -3 Operational working capital +Fixed assets 70 37 -33 Operational Investment-Suppliers 11 11 0 Operational Investment+Other assets net -17 -17 0 OthersTotal 70 30 -40
+ MVA® 30 30 0 - Intrinsic MVA® 80 90 -30= Perception variation -50 -60 30
Present value of future benefits 80 90 10Residual Income for the period (present value) 5 5 0
Ratios:% of MVA
® / Market value 30.0% 50.0% 20.0%
% of Present value of future benefits/Market value 80.0% 150.0% 70.0%% of Present value of future benefits/MVA
® 266.7% 300.0% 33.3%
% of Present value of future benefits/Capital Invested 114.3% 300.0% 185.7% The ratio analysis indicates the following: 1. With respect to the ratio of
MVA®
/market value (expressed as a percentage), similar to “corner” 1, it is important to follow the trend of the percentage by economic sector and, in the example, it is significant.
2. With respect to the ratio of present
value of future benefit/market value (expressed as a percentage), it can be seen that there is not only a reasonable percentage of economic support but also an increasing trend.
3. With respect to the ratio of present
value of future benefit/MVA®
(expressed as a percentage), the intrinsic MVA® versus Stewart’s MVA® shows that there is room to improve the market value due to the fact that the future economic benefit might support a higher market value.
4. With respect to the ratio of present
value of future benefit/capital
invested (expressed as a percentage), a very high level of efficiency when compared with the other corners is attributed to a drop in capital invested.
The sample of the USA companies classified in “corner” 4 is: Table 11: US Companies Examples for
“Corner” 4 (of Figure 4)
US$ millions
Market Value December 31 MVA®
2001 2000 Change Amount
Walt Disney
47,925 58,369 –10,444 15,484
Boeing 38,007 46,809 –8,802 14,917
In some circumstances this is the permanent profile of the entity. The commodities business might be one example of this situation and the perspective of investment return to the stakeholders by dividends or capital reduction is perfectly recognized in this profile.
JAMAR Vol. 1 · Number 1 · 2002
70
Final Comments
One of the most difficult challenges for the value-management process is the linkage between the shareholders’ desires and managers’ behavior—because it is difficult to make them focus on value management in a productive way. It requires concepts, structures, systems, and people to turn abstraction into reality—which means management. This paper has addressed the conceptual aspects of this issue. It is evident that the higher the market value, the better the perception from the point of view of the shareholder, but this does not cope with all that is needed to avoid informational bias. Even if the shareholder is satisfied with the level of increase in market value, this does not guarantee that the shareholder is aware of the level of efficiency related to this market value. In other words, what has occurred with respect to the level of investments in providing this result? The proposed “corners” profile of market value and MVA® is one way to plan and follow the operations of the entity in the context of the challenge to identify proper trade -offs in management decisions. The use of this approach is recommended for (at least) four important correlated benefits, as follows: 1. It can alleviate feelings of unfairness on
the part of managers. Although market value is one issue that shareholders include in the performance appraisal, they do not have control of market value, even though their actions can affect it. As a consequence, a fair measure is fundamental to provide feasible goals that meet with the commitment of management, and the model achieves this.
2. The model allows both the stakeholders
and managers to look at the same tool, which is, in itself, very useful in reducing bias and misunderstandings in the management of the entity.
3. The model provides conditions to
identify strengths, weaknesses, and responsibilities of what is useful for the management accounting mission in the entity.
4. The model can be used as an instrument
to follow the path of the entity as a going concern, for both planning and control.
The planning process is definitely the key part of this process. In this situation, the “corners” model and the use of the intrinsic and Stewart types of MVA® provides additional relevant information, not only for the shareholders but also for managers in their self-evaluation of their proposed strategies. With regard to the model itself, some additional comments can be made. 1. First of all, it is not proposed to
substitute this approach for the metrics already at the disposal of the entity. Rather, the model should be added to the current approaches adopted by the entity. In this sense, it is important to recognize that this does not cast out all previous contributions. On the contrary, it upgrades and integrates them. This is very significant because the process of breaking with established theories requires careful work to avoid misunderstandings, frustration, and wasted time.
2. Although, naturally, a positive MVA® is
the desired profile, the understanding presented in this paper involves a deeper analysis than that provided simply by seeking a positive MVA®. Without such a deeper analysis, the “corner” analysis is extremely superficial and not especially useful.
3. Even though “corner” 1 is usually the
most desirable from the point of view of the owner (the shareholder), this “corner” is definitely not the only
JAMAR Vol. 1 · Number 1 · 2002
71
acceptable one, depending on the circumstances.
4. “Corner” 2 might be a temporary
position for an entity while the investors are considering a full appreciation of the information made available, rather than reacting to the magnitude of the intrinsic economic perspective.
5. “Corner” 3, much more than any other,
is the least desired—due to the combination of an increase in capital invested and a decrease in market value. This is the opposite of what the shareholder would like to obtain in the long term.
6. “Corner” 4 might be typical for entities
in which a high potential for value growth cannot be perceived. It requires a strong effort (in terms of assets and liabilities management) to reduce the capital invested to offset the possible decrease in market value. What can happen is that market anticipation might be stronger than the capability of asset management to deliver. This configuration strongly adheres to income distribution and, in some cases, it could slowly reduce the assets of a business. It is probably the most complex “corner” due to the positive MVA® and the negative change in market value. In this case, in spite of the decline in market value, the benefit attributed by the market exists and should be understood as a potential future benefit.
7. The proposal is dynamic, not static—in
the sense that, after the identification of the “corner” status, the entity must develop its plan to “migrate” or stay where it is. The current status identification is the first step in the entity’s life journey.
In response to the research question posed at the beginning of this paper, from the
perspective of value management, the proposed analysis seems to be a very useful addition—in that it provides consistency and reduces the influence of biased information, both for shareholders and management. The proposed method simultaneously links the internal work of management with the external world. In so doing, it canvasses the full scope of value-management analysis. References
Copeland, T., Koller, T. and Murrin, J. (1994), Valuation: Measuring and Managing the Value of Companies, Wiley, New York, USA. Iudicibus, S. (1997), Teoria da Contabilidade, 5th edition, Atlas, São Paulo, Brazil. Rappaport, A. (1998), Creating Shareholder Value , Free Press, New York. Sheikholeslami, M.(2001), “EVA, MVA, and CEO Compensation”, American Business Review , West Haven, Jan. Simon, H. (1976), Administrative Behavior, Free Press, New York, USA.Stewart, G.B. III (1990), The Quest for Value, Harper Business, New York, USA. Solomon, E. and Pringle, J.J. (1981), Introdução à Administração Financeira, Atlas, São Paulo, Brazil. Van Horne, James C. (1995), Financial Management and Policy, Prentice Hall, Englewood Cliffs, USA. Yook, K.C. and McCabe, G.M. (2001), “MVA and the Cross-section of Expected Stock Returns”, Journal of Portfolio Management, New York, Spring.