Demonstrating validity for high-impact language tests - ealta
Loyola University Chicago Loyola University Chicago
Loyola eCommons Loyola eCommons
Dissertations Theses and Dissertations
1988
The Validity of Credentialing Tests: An Application of Content, The Validity of Credentialing Tests: An Application of Content,
Criterion-Related, and Construct Valitation Strategies to a Medical Criterion-Related, and Construct Valitation Strategies to a Medical
Laboratory Practitioner Certification Examination Laboratory Practitioner Certification Examination
James Robert Fidler Loyola University Chicago
Follow this and additional works at: https://ecommons.luc.edu/luc_diss
Part of the Psychology Commons
Recommended Citation Recommended Citation Fidler, James Robert, "The Validity of Credentialing Tests: An Application of Content, Criterion-Related, and Construct Valitation Strategies to a Medical Laboratory Practitioner Certification Examination" (1988). Dissertations. 2624. https://ecommons.luc.edu/luc_diss/2624
This Dissertation is brought to you for free and open access by the Theses and Dissertations at Loyola eCommons. It has been accepted for inclusion in Dissertations by an authorized administrator of Loyola eCommons. For more information, please contact [email protected].
This work is licensed under a Creative Commons Attribution-Noncommercial-No Derivative Works 3.0 License. Copyright © 1988 James Robert Fidler

THE VALIDITY OF CREDENTIALING TESTS: AN APPLICATION OF
CONTENT, CRITERION-RELATED, AND CONSTRUCT VALIDATION
STRATEGIES TO A MEDICAL LABORATORY PRACTITIONER
GERTIFICATION EXAMINATION
by
James Robert Fidler
A Dissertation Submitted to the Faculty of the Graduate School
of Loyola University of Chicago in Partial Fulfillment
of the Requirements for the Degree of
Doctor of Philosophy
November
1988

(c). 1988, James Robert Fidler

ACKNOWLEDGMENTS
The author would like to express thanks to Dr. John Edwards, Dr.
Emil Posavac, and Dr. Scott Tindale for their assistance and guidance
throughout this research. In addition to proposing ideas, suggesting
analyses and reviewing drafts related to this project, both Dr.
Posavac and Dr. Tindale helped the author during many stages of his
graduate work. Special thanks are expressed to Dr. Edwards who
directed this research. Throughout both the author's undergraduate
and graduate work, Dr. Edwards provided guidance, assistance, and an
example for the author in many academic areas.
This report was also made possible through the cooperation and
support of Mr. Chester B. Dziekonski, Executive Director of American
Medical Technologists. Thanks are extended to Mr. Dziekonski for the
many ways in which his help contributed to this project.
The author gratefully expresses thanks to his mother, Barbara,
and to Timothy and Gerald, for the encouragement, support, and
understanding which enabled him to realize the completion of many
academic goals.
ii
VITA
The author, James Robert Fidler, is the son of Robert C. Fidler
and Barbara (Henry) Fidler-Swatzina. He was born July 16, 1960, in
Chicago, Illinois.
His elementary education was obtained at Queen of the Rosary
school in Elk Grove, Illinois. His secondary education was completed
in 1978 at Elk Grove High School.
In September, 1978, Mr. Fidler entered Loyola University of
Chicago, receiving the degree of Bachelor of Science cum laude in
psychology in May, 1982.
In September, 1982, Mr. Fidler began graduate study at Loyola
University of Chicago, in the applied social psychology program. Mr.
Fidler completed the degree of Master of Arts and doctoral class work
in May, 1985.
In October 1985, the author began employment with American
Medical Technologists in Park Ridge, Illinois, as Director of Testing
and Education. His primary duties included the direction of test
development, administration, processing, and validation.
Mr. Fidler has contributed articles to the American Journal of
Psychology in the area of cognitive processing, and to Evaluation and
the Health Professions in the area of professional role definition.
He received the degree of Doctor of Philosophy in January 1989.
iii
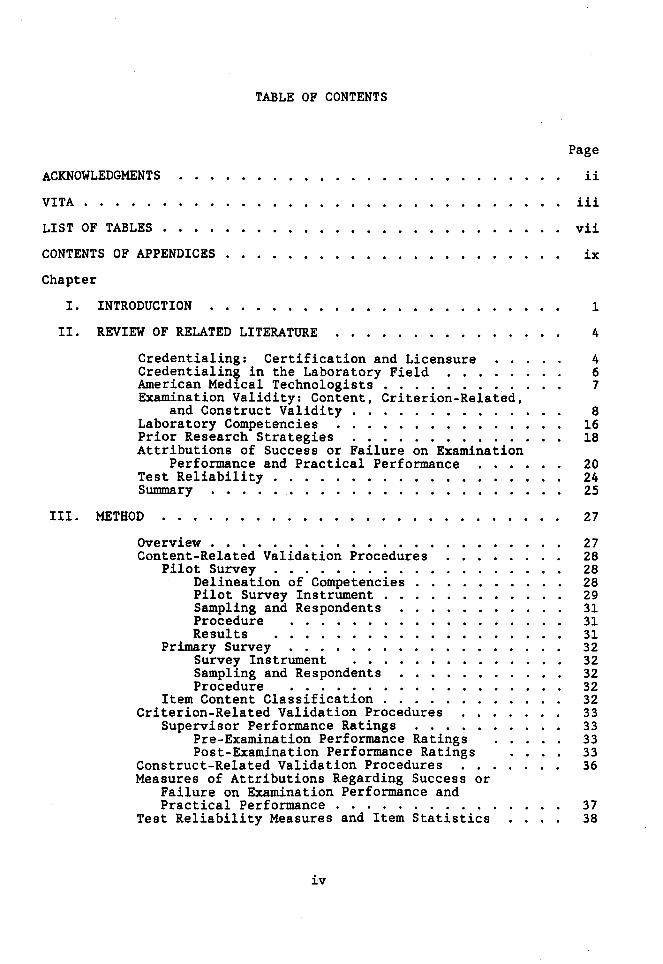
TABLE OF CONTENTS
Page
ACKNOWLEDGMENTS
VITA
ii
iii
LIST OF TABLES .
CONTENTS OF APPENDICES . . . . . . . . . . . . . . vii
ix
Chapter
I. INTRODUCTION 1
4 II. REVIEW OF RELATED LITERATURE
Credentialing: Certification and Licensure 4 Credentialing in the Laboratory Field . . . . 6 American Medical Technologists . . . . . . . 7 Examination Validity: Content, Criterion-Related,
and Construct Validity . . . • • . • 8 Laboratory Competencies . • . . . . • • • • 16 Prior Research Strategies . . • • • • . . . . 18 Attributions of Success or Failure on Examination
Performance and Practical Performance • • • • . . 20 Test Reliability • . . . . • • . • . • . 24 Summary . • • . 25
III. METHOD
Overview . . . . . . . . . . . . . . Content-Related Validation Procedures
Pilot Survey . . . . . . • • . Delineation of Competencies Pilot Survey Instrument . Sampling and Respondents Procedure Results . • . . . . . .
Primary Survey • . . . . . . Survey Instrument Sampling and Respondents Procedure . . . . . • •
Item Content Classification . . . . Criterion-Related Validation Procedures
Supervisor Performance Ratings . . Pre-Examination Performance Ratings Post-Examination Performance Ratings
Construct-Related Validation Procedures . . Measures of Attributions Regarding Success or
Failure on Examination Performance and Practical Performance . • . . . . . . . . .
Test Reliability Measures and Item Statistics
iv
27
27 28 28 28 29 31 31 31 32 32 32 32 32 33 33 33 33 36
37 38

IV. RESULTS • • • • • • . • • • • • • • 40
Overview of Obtained Measures • • • • • Medical Laboratory Technician
Examination Valida ti on • . • . . • • • • . • • • Medical Technologist Examination Validation:
40
40
Parallel Measures • • . . • . • 41 Results of Content-Related Measures • . • • . 42
MT and MLT Task Analyses . 42 Respondents . • • • • • • • • 42 Demographic Questions • • • • • • • • 42 Tasks • . • • • • . . . • • • . . • . • . 45 Knowledge Areas • • • . . • • • • 4 7 General Work Areas • • • . . • • • • . • • • • 4 7
Judges' Content Classification of Test Items . 54 Results of Criterion-Related Measures • • 56
Pre-Examination Supervisor Ratings • • • • • • • • • 59 Laboratory and Non-Laboratory Academic
Performs.nee . . . . . . . . . . . . . . . . Post-Examination Supervisor Ratings • • • • .
Results of Construct-Related Measures ••••••• Convergent and Discriminant Validation • • • • Factor Analysis of Test Items • • • •
Exploratory Analysis Strategy • • • • • • Item Sample A • • • • • • • • • • .
63 67 73 75 77 77 77
Item Sample B • • • . • • • • Factor Analysis of Sub-Scores
. . . . . . 81
Attributions of Performance . • • . • • • • . • • • • Examinee Attributions of Test Performance Supervisor Attributions of Practical Performance
Test Reliability . . • •
82 84 84 87 92
v. DISCUSSION • • . . • . . . . . 94
REFERENCES
APPENDIX A
APPENDIX B
APPENDIX C
Content-Related Validity Task Analysis • • • • . . • • • • • • • • Judges' Item Classification .•••.•••
Criterion-Related Validity • • • • • • • • •
94 94 96 97
Academic Performance and Examinee Performance Post-Examination Supervisor Ratings
98 . • • 100
Construct-Related Validity • . • • • • • Test - Sub-Test Correlations • • • • • • • Factor Analysis • . . • • . . . • • • . •
Attributions of Performance • • • . • • . . . Examinee Attributions of Test Performance Supervisors' Attributions of
Practical Performance • . • • • . . • Test Reliability • • . . • . • • . • • • . . Utility of Validation Measures Employed in the
Present Research: Implications for Researchers Content-Related Measures • . • • • • Criterion-Related Measures • • • • • Construct-Related Measures .
SUI11IDary • • • • • • • • • • • • • • • • • •
v
• • 103 . 103
• • 104 • • 104 • . 104
• . 106 • • 107
• 108 • • 108 • • 110
. 112 • 113
115
• 118
• 127
. 129

APPENDIX D
APPENDIX E
APPENDIX F
APPENDIX G
vi
• 131
138
. 141
149

Table
1.
2.
3.
4.
LIST OF TABLES
Task Analysis Mail Survey Responses
MLT and MT Responses to Demographic Questions •
Knowledge Area Importance Ratings for MLT and MT Respondents
General Work Area, Time Spent and Importance Ratings for MLT and MT Respondents . • . . . • • . .
Page
. . • 43
• 44
48
49
5. Current and Survey-Based Test Specifications for MT Certification Examination • • • • • . • • • • • • • • • 51
6. Current and Survey-Based Test Specifications for MLT Certification Examination . • • • . . . . • • • • . . • 52
7. Current and Survey-Based Sub-Section Examination Specifications • . • • •
8. Correspondence Between Current Item Pool Classifications
53
and Judges' Content Category Assignments • 55
9.
10.
Data Collection Response Rates . . . . . 57
MLT and MT Examination Performance Statistics •
11. Correlations Between Total Test Score and Pre-Examination Internship Supervisor Ratings
• • 58
for MT Examinees . . . . . . . . . . . . . . . . . . . . . 60
12. Correlations Between Pre-Examination Work Area Performance Ratings and Examination Sub-Test Performance for MT Examinees . • . . • . 62
13. Correlations Between Measures of Academic Performance and Total Test Score for MLT Examinees • . . • •
14. Mean Academic Performance for Passing and Failing
64
MLT Examinees . . . . . . • • . . . . . • • . . • . . • • . 66
15. Correlations Between Post-Examination Supervisor Ratings and Test Performance for MT Examinees . • • . . • . 68
16. Correlations Between Post-Examination Supervisor Ratings and Test Performance for MLT Examinees . • . . • • 70
17.
18.
Correlations Between Pre-Examination Internship Supervisor Ratings and Post-Examination Supervisor Ratings for MT Examinees • • • • • . • • • • • . • •
Correlations Between Global Work Characteristics and Total Test Score for MT and MLT Examinees • . • •
19. Mean Global Work Ratings for Passing and Failing
71
72
MT and MLT Examinees • • • • • . • • • . • • . • • • • • • 74
vii

20.
21.
22.
23.
24.
25.
Test and Sub-Test Intercorrelations for MT and MLT Examinations • • . . . . . . . • .
Results from Factor Analysis of Item Sample A .
Results from Factor Analysis of Item Sample B •
Summary Statistics from Two Independent Factor Analyses of MLT Examination Items • • . . . • . • • . . .
Results from Factor Analysis of MT and MLT Examinations Sub-Tests . . . • • . . • •
Correlations Between Examinee Attribution Variables and Total Test Score for MT and MLT Examinees • • • • •
76
. 78
• 79
80
83
• 85
26. Mean Supervisor Attribution Ratings for MT and MLT Groups • 88
27. Correlations Between Supervisor Attribution Variables and Total Test Score for MT and MLT Examinees • . • .
28. Correlations Between Best/Worst Variable and Total Test Score, Controlling for Attributional Variables,
• 90
for MT and MLT Examinees • • • • • • • • • • . • • . . 91
29. Reliability Indices for Five Administrations of MT and MLT Examinations • • • • • . . • • • • • • • • • • 93
viii
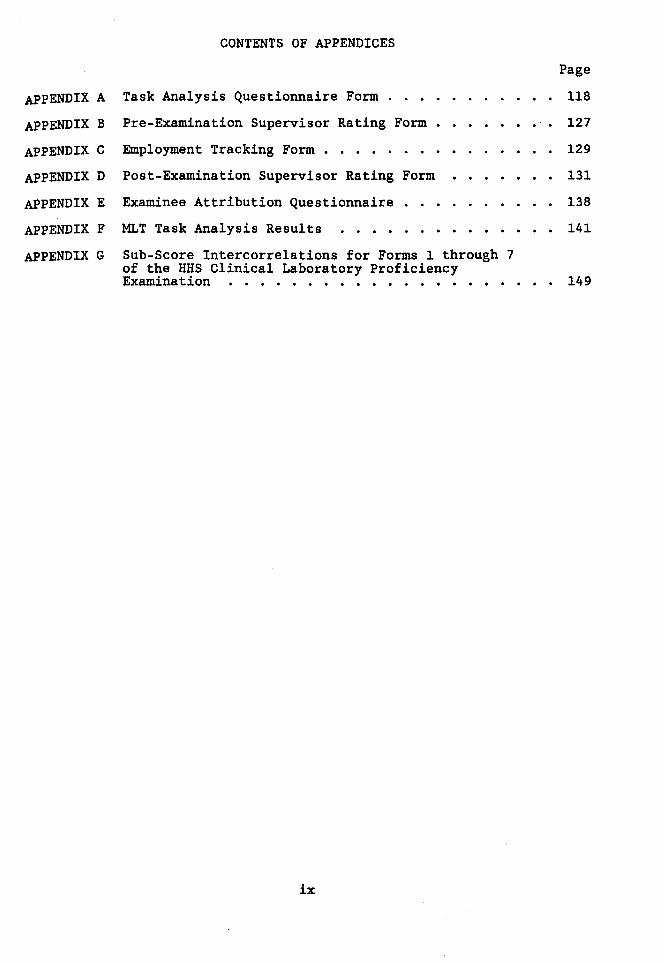
CONTENTS OF APPENDICES
APPENDIX A Task Analysis Questionnaire Form . • •
APPENDIX B Pre-Examination Supervisor Rating Form
APPENDIX C Employment Tracking Form •
APPENDIX D Post-Examination Supervisor Rating Form
.APPENDIX E Examinee Attribution Questionnaire •
APPENDIX F MLT Task Analysis Results
Page
118
127
129
131
138
141
APPENDIX G Sub-Score Intercorrelations for Forms 1 through 7 of t~e H~S Clinical Laboratory Proficiency Examination . . . . . . . . . . . . . . . . . . . . . 149
ix
CHAPTER I
INTRODUCTION
The validity of examinations is a primary consideration in
competency certification. As a broad range of organizations grant
certification, the National Commission for Health Certifying Agencies
(NCHCA) was established to develop standards of conduct for
credentialing agencies. The Commission has outlined specific criteria
that voluntary certification bodies should adhere to in promoting the
quality and integrity of professional certification. Included in the
NCHCA criteria are guidelines for establishing the validity of
certification .examinations. These guidelines address the issue of
content, criterion-related, and construct validation of certification
examinations. This overall, tri-partite perspective on validation is
retained throughout the present discussion, and provides an outline by
which the presentation is organized. Specifically, the content,
criterion-related, and construct validity of two laboratory
practitioner certification examinations are addressed.
While several laboratory practitioner certification agencies
exist nationwide, in addition to several state licensing boards and
one government agency, the present research addressed certification
examinations administered by one group: American Medical
Technologists (AMT). AMT has been awarding certification to
laboratory practitioners since 1939. Currently, AMT recognizes and
certifies two levels of practitioners: medical laboratory technician
(an entry-level designation) and medical technologist (an experienced
and supervisory-level designation). While the present research
primarily addressed medical laboratory technicians (MLTs) several
parallel validation measures were also considered for the medical
technologist (MT) group. The general intent of the present research
1
was to assess the validity of the respective tests by comparing
examination performance to a number of independent criteria
purportedly related to competence in the laboratory. The degree to
which obtained test scores agreed with other independent indicators of
laboratory competence was assessed. In addition to validation, one
other issue is addressed in the present discussion: attribution of
success or failure. Specifically, examinees were queried regarding
the reasons they perceived for success or failure on the tests that
they took. Furthermore, examinees' work supervisors were queried
regarding the reasons for examinee success or failure in their
practical on-the-job performance. While attributional variables may
yield supplementary information regarding the meaning of a given test
score, the purpose of including these variables in the present
research was primarily theoretical and exploratory. The attempt was
made to assess the generalizability of attributional factors by
applying them to a new performance domain.
The validation aspect of the present research was two-fold. A
primary intent was to assess the appropriateness of MT and MLT
examinations administered by American Medical Technologists,
specifically. A second intent of the research was to assess the
utility of various validation strategies which may be of use to other
credentialing agencies. This second aspect is crucial, since
investigators suggest that comprehensive validation studies are
difficult to carry out (and are seldom performed satisfactorily in the
certification context). The present research not only contributes to
updating criteria used for laboratory practitioner competency
certification, but investigates the overall viability of sundry
validation strategies as well.
Examination validity was assessed via a number of diverse
strategies. Content validity was assessed by conducting a task
analysis of currently practicing laboratory technicians, and relating
2

the amount of time spent in general work areas to the proportion of
examination questions addressing each area. Furthermore, subject
matter ex~erts were asked to provide content classifications of test
items. These classifications were then compared to current item pool
content designations. Criterion-related validity was assessed by
comparing pre-examination and post-examination supervisor performance
ratings to examinee test and sub-test performance. Construct validity
was assessed by investigating the interrelationships between specific
work-area performance and sub-test performance. A factor analysis of
a sample of test items was also utilized to investigate constructs
underlying test performance. In addition, several indices of test
reliability were obtained.
This report begins with a discussion of a number of validation
issues and how other investigators have applied them to similar tests.
Background regarding the tests under consideration and American
Medical Technologists is presented. Chapter III of this report
describes the methodology for collecting validation and attribution
information, in detail. Chapter IV presents the results of analyses
performed on the collected data, and describes the degree of
relationship between examination performance and other indices of
laboratory competence. This report is concluded with a discussion of
findings, and sUIIUil8ry statements suggesting which validation
strategies may be of the greatest utility to other investigators.
3

CHAPTER II
REVIEW OF RELATED LITERATURE
Credentialing: Certification and Licensure
"Credentialing" may be generally thought of as the process by
which individuals are deemed competent to perform in their
professional area of practice. As a broad term "credential" tends to
suggest a piece of evidence by which individuals support claims that
they can successfully perform a given outline of duties. In the
general sense, the term "credential" could be used to suggest a number
of things including: academic degrees, experience, and certificates
of completion. However, when the term is used in the health
professions, it typically refers to the award of a license or
certificate. In the present report, the term will be used in this
latter sense, and will refer to the process of verifying competence.
Several characteristics differentially define licensure and
certification. Licensure can be thought of as restricting practice in
a given profession while certification can be thought of as
restricting the title of individuals working in a given profession.
Furthermore, a license is typically a permit from a government
(usually state) agency allowing the holder to provide special types of
services. Most health related services require a license. On the
other hand, certification can be considered voluntary, and is usually
a nation-wide process whereby a nongovernmental agency grants a title
or certification of competence to practice (D'Costa, 1986).
Although a fundamental difference exists between licensure and
certification, the process by which either of these credentials are
awarded can be similar. While individual differences exist between
credentialing bodies, many can be thought of as requiring two basic
elements: 1) a minimum standard of experience and/or education must
4
5
be met, and 2) an examination must be successfully completed. For
example, an agency may state that in order to be deemed competent to
practice, an individual must have at least a Bachelor's degree in the
field and pass a competency examination. By using a multiple
criterion approach in awarding credentials, agencies hope to
successfully screen out individuals who do not meet at least a minimum
determined standard. Ultimately, all standards seem to be derived from
opinions of experts within professional groups.
While both minimum standards and examinations may be equally
. important in the credentialing process, the present research and
discussion primarily address the examination aspect of the process.
This focus is derived from an analysis of several issues. D'Costa
(1986, p. 138) states that "because failure to pass a credentialing
examination is the most disputed and tangible basis for denying a
credential, such examinations have come increasingly into public
awareness and criticism. Recent legal challenges have raised
questions about the job relatedness and fairness of such examinations,
especially when they are primarily in the written and multiple-choice
mode.• The examination may be the most vulnerable element in the
credentialing process, and therefore deserves special consideration.
However, most importantly, the quality of a test may be crucial toward
allowing only competent individuals to practice, thus protecting the
public that the profession serves.
In some professions, there is clearly a lack of consensus in
outlining minimum standards for the award of a credential (for
example, should a practitioner be minimally required to have an
Associate or Bachelor degree?). Such issues are typ~cally manifest as
fundamental disagreements between professional organizations.
However, since examination challenges usually involve a particular
circumstance rather than profession-wide disagreements 'as to what
constitutes minimal competence, the test may be a greater source of
vulnerability to credentialing bodies.
6
While the present discussion will address non-examination·
criteria as they apply, the main focus of the research involves
credentialing tests. Furthermore, although the ideas presented in
this discussion relate to licensure, the research was conducted within
the context of one certification agency. Although the principles
presented here may or may not apply to all certification disciplines,
the present research involves the assessment of medical laboratory
practitioner competence, specifically.
Credentialing in the Laboratory Field
The structure of credentialing in laboratory practice is diverse
and complex. Overall, a single unitary standard for demonstrating
competence in the laboratory field does not seem to exist. This fact
is illustrated by the number of alternate laboratory credentials
awarded. For example, each of the following agencies issues at least
one type of certification designation in the laboratory profession:
American Medical Technologists (AMT), the American Society of Clinical
Pathologists (ASCP), the International Society for Clinical Laboratory
Technologists (ISCLT), and the National Certification Agency for
Medical Laboratory Personnel (NCA). While a certificate from any of
the above agencies is sufficient in most states, several states have
developed their own licensing requirements. Licenses to practice are
required in the states of California, Florida, Georgia and Tennessee,
and in New York City. Furthermore, practitioners working in
independent laboratories (in accordance with Medicare personnel
regulations) may be certified by the United States Department of
Health and Human Services. Several other agencies also exist for the
purpose of certifying specialists within the laboratory profession
(for example, histologists and microbiologists).

The distinction between laboratory licensure and certification
is further obscured by the fact that the passage of some certification
examinations may be accepted in lieu of a licensure examination.
Although attempts have been made at unifying the medical laboratory
profession (for example, the proposed unification of American Medical
Technologists and the American Society for Medical Technology in
1985), the discipline remains diversified. While the principles and
applications discussed in the present research may be relevant to all
laboratory credentialing bodies, this report deals exclusively with
certification examinations administered by American Medical
Technologists.
American Medical Technologists
American Medical Technologists (AMT) is a nation-wide agency
that certifies three primary designations of health personnel:
medical technologists, medical laboratory technicians, and medical
assistants. While medical assistants do perform laboratory-related
tasks, these are not central to the group's professional role.
Therefore, the present discussion will address only the two laboratory
groups certified by AMT.
American Medical Technologists is one of the oldest laboratory
practitioner certifying groups, and has been awarding medical
technologist certification since 1939, medical laboratory technician
certification since 1968, and medical assistant certification since
1972. The organization's purpose is to protect the welfare of the
public by maintaining competency standards in the medical laboratory
and medical assisting professions. At the time of this report, AMT
maintained an overall membership of approximately 16,500
practitioners: 7,200 medical technologists, 1,300 medical laboratory
technicians, and 8,000 medical assistants.
AMT is composed of a complex organization of boards, committees,
and individuals. The body responsible for all actions of the
7

association is the AMT Board of Directors. Although there are a
number of sub-committees within the organizational structure, one of
the most salient groups is the AMT Education, Qualifications, and
Standards (EQS) Committee. The EQS Committee is charged with the
responsibility of constructing tests and developing test standards.
Also associated with AMT is the American Medical Technologists
Institute for Education (having its own Board of Directors) which
directs all continuing education policy. The Accrediting Bureau of
Health Education Schools, another group within AMT, is charged with
the responsibility of assuring that medical laboratory technician and
medical assisting vocational schools meet acceptable standards.
The administration of AMT is supported by a staff of 17
individuals, working at the AMT Office in Park Ridge, Illinois. The
staff are guided by the Executive and Associate Executive Directors.
AMT currently has organized •societies• within many states,
holds annual National Conventions and Educational Sessions, and
releases a publication eight times per year. AMT develops and
promotes a number of approved continuing education programs for
members, provides a system of recording and reporting earned
continuing education credit, and directs an ongoing "Revalidation of
Certificate• program. The "Revalidation• program was designed to
promote professional growth of practitioners after they are certified.
In order to become a certified member of AMT, an individual must: 1)
meet a set of educational requirements, 2) fulfill a set of work
experience requirements, and 3) pass a certification test. The •test•
criterion will be the subject of the remainder of this discussion.
Examination Validity: Content, Criterion-Related, and Construct
Validity
Validity is perhaps the primary consideration when assessing the
•goodness• of a test. Although test validity may be conceived of in a
variety of ways, most investigators agree that a test's utility hinges
8
on the demonstration of its validity. This issue is especially
salient in the health credentialing field where practitioners are
certified, on the basis of an examination, to deliver critical health
care services to individuals.
While at least one-dozen types of validity are discussed by
investigators, most presentations delineate three major types of
validity: content, criterion-related, and construct. That primary
tri-partite distinction will be utilized for the present research.
Content validity addresses whether or not a test includes a
representative sample of the relevant content domain, and excludes
content outside that domain. A primary strategy for assessing content
validity is to have a group of individuals (with the appropriate
knowledge of the subject matter) review an actual test, or a sample of
items comprising a test. Raters are then systematically queried as to
the appropriateness of item and test content. A second, somewhat
indirect method of assessing content validity is to: 1) conduct a
task analysis of practitioners in the relevant field to determine
appropriate content, then 2) systematically assess whether the test is
representative of these behaviors.
However, a special problem emerges when considering content
validity in the certification context. Because of the confidential
nature of certification tests and the lack of opportunity to assemble
large groups of practitioners (under secure conditions) for content
reviews, it is difficult to conduct large-scale content-related
assessments. As a result, direct reviews of test items may be limited
to active members in the credentialing agency who have "clearance" to
view examinations.
In contrast to looking directly at actual test documents,
criterion-related validity involves the extent to which scores on a
test are related to an external criterion measure (such as on-the-job
performance). Such research is typically correlational, and assesses
9

10
the relationship between behavioral performance in specific areas, and
written measures of competence in those areas. A primary criterion
for assessing this type of validity involves supervisors' ratings of
examinees' practical ability. Criterion measures can be obtained both
before and after a test is administered, and may include ratings of
performance in specific content-related work areas, in addition to
rating examinees in terms of other attributes (such as attendance at
work, appropriate use of time, character, etc.).
While criteria other than supervisor evaluations may be useful,
these tend to be the most widely considered by credentialing agencies
for validation purposes. One reason for the emphasis on this data
source is that supervisor ratings are often required (by certification
agencies) as a prerequisite to taking a certification examination.
Therefore, correspondence between practical ratings and test
performance is essential to both the certification process and the
test validation process.
Construct validity refers to the degree that performance on a
measure is related to theoretical constructs utilized to explain
observable behavior patterns. When test scores are interpreted using
a construct, they are evaluated in terms of a framework or network of
aspects associated with the construct label (American Educational
Research Association, American Psychological Association, National
Council for Measurement in Education, 1985). One type of construct
validity, convergent validity, may be demonstrated by showing that
behavioral performance in specific work areas is related to written
measures, purportedly testing competence in those areas. In addition,
discriminant validity may be demonstrated by showing _that practical
and written performance in unlike areas are not related. Construct
validity may also be considered by using a factor-analytic
methodology. In this way, the constructs that a test is assessing may
be defined.

11
In yet another sense, all types of validity may be considered
aspects of (the more general) construct validity. For example,
information gained regarding the content-appropriateness of a test, or
the predictive ability of a test, contributes to a better
understanding of the constructs that a test is addressing. In this
way, validation research of any type may be viewed as enlarging the
nomological net delineating the constructs addressed by a test. Each
of these construct validation aspects are discussed in more detail
below as they apply to laboratory practitioner credentialing.
Validity involves the correctness of the inferences that may be
drawn from any individual's test score (Shimberg, 1981). Shimberg
highlights the importance of validity regarding licensure and
certification testing: "Tests are one part of the licensing and
certification process whose purpose is the protection of public
health, safety, and welfare" (p. 1138). Shimberg's statement is most
salient regarding the credentialing of health personnel. The public's
welfare is indeed dependent upon the qualifications and competencies
of individuals who deliver health care.
The most connnon conception of health care personnel would
perhaps include: doctors, dentists, paramedics, and nurses. However,
there are other medical professionals who also carry significant
amounts of responsibility. Medical laboratory practitioners are one
such group. Laboratory personnel provide an extensive network of
services which are crucial to the correct diagnosis and treatment of
patient pathology. Doctors rely on accurate and reliable test results
for determining subsequent action. Given the criticality of the
medical laboratory technician's role, sound mechanisms for competence
assessment are essential.
In general, examination validity is a primary consideration of
competency certification. The National Connnission for Health
Certifying Agencies (NCHCA) states that " ... validity is an essential
component of any health certification process. Indeed the concept of
validity is applicable not only to certification examinations, but
also to the entire certification process. There is a fundamental
relationship between validity and the purpose of health certifying
agencies and the CoDllllission in society" (NCHCA, 1981, p. 2).
NCHCA provides guidelines for the establishment of validity of
certification examinations. The CoDllllission discusses three types of
validity to consider for certification testing (NCHCA, 1981, p. 2).
The CoDllllission also states that validation should begin with content
measures, then proceed to the other measures in the following order:
12
First, content validity, which is a determination that the content of the examination--both in terms of individual test items and the relative emphasis of different content areas of the examination--is based on the behavioral domain of the occupation involved, is an essential validity. Second, predictive or criterion-related validity, which assures that examination results are related to occupational performance, should be the object of certifying agencies' vision and is an area on which each agency should have a defensible stand, given that each a~ency implicitly represents itself as offering this type of validity to at least some extent. Third, construct validity, which demonstrates the relationship of psychological traits or other identifiable characteristics necessary for a performance in a profession to the examination, is a research frontier toward which certification should be advancing.
The CoDllllission continues that:
The term predictive validity is applied most frequently to demonstrations of a relationship between the certification examination results for an individual and that individual's on-thejob performance over time. A relationship between the certification examination results for an individual and that individual's performance on another evaluation instrument with a similar purpose is called also concurrent validity. Both such relationships definitely are covered by the more generic term, criterion-related validity.
The task force assumed that certifying agencies in the CoDllllission membership should be progressing along the continuum from content to predictive (or criterion-related) to construct validity. Some groups, of course, presently are able to do more than others in this regard, given the considerable consumption of resources necessary to establish validity, but all groups should be encouraged to do what they can. For the time being, it is reasonable to expect the primary focus of resources to be on the identification of examination content and the assurance of content validity (NCHCA, 1981, p. 2).
NCHCA provides an outline for establishing the content validity
of examinations which include assessment of the: 1) universality, 2)

13
frequency, 3) criticality, and 4) level of behaviors that a test
purports to measure. Perhaps one reason for primary consideration of
content validity involves the more ready accessibility of this type of
validation data. In addition, Shimberg (1981) states that " ... in the
licensing/certification situation, the purpose of the test is to
identify those applicants who meet a specified competence standard.
The test seeks to determine whether applicants possess the requisite
knowledge, skills, and abilities deemed necessary for competent
performance. For this purpose, content validity is an appropriate
validation strategy" (p. 1143).
However, other investigators are more insistent that
certification agencies should go beyond the demonstration of content
validity. For example, Messick (1981) suggests construct validity is
of primary importance. He argues that content validity is irrelevant
as well as insufficient. However, the total dismissal of the
necessity of content validity may be disputed from a legal point of
view.
It may be argued that while content validity is required, it is
also necessary to look at the outcomes derived from examination
determined decisions (criterion-related validity). In addition,
D'Costa (1986, p. 144) states that "validity is concerned with the
interpretations, utilization, and impact of examination results. It
justifies the rights and privileges that are received by individuals
who have passed such examinations. More importantly, validity is
concerned with the perceptions of the public as to the rights or
capabilities of such individuals." He continues that "credentialing
agencies have responsibilities for their examinations that go beyond
those formally published in the examination manuals or declared by the
examination representatives in professional forums."
D'Costa discusses validity considerations in terms of "how well
the credentialing examination models or serves as a miniature replica
14
of, professional competence.• In addition, "content, construct, and
criterion validity checks are but facets of the total process of
modeling or representing a theory of competence by means of an
examination" (D'Costa, 1986, p. 143). Relatedly, D'Costa suggests
that job relevance and adverse impact should be of primary concern to
credentialing agencies. He reconnnends that examination specifications
incorporate a competency model based on the following dimensions: the
assigned job function, the level of expertise required given the
content and available resources, and the job performance context.
Clearly, investigators differentially weight the importance of
various validation strategies. The range of different perspectives
and emphases may suggest that an integrated, multi-method validation
plan is appropriate. However, as highlighted in a later passage, all
types of validity may contribute to a more global •construct
validity.•
NCHCA also suggests that overlap exists among the major validity
types.
Ultimately, the purpose of achieving each type is the same: to assure competent performance ... satisfactory outcomes of practitioner performance, rather than just individual attainment of the standard prerequisites to performance, are the public expectation underlying certification (NCHCA, 1981, p. 3).
The Connnission recognizes that it is not the first or only group to
attempt to establish some guidelines on the subject of validity.
However,
... the Connnission's unique role demands the establishment of validity guidelines of particular application to Connnission members. These guidelines, and the demonstrations of validity on the part of Connnission members, should conform with the spirit of guidelines issued by the Equal Opportunity Connnission and other federal agencies and the American Psychological Association.
The tri-partite conception of validity (content, criterion
related, and construct) is perhaps adopted by most traditional
treatments of the subject. Of particular relevance is a document
published by a joint connnittee of the American Educational Research
Association, the American Psychological Association, and the National
Council on Measurement in Education (1985) entitled "Standards for
Educational and Psychological Testing." In addition to recognizing
the "three types" of validity, the document contains a chapter
addressing "Professional and Occupational Licensure and
Certification." The "Standards" also note the difficulty of
conducting criterion-related validation studies. However, it states
that "The difficulty in conducting criterion-related validation
studies does not, however, lessen the importance of validity, which
.remains a central concern. Test users should develop the evidential
basis to support a particular use" (p. 63).
15
Regardless of the particular strategy used to validate a test, a
conunent should be made regarding the subjective aspect of validation.
Hambleton (1984, p. 200) offers a salient statement regarding the
demonstration of validity. "But it should be noted that the validity
of a set of test scores and/or related mastery-nonmastery decisions
can never be demonstrated conclusively; instead, evidence is
accumulated to determine if the test scores and/or resulting decisions
appear to be serving their intended purpose. Eventually, when a
sufficient amount of evidence is collected (to fit the importance of
the intended use of the test), a judgment can be made about the
validity of the test scores and/or decisions for the intended
application." Overall considerations of validity appear to involve
expectations of how the data should array, and relative comparisons of
the data with the validator's expectations.
Before describing the validation methodology utilized for the
present research, the delineation of several laborato~y practitioner
classifications and a brief review of other medical technology
validation studies are presented below. The distinction between
content, criterion-related, and construct validity is highlighted.
16
Laboratory Competencies
A special issue regarding the competency certification of
laboratory practitioners involves the distinction between medical
technologists (MTs) and medical laboratory technicians (MLTs). These
designations generally represent gradations in practitioners'
knowledge base and experience. While MLTs may function in many of the
same task areas as MTs, MTs are typically expected to perform at a
higher level than MLTs.
The American Society for Medical Technology (1973) presented a
position paper which differentiated between several competency
designations of laboratory personnel. This paper included
descriptions of the MT and MLT roles. The difference between these
roles is succinctly described by Morgan and Irby (1978):
Scrutiny of the levels as differentiated in the paper indicates the medical technologist must possess the capabilities of both the medical laboratory technician and the certified laboratory assistant, plus an indepth knowledge of instruments and the physiological conditions affecting test results. Emphasis is on the career-entry solving skills, such as recognizing, identifying, and synthesizin~ solutions to problems. The medical technologist should be familiar with systems controls, organizations, and coII1111unications, particularly as they relate to management. The baccalaureate technologist may be involved in instruction that ranges from bench teaching to the actual design, implementation, and evaluation of curricula. The position paper suggests the MLT would function in many of the same areas, but not at the same criterion level of the medical technologist. In solving problems, the MLT is expected to follow prescribed strategies to recognize a problem and make corrections. The role of the MLT in teaching is more limited (Morgan and Irby, 1978, p. 213).
It is therefore important to distinguish not only the types of
tasks that MTs and MLTs perform respectively, but the mastery level of
these tasks as well. By delineating the tasks that laboratory
practitioners perform, the present research will contribute to a
revision of the competency outline from which AMT certification
examinations are developed. Overall, the medical laboratory
technicians (MLTs) tend to be the entry-level practitioners, while the
medical technologists (MTs) tend to be more technically advanced,
experienced, and perhaps supervisory practitioners.
17
The career progression of the laboratory practitioner is not
thoroughly defined. There are several "routes" that a practitioner
may take to career advancement which are largely dependent upon the
types of training that a practitioner receives and the professional
organization that a practitioner is affiliated with. For example,
American Medical Technologists espouses a "career ladder" concept,
whereby a practitioner is first an MLT (by meeting educational,
experiential, and examination requirements) then progresses to an MT
(through meeting additional experiential and examination
requirements). However, if the appropriate qualifications are met, an
individual may become an MT, directly. In comparison, the Health and
Human Services (HHS) Clinical Laboratory Proficiency Examination
allows any individual (including those trained only "on-the-job") to
become an MT, directly. Furthermore, the American Society of Clinical
Pathologists (ASCP) require MTs to possess a baccalaureate degree in
addition to taking a test. ASCP also defines a distinct set of
requirements for MLTs as well.
However, all agencies recognizing both MT and MLT designations
construct a separate examination for each group. While tests for
these groups may have a large proportion of "shared" items, the set
difficulty level of the questions is typically more stringent for the
MT examination (that is, the same question for the MT group would be
considered easier than for the MLT group). The overall difficulty
level of the questions comprising the MT test is greater than that
comprising the MLT test. However, the minimum passing score for both
tests tends to be comparable.
The issues outlined above suggest difficulties in determining
the "equivalence" of certificates awarded by alternate agencies.
However, despite these differences, both MT and MLT designations tend
to be recognized by most employers of laboratory practitioners.

18
Prior Research Strategies
In order to evaluate overall competence, specific competencies
must be defined. Morgan and Irby (1978) suggest that the definition
of competencies along with criterion-referenced examinations is based
on the need for the development of comprehensive task analyses in the ~
clinical laboratory field. Major medical laboratory task analyses
include those conducted by the National Committee for Careers in
Medical Laboratories (1973), the Kettering Medical Center (1975),
Hedrich and Fiene (1975), the American Society for Medical Technology
(1976), Lynch (1976), and the Navy Medical Department (1972).
Given the development of adequate task inventories, several
agencies have utilized a variety of validation strategies. One
landmark study, conducted by Professional Examination Service (PES) in
1978, originated following the passage of the 1972 amendment of the
Social Security Act (PL 92-603). "The program legislated by these
amendments established a new way for persons who fail to meet formal
education requirements to demonstrate their competency to perform as
clinical laboratory technologists by passing a proficiency
examination" (PES, 1978, p. 2). Toward this end, the HEW Clinical
Laboratory Technology Proficiency Examination was established.
Validation of the examination included assessing the
relationships (via correlations) between the written examination, a
practical laboratory examination, and a supervisor rating instrument.
PES concluded that the written examination was an adequate mechanism
for credentialing job-trained practitioners in the clinical laboratory
field. Specifically, the examination assessed the job-related
competencies of entry-level clinical laboratory practitioners and
predicted performance in a laboratory setting.
A different type of criterion-related validation study was
conducted by Lunz, Gaines, and Saylor (1986). These investigators
attempted to demonstrate the concurrent validity of the American

19
society of Clinical Pathologists (ASCP) Board of Registry Medical
Laboratory Technologist Certification Examination. In this study, the
relationship between a written examination, and the external criterion
of faculty ratings of student performance on cognitive and practical
tasks (in each content area of the medical technology curriculum) was
assessed. Cognitive and practical ratings were correlated with total
test score and each of six sub-scores, respectively. The results
supported the assumption that the examination measures the same base
of knowledge and skills that the medical technology programs assess.
Although not directly related to examination validity, Jeff and
West (1988) investigated pre-professional grade point average as a
predictor of success in medical technology programs. These
researchers correlated grades obtained in pre-professional courses
with grades obtained in professional phase courses for 125 graduates
of an MT program. These authors found that
The specific courses which showed the greatest incidence of correlations above .35 with specific professional phase courses were microbiology, mammalian physiology, and genetics. Those showing the lowest correlations were survey of calculus, general and analytical chemistry, organic chemistry, computer science, and physics (1988, p. 51).
These authors also suggest that aptitude or interest measures can be
valuable as predictors of performance when used in conjunction with
academic measures.
Overall, one particular issue is salient regarding certification
validation, and involves the demonstration of job-related criterion
validity. NCHCA (personal coDll!lunication, 1986) and Hect (1979)
suggest that proper certification validation should proceed from a
"practitioner-based" standpoint. Furthermore, Shimberg (1981) states
that finding or developing suitable performance criteria against which
to evaluate certification tests is especially difficult. For this
reason, he suggests that carrying out a criterion-related validity
study of a specific licensing or certification examination may not be
technically feasible. The problem is such that the most useful type
of validity data is perhaps the most difficult to obtain.
Regarding construct validity, Shimberg continues that in
practice, few agencies attempt to assess unobservable attributes.
• ... most agencies rely on assurance from accredited institutions that
their graduates possess not only the requisite knowledge and skills,
but other attributes as well• (p. 1144).
20
The present research approaches the validation of AMT
certification examinations from an integrative perspective. Content,
criterion-related, and construct validation of Medical Laboratory
Technician (MLT) certification examinations will be considered. The
two main purposes of this research are to: 1) apply a variety of
validation techniques to laboratory practitioner examinations,
assessing their utility as credentialing mechanisms, and 2) apply
specific information gained from this research to the ongoing test
development of MT and MLT examinations. This information will be used
toward maintaining valid competency tests in the medical laboratory
field.
Attributions of Success or Failure on Examination Performance and
Practical Performance
In addition to assessing test validity, an ancillary aspect of
this research was to explore the usefulness of subjective attributions
about the causes of performance in interpreting validation data. Two
types of attributions were studied: examinees' attributions of their
test performance and supervisors' attributions about examinees' job
performance. Results from the former provide information about the
merits of self-evaluations (of ability, effort, etc.) as a validity
criterion, while results from the latter provide more information
regarding the utility of a coDll!lonly used criterion variable:
supervisor evaluations of performance. This variable i~ also

21
important in that supervisor ratings (aside from validation) are often
used in the overall certification process.
Although not directly related to certification tests, several
investigators have addressed the prediction of student success in
laboratory courses. Of particular relevance, is the work of Rifken,
Maturen, and Bradna (1981). These investigators concluded that a
combination of academic and non-academic measures are most effective
in predicting success, and should be utilized in the process of
student selection. Such supplementary measures included overall
impression, motivation and writing ability. Other investigators have
also highlighted the utility of aptitude or interest measures (in
conjunction with academic measures) in predicting success (Lundgren,
1968; Mccure & Rausch, 1969, and Maynard, Larimore & Seation, 1974).
The above line of reasoning may be applied to the certification
examination context; that is, factors beyond obtained test scores
could be considered in the prediction of success in the laboratory
profession. In an attempt to investigate how other factors may affect
the prediction of success, the present research addresses the
attributions that examinees offer regarding the success or failure of
their test performance. Relatedly, toward identifying factors
affecting the outcome of supervisor performance ratings, supervisors
were questioned about the attributions that they made regarding the
practical performance of examinees.
One variable of potential utility to persons making selection
decisions involves the causes to which applicants attribute their
success or failure. It is clear that performance, in any domain, is
not only a function of an individual's ability, but also a function of
the effort that an individual exerts toward that performance as well.
For example, an individual scoring high on a certification examination
(high ability) may, in fact, perform poorly in the field because of
lack of motivation (low effort). While attributional variables may

22
reveal supplementary information regarding the meaning of a given test
score, the purpose of including these variables in the present
research is primarily theoretical. The attempt is made to assess the
generality of attributional patterns by applying these to a new
domain. As such, this area of inquiry remains theoretical and
exploratory in nature. Specifically, the question is posed as to
whether the types of attributions about the causes of success or
failure in general academic areas can be fruitfully applied to
certification tests and on-the-job performance in the areas of medical
technology.
Weiner (1980) presents a three-factor scheme for classifying
attributions of success and failure: 1) locus, or factors internal or
external to the individual, 2) stability (i.e., temporary versus long
term) of factors, and 3) controllability of factors. These proposed
dimensions of causality were derived by Weiner from a logical
examination of perceived causes. Each of the three factors may
combine to yield a type of performance attribution. For example, an
internal, generally unstable, but controllable factor would be effort,
while an uncontrollable and unstable cause, external to the
individual, might be construed as luck.
Additional related research (Hedl, 1988) investigated the
attributions of allied health faculty to hypothetical student
achievement data. Faculty in the study rated linear and nonlinear,
ascending or descending grade profiles along ten causal dimensions:
ability, anxiety, curriculum, test difficulty, study for tests, study
habits, teacher factors, personal factors, student interest, and luck.
Hedl based his selection of attribution types on the three
dimensions (locus, stability, and controllability) proposed by Weiner.
However, he also extends his analysis to include additional causes
suggested salient by other research (Cooper & Burger, 1980; Weiner,
1985).

23
Among other findings, Hedl (1988, p. 153) concluded that
• ... student ability and effort attributions were prominent for
ascending and uniformly high performance while external factors ·were
more prevalent for descending and uniformly low performance."
Furthermore, " ... high stable performance was attributed to student
ability and effort while low performance was not only attributed to
ability, but also to the external factors of curriculum and test
difficulty" (Hedl, 1988, p. 161). In addition, • ..• the fact that luck
was not used by allied health faculty is consistent with the prior
literature and suggests that academic outcomes are rarely viewed as
being defined by random processes." In addition to providing
information regarding the attributions of success or failure in
student achievement, Hedl highlights the interaction of these
attributions with characteristics of the rater (faculty). He
concludes that allied health faculty may use "nontraditional"
attributions (motivation, student interest) and that causal
attributions in achievement settings may be more diverse than
originally hypothesized.
The pre·sent research provides information which may help
employers or certification/licensure boards to enhance selection
validity by considering other variables in addition to ability, as
presumably revealed by test scores. Regarding supervisor
attributions, while the present research is not directly related to
test validity, the information provided may suggest additional
variables for employers or credentialing boards to consider. In
addition, the research provides information regarding the utility of
the supervisor criterion variable itself. For example, the question
is raised as to whether supervisor ratings of performance, which are
used to assess predictive validity of ability, are distorted by
supervisors' perceptions of other factors, such as effort.
24
Test Reliability
Reliability may be defined as the degree to which test scores
are consistent, dependable, or repeatable. In that sense, the
reliability of a test is the degree to which that test is free of
random measurement error (American Educational Research Association,
American Psychological Association, and National Council for
Measurement in Education, 1985). Given this definition, it is clear
that for a test to be valid, it must first be reliable. For example,
if a test does not yield scores that are consistent or repeatable, the
test does not reliably measure an attribute. It is unlikely that such
a test would be capable of reflecting a valid dimension. In such a
context, an obtained score on a given measure could be a function of
the true attribute under assessment, but may or may not be a function
of random error (unreliability) as well.
While a test must first be reliable to be valid, the converse is
not true; a test does not have to be valid to be reliable. For
example, consider an employment selection instrument that
characteristically indicates that individuals have a greater amount of
ability than they actually possess. In selection decisions, this
could result in the consistent selection of underqualified employees.
The test is reliable in that it characteristically indicates that
examinees have more ability than they actually possess. While a
correlational analysis of such scores may not reveal low validity, a
certain minimal ability requirement may not be met by examinees. If a
test results in unsatisfactory employee selection, the problem may be
because of measurement error (unreliability) or because of poor test
validity, or because of both reasons. However, the selection
instrument must first be consistent in the way it measures applicant
ability. Clearly, the demonstration of both reliability and validity
is necessary for adequate test utilization.
s~ry
Overall, the judgment of "acceptable" validity is subjective to
some extent. The test validator should begin by making some a priori
predictions regarding the outcome of validation measures. A
comparison of predictions and outcomes can be judgmental since rigid
criteria for acceptable validity coefficients may not exist. While
higher coefficients are desirable, validity can be demonstrated by
obtaining patterns of results that array in predicted directions.
25
With respect to content validity, a majority of subject matter
experts should agree on primary content classifications of examination
items (an 80% agreement criterion was established for the present
research). In addition, the proportion of questions in certification
examination sub-tests should correspond with the amount of time that
practitioners typically spend in these areas. Statistically
significant relationships (p<.05) are desirable for this measure.
With respect to criterion-related validity, moderate, positive
correlations between overall supervisor ratings and total test scores
are predicted. The same result is desirable for ratings and sub-test
scores in particular work areas as well. However, as the total test
scores may take on more of a range than sub-test scores, higher
correlations between "overalln measures may be expected. To enhance
the validity of criterion measures, it is also desirable to
demonstrate relationships between pre and post-examination supervisor
ratings. In addition, it is predicted that for a valid test, passing
examinees should score higher than failing examinees on laboratory
content-related criterion measures, but not necessarily for measures
unrelated to laboratory content (for example, attendance at work).
However, the magnitude of the expected differences is difficult to
specify.
Construct validation should include measures of both convergent
and discriminant validities. Higher positive correlations are

26
expected between related criterion measures and test scores than
between non-related measures and scores. While the exact magnitude of
the coefficients is not predicted, moderate, positive correlations
(+.30 to +.40) are desirable. With regard to a factor analytic study,
it is expected that some subject matter factors will emerge in
addition to factors that may be related to depth of knowledge required
to answer test items (for example, recall versus interpretation).
As the attribution measures addressed here are primarily
exploratory, a number of straightforward predictions are not offered.
However, it is desirable to show that supervisors' ratings are based
primarily on judgments of effort and ability rather than the effects
of luck or worker's mood.
CHAPTER III
METHOD
Overview
A number of content, criterion-related, and construct validation
methodologies were employed to assess the validity of medical
laboratory technician and medical technologist examinations
administered by American Medical Technologists. While assessing the
validity of the MLT examination was of primary importance, a number of
parallel measures for the MT test were obtained to supplement the
validation information.
Specifically, for the MLT examination, validation measures
included: 1) a general work-area and specific task analysis
(content), 2) expert classifications of examination items into content
areas (content), 3) pre-examination supervisor performance ratings
(criterion-related), 4) post-examination supervisor performance
ratings (criterion-related), 5) an analysis of pre-examination
laboratory-related and non-laboratory-related scholastic transcript
data (criterion-related and construct), and 6) a factor analysis of
examinee performance on a sample of test items (construct). For the
MT examination, parallel measures were obtained for: 1) the general
work-area analysis (content), 2) the pre-examination supervisor
performance ratings (criterion-related), and 3) the post-examination
supervisor performance ratings (criterion-related).
In addition to validation measures, several attribution of
performance measures were obtained for both MLT and MT groups.
Specifically, both test-taking groups were asked how a number of
factors were perceived to influence their test performance. In
addition, on-the-job supervisors were asked how a number of similar
factors were perceived to influence a laboratorian's
27

28
(post-examination) practical performance. A detailed description of
each of the validation and attribution measures utilized is presented
below.
content-Related Validation Procedures
Pilot Survey
The present content validation research was conducted via mail
survey methodology. Before the primary survey was administered, a
pilot study was conducted. This served to refine the mechanics of the
survey itself, but more importantly, to guide the preparation of a
representative and thorough task inventory.
Delineation of Competencies. Although the present study
addresses MT and MLT practitioners, a single task inventory was
utilized for assessing the activities performed by both groups. The
development of the l~boratory practitioner task inventory took place
through a multi-stage process. Overall, the AMT Education,
Qualifications, and Standards Committee (hereafter referred to as the
EQS Committee) was responsible for generating content areas
represented by the task list (the EQS Committee is composed of highly
experienced and expert laboratory practitioners, representing a
variety of practical work and academic settings).
Development of the inventory began with the Chairman of the
Standards Committee who constructed a comprehensive outline of task
and knowledge areas required of laboratory practitioners. The outline
was then circulated to the EQS Committee who rated each entry in terms
of: 1) the amount of time spent on the task, 2) the importance of the
task, and 3) the level of the task (that is, entry-level versus
advanced level). After revision, this comprehensive outline was
retained as a master classification of requisite task and knowledge
areas for medical laboratory practice.
A second-order document was generated from the master outline,
and comprised the preliminary task inventory. Each of the entries in
29
the master outline was reflected by an entry in the task inventory.
Toward this end, entries from the master were amended: redundant or
trivial items were eliminated, some items were combined to yield
superordinate areas, and some new items were added. This intermediate
task inventory consisted of 152 entries and was the subject of the
pilot questionnaire. The inventory was the tool by which the validity
of the master outline would be assessed.
Pilot Survey Instrument. The pilot survey instrument consisted
of several main parts, including a cover letter explaining the purpose
of the study. The questionnaire was composed of the task list,
followed by a list of knowledge areas, several demographic items, and
a list of general work areas (see Appendix A for a copy of a final
questionnaire form which is similar to one of the pilot forms).
Overall, respondents were asked to rate each task along three
dimensions: time spent, importance, and requirement for
certification. "Time spent" is synonymous with the "frequency"
criterion outlined by NCHCA, and addresses the amount of time
typically spent performing a task. The "importance" scale reflects
the "criticality" criterion, or relative weight to be placed on a
task. "Requirement for certification" reflects the level of behavior,
such that respondents were to indicate whether or not task competency
should be required for entry-level certification. The time spent and
importance dimensions were represented by four-point (1-4) scales,
while the "requirement" dimension was considered categorical. For the
latter judgment, respondents were to indicate whether they perceived
competency in a specific task as essential or not essential for entry
level certification (or whether they were unsure). After rating all
tasks, respondents were asked to add any tasks that they thought were
important, but were absent from the list.
30
In addition to the individual tasks, twelve knowledge areas were
identified. Respondents were asked to indicate how necessary
knowledge of each area is for competent laboratory performance ..
The knowledge section was followed by two demographic questions.
The first item asked respondents how many years they worked as a
laboratory practitioner, and the second item asked respondents to
indicate their place of employment.
The final section of the questionnaire outlined twelve general
work areas which were superordinate representations of the task
inventory. Respondents were asked to rate these entries in terms of
the percentage of time they spent on each area, and the importance of
each area.
Because of the length of the main task inventory and the number
of judgments required for each task, a matrix-sampling methodology was
utilized to present respondents with only a portion of the complete
inventory. This strategy has been used in a similar study regarding
tasks performed by Registered Medical Assistants (Fidler, 1988). For
both MT and MLT surveys, respectively, four questionnaire forms were
developed. Half of the respondents received even-numbered entries
from the main task inventory, and half received odd-numbered entries.
Within these two groups, half of the respondents were asked to rate
entries from their respective lists in terms of time spent and
necessity, and the remaining respondents were to rate tasks in terms
of importance and necessity. Each of the four forms were constructed
for both MT and MLT populations. While only several individual tasks
were common to MT and MLT forms, the knowledge area, demographic, and
general work area sections were common to both forms in their
entirety.
For the purposes of the pilot survey, only one of each MT and
MLT forms were distributed because of the overall similarity of the
questionnaires. In addition, the pilot survey included alternate

31
extended forms which asked respondents to rate entries by applying all
three dimensions (time, importance, and necessity) to the task list.
Sampling and Respondents. Sixty respondents (30 MT and 30 MLT)
from across the nation were selected via a systematic random sampling
of the membership file. Only respondents who held •active" membership
status were selected.
Procedure. Respondents received an envelope containing a
questionnaire and a postage-paid return envelope. Half of each MT and
MLT group, respectively, received a questionnaire form requiring two
judgments for each task, and the remaining half received a form
requiring three judgments for each task.
The first page of the questionnaire consisted of a cover letter
explaining the purpose of the study, and assuring the confidentiality
of responses. Participants were instructed to return the
questionnaire by a specified date (approximately 16 days from the
initial mailing date).
Results. Overall, approximately 23% of those sampled responded
to the survey. In addition, an equal proportion of MTs and MLTs
responded (23% of each group, respectively). The long and short forms
of the questionnaire yielded comparable rates of response. The
shorter form was adopted for use in the primary survey.
The rate of response to the pilot study was marginally lower
than that obtained in a similar study conducted for Registered Medical
Assistants (Fidler, 1988). This result is partially attributable to
the fact that these studies were conducted at different times of the
year.
A major purpose of the pilot study was to determine the
inclusiveness and representativeness of the task inventory for both MT
and MLT designations. The results suggested that no major task
additions were required on the basis of pilot responses.

32
The preliminary study was also utilized to assess any potential
difficulties with the mechanics (instructions, rating scales, wording,
etc.) of the questionnaire. The data from the preliminary mailing
suggested that the format of the questionnaire was acceptable, and
that no changes in the presentation or mechanics were necessary.
Primary Survey
Survey Instrument. The questionnaire followed a format similar
to that utilized for the pilot survey (see Appendix A for a copy of
one form of the primary survey instrument). A matrix-sampling design
was used to implement the survey such that one-half of the respondents
received even-numbered tasks from the complete inventory, and one-half
of the respondents received odd-numbered tasks. In addition,
approximately 20% of the task entries, general task areas, and
knowledge areas were shared by both forms.
Sampling and Respondents. Systematic random samples of 500 MTs
and 500 MLTs were obtained from the current membership listing.
Eligible respondents must: 1) have been an active member in good
standing, and 2) not have participated in the pilot study.
Procedure. The procedure for implementing the primary survey
followed that used for the pilot survey. Respondents received copies
of the questionnaire with a postage-paid envelope. In addition,
approximately two weeks after the initial mailing, a reminder letter
requesting responses was mailed to the participant sample.
Item Content Classification
Toward validating the content classification of actual test
items, seven subject-matter experts were asked to categorize 210 test
items (which comprised a full MLT certification examination) by area
of laboratory practice. Specifically, members of the AMT Board of
Directors and AMT Education, Qualification, and Standards Committee
were asked to assign each of 210 test items into one of the following
areas: chemistry, hematology, immunohematology/immunology,
microbiology, urinalysis, or "other." These areas (except for
•other") represent the current content areas used in specifying
certification examination parameters.
33
Overall, judges' classifications were compared to current item
pool classifications for each item. While some items were potentially
classifiable into more than one category, judges were instructed to
assign all items to one "best• area.
Criterion-Related Validation Procedures
Supervisor Performance Ratings
Two sources of criterion-related validity information were
derived from supervisor performance ratings: one source was obtained
prior to examination and one source was obtained after examination.
Both measures were obtained for MLT and MT examinees.
Pre-Examination Performance Ratings. In addition to the
requirement of successfully passing a certification examination to
become an MLT or MT with American Medical Technologists, certificants
are required to meet several other criteria. One criterion states
that individuals must provide evidence of "approved" laboratory
experience p~ior to the award of certification. As part of the
approval process, an applicant's supervisor must complete and return a
performance rating form to AMT. Such verification must be part of an
applicant's file before an examinee's grades are released.
Data regarding pre-examination laboratory performance were
collected from archival application files for both MLT and MT groups.
A sample pre-examination rating form is presented in Appendix B. As
indicated, supervisors were asked to rate applicants in 12 areas. For
each area, an applicant was rated as being either excellent, good,
fair, or poor. In addition, supervisors were asked the general
question, "Do you feel the applicant is qualified for registration?"
Post-Examination Performance Ratings. Approximately three
months after test administration, a similar supervisor rating
34
questionnaire was mailed to each examinee's current employer. The
first step in obtaining post-examination ratings was to determine
where individuals were currently employed. A large proportion of MT
examinees provided employment history on their applications. If an MT
examinee started working at a given place of employment within 10
months prior to data collection, supervisor rating forms were mailed
directly to an applicant's workplace. If an MT did not provide
•current place of employment" information that was less than 10 months
old, examinees were sent a form asking them to provide this
information to American Medical Technologists. In addition,
applicants were asked to indicate if they were not currently employed
in a laboratory setting. A copy of the employment tracking form is
included in Appendix C.
Similarly, MLT applications were reviewed for work history
information. However, as most MLTs are of entry-level status in the
profession, only several applicants had usable work history
information. Therefore, all MLT examinees were sent an employment
tracking form. Approximately two weeks after these forms were sent
out, a follow-up letter and additional form were mailed to
nonrespondents. After as many responses as possible were obtained,
supervisor rating forms were mailed to the place of employment
indicated by each applicant.
The supervisor rating form consisted of three main sections (a
copy of the form may be found in Appendix D). The first section asked
supervisors to rate the applicant's performance in a number of work
areas. This part of the instrument was identical to the form used for
pre-examination ratings, except that the former used a five-point
rating scale (excellent, very good, average, fair, or poor), while the
latter used a four-point scale (excellent, good, fair, or poor). In
addition, the post-examination form included descriptions of each
level of performance while the pre-examination form did not.
35
The second section of the form asked supervisors to rate each
individual on six non-work area aspects. These ratings, related to
more global characteristics of performance included the following
areas: 1) quality of work, 2) job knowledge, 3) time utilization,
attendance, and reliability, 4) policy compliance, 5) professional
judgment and decision making, and 6) quantity of work. In addition,
supervisors were asked to rate the practitioner in terms of the "best"
and "worst" technicians that they have encountered.
The third main section of the form queried raters regarding
their perceived causes of technician's performance level. For
example, questions such as "How important is supervisor influence in
affecting the technician's performance?" were included. This section
of the form will be discussed in more detail in the "attribution
variables" section below.
Following the three main questionnaire sections, supervisors
were asked to describe any other factors that they felt influenced a
technician's performance. Raters were also asked to coDll!lent on any
general aspects of practitioner's performance. All supervisors were
asked to sign and date their forms, provide their certification
affiliation (if applicable) and provide their job title.
Attached to each rating form was a cover letter describing the
procedure for returning the form. If the to-be-rated technician was
no longer employed at the rater's facility, the respondent was asked
to check the appropriate box on the cover letter, and provide the
address of the technician's current place of employment (if known).
In addition, respondents were told that two identical rating forms
were enclosed in the envelope they received, along with two self
addressed, postage-paid envelopes. Respondents were instructed to
pass the second rating form along to another supervisor who was
familiar with the technician's work. Raters were asked to return the
completed form to AMT within 10 days, if possible. Approximately two
36
weeks after the initial mailing, a follow-up letter requesting return
of the forms was sent to respondents.
While the majority of examinees took the MT or MLT test on the
same date, some examinees took a test after the primary administration
date. The mailing of rating forms was staggered such that ratings
would be made three months after respective test administration dates,
or as soon as an examinee's current place of employment could be
located (after three months).
Construct-Related Validation Procedures
Overall, three primary strategies were utilized to assess the
construct validity of the MLT examination. The first strategy
consisted of obtaining correlations between each of five sub-test
scores, and the total test score (minus the respective sub-score).
Similarly, sub-test intercorrelations were computed and examined for
associations between distinct content areas.
The second primary construct validation technique consisted of a
factor analysis of responses to items on the MLT examination.
Specifically, two random samples of four items from each sub-test were
selected (with replacement). Each of the two twenty-item samples was
then factor-analyzed independently. Only samples of items (rather
than all items) were considered for the factor analysis. This
strategy was adopted because of the number of items comprising the
test (210) and the relatively few number of examinees taking the test
(114).
The third source of construct validation information was
obtained from data that was also used for criterion-related
validation. Specifically, total battery scores were correlated with
grade point average (GPA) in laboratory-related course work and non
labora tory-rela ted course work, respectively. Through this strategy,
convergent and discriminant validities were assessed.
Measures of Attributions Regarding Success or Failure on
Examination Performance and Practical Performance
37
Attributions of success or failure were considered from two
perspectives: 1) attributions examinees made regarding their own test
performance, and 2) attributions supervisors made regarding the
practical performance of examinees. As discussed above, Weiner (1980)
presents a three-factor scheme for classifying attributions of success
and failure: 1) locus of factors internal or external to the
individual, 2) stability of factors, and 3) controllability of
factors. These factors combine (in a 2 x 2 x 2 matrix) to yield eight
types of attributions, and include the following: 1) mood, 2) typical
effort, 3) innnediate effort, 4) task difficulty, 5) luck, 6) ability,
7) influence of superiors, and 8) unusual help from others. For
example, "luck" would be considered an uncontrollable, unstable
factor, external to the individual. Each of the factors was
considered for both the examinee attribution questionnaire and the
practical performance attribution questionnaire.
Included in each examinee's test packet was a copy of the
examinee attribution questionnaire (see Appendix E). Innnediately
following the certification examination administration, examinees were
asked to complete the questionnaire, rating how important each of the
following were in affecting their test performance: mood, typical
effort, task difficulty, luck, iilllllediate effort, ability, teacher
influence, and unusual help from others. These factors represented an
application of each of Weiner's eight attribution types to the
examination situation.
Also included in the questionnaire was an item asking examinees
to estimate how well they thought they performed on the test. Each
examinee was asked to indicate (on a 0-7 scale) the likelihood of
their passing the test. The questionnaire concluded by asking

examinees to describe any other factors that they thought affected
their test performance.
38
Regarding supervisor's attributions of individual's practical
performance, a parallel questionnaire was constructed and was part of
the supervisor rating instrument (see Appendix D). When performance
ratings were obtained (three months after examination) supervisors
were asked to make attributions regarding the practical performance of
the examinee. However, while the examinee attribution questionnaire
reflected all eight of the aspects defined by Weiner, the practical
performance attribution questionnaire reflected only seven of those
aspects. Specifically, in the course of operationalizing the
"inunediate effort" and "typical effort" variables, it was found that
given the supervisor's perspective and the purpose of the
questionnaire, these two aspects became indistinguishable. For this
reason, the "typical effort" dimension was included in the
questionnaire and the "inunediate effort" dimension was omitted.
Therefore, the practical performance attribution questionnaire
consisted of the following seven dimensions: mood, typical effort,
task difficul.ty, luck, ability, supervisor influence, and unusual help
from others. As with the examinee questionnaire, this form asked
supervisors if they felt any other factors influenced the
practitioner's performance.
Test Reliability Measures and Item Statistics
Several measures of reliability were obtained for the MLT
certification examination. As a primary measure, KR-20 reliability
statistics were obtained for the total test (baseline examination
group only). Furthermore, the standard error of the test was
computed, and revealed the extent to which scores would vary if the
test were repeated. The standard deviation of the total battery raw
scores was also computed.

39
In addition, for each of the 210 items comprising the test,
measures of item difficulty and item discrimination were computed.
specifically, item difficulty was represented by two statistics:. 1)
percentage of examinees answering an item correctly, and 2) ETS Delta.
An index of discrimination was represented by point-biserial
correlations between each item, and the total test battery raw score.

CHAPTER IV
RESULTS
overview of Obtained Measures
A number of independent measures were utilized to address the
validity of the medical laboratory technician (MLT) certification
examination. All measures discussed in the present research are
oriented toward assessing the validity of the MLT examination. The
focus on medical laboratory technicians reflects the criticality of
entry-level competence. While the role of the more advanced medical
technologist is also important, the mastery of basic laboratory skills
and techniques is essential in the career of any practitioner. In
addition, selected parallel measures were obtained for the medical
technologist (MT) examination. Before describing the parallel MT
measures, a brief review of the MLT measures is presented.
Medical Laboratory Technician Examination Validation
Content validity was addressed by conducting a task analysis of
MLTs and relating the outcome of the analysis to present certification
examination content categories. In addition, laboratory technology
subject-matter experts were asked to place a sample of unclassified
examination items into respective content categories. The experts'
classifications were then compared to the categories containing items
on the examination. Criterion-related validity information included
student transcript data, pre-certification supervisor performance
ratings, and post-certification supervisor performance ratings.
Construct validity information included correlations of subscores with
total scores, and a factor analysis of a sample of examination items.
Test reliability was assessed via KR-20 statistics and standard
error of measurement statistics. In addition, aspects of examination
performance and work-performance attributions of success/failure were
addressed. Examinees received a questionnaire regarding attributions
40

of their examination performance, and supervisors received a
questionnaire regarding attributions of examinees' practical
performance.
Medical Technologist Examination Validation: Parallel Measures
41
A number of similar measures were obtained for the MT group as
well. General content category validity for the MT examination was
assessed. This helped to clarify the differential roles of MT and MLT
practitioners. Although the general content areas were compared,
individual tasks were not compared for these two groups. Because of
the large number of tasks addressed, meaningful comparisons for each
task across groups were not feasible. Content validation for the MT
examination was therefore limited to the more general content category
level.
Regarding criterion-related validity information, post·
certification supervisor ratings were obtained for the MT group. This
data source was considered salient since criterion-related studies in
the certification context are not prevalent. The focus of this aspect
of the research was also intended to address the feasibility,
practicality, and utility of considering supervisor ratings in the
certification examination context.
Where available, pre-certification supervisor ratings were also
utilized to assess the criterion-related validity of the MT
examination. However, course transcripts were not considered for the
MT group.
Regarding construct validity, it is likely that factors
contributing to test performance should be comparable for alternate
practitioner classifications. For this reason, a factor analysis was
not conducted for the MT examination.
In contrast, because of the theoretical and exploratory nature
of the attributional variables, both MT and MLT groups were asked to
respond to these measures. While no differences between these groups
were predicted in terms of attribution, it was hoped that the use of
two distinct data sources could serve to replicate any significant
effects.
Results of Content-Related Measures
MT and MLT Task Analyses
42
Results from the task analysis for both MLTs and MTs regarding
general content categories were compared to weights utilized for
current examination specifications. Number of items per category
based on the task analysis was compared to current specifications via
a chi-square goodness-of-fit test. For the analysis to reflect test
content validity, category weights (in terms of number of items per
category} for the certification examination must be consonant with the
weights placed on these respective areas in practice. A non
significant chi-square value would be consistent with test validity.
Respondents. Overall, approximately 34% of the MLTs and 40% of
the MTs sampled returned a questionnaire (500 individuals from each
group were sampled from the population}. Because of the amount of
information required, tasks and rating scales were distributed across
four questionnaire forms for each respondent group. The forms were
constructed such that approximately 20% of the task, knowledge, and
work areas were cpmmon to two or more forms. The proportions of
individuals responding to a given questionnaire form are described in
Table 1. As indicated, comparable numbers of each form were returned
within groups. Overall, the MT group returned a marginally greater
number of questionnaires than the MLT group.
Demographic Questions. Responses to two demographic items are
presented in Table 2. As indicated by the responses to Question 1
(How many years have you worked as a laboratory practitioner?}
respondents represented a wide range of experience levels for both MT
and MLT groups. Segments of the MT group were very experienced, with
44% working as laboratory practitioners for greater than 19 years.

TABLE 1
Task Analysis Mail Survey Responses
Number of questionnaires mailed
Number of questionnaires/reminders
returned because of incorrect addresses
Form 1 responses
Form 2 responses
Form 3 responses
Form 4 responses
Total number of responses
Response percentage
MLT
500
8
39
49
38
...il 165
Group
33.5%
_lIT_
500
1
46
54
49
2Q.
199
39.9%
43

TABLE 2
MLT and MT Responses to Demographic Questions
question 1: How many years have you worked as a laboratory
practitioner?
Grou12 Res12onse
MLT _fil_
11.6 .5 Less than 3 years
37.5 12.6 4-8 years
25.1 27.5 9-13 years
15.5 15.4 14-18 years
10.3 44.0 19 years or more
Question 2: Which of the following best describes your place of
employment?
Grou12 Res12onse
MLT _fil_
46.2
25.2
1.4
9.5
17.6
68.0
10.5
5.2
6.4
9.9
Hospital
Physician's office(s)
Reference laboratory
Independent clinical laboratory
Other
44
Note: Several MLT and MT respondents reported working in two
settings. These responses were omitted from the above
tabulations.

45
In response to Question 2 (Which of the following best describes
your place of employment?) the majority of both MT and MLT respondents
indicated working in either a hospital or physician's office. A
greater percentage of MTs compared to MLTs reported working in a
hospital. In contrast, a greater percentage of MLTs compared to MTs
reported working in a physician's office. Based on Tables 1 and 2,
any direct comparisons of tasks between MTs and MLTs without
controlling for years of experience and work setting would be so
confounded as to be uninterpretable.
Tasks. Mean MLT group ratings for the requirement, time spent,
and importance scales are presented in Appendix F. Regarding the
requirement scale (which was considered categorical) respondents were
asked: • ... do you feel that competency in this task should be
essential for ... certification?" Respondents were to indicate whether
they felt each task was essential, not essential, or were unsure
regarding the task's essentiality. The percentages of individuals
replying in each of the above three categories are presented in the
first three columns of Appendix F. Of the 140 specific tasks
presented, knowledge of 134 tasks was perceived as essential for
certification by the majority of MLT respondents. Less than half of
the respondents perceived the following tasks to be essential: 1)
prepare and examine stool for fats, 2) perform identification and
staining of cryptosporidium species, 3) perform comprehensive
mycological examination, 4) collect blood for blood gases, 5) perform
test for radial i.mmunodiffusion, and 6) perform •special" (urinalysis)
tests.
Mean MLT group ratings for the time spent and importance scales
are presented in columns 4 and 5 of Appendix F, respectively. Scales
for these variables were constructed such that "4" represented most
time spent, or most important.

Mean ratings for the time spent and importance scales may be
interpreted in both absolute and relative terms. For example,
consider the task: "Perform test for occult blood in stool." This
task was rated overall as 3.20 on a 1-4 scale. For an absolute
interpretation, one can refer to the original wording of the scale
which states that a "3" is to be assigned if the task is considered
"important.•
46
In a relative sense, the overall mean rating of a task can be
compared to that of other tasks. For example, more importance is
placed on "Performing test for occult blood in stool" than on
"Preparing and examining stool for fats• (the latter of which received
a mean rating of 1.90). Similar absolute and relative interpretations
can be placed on the importance scale as well.
Overall, the magnitude of the time spent and importance ratings
for each task provide input regarding the appropriateness of testing
knowledge related to a task. Ratings of specific tasks are primarily
used to validate the competency outline from which test questions are
developed. In other words, the individual task ratings indicate
whether or not the competency outline (on which examinations are
based) is reflective of the work performed in practice. However, the
general •work area• ratings (discussed below) are more directly
related to examination content by describing the proportion of test
items appropriate for each major work area. The ratings obtained from
the task analyses, in conjunction with the expert judgments rendered
by the Education, Qualifications and Standards Committee determine the
approximate number of test items referencing a particular task or task
area.
As a primary purpose of the present research was to investigate
the utility of methods employed as test validation tools, the
appropriateness of the scales was also considered. For the content
aspect of the validation procedure, "time" and "importance• scales

47
were correlated across all of the 140 tasks. The relationship between
these two variables was significant (£(138) • .783, _2<.01). This
result may have implications regarding the utility of using both
scales in validation research, especially if respondents are required
to rate a lengthy list of tasks.
In the free-response section of the questionnaire, several
laboratory practitioners stated that they also performed tasks related
to histology, computer usage, and laboratory management (MTs). In
addition, many of the MT and MLT respondents indicated that they
specialized in one primary area of laboratory practice (for example,
chemistry exclusively).
Knowledge Areas. In addition to the 140 job-oriented tasks
discussed above, respondents were asked to rate the importance of 12
related knowledge areas. Mean ratings for both MT and MLT groups are
presented in Table 3. As indicated, the MLT group rated virtually all
of the knowledge areas as "important." The MT group considered most
knowledge areas important, with the exception of the hemopoiesis, and
principles of immunological examination areas (these areas had mean
ratings of less than 2.0 on a 4-point scale). A relative
interpretation of the ratings presented in Table 3 can be applied in a
manner similar to that utilized for the individual task ratings
discussed above. A possible interpretation of the higher overall
ratings made by the MLT group includes the fact that at the entry
level, all new concepts may be perceived as important to know (and are
more "fresh" in the practitioner's mind). As practitioners accumulate
more experience, it may become more clear as to which types of
knowledge are essential in laboratory practice. For example,
fundamental principles may become more routine, thus lowering their
perceived importance.
General Work Areas. Individuals were also asked to rate several
general work areas regarding time spent and importance. Table 4

48
TABLE 3
Knowledge Area Importance Ratings for MLT and MT Respondents
Group Importance
Rating*
3.31
3.34
2.92
2.99
3.26
3.33
3.19
3.21
3.29
3.34
3.50
3.60
3.64
3.42
2.66
3.08
2.36
1.86
1.41
2.88
3.38
3.80
3.23
2.89
Knowledge Area
Liver function
Electrolytes and acid-base balance
Kidney anatomy
Urine formation
Physical and chemical properties of urine
Hemopoiesis (i.e., blood functions, etc.)
Principles of inmunological examination
Principles of hemostasis
Innnunohematological concepts
Antigens
Blood components and their administration
All blood bank operations
* Rating scale of 1-4, 4 representing most important.

49
TABLE 4
General Work Area, Time Spent and Importance
Ratings for MLT and MT Respondents
Work Area Percent of Time Im12ortance
MLT MT MLT ..11L
Chemistry 27.29 29.88 3. 71 3.64
Hematology 22.97 22.08 3.74 3.80
Urinalysis 13. 77 10.23 3.37 3.38
Blood Banking 9.50 8.78 3.23 3.42
Microbiology 9.28 11.41 3.11 3.08
Immunology-Serology 4.81 5.28 2.92 2.88
Laboratory Safety 4. 72 2.74 3.21 3.23
Immunohematology 2.32 3.44 2.57 2.66
Hemostasis 2.11 3.41 2.53 2.89
Parasitology 1. 70 1. 75 2.30 2.36
Mycology .58 .83 1.85 1.86
Virology .37 .17 1. 76 1.41
so
presents mean ratings for these variables, for both MT and MLT groups.
As indicated, ratings on time spent and importance scales were very
similar for both laboratory practitioner classifications. This ·result
suggests certification examination content categories may be similar
for MT and MLT designations. However, regardless of the content
similarity of MT and MLT examinations, such tests should be
differentiated on the basis of minimal performance criteria. This
differentiation takes place in the assignment of item and test minimum
passing levels, and requires criterion-related validation procedures
to assess its utility.
The time spent ratings for the major work areas were used to
construct a "hypothetical" 210-item test. This was done to enable a
comparison of current test specifications with specifications that
would be derived from survey data alone. While a test developer may
not rely exclusively on practitioner data for determining test
specifications, results from practitioner responses should be in line
with the test blueprint that is actually used.
The "hypothetical" test was constructed by multiplying the
percentage of time spent in each area by 210 (the number of items on
an examination). It was predicted that correspondence between the
actual and hypothetical tests would be demonstrated by a non-
signif icant chi-square goodness-of-fit test. As laboratory safety
questions are not mutually exclusive, this section did not fit into
the analysis. However, the validity of having safety questions on the
examination seems apparent.
Current test specifications are compared to the hypothetical,
survey-based specifications, in Tables 5, 6, and 7. Chi-square
goodness-of-fit analyses were performed on the specific content areas
outlined in Tables 5 and 6. Although two cells in Table 5 contained
expected frequencies equal to zero, these cells were omitted in the
calculation of the total chi-square value to prevent division by zero.
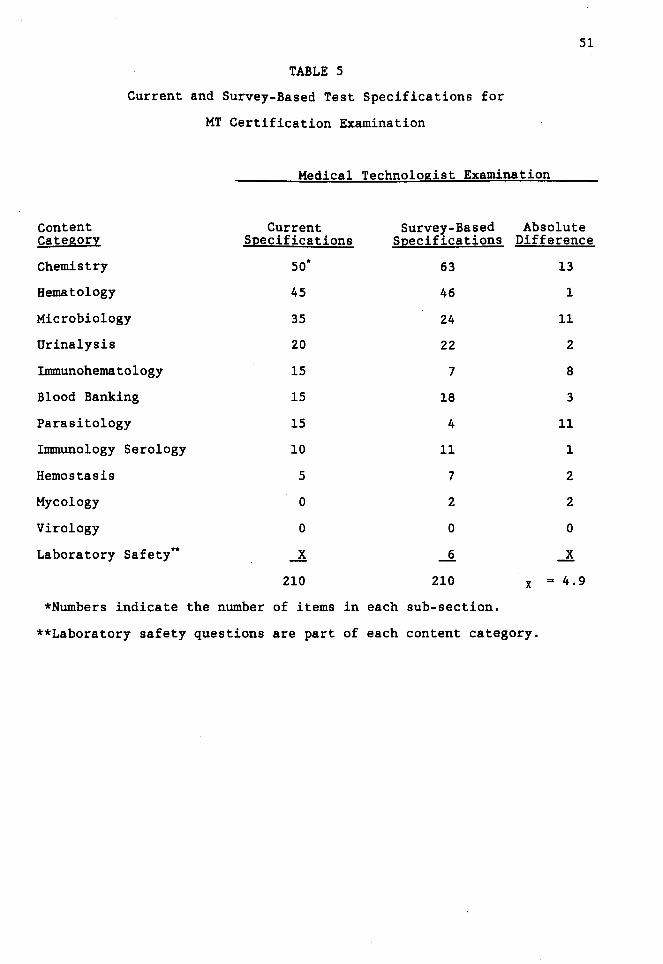
TABLE 5
Current and Survey-Based Test Specifications for
MT Certification Examination
51
Medical Technologist Examination
Content Current Survey-Based Absolute Category Specifications Specifications Difference
Chemistry so* 63 13
Hematology 45 46 1
Microbiology 35 24 11
Urinalysis 20 22 2
Immunohematology 15 7 8
Blood Banking 15 18 3
Parasitology 15 4 11
Immunology Serology 10 11 1
Hemostasis 5 7 2
Mycology 0 2 2
Virology 0 0 0
Laboratory Safety** _! __§_ _!
210 210 x ... 4.9
*Numbers indicate the number of items in each sub-section.
**Laboratory safety questions are part of each content category.

TABLE 6
Current and Survey-Based Test Specifications for
MLT Certification Examination
Medical Laboratory Technician Examination
Content Current Survey-Based Category S12ecifica tions S12ecifications
Hematology 54* 48
Chemistry 50 57
Urinalysis 40 29
Microbiology 21 20
I.mmunohematology 11 5
Blood Banking 11 20
Parasitology 9 4
Immunology Serology 8 10
Hemostasis 6 5
Mycology 0 1
Virology 0 1
Laboratory Safety* _! 10
210 210
*Numbers indicate the number of items in each sub-section.
52
Absolute Difference
6
7
11
1
6
9
5
2
1
1
1
.Jl
-x- 4.5
**Laboratory safety questions are part of each content category.

S3
TABLE 7
Number of Items in Current and Survey-Based Sub-Section
Examination Specifications
MLT Examination
current Specifications
Chemistry Hematology Inununohematology
so 60 30
Survey-Based Specifications
Microbiology
30
Chemistry Hematology Inununohematology Microbiology
S7 S3 3S 24
MT Examination
Current Specifications
Chemistry
so*
Hematology
so
Inununohematology Microbiology
40 so
Survey-Based Specifications
Chemistry Hematology Inununohematology
63 S3 36
Microbiology
28
Urinalysis Total
40 210
Urinalysis Total
29 198*"
Urinalysis Total
20 210
Urinalysis Total
22 202*"
*Numbers indicate the number of items in each sub-section.
**There are less than 210 items for the survey-based specifications
because of the exclusion of laboratory safety questions here.

54
In addition, cells in both Tables 5 and 6 having fractional expected
frequencies were not adjusted in any way (Bradley, Bradley, McGrath, &
cutcomb, 1979) ., Results from these analyses (using two-tailed tests)
failed to yield significance for both the MT C!2(9) - 15.47, .!l.:.!..:..) and
MLT (!2(10) - 11.43, .!l.:.!..:..) examinations.
Furthermore, specific content areas were combined to reflect the
five sub-sections that comprise the MT and MLT tests (see Table 7).
Again, chi-square goodness-of-fit tests were used to assess the
correspondence between actual test specifications and hypothetical
specifications based on survey response data. The chi-square was
significant for neither the MT table (!2(4) ~ 7.85, .!l.:.!..:..), nor MLT
table <!2(4) • 3.36, .!l.:.!..:..>·
For MT and MLT groups, both chi-square analyses suggest
acceptable correspondence between the proportions of items contained
in the examinations, and the amount of work performed in specific work
areas, in practice. Although the MLT data yielded a "better" fit than
the MT data, the fit for both groups was satisfactory.
Judges' Content Classification of Test Items
Test content validity would be reflected by agreement between
expert item classifications and current examination item
specifications. Overall, it was desirable to have at least 80% of the
judges agree upon any given item classification. In addition, the
statistic kappa <!> was used to test the significance of inter-rater
agreement in assigning test items into content categories (Fleiss,
1971).
Seven judges were available for classifying unidentified
examination items into content categories. The percentage of judges
agreeing with each of the current item pool classifications for each
respective sub-category is presented in Table 8. A high degree of
agreement between classifications and judgments is indi~ated.
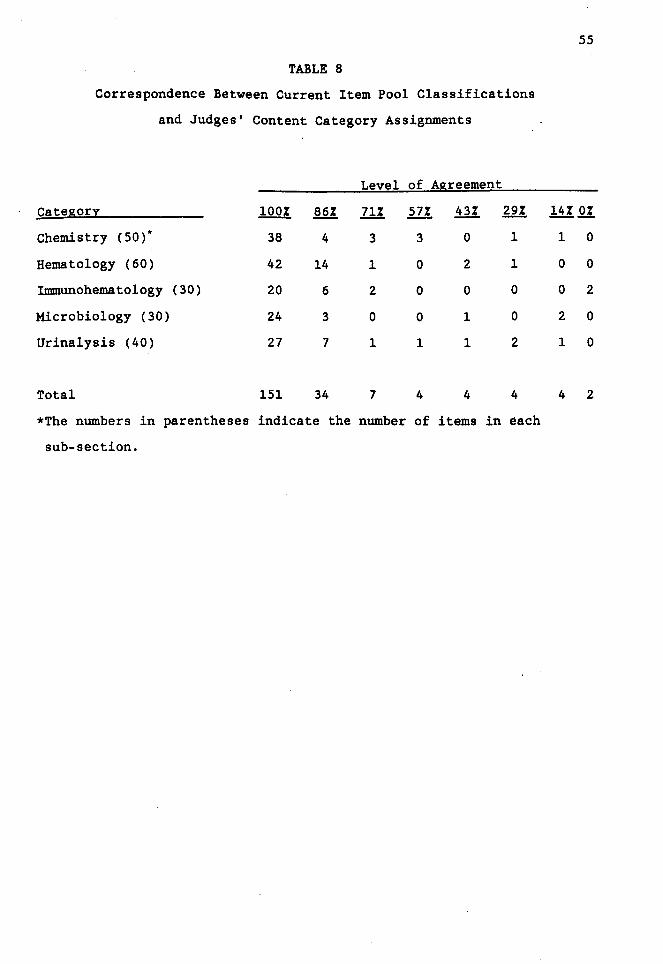
TABLE 8
Correspondence Between Current Item Pool Classifications
and Judges' Content Category Assignments
Level of Agreement
Categor1 100% 86% 71% fil 43% 29%
Chemistry ( 50) * 38 4 3 3 0 1
Hematology (60) 42 14 1 0 2 1
:rmmunohematology (30) 20 6 2 0 0 0
Microbiology (30) 24 3 0 0 1 0
Urinalysis (40) 27 7 1 1 1 2
Total 151 34 7 4 4 4
*The numbers in parentheses indicate the number of items in each
sub-section.
55
14% Q!
1 0
0 0
0 2
2 0
1 0
4 2
Approximately 72% of the test items were unanimously "correctly"
classified by all judges. Furthermore, 88% of the test items met the
"80% agreement" condition specified a priori. Each of the content
categories appeared to be rated comparably in terms of accuracy.
56
One point should be noted, however, regarding the judges'
ratings presented in Table 8. Some judges rated some items as being
equally classifiable into more than one content-category. When this
occurred, "agreement" was noted if the "correct" category was
indicated regardless of order, for a particular item. Overall, a high
degree of agreement with item pool content classifications was found.
Furthermore, to test the statistical significance of inter-rater
agreement in assigning items to content categories, the statistic
kappa was computed. For the seven raters and 210 items considered
here, a high level of agreement was indicated CK - .845, SE(,K) •
.0087). Kappa resembles a correlation coefficient in that an index of
association ranging from -1 to +1 is obtained. The significance of
kappa may be tested by the ratio ,K/SE(,K) which, under the null
hypothesis of no agreement beyond chance, is approximately distributed
as a standard normal variate (Fleiss, 1971). For the present data, it
is suggested that overall inter-rater agreement in assigning items to
categories is significantly greater than chance (~ • 96.8). Although
published standard normal variate tables do not include ~ values of
this magnitude, the probability of obtaining such a result by chance
would be much less than one in one million.
Results of Criterion-Related Measures
While each of the criterion measures and their respective
relationships to test performance are discussed in detail below,
overall response rates from the primary data sources are presented in
Table 9. In addition, examination performance statistics for both MT
and MLT tests are presented in Table 10.

TABLE 9
Data Collection Response Rates
Data Collected
Total number of examinees
Number of passing examinees
Pre-examination internship rating
(archival)
Post-examination supervisor ratings
(mail question~aire)
(Percentage working, having usable
ratings)
Examinee attribution ratings
MLT
-1L _%_
114
87 76%
6/70* 9%
56/70 80%
(29/70) (41%)
101/114 89%
57
Group
MT
-1L _%_
81
65 80%
69/81 85%
64/75 85%
(61/75) (81%)
80/81 99%
*Further data.collection abandoned for archival MLT data.

S8
TABLE 10
MLT and MT Examination Performance Statistics
Grou
MLT MT
Maximum Standard Maximum Standard Score Possible ~ Deviation Possible Mean Deviation
Total 210 122.46 24.82 210 123.46 21. 77
Chemistry so 29.31 7.40 so 28.27 6.13
Hematology 60 36.29 8.31 so 31.26 6.0S
Immunohematology 30 17.96 4.37 40 2S.46 S.11
Microbiology 30 16.00 4.SO so 26.68 6.90
Urinalysis 40 22.90 4.76 20 11.81 2.36

59
Results from pre-examination and post-examination supervisor
performance ratings were compared to examination performance. For
each content area addressed by the rating instrument, a point value
ranging from 1 to 4 was assigned to each performance level ("l"
represents "poor" performance, and •4• represents "excellent•
performance). Point values for each content category were correlated
with respective examination sub-scores across all individuals. While
it is difficult to make exact predictions regarding these analyses,
moderate (.30-.40) positive correlations between criterion measures
and test performance are expected. Statistically significant results
are desirable, in addition to patterns of correlations in the
predicted direction.
Transcript data was treated in a similar fashion (course grades
of "A" were assigned four points per credit hour, etc.). In addition,
cumulative GPAs across laboratory and non-laboratory subjects,
respectively, were correlated with total examination score. A higher
correlation between laboratory-related course performance and total
score than between non-laboratory-related course performance and total
score was predicted.
Pre-Examination Supervisor Ratings
Although too few pre-examination supervisor ratings were
available for the MLT group, approximately 85% of the MTs tested had
this information as part of their application file. While AMT
requires internship ratings for all examinees, a number of MTs were
either foreign or had been trained in the Armed Services. As standard
forms were not used for evaluating these individuals, their ratings
were not included in analyses.
Correlations were obtained between total test score and each of
the 12 pre-examination rating areas for MTs. The results of these
analyses are presented in Table 11. Significant relati~nships were
noted in seven of the eight subject matter areas. However, the one
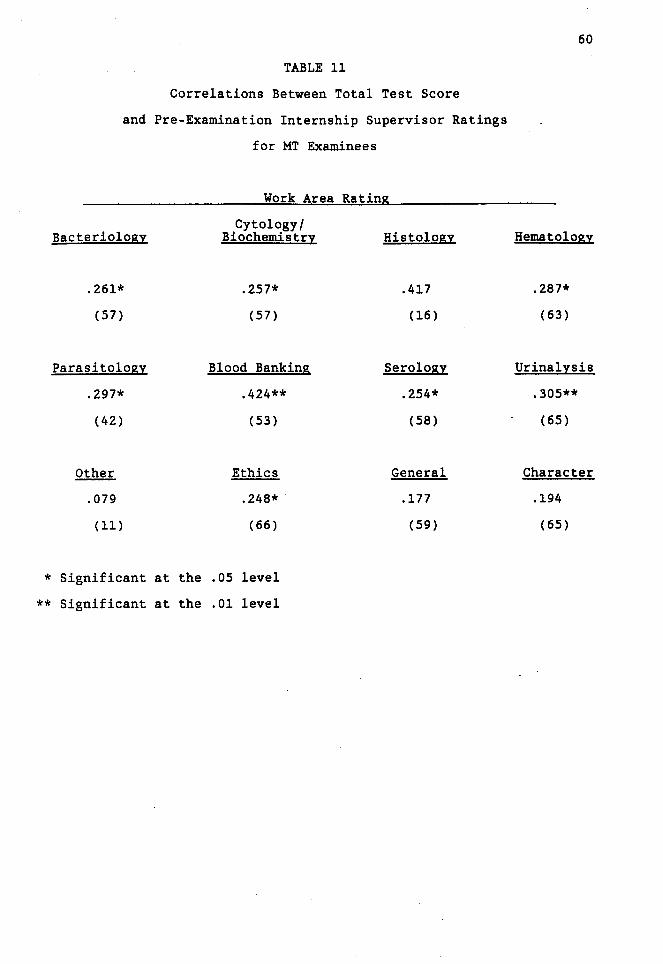
TABLE 11
Correlations Between Total Test Score
and Pre-Examination Internship Supervisor Ratings
for MT Examinees
Work Area Rating
Bacteriology Cytology/
Biochemistry Histology
.261* .257* .417
(57) (57) (16)
Parasitology Blood Banking Serology
.297* .424** .254*
(42) (53) (58)
Other Ethics General
.079 .248* .177
( 11) (66) (59)
* Significant at the .05 level
** Significant at the .01 level
60
Hematology
.287*
(63)
Urinalysis.
.305**
(65)
Character
.194
(65)

area that did not exhibit a relationship to total test score
(cytology/histology) had only 16 cases for which a correlation could
be computed. Furthermore, it should be noted that neither cytology
nor histology are part of the examination. However, ratings in these
areas were considered because the data (available from the pre
examination rating forms) presented an opportunity to assess "halo"
effects. In practice, few MTs actually perform tasks in these areas.
Of the four non-content related scales, a significant
correlation was obtained only for •ethics.• The •other,• •general,"
and "character• scales exhibited no relationship with total test
score. The lack of relationships between these variables and test
score may, in one respect, represent discriminant validity.
Alternatively, these results may also suggest the absence of "halo"
effects. Specifically, ratings on laboratory performance and ratings
of personal aspects may be independent.
61
To further examine the relationship between test performance and
pre-test performance ratings, correlations were obtained between each
work area and each test sub-score. The results of these analyses are
presented in Table 12. Although there is not a direct correspondence
between the rated work areas and the sub-tests, the boxed cells
represent areas that should be most closely related. A boxed cell
should exhibit the highest correlation in its row and column. It is
important to point out that work areas and test areas do not always
correspond on a one-to-one basis. That is, although hematology and
urinalysis are represented by the hematology and urinalysis sub-tests,
respectively, chemistry is represented by the biochemistry sub-test.
Furthermore, both bacteriology and parasitology are represented by the
microbiology sub-test, both blood banking and serology are represented
by the immunohematology sub-test, and cytology/histology is not
represented on the test at all. The bacteriology, hematology,
parasitology, blood banking, and urinalysis work ratings were

TABLE 12
Correlations Between Pre-Examination Work Area
Performance Ratings and Examination Sub-Test Performance·
for MT Examinees
Work Area Sub-Test
Immune-
62
Chemistry Hematology hematology Microbiology Urinalysis
Bacteriology .179 .133 .121
~ .250*
(58) (57) (58) (58) )
Biochemistry bJ .184 .163 .222* .253*
(57) (58) (58) (58) )
Cytology/ Histology .263 .428* .161 .490* .320
(16) (16) (16) (16) (16)
Hematology .305**
~ .170 .131 .411**
(64) (64) (64) (64) )
Parasitology · .115 .181 .186 .446** .065
(43) (42) (43) (43) (43)
Blood Banking .304* .424** .334** .285* .335**
(54) (53) (54) (54) (54)
Serology .196 .229*
~ .243* .356**
(59) (58) (59) (59) )
Urinalysis .254* .206* .153 .287** . 351** .
(66) (65) (66) (66) (66)
* Significant at the .05 level
** Significant at the .01 level

significantly correlated with respective sub-test performance.
However, the biochemistry and serology work areas did not reveal
significant correlations. As cytology/histology is not tested on the
examination, no predictions were made for this area.
63
The matrix presented in Table 12 suggests mixed discriminant and
convergent validity in terms of pre-examination ratings. The most
clear-cut validity is exhibited by the microbiology sub-test, which
consists of both bacteriology and parasitology questions. For this
area, stronger relationships were obtained between respective rating
and test score than between rating and any other test score. Results
for the other test sub-sections are less compelling. For the
remaining sections, a general lack of discriminant validity is
evident.
An analysis of the relationship between pre-examination
performance ratings and sub-test scores could not be generated for the
MLT group. A review of archival data for this group only yielded pre
test supervisor ratings for several individuals. The reason for this
result can be attributed to the large number of individuals in
"member-elect" status with the AMT registry. In this status,
prospective certificants can take the certification test prior to
completing their internship work. The largest proportion of MLT
examinees held member-elect status and, therefore, their application
file did not yet contain internship performance ratings.
Laboratory and Non-Laboratory Academic Performance
For all MLT examinees, grade point averages (GPAs) and number of
semester hours completed in laboratory and non-laboratory subjects
were calculated. These results were correlated with performance on
the total test battery. Table 13 presents the results of the
correlations between academic performance and test performance. Each
examinee's mean GPA was computed and correlated with the total test
score. The results of these calculations were significant

TABLE 13
Correlations Between Measures of Academic Performance
and Total Test Score for MLT Examinees
Non-La bora tory Laboratory
Hours GPA
Laboratory GPA -.023 .304*
(65) (34)
Laboratory Hours .300*
(32)
Non-Laboratory GPA
Non-Laboratory Hours
Transfer Hours
* Significant at the .05 level
** Significant at the .01 level
*** Significant at the .001 level
Non-La bora tory Hours
-.110
(73)
.056
(68)
-.190
(33)
Transfer Hours
-.093
(72)
.091
(65)
.087
(35)
.079
(76)
64
Total Test Score
.500***
(77)
-.050
(70)
-.204
(36)
.300**
(79)
.192*
(78)

65
(£(77) - .410, Q<.001) suggesting a strong relationship between
overall academic performance and total battery score. Furthermore, a
significant relationship between lab GPA and total test score emerged
(£(75) = .500, Q<.001) but a significant relationship between non-lab
GPA and total test score did not emerge (£(34) = -.204, .!!.:..!.·>· Discriminant validity for this measure seems well-defined.
However, the results regarding the relationship between amount
of training and test performance were less straightforward. The
correlation between number of semester hours of laboratory training
and total score was not significant, while the relationship between
number of semester hours of non-laboratory training and total score
was significant (the results for "transfer hours" should be
interpreted with great caution, as some transcripts indicated transfer
credit while others did not). To further investigate these findings,
the total number of academic hours completed by each examinee was
correlated with total test score. A relationship between amount of
academic training and test score was not indicated (£(66) = .085,
!l.: ... !.:J· In addition, when transfer hours were included with
laboratory-related and non-laboratory related training, the
relationship between amount of training and test score was not
appreciably affected (£(63) = .136, li.:.!.:...>· To enhance interpretation
of the academic variables, the examinee group was divided into passing
and failing examinees. Mean scores for each of the variables for both
passing and failing MLTs are presented in Table 14. When mean scores
for both groups were compared via two-tailed j;.,-tests, significant
relationships were noted for the laboratory GPA (j;.,(75) = 2.87, Q =
.008), non-laboratory hours (j;.,(77) = 3.40, Q = .001), and
transfer hours (j;.,(76) = 2.60, Q = .012). Although not statistically
significant, the passing group did exhibit a greater amount of
laboratory training than the failing group.

TABLE 14
Mean Academic Performance for Passing and Failing
MLT Examinees
Laboratory GPA
Laboratory Hours
Non-Laboratory GPA
Non-Laboratory Hours
Transfer Hours
Passing
3.19
(61)
52.95
(56)
3.23
(31)
11.46
(61)
2.50
(60)
Standard
Deviation
.66
23.38
.58
18.10
6.90
Group
Failing
2.68
(16)
47.53
(14)
3.33
(5)
2.29
(18)
.15
(18)
Standard
Deviation
.63
26.17
• 71
5.85
.64
66

67
Post-Examination Supervisor Ratings
Three months following the examination, each examinee's
supervisor was contacted and asked to provide performance ratings for
the examinee along a number of dimensions. Although this information
was gathered for both MT and MLT groups, far fewer rating forms were
obtained for the MLT group (41%) than for the MT group (81%). The
large proportion of the MLT group was not employed three months after
testing. The results for these two groups should be interpreted with
the differential response rate in mind.
Although 114 MLTs were tested, only 70 were tracked for
supervisor ratings. Similarly, only 75 of the 81 MT examinees were
tracked. The test administration cycle spanned a 4-month period.
Examinees tested near the end of this period were not tracked because
of: 1) time considerations involved in conducting this research, and
2) the fact that very little additional data would have been obtained.
Correlations between post-examination content related work area
performance and test scores for the MT group are presented in Table
15. The MT post-examination ratings were similar to that of the pre
examination ratings in that ratings in the bacteriology and
parasitology work areas were most closely related to test performance
in that test sub-section. The chemistry and urinalysis areas also
revealed convergent and discriminant validities, while the results
from the remaining areas were less conclusive.
Overall, results regarding convergent and discriminant
validities for sub-area performance are mixed. Four of the seven
rated areas were significantly correlated with respective test sub
scores. However, sub-test scores were also shown to be related to
performance in other rated work areas as well. Furthermore, the
hematology and iDllllunology test scores did not correlate significantly
with any work area rating. Possible interpretations of the obtained
pattern of results include: 1) the small number of items on which some

TABLE 15
Correlations Between Post-Examination Supervisor Ratings
and Test Performance for MT Examinees
Test Performance
Iuununo- Micro-Work Area Chemistry Hematology hematology biology Urinalysis
Bacteriology .110 .123 .207 .358* .178 (39) (38) (39) (39) (39)
Parasitology .194 .087 .163 .460* .018 (24) (23) (24) (24) (24)
Cytology/Histology (6) (6) (6) (6) (6)
Biochemistry .382** .201 .141 .280* .416** (45) (44) (45) (45) (45)
Hematology .379** ~ .158 .215 .333** (49) ) (49) (49) (49)
Blood Banking .250 .270 mo .587** .291* (33) (32) ) (33) (33)
Serology .263* .173 mo .334* .137 (44) (43) (44) (44) )
Urinalysis .311* .215 .100 .138 .307* (4 7) (47) (47) (47) (47)
Other
Ethics
Character
Overall
* Significant at the .05 level
** Significant at the .01 level
68
Total
.265 (38)
.289 (23)
(6)
.360** (44)
.313* (48)
.467** (32)
.300* (43)
.264* (47)
.146 (9)
.135 (54)
.169 (55)
.273* (56)
sub-test scores are based, and 2) the overall interrelatedness of the
knowledge underlying these areas.
69
Results from the MLT group were even less conclusive (see Table
16). For this data, only the biochemistry ratings were significantly
related to test performance in that sub-section. In addition,
bacteriology ratings yielded an inverse (though not statistically
significant) relationship with microbiology sub-section scores.
As both pre- and post-examination work area ratings were
available for MT examinees, these two measures were correlated to
provide more information regarding the relationships between criterion
measures. The results of these analyses are presented in Table 17.
Correlations between these measures tended to be consistent with other
obtained relationships. Highest correlations were obtained for the
microbiology and urinalysis areas, although results for the hematology
and serology areas were also significant. The chemistry and blood
banking work areas for pre- and post-examination ratings exhibited
little consonance. Although the majority of pre- and post-examination
ratings were obtained from different supervisors (a considerable
amount of time elapsed between these two ratings) several of these
ratings were obtained from the same supervisor.
In addition to rating specific work areas, supervisors were
asked to consider several global non-content-related aspects of the
laboratorians' performance. Correlations between quality of work, job
knowledge, time utilization, policy compliance, judgment and decision
making, quantity of work, and total test score, respectively, are
presented in Table 18. In addition, supervisors were asked to rate
the laboratorian in terms of the "best and worst" technicians that
they have encountered. Correlations between this variable and test
score are also presented.

TABLE 16
Correlations Between Post-Examination Supervisor Ratings
and Test Performance for MLT Examinees
Test Performance
Immune- Micro-Work Area Chemistry Hematology hematology biology Urinalysis
Bacteriology .113 .031 -.397 Olli .009 (10) (10) (10) ) (10)
Parasitology Q (3) (3) (3) (3)
Cytology/Histology (4) (4) (4) (4) (4)
Biochemistry .506* .599** .471* .070 .370 (18) (18) (18) (18) (18)
Hematology .227 UlliJ .187 -.168 .144 (18) ) (18) (18) (18)
Blood Banking .031 -.005 ~ -.128 .097 (9) (9) ) (9) (9)
Serology .065 .170 rnIJ -.440 .070 (12) (12) ) (12) (12)
Urinalysis .378 .501* .353 -.190 []IJ (17) (17) (17) (17) )
Other
Ethics
Character
Overall
* Significant at the .05 level ** Significant at the .01 level
70
Total
-.127 (10)
( 3)
(4)
.497* (18)
.178 (18)
.082 (9)
.070 (12)
.368 (17)
.191 (9)
.436* (26)
.358* (26)
.096 (27)
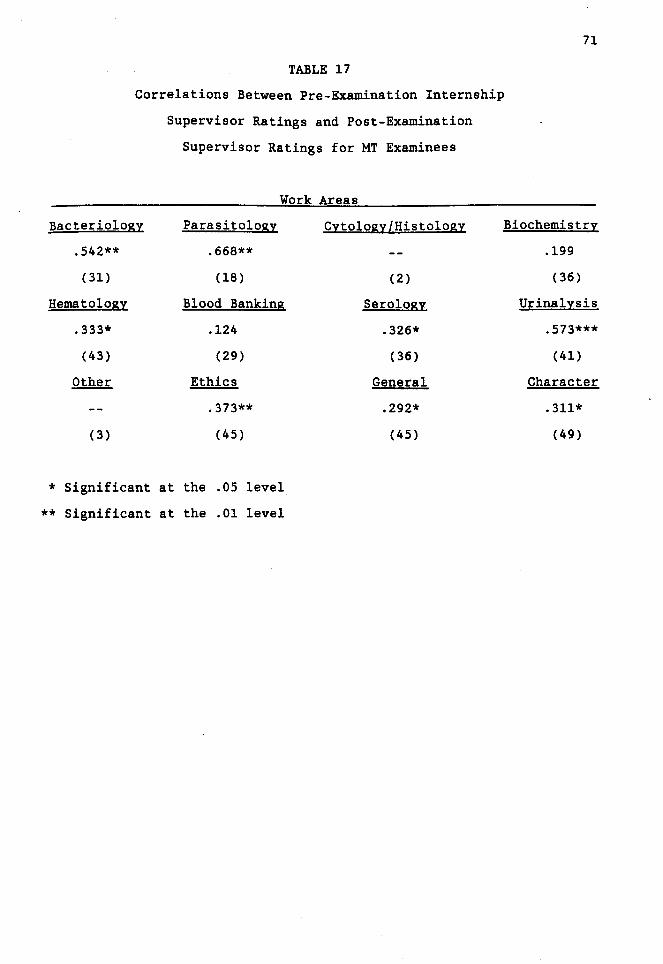
TABLE 17
Correlations Between Pre-Examination Internship
Supervisor Ratings and Post-Examination
Supervisor Ratings for MT Examinees
Work Areas
Bacteriology
.542**
(31)
Hematology
.333*
(43)
Other
(3)
Parasitology
.668**
(18)
Blood Banking
.124
(29)
Ethics
.373**
(45)
* Significant at the .05 level
** Significant at the .01 level
Cytology/Histology
(2)
Serology
.326*
(36)
General
.292*
(45)
71
Biochemistry
.199
(36)
Urinalysis
.573***
(41)
Character
.311*
(49)

TABLE 18
Correlations Between Global Work Characteristics
and Total Test Score for MT and MLT Examinees
Work Characteristic
Quality
Job Knowledge
Time Utilization
Policy Compliance
Judgment
Quantity of Work
Best/Worst
* Significant at the .05 level
** Significant at the .01 level
MT
.311**
.347**
.225*
.164
.237*
.342**
. 377**
Examinee Grou:g
MLT
(58) .241
(58) .278
(57) .234
(58) .289
(58) .242
(58) .198
(58) .342*
72
(29)
(28)
(29)
(29)
(28)
(29)
(28)
73
For the MT group, a significant relationship between each of the
ratings (except "policy compliance") and total score was obtained. In
contrast, the only significant relationship indicated for the MLT
group involved the "best/worst• dimension. Although not statistically
significant, the remainder of the ratings did exhibit low, positive
correlations with total test score.
As a supervisor's summative or overall evaluation of a
laboratory worker's performance was of particular interest, the
best/worst variable was analyzed in greater detail. Table 19 presents
mean best/worst ratings for passing and failing examinees for both MT
and MLT groups. Mean ratings were significantly higher for passing
examinees than for failing examinees for the MLT group, (~(26) • 3.62,
.12. ~ .029), but not for the MT group, (~(56) • 1.70, .!l.: .. !.!J. Also
presented in Table 19 are mean values for passing and failing
examinees for each of the global ratings. Although none of the
analyses performed on these variables yielded significant results,
means for both MT and MLT passing groups were higher than each
respective failing group (except for MLT policy compliance). The lack
of significance for these measures may be attributable to the low
numbers of failing examinees for which ratings were available.
However, as a general trend, the pattern of results lends some support
that the test moderately differentiates job performance. While the
magnitude of the obtained differences are small, the data array in the
predicted pattern.
Results of Construct-Related Measures
The computation of construct validation measures was
straightforward. Correlations between each of five examination sub
scores and the total score (minus the respective sub-score) were
obtained. It was hypothesized that a moderate, positive correlation
between sub-scores and total score would emerge. In addition,

74
TABLE 19
Mean Global Work Ratings for Passing and Failing
MT and MLT Examinees
Grou:e
Medical Medical Technologist LaboratorI Technician
Passing Failing Passing Failing
Rating .Ji Mean SD .H Mean SD .Ji Mean SD .H ~ SD
Best/Worst* 50 7.62 1.60 8 6.00 2.62 25 7.40 1.63 3 5.00 1.00
Quality 50 4.22 .76 8 3.75 1.28 25 4.04 .89 4 3.50 1.00
Job Knowledge 50 4.00 .78 8 3.37 1.19 24 3.83 .76 4 3.25 1.26
Time Utilization 49 4.14 .76 8 4.00 1.07 25 3.96 .93 4 3.75 .96
Policy Compliance 50 4.32 .62 8 4.12 1.13 25 4.04 .73 4 4.25 .50
Judgment 50 3.94 .93 8 3.62 1.41 24 3.96 .91 4 3.75 .96
Quantity of Work 50 4.16 • 77 8 3.87 1.13 25 3.88 .93 4 3.50 1.29
* While all other scales presented on this Table range from 1-5,
the "best/worst" scale ranges from 1-10.
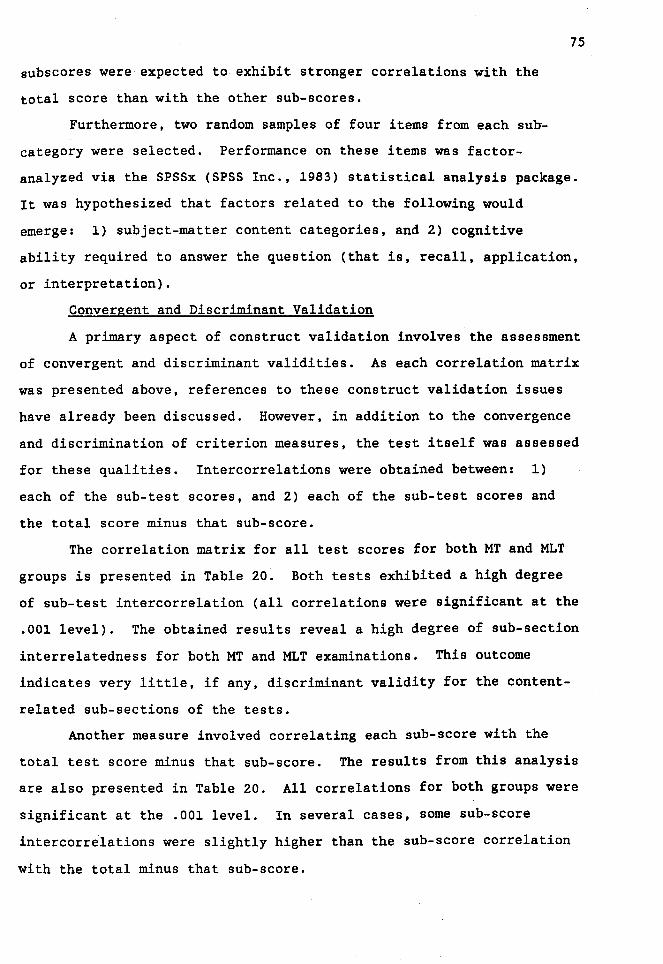
subscores were expected to exhibit stronger correlations with the
total score than with the other sub-scores.
75
Furthermore, two random samples of four items from each sub
category were selected. Performance on these items was factor
analyzed via the SPSSx (SPSS Inc., 1983) statistical analysis package.
It was hypothesized that factors related to the following would
emerge: 1) subject-matter content categories, and 2) cognitive
ability required to answer the question (that is, recall, application,
or interpretation).
Convergent and Discriminant Validation
A primary aspect of construct validation involves the assessment
of convergent and discriminant validities. As each correlation matrix
was presented above, references to these construct validation issues
have already been discussed. However, in addition to the convergence
and discrimination of criterion measures, the test itself was assessed
for these qualities. Intercorrelations were obtained between: 1)
each of the sub-test scores, and 2) each of the sub-test scores and
the total score minus that sub-score.
The correlation matrix for all test scores for both MT and MLT
groups is presented in Table 20. Both tests exhibited a high degree
of sub-test intercorrelation (all correlations were significant at the
.001 level). The obtained results reveal a high degree of sub-section
interrelatedness for both MT and MLT examinations. This outcome
indicates very little, if any, discriminant validity for the content
related sub-sections of the tests.
Another measure involved correlating each sub-score with the
total test score minus that sub-score. The results from this analysis
are also presented in Table 20. All correlations for both groups were
significant at the .001 level. In several cases, some sub-score
intercorrelations were slightly higher than the sub-score correlation
with the total minus that sub-score.
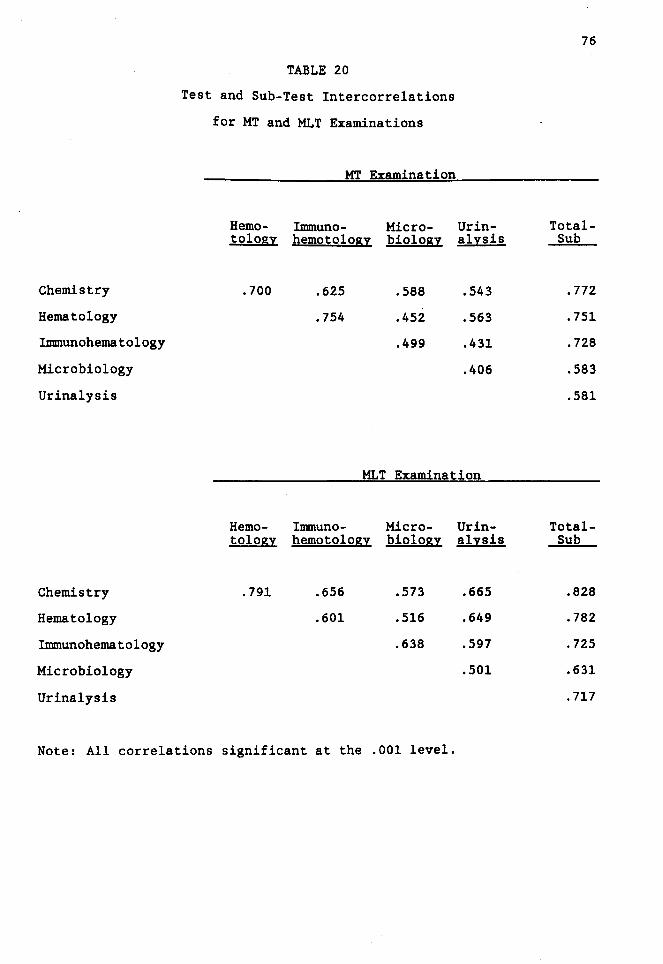
Chemistry
Hematology
Imm.unohematology
Microbiology
Urinalysis
Chemistry
Hematology
Imm.unohematology
Microbiology
Urinalysis
TABLE 20
Test and Sub-Test Intercorrelations
for MT and MLT Examinations
MT Examination
Hemo- Imm.uno- Micro-tology hematology biology
.700 .625 .588
.754 .452
.499
Ur in-alysis
.543
.563
.431
.406
MLT Examination
Hemo- Imm.uno- Micro- Ur in-tology hematology biology alysis
.791 .656 .573 .665
.601 .516 .649
.638 .597
.501
Note: All correlations significant at the .001 level.
76
Total-Sub
. 772
.751
. 728
.583
.581
Total-Sub
.828
.782
. 725
.631
. 717

77
Factor Analysis of Test Items
Exploratory Analysis Strategy. Two item samples were
independently factor analyzed via a principal components analysi~ with
Varimax rotation. This strategy was adopted, as the purpose of the
analysis was to see if factors emerged that correspond to the major
content areas of the examination. Because a low number of examinees
took the test, only samples of items were included in the analyses
(four items from each of the five content categories). In addition,
two independent item samples were selected from the same test for the
purpose of replicating the factor structure.
The results of an initial analysis yielded eight factors for
Item Sample A, and seven factors for Item Sample B. On the basis of
this result, a second analysis was conducted setting the number of
factors for each item sample equal to eight. The results from the
second analysis did not differ appreciably from the results of the
initial analysis, for Item Sample A. For Item Sample B, the factor
structure did change somewhat, but in no way enhanced an
interpretation of the results.
The rotated factor matrices from the initial analyses are
presented in Tables 21 and 22. In addition, the eigenvalues and
percentage of variance accounted for by each of the factors, for both
item samples, are presented in Table 23. Each item sample is
interpreted independently.
Item Sample A. Overall, the results from the factor analyses
are difficult to interpret and do not yield a readily identifiable set
of factors. Factor 1 from Item Sample A is particularly difficult to
label. The three items of this factor with loadings over .50 are from
three separate sub-tests. The only thing that these items may have in
common is that all three appear to involve only recall of facts. No
interpretation, analysis, or knowledge of methodology appear to be
relevant. Two microbiology items loaded on factor 2. However, two of

78
TABLE 21
Results from Factor Analysis of Item Sample A
Factor Loading
.llfil!l _L _2_ -L _4 _ _ s _ _ 6_ _7_ _8 _
Chem 4 .57 .04 -.18 .18 .14 -.15 .30 -.14
15 .01 .62 -.07 .20 .12 -.18 .01 .12
21 .16 .10 -.12 .75 .06 .06 .07 .16
41 -.23 .01 .29 .03 .28 -.06 .29 .33
Hem 64 .05 .39 .04 .14 .04 .15 -.59 -.08
85 .31 -.00 .29 .43 .08 -.12 -.14 .02
93 -.20 -.09 .21 .59 -.10 .05 .06 -.06
96 .03 .24 .04 .16 -.05 .13 .73 .02
Inun 114 .69 -.06 .21 -.06 .03 .01 .04 -.10
120 .12 -.28 .34 -.23 .22 .57 .01 .21
127 -.04 .13 -.02 .07 -.01 .02 .04 .88
128 .20 .12 -.14 -.12 .77 -.05 -.05 -.01
Mic 141 .10 .53 -.07 -.03 .16 .35 .29 -.07
149 .07 .42 -.06 -.17 -.50 .18 .04 -.30
162 -.32 .22 .30 .28 .52 .27 .04 -.15
167 .02 .60 .22 -.16 -.07 -.12 -.07 .13
Ur in 193 .67 .18 .oo .03 -.01 .19 -.17 .26
181 -.07 .13 .62 .18 -.06 -.12 -.23 .01
184 -.03 -.04 -.23 .15 -.16 .78 -.01 -.06
207 .14 -.02 .69 -.00 -.01 .01 .17 -.01

79
TABLE 22
Results from Factor Analysis of Item Sample B
Factor Loading
Item _L _ 2_ _ 3 _ _ 4_ _s _ _6 _ _7 _
Chem 20 -.27 -.03 • 71 .13 -.09 .14 -.19
27 .29 .S2 .13 -.06 .10 .22 .OS
32 .2S .43 .04 .48 .10 -.22 -.27
39 .19 .08 .11 .61 -.04 -.01 -.03
Hem S9 .OS .S4 .21 .24 .40 .oo -.00
90 -.lS .S7 -.03 .07 -.3S .lS .OS
92 .23 .10 .09 -.14 .60 .30 -.13
107 .09 .62 -.OS .11 -.OS -.30 .03
Imm 114 .19 -.17 .14 .22 -.12 -.07 .69
llS .11 .12 .08 -.14 -. 71 .23 -.10
116 .lS .07 .60 .16 .21 .14 .19
119 .10 .14 .09 .07 .06 .64 -.08
Mic 141 .76 -.OS -.11 .10 .17 .lS -.06
148 .44 .02 .SS -.04 -.24 .oo .23
1S2 .03 -.17 .10 .08 -.08 .S4 .23
160 .7S .24 .13 .10 -.06 -.06 .07
Ur in 194 .lS -.29 .08 .lS -.15 -.10 -.69
197 .20 .09 .32 -.08 .29 -.45 .26
198 -.10 .18 .10 .64 .17 .28 .17
202 -.06 -.16 -.49 .52 -.09 .16 .07

Factor
1
2
3
4
5
6
7
8
Factor
1
2
3
4
5
6
7
80
TABLE 23
Summary Statistics from Two Independent Factor Analyses
of MLT Examination Items
Item Sam12le A
Eigenvalue Percentage of Conunon Variance Cumulative Percentage
2.21 11.1% 11.1%
1.61 8.0% 19.1%
1.59 8.0% 27.0%
1.41 7.1% 34.1%
1.27 6.4% 40.5%
1.22 6.1% 46.6%
1.13 5. 7% 52.2%
1.08 5.4% 57·.6%
Item Sam12le B
Percentage of Eigenvalue Conunon Variance Cumulative Percentage
2.84 14.2% 14.2%
1.62 8.1% 22.3%
1.58 7.9% 30.2%
1.37 6.9% 37 .1%
1.35 6.8% 43.8%
1.28 6.4% 50.2%
1.09 5.4% 55.6%

81
the three items also seemed to involve knowledge of methodology. It
is particularly interesting to note that item Mic 141 was also the
item for which there was the least amount of consensus regardin~
content classifications. Specifically, most raters said that this
item probably should not be classified into any of the categories
specified on the examination. Further research on this item revealed
that it is most closely related to histology, a topic not addressed on
the MLT examination.
Factor 3 consisted of two urinalysis items: one involving the
interpretation of analyses and one involving knowledge of anatomy.
Factors 4, 5, and 6 yielded no clear-cut interpretations. Although
factor 7 involved two hematology items, one item had a positive factor
loading and one item had a negative factor loading. Overall, a
consistent, readily interpretable set of factors was not revealed for
this item sample. In addition, some items from Item Sample A (and
from Item Sample B, discussed below) did not load on any factors.
Item Sample B. Factor 1 appeared at first consideration to
consist of microbiology content. However, the presence of item Mic
141 (discussed above) obscures an interpretation of this factor. It
is noteworthy that this item, which may be most closely related to
histology, loaded on both factor sets (two items were shared by both
item samples: Mic 141 and Imm 114).
Factor 2, although containing items of modest factor loadings,
may represent the most clear-cut factor from both item sets. Three of
the items are from the hematology sub-test, and the one chemistry item
addresses values of calcium in the blood. This factor may involve
knowledge of hematology content.
Factor 3 very much resembles Factor 1 from Item Sample A. This
factor, composed of items from three different sub-tests, appears to
involve only recall of facts/relationships. No interpretation or
knowledge of methodology is indicated.

82
While two items from Factor 4 are from the urinalysis sub-test,
the chemistry item is almost non-content category related. This
latter item refers only to general solution methodology. Factors· 4,
5, and 7 lack any clear commonalities. As with Item Sample A, the
results from this analysis reveal few readily interpretable outcomes.
Although based on small samples of items (necessitated by the
low number of examinees) the factor analyses do not reveal a reliable
test factor structure that corresponds to different knowledge content
areas. While an alternate underlying factor set may exist to describe
the examined constructs, the present analyses do not suggest a
particular direction of study. Perhaps the construct represented by
the test score reflects a type of general laboratory ability or
competence. Such an interpretation would have consequence in
determining whether a multiple-cut or total test battery score is more
appropriate for determining "minimal competence."
Factor Analysis of Sub-Scores
A second exploratory strategy consisted of independent factor
analyses of sub-score performance for both MT and MLT groups. In an
initial analysis (which left the number of factors unspecified) only
one factor was extracted for each examinee group. For the MT group,
this factor accounted for 64.9% of the variance. Similarly, this
factor accounted for 69.7% of the variance for the MLT group. Factor
loadings for both MT and MLT groups are presented in Table 24. For
both examinations, each of the sub-tests loaded heavily (.72 to .89)
on the single factor that was extracted.
A subsequent factor analysis of the five sub-scores for both
groups (which specified the extraction of five factors) was conducted.
The first of the five factors extracted accounted for exactly the same
amount of variance yielded by the first analysis, for both examinee
groups. Furthermore, the rotated factor matrices revealed that each
of the respective sub-scores loaded over .78 on a different factor (of
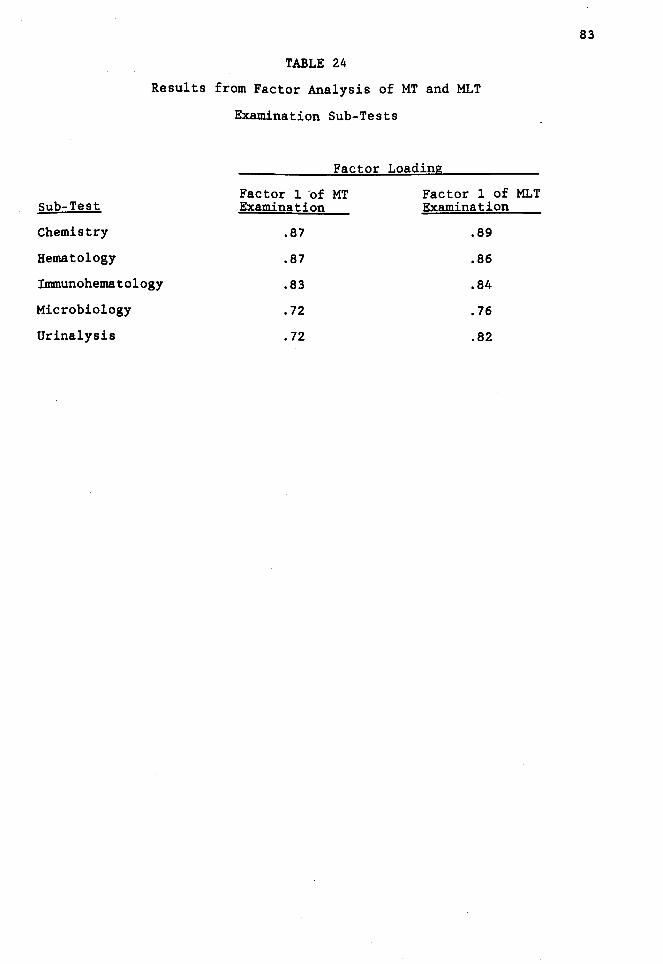
TABLE 24
Results from Factor Analysis of MT and MLT
Examination Sub-Tests
Sub-Test
Chemistry
Hematology
Innnunohematology
Microbiology
Urinalysis
Factor Loading
Factor 1 of MT Examination
.87
.87
.83
.72
• 72
Factor 1 of MLT Examination
.89
.86
.84
.76
.82
83
84
the five extracted). However, as with prior analyses, it would appear
as if only one factor was dominant. Overall, these findings are
consistent with the results obtained from the factor analyses of
individual item responses. When the factors are assessed in an
orthogonal manner, only one factor appears to be salient. Sub-scores
may not be assessing distinct subject-matter areas in an independent
fashion.
Attributions of Performance
For this exploratory aspect of the present research, no specific
predictions were made regarding the relationship between test scores
and examinees' self-attribution ratings. However, it was expected
that if post-test supervisor ratings are to be used for test
validation, their relation to test scores should be unaffected by
supervisors' attributions regarding the causes of examinees' job
performance. Examinees' attribution and supervisors' attributions
were considered independently, as discussed below. The primary
analysis strategy involved correlating each of the attribution
dimensions to total test score.
Examinee Attributions of Test Performance
After examinees had completed the certification test at the
administration site, they were asked to complete a questionnaire
regarding the attributions of their performance, and to indicate how
well they thought they performed on the test. Correlations between
each of these variables and the total test score for both MT and MLT
groups are presented in Table 25. For the MT group, only the
"iIImlediate effort" variable appeared to be related to test
performance. For the MLT group, only the "luck" variable appeared to
be related to test score. Toward investigating the pooled effect of
attribution ratings, an overall "effort" variable was constructed by
sUIImling scores on "iIImlediate effort" with scores on "trpical effort."
Although the correlation between the pooled effort score and total

TABLE 25
Correlations Between Examinee Attribution Variables
and Total Test Score for MT and MLT Examinees
Examinee Grou12
Attribution Characteristic MT MLT
Mood .089 (79) -.162 (100)
Typical Effort .059 (78) .119 (101)
Task Difficulty -.013 (78) -.015 (98)
Luck .106 (78) -.232** (100)
Immediate Effort .248* (79) .143 (101)
Ability .072 (79) .124 (99)
Teacher Influence .093 (79) .015 (99)
Help .042 (79) -.037 (99)
Success Estimate .169 (78) -.092 (100)
* Significant at the .OS level
** Significant at the .01 level
85
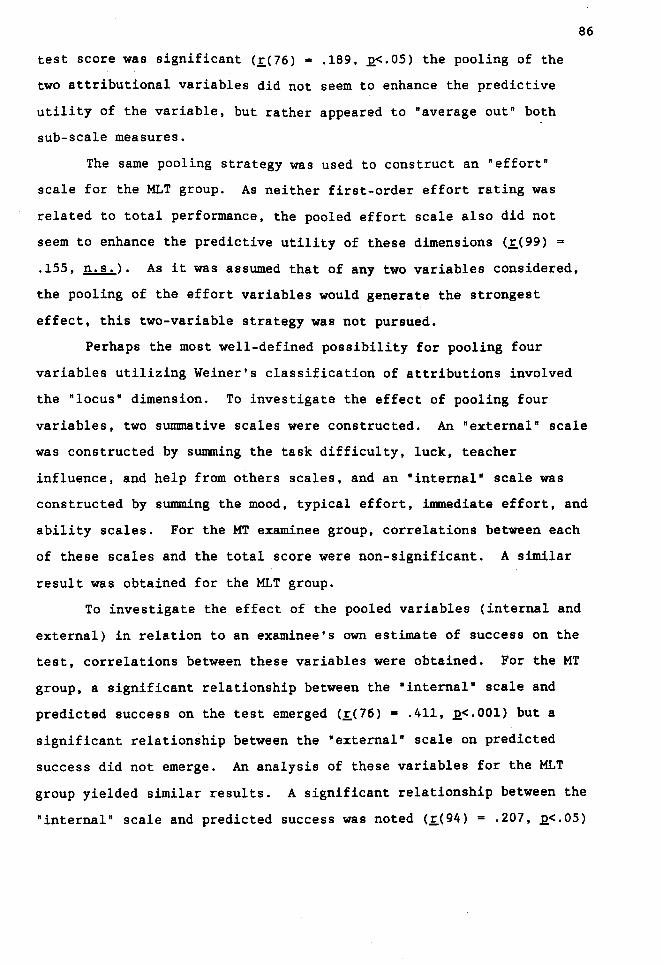
test score was significant (£(76) = .189, J2.<.05) the pooling of the
two attributional variables did not seem to enhance the predictive
utility of the variable, but rather appeared to "average out" both
sub-scale measures.
The same pooling strategy was used to construct an "effort"
scale for the MLT group. As neither first-order effort rating was
related to total performance, the pooled effort scale also did not
seem to enhance the predictive utility of these dimensions (£(99) =
.155, !h.!..:.,). As it was assumed that of any two variables considered,
the pooling of the effort variables would generate the strongest
effect, this two-variable strategy was not pursued.
86
Perhaps the most well-defined possibility for pooling four
variables utilizing Weiner's classification of attributions involved
the "locus" dimension. To investigate the effect of pooling four
variables, two summative scales were constructed. An "external" scale
was constructed by summing the task difficulty, luck, teacher
influence, and help from others scales, and an "internal" scale was
constructed by summing the mood, typical effort, immediate effort, and
ability scales. For the MT examinee group, correlations between each
of these scales and the total score were non-significant. A similar
result was obtained for the MLT group.
To investigate the effect of the pooled variables (internal and
external) in relation to an examinee's own estimate of success on the
test, correlations between these variables were obtained. For the MT
group, a significant relationship between the "internal" scale and
predicted success on the test emerged (£(76) = .411, J2.<.001) but a
significant relationship between the •external" scale on predicted
success did not emerge. An analysis of these variables for the MLT
group yielded similar results. A significant relationship between the
"internal" scale and predicted success was noted (£(94) = .207, J2.<.05)

while a relationship between the "external" scale and predicted
success was not indicated.
87
Correlations between examinees' predictions of success and total
test score were also obtained. A significant relationship was
demonstrated for neither the MT group (£(76) • .169, ~) nor the MLT
group (£(98) • -.092, ~).
One interpretation of the above exploratory research suggests
that self-reports of ability and predicted success do not contribute
to test validation. Furthermore, if such self-reports were assumed to
be valid criteria, the validity of the test in identifying the most
able and hard-working could be called into question.
Another strategy used to investigate the attributional variables
was to compare passing and failing examinees along each dimension.
For both MT and MLT groups, passing and failing examinees were
compared via two-tailed .t.-tests. For both examinee groups, the only
self-attributional variable that distinguished performance was the
ability rating of the MLT group (.t.(97) • 2.02, .2 • .05). In this
comparison, passing examinees indicated that their ability was a more
important fac.tor affecting their test performance than failing
examinees. No other attributional variable differentiated examinees
for either the MT or MLT groups.
Supervisor Attributions of Practical Performance
To explore further the use of attributional variables in the
examination validation context, examinees' work supervisors were asked
to provide attributions regarding the practical performance of
examinees. As with the criterion-related data, these ratings were
obtained approximately three months after test administration.
Overall mean supervisor attribution ratings for both MT and MLT
groups are presented in Table 26. Rank-ordering across all
attribution types were identical for both groups. The results of
these mean ratings array as would be expected, given the assumption
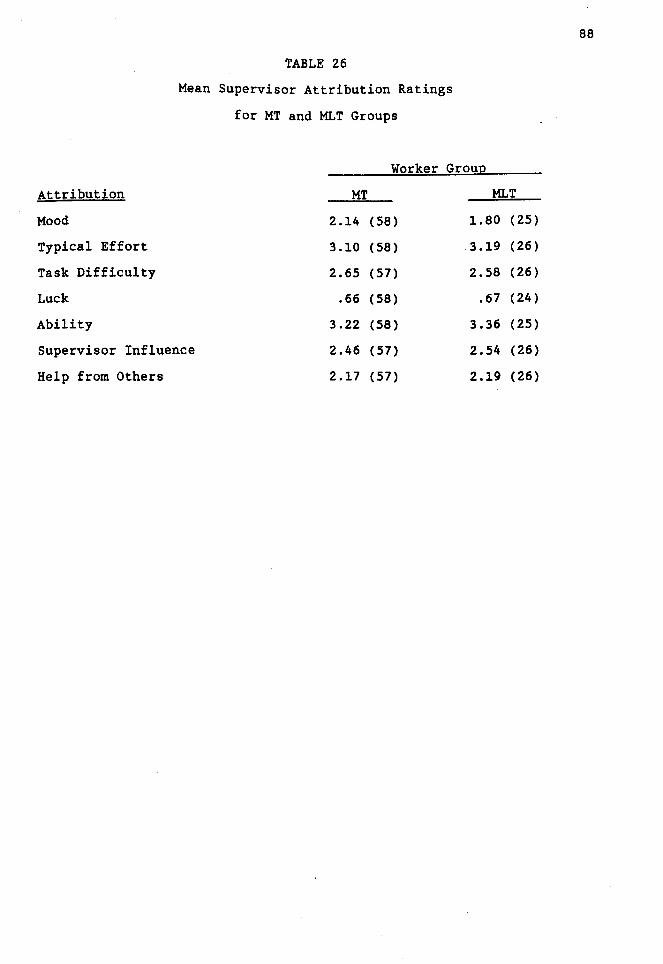
Attribution
Mood
Typical Effort
Task Difficulty
Luck
Ability
TABLE 26
Mean Supervisor Attribution Ratings
for MT and MLT Groups
Worker Group
MT MLT
2.14 (58) 1.80 (25)
3.10 (58) 3.19 (26)
2.65 (57) 2.58 (26)
.66 (58) .67 (24)
3.22 (58) 3.36 (25)
Supervisor Influence 2.46 (57) 2.54 (26)
Help from Others 2.17 (57) 2.19 (26)
88

89
that supervisors' ratings are an acceptable validation criterion
measure. Specifically, supervisors of both MT and MLT workers said
that they thought luck and workers' mood influenced performance least.
In contrast, ability and effort were perceived as having the most
influence on performance. These results are consistent with the idea
that supervisors' ratings are a valid criterion measure.
Correlations between total test score and each of the
attributional variables in addition to supervisors' ratings of
best/worst technician (global performance criterion) for both MT and
MLT groups are presented in Table 27. These correlational analyses
suggest that test scores may not be related to attributions to
internal factors of ability and effort. However, for the MT group,
higher test scores were associated with lower attributions of job
performance to mood, task difficulty, and luck. Although these three
attributions were inversely related to test performance for the MT
group, the same effect was not replicated for the MLT group.
Supervisors generally gave higher ratings to effort and ability
attributions. However, it seems that these ratings may not predict
test performance in a straightforward manner. In contrast, the global
performance rating (best/worst) was correlated significantly with
total test scores.
A primary issue in utilizing supervisor ratings for validation
involves the types of factors that contribute to a supervisor's
judgment. To address this issue, correlations between test
performance and overall ratings were obtained, controlling for the
effects of each of the attributional variables. Partial correlations
for the MT and MLT group are presented in Table 28. For each of the
attributional variables, controlling for the variables tended to only
marginally increase correlations compared to the first-order
relationships (except for "luck" for the MT group, which remained
unchanged). In addition, for the MT group, the change in correlations

TABLE 27
Correlations Between Supervisor Attribution Variables
and Total Test Score for MT and MLT Examinees
Examinee Grou12
Attribution Characteristic MT MLT
Mood -.232* (57) -.074 (25)
Typical Effort -.035 (57) .010 (26)
Task Difficulty -.364** (56) .068 (26)
Luck -.307** (57) -.215 (24)
Ability .181 (57) .081 (25)
Supervisor Influence .002 (56) -.152 (26)
Help -.084 (56) -.044 (26)
Best/Worst . 377** (58) .342* (28)
* Significant at the .05 level
** Significant at the .01 level
90

TABLE 28
Correlations Between Best/Worst Variable
and Total Test Score, Controlling for Attributional Variabl~s.
for MT and MLT Examinees
Examinee Grou12
Attribution Characteristic MT MLT
Mood .405*** (53) .515** (18)
Typical Effort .429*** (53) .502* (18)
Task Difficulty .428*** (53) .460* (18)
Luck .377** (53) .514** (18)
Ability .384** (53) .502* (18)
Supervisor Influence .420*** (53) .464* (18)
Help .408*** (53) .510* (18)
* Significant at the .05 level
** Significant at the .01 level
*** Significant at the .001 level
91

tended to be modest, overall. None of the changes in£ were
significant for either the MT or MLT group.
92
While a clear pattern did not emerge for the MLT group, the
partial correlations were only based on 18 observations. The low
number of ratings for this group makes it somewhat difficult to
interpret the results. However, the generally consistent pattern of
partial correlations suggests that the predictive validity coefficient
(test score by best/worst rating) especially for Ml.Ts, is slightly
supressed by supervisors' perceptions of the employees' effort,
ability, the task difficulty, et cetera. This outcome is better than
if the predictive validity coefficients had been inflated by
attributions.
Test Reliability
For both MT and.MLT tests, KR-20 and standard error of test
statistics were calculated for the baseline group of each examination
administration (N • 70 for MT group, N - 60 for MLT group). The
results of these reliability indices are presented in Table 29. These
figures are compared to reliability estimates from four other
administrations of each respective test. The results indicate a great
degree of stability in reliability across parallel forms. For the MT
group, the range of KR-20 estimates for the last five administrations
was .882 to .949. For the MLT group, this range was .923 to .949.
Similarly, for the last five administrations, the standard error of
test for the MT group ranged from 8.52 to 8.72. For the MLT group,
standard error of test ranged from 8.63 to 8.94. Reliabilities for
the current tests are consistent with reliability estimates obtained
from past administrations.
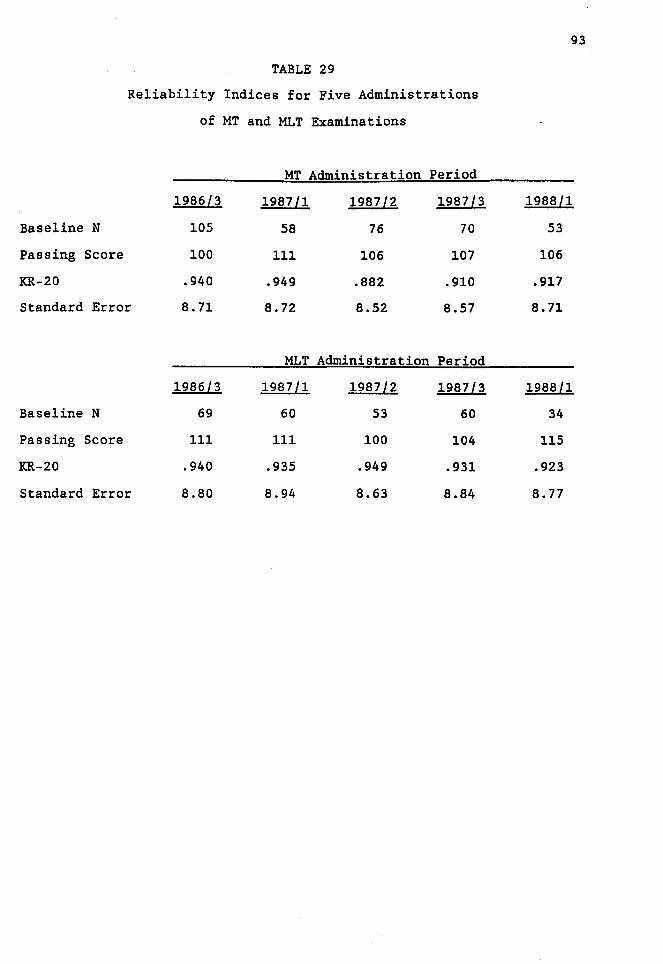
TABLE 29
Reliability Indices for Five Administrations
of MT and MLT Examinations
MT Administration Period
1986l3 1987ll 1987l2 1987l3
Baseline N 105 58 76 70
Passing Score 100 111 106 107
KR-20 .940 .949 .882 .910
Standard Error 8. 71 8. 72 8.52 8.57
MLT Administration Period
1986l3 1987ll 1987l2 1987 l3
Baseline N 69 60 53 60
Passing Score 111 111 100 104
KR-20 .940 .935 .949 .931
Standard Error 8.80 8.94 8.63 8.84
93
1988ll
53
106
.917
8. 11
1988ll
34
115
.923
8. 77
content-Related Validity
Task Analysis
CHAPTER V
DISCUSSION
The crux of adequate content validation involves insuring that a
test contains items that reflect behaviors purportedly predicted by
the test. For the present research, content validity was assessed
through a task analysis. Specifically, the expert group who is
responsible for the test's content generated a comprehensive list of
"competencies" that they believed comprise the role of the MLT. The
list was designed to include all required knowledge and behavior
areas. This list was then circulated to practitioners currently
working as MLTs. The majority of all respondents indicated that
knowledge of all but six of the 140 competencies should be required
for an individual to be certified. This result, taken with the fact
that virtually no other major competencies were added by the
respondent group, suggests that items constructed from this task list
adequately represent the MLT role. If items are constructed from the
competency outline, examinations based on these items should reflect
content validity. However, it should be noted that one potential
reason why few additional tasks were added may be because respondents
lack the motivation to think about or list other duties. A possible
way to address this issue is to supplement self-report with an
observational strategy.
The task areas were linked to the examination by considering
only the major work area designations. Both MT and MLT respondents
were asked to provide "percent of time spent" and "importance" ratings
for several general work areas rather than in terms of specific tasks.
Proportions of time spent in each of these areas were compared to
proportions of test questions in each respective area. A K2 goodness-
94

95
of-fit test was performed assessing the correspondence between the
proportion of questions in each of the five sub-tests and work areas,
combined in such a way as to reflect the amount of time spent in those
five areas. The "!!.2 goodness-of-fit test was significant for neither
the MT test, nor the MLT test.
A second X2 analysis was performed, partitioning the categories
in a different way. Specifically, the amount of time spent in 11 of
the 12 work areas was compared to the number of test questions
addressing each area (cells with expected frequencies equal to zero
were omitted from the analysis). The results of this analysis for
both MT and MLT groups also indicated satisfactory correspondence
between time spent in practice and test question proportions.
Comparing the mean work area ratings for both groups suggests
that in terms of content the roles of the MT and MLT, although not
identical, may be similar. For example, results from the task
analysis suggest that for each of the 12 work areas considered, less
than a 4% difference was obtained between MT and MLT groups in terms
of time spent. Importance ratings for each of the general work areas
were also very similar between groups. However, a pattern of
differences did emerge for the knowledge areas such that the MLTs
seemed to place greater importance on these areas, overall. Perhaps
these roles are best differentiated by the depth of knowledge required
in these areas for the different certification designations. That is,
MT and MLT tests should be differentiated by criterion level of
performance rather than purely in terms of content. While the content
of the questions may be similar, a higher minimum passing score would
be set for the MT group than for the MLT group.
It should be noted, however, that the similarity of proportions
between MT and MLT groups may pertain only to the sets of items and
areas rated here. MTs and MLTs may differ in ways not included on the
tests or task outlines. Several MT respondents reported working in
96
the general area of "laboratory management.• This result is
consistent with scope of practice statements offered by most
laboratory practitioner certifying groups. However, the current MT
test does not test for laboratory operation skills. It may or may not
be appropriate to test for such skills in the certifying process. In
one respect, it could be argued that a medical technologist often
works in a managerial capacity. As such, competency in this area
should also be required for successful job performance. However, it
could also be argued that managerial skills are quite distinct from
laboratory skills. As the laboratory aspect is the critical aspect of
the job (such that a lack of competence in this area causes the
greater potential harm), emphases and resources should be primarily
channeled here. The validity of both perspectives is argued by
alternate certification groups: some who test for •supervisory•
competencies and some who test for laboratory competencies only. The
bases for these positions appear to be derived from the basic
philosophy that a credentialing board adopts regarding the MT job
role.
Judges' Item Classification
Perhaps the best source for assessing a test's content validity
is to consider the test items actually comprising a test. However,
because of the confidential nature of the test item pool, it is not
feasible to have practitioners rate items for content appropriateness.
As information regarding the actual test items was considered
essential, members of the AMT expert committee were asked to classify
items comprising an MLT examination into general examination
categories. While it is recognized that these same experts are
responsible for constructing the test originally, procedural steps
were taken to control for the possibility of an artificially inflated
validity index. Those steps were as follows: 1) a period of
approximately six months had passed between the original test
construction and the classification of items, 2) two other MT and MLT
tests containing entirely different items were constructed by the
committee during this period, and 3) raters were not told that these
items comprised an actual test.
97
Overall, a very high degree of correspondence was obtained
between experts' broad subject matter classification of items and the
categories in which they appeared on the test. Items appeared to be
pooled with a high degree of inter-rater agreement in terms of general
subject matter classifications (inter-rater agreement was
statistically significant~.
Criterion-Related Validity
Although too few pre-examination supervisor ratings were
available for the MLT group, approximately 85% of the MTs tested had
this information as part of their application file. While AMT
requires internship ratings for all examinees, a number of MTs were
either foreign or had been trained in the Armed Services. As standard
forms were not used for evaluating these individuals, their ratings
were not included in analyses.
Correl~tions between ratings on each work area and total score
on the test were significant, except for the cytology/histology area.
However, this result may be expected since few practitioners were
rated in this area and questions for this area do not appear on the
test. Although most of the correlations were modest, the blood
banking total score correlation coefficient was equal to .42. These
results are particularly noteworthy as several years may have elapsed
between ratings and the MT test. In addition, a significant
relationship was obtained between the ethics scale and the total test
score. A similar result, noted for several post-examination ratings,
may not be readily interpretable. It is unclear as to why
supervisors' ratings of practitioner ethicality would be related to
test performance.
98
Relationships between ratings of each work area and respective
test sub-section were also assessed. It is important to point out
that work areas and test areas do not always correspond on a one-to
one basis. That is, although hematology and urinalysis are
represented by the hematology and urinalysis sub-tests, respectively,
chemistry is represented by the biochemistry sub-test. Furthermore,
both bacteriology and parasitology are represented by the microbiology
sub-test, both blood banking and serology are represented by the
immunohematology sub-test, and cytology/histology is not represented
on the test at all. Therefore, in the present analysis, the
bacteriology and parasitology areas are both compared to the
microbiology score, and the blood banking and serology areas are
compared to the immunohematology score. Performance in five of the
seven critical work areas (cytology/histology is not a critical work
area) correlated significantly with their respective sub-scores.
Furthermore, four of the seven critical work areas correlated most
strongly (or nearly so) with respective sub-test score, compared to
other sub-test scores. These results suggest some degree of
convergent and discriminant validity (the boxed areas in Table 12
indicate the cells for each row where the highest correlations are
desired).
Academic Performance and Examinee Performance
A review of the correlations between GPA and test performance
suggests that the MLT test exhibits both convergent and discriminant
validity in terms of this dimension. 'While the correlation between
laboratory GPA and total test score was significant at the .001 level,
the correlation between non-laboratory related GPA and total test
score was slightly negative. However, the following caveats must be
mentioned when interpreting the above results. First, GPAs for the
laboratory area were computed over many more courses for each
individual than for non-laboratory course work. In most cases, non-

99
laboratory GPAs were based on less than six course grades. Such a
situation could have resulted in restricted range of the non
laboratory GPA correlate. A second caveat involves the fact that non
laboratory GPA was computed for far fewer individuals than laboratory
GPA (also, possibly causing the correlation to be unstable). To
further enhance an interpretation of convergent and discriminant
validities, the results reveal a significant relationship between
laboratory and non-laboratory GPA. While academic performance appears
to be consistent within individuals, those performing better in their
laboratory coursework exhibited higher examination scores.
The source of GPA data used in the present research was highly
heterogeneous. Transcripts from which GPAs were computed were very
diverse in terms of point systems and credit hour structure. Despite
the procedural difficulties involved with putting GPAs into a conunon
frame of reference, the correlational results were very much in the
predicted direction. A somewhat different result emerged regarding
the amount of academic training. While the amount of laboratory
coursework did not appear to be related to examination score, the
amount of non-laboratory training did show a relationship to test
score. One interpretation of this result suggests that it is the
quality of laboratory course performance rather than the quantity of
courses taken that influences test performance. In addition, the data
indicate that individuals taking more general coursework perform
better on the test. Perhaps individuals taking a broader range of
courses are likely to exhibit better test performance, overall.
In summary, for the relevant, laboratory-related subjects,
course grades rather than the number of courses taken were more
predictive of test performance. In contrast, for the less-relevant,
non-laboratory-related subjects, the number of courses taken rather
than course grades was more predictive of test performance.
100
The results regarding the correlation between amount of transfer
credit and test score should be interpreted with extreme caution. The
transcript data indicated transfer credit for some individuals but not
for others. When referring to an examinee's registry application, it
was clear that for some individuals large amounts of credit were
earned at other schools but not reflected in the primary transcript.
For this reason, straightforward interpretations of this data source
may not be possible.
When mean measures of academic performance were compared for
passing versus failing examinees, the results were generally in the
predicted direction, although not statistically significant. Passing
examinees exhibited higher GPAs and accrued more laboratory course
credit than failing examinees. Similarly, passing examinees accrued
more non-laboratory course credit than failing examinees. However,
failing examinees had a slightly higher non-laboratory GPA than
passing examinees (note the very low number of failing examinees for
which non-laboratory GPA was available).
Overall, both the correlational results and mean scores for
dichotomized test performance groups indicate validity of the MLT
certification test. This result is especially noteworthy when
considering the heterogeneous data base from which these conclusions
are derived.
Post-Examination Supervisor Ratings
Results from post-examination supervisor ratings (three_ months
after examination) supporting test validity are somewhat mixed. For
this measure, the MT test yielded better validity than the MLT test;
however, the lack of significant results for the MLT test may be
partially attributable to the low number of ratings obtainable for
this group (many MLTs were not employed three months after
examination).

101
Regarding the MT examination, four of the seven test sub-scores
significantly correlated with supervisor ratings in respective work
areas. Furthermore, test sub-scores were also shown to be related to
some supervisor ratings in other non-content related work areas
without a clear pattern. It is suggested that part of the reason for
the capricious nature of these correlational findings involves the
lack of direct correspondence between general work traits (habits or
characteristics) and specific content-related work abilities.
The high sub-test intercorrelations obtained in the present
research are not alien to competency tests in the medical laboratory
field. A large-scale medical technologist certification examination
is administered periodically by the Professional Education Service
(1988) under a contract from the United States Department of Health
and Human Services. Sub-section intercorrelations for all
administrations of this test are presented in Appendix G. As
indicated, the strong interrelationships between sub-tests noted for
the present research are consistent with results obtained on the
Health and Human Services medical technologist examination.
A clear exception to the lack of consistent results regarding
the relationship between post-examination supervisor ratings and test
sub-scores involves the MT microbiology sub-test, and to some degree,
the urinalysis sub-test. Both pre- and post-examination ratings
indicate convergent and discriminant validities for the microbiology
sub-test (which includes bacteriology and parasitology questions).
Although to a somewhat lesser degree, this pattern was also apparent
for the urinalysis work area. The chemistry, hematology, and
immunohematology areas seemed to lack the clear-cut validation
evidence exhibited by the microbiology and urinalysis sections of the
MT examination. To further enhance the interpretation of these
results, correlations between pre- and post-examination measures
102
tended to be higher for those sub-sections exhibiting the best
validity and diminished for those sub-sections showing poor validity.
One reason for the lack of patterned results for the
immunohematology sub-test may involve the heterogeneous nature of the
body of items comprising this section (which is composed of
immunology, immunohematology, serology, and blood banking items).
However, the reason for the lack of clear-cut correspondence between
performance ratings in hematology and chemistry sub-test scores,
respectively, is more difficult to assess.
Relationships between total examination score and general,
non-content-related performance aspects were assessed for both MT and
MLT tests. For the MT group, five of the six rated performance
characteristics were significantly correlated with the total test
battery score. In addition, a supervisor's overall rating of an MT
was clearly related to an examinee's total test performance. In
contrast with the MT data, the only MLT performance rating that was
related to test scores was the overall rating. All sub-areas of non
content-related laboratory performance exhibited positive correlations
with total test score, but were not statistically significant. The
differential response rates for the MT and MLT supervisor rating may
have contributed to the above results. The overall "best technician/
worst technician" dimension may be a stronger, more reliable indicator
of performance than sub-area dimensions (such as time utilization).
As with the content-related performance ratings, test
performance was dichotomized into passing and failing groups for both
MT and MLT examinees. For every dimension, passing examinees
exhibited higher mean ratings than failing examinees. However, the
only statistically significant difference appeared for the •overall"
rating. Clearly, each of the rating scales utilized contributed to
the demonstration of test validity, despite the small differences
obtained between passing and failing groups. The patterns of

differences, rather than the magnitude of differences, argue for the
validity of the test.
103
Regarding the MLT group, all but one of the dimensions (p~licy
compliance) exhibited mean differences in the predicted direction.
However, statistical significance was not achieved for any of the
relationships between global work ratings of practical performance and
test score for this group.
Construct-Related Validity
Test - Sub-Test Correlations
Despite the high degree of sub-test intercorrelation for both MT
and MLT examinations (all correlations were significant at the .001
level), sub-tests tended to be more closely related to the total test
than they did to other sub-tests. This result supports the use of
distinct, content-related, sub-tests for certifying the "generalist"
laboratory practitioner. For the MT test, the chemistry and
urinalysis sub-sections were more highly related to total test
performance than to performance in any other sub-test. Although each
of the hematology, inununohematology, and microbiology sub-sections
were more strongly related to another sub-test, relationships to the
total test were nearly as strong in every case. Scores for the MLT
examinee group exhibited a very similar pattern. Scores in chemistry,
inununohematology and urinalysis were more strongly related to overall
performance than with performance on other sub-tests, while results
for the hematology and microbiology sections were very near to the
desired pattern. Overall, given high sub-section intercorrelations,
both MT and MLT tests exhibited mixed degrees of convergent and
discriminant validity. To further investigate the reasons for high
sub-section relatedness, the results from the factor analysis are
discussed below.

104
Factor Analysis
Independent factor analyses were performed on two item samples
from the MLT examination. The analyses revealed eight and seve~
factors, respectively. However, the majority of the factors extracted
were difficult to interpret. Only three of the 15 factors consisted
of items from a single sub-test, suggesting that each sub-test is not
tapping a distinct construct. In addition, the "mixed-item" factors
contained very few items with factor loadings over .50, thus making it
very difficult to apply meaningful labels to the item groups.
Perhaps more performance observations are needed to better
define the constructs. On the other hand, perhaps the test is not
easily broken down into well defined factors because of the
interrelated nature of medical laboratory content areas. In any case,
the lack of salient factors obtained from these analyses corroborate
the results obtained from the sub-test intercorrelations: a very high
degree of commonality is evident among examination sub-tests. It is
doubtful that tests in this area are similar to tests of ability that
derive, for example, distinct verbal and mathematical abilities. If,
in fact, medical laboratory skills involve a more unitary trait, this
may involve implications as to whether a multiple-cut or total test
battery passing score is more appropriate for determining minimal
competence. At the time of the present research, no other factor
analytic studies related to medical laboratory technology
certification tests were known.
Attributions of Performance
Examinee Attributions of Test Performance
Results obtained from the examinee attribution questionnaire
suggest that there appears to be little overall relationship between
the self-attribution variables and total test performance. For the MT
group, one exception to this finding involves the significant
relationship between self-ratings of immediate effort and test

105
performance: examinees stating that inunediate effort was an important
factor affecting their test performance performed better on the test.
This result was not replicated by the MLT group however. For the MLT
group, a significant relationship between the luck variable and test
performance was noted. Those MLTs who stated that luck was an
important factor influencing their performance tended to perform less
well on the test. However, this result was not replicated by the MT
group.
Furthermore, examinees from neither group appeared to be able to
predict their own test performance, even after having answered all of
the test questions. In addition, an analysis of mean success
estimates from passing and failing examinees from each group revealed
the following: while passing MT examinees gave higher estimates of
success than failing MT examinees, the converse was true for the MLT
group. Failing MLT examinees gave higher success estimates than
passing MLT examinees as a group (both results, however, were not
statistically significant). One explanation for these outcomes could
include the fact that examinees may be unable to determine if given
questions were answered correctly or incorrectly. It appears that
neither examinee group has the ability to judge the correctness of
their answers over a 210-item test. Furthermore, the entry-level
(MLT) group exhibits a marked •overconfidence• in their performance.
The •success estimate• findings outlined above may have
implications regarding the attributional variables. Specifically, MTs
tended to be more accurate (than MLTs) regarding predictions of their
performance, and exhibited a relationship between internal
attributions and test performance. In contrast, MLTs tended to be
less accurate (than MTs) regarding predictions of their performance,
and exhibited a relationship between external attributions and test
performance. Given these findings, it is possible that experience (as

operationalized by MT versus MLT) may mediate the strengths and
directions of the obtained relationships.
106
Neither the pooling of two or four variables seemed to augment
the relationship between attributional dimensions and test
performance. However, pooling four variables did enhance the
.relationship between attributional variables and the success estimate
variable. All eight attributional variables were employed to assess
the relationship between "locus" and success estimates. For both MT
and MLT groups, examinees placing more weight on the influence of
internal factors estimated that their performance. would be better.
Weight placed on external factors showed no relationship with
estimates of success for either group. These results are particularly
interesting, considering the replication of the effect. Apparently,
examinees who feel that they personally "bring more to the test
situation" estimate that their performance will be better. However,
despite the above relationship, these factors do not appear to be
related to actual test performance.
Supervisors' Attributions of Practical Performance
Results from the analysis of MT and MLT supervisor attribution
questionnaires were mixed. For the MT group, the importance that
supervisors placed on mood, task difficulty, and luck, appeared to be
related to an MT's total score. However, none of the attributional
variables appeared to be related to total score for the MLT group. In
interpreting these results, it should be noted that the MT group had
over twice the number of ratings on which to base correlations. The
lack of significant results for the MLT group may or may not be
attributable to the low number of ratings available. Alternatively,
it is possible that different supervisors interpreted the questions
differently. For example, some supervisors may have attributed an
individual's performance to easy tasks, while others may have
attributed performance to difficult tasks. Further research might

include asking these questions using more direct, less ambiguous
wording.
107
For the MT group, both the mood and luck variables performed as
expected: the more importance that supervisors placed on mood and
luck as influencing examinees• behavior, the lower examinees' scores
·tended to be. However, the task difficulty variable did not perform
as expected: when supervisors said that task difficulty was important
in influencing examinees• practical performance, scores for examinees
tended to be lower.
To further investigate the effects of the supervisor
attributional variables, correlations between total score and the
supervisor's •overall" rating were obtained, controlling for each of
the attributional variables. For the MT group, the partial
correlations tended t~ be only marginally greater than the first-order
correlations between overall rating and test score. This result
suggests that the relationship between supervisor rating and test
performance (the predictive validity coefficient) is marginally
suppressed by the supervisors' perceptions of each of the
attributional·variables. Stated differently, a supervisor's judgment
of performance does not seem to rely heavily on any one of the
particular attributional dimensions assessed.
However, for the MLT group, the partial correlations tended to
be greater than the first-order correlations, overall. Although there
were few ratings available for the MLT group, it would seem that the
attributional dimensions assessed have a greater effect in mediating
the relationship between overall judgments of performance and test
performance.
Test Reliability
Both KR-20 and standard error of test statistics yielded
satisfactory reliability results. Reliability estimates for the
current examinations were compared to statistics obtained from four
parallel forms. Both MT and MLT tests appear to satisfy the test
reliability prerequisite necessary for considering validity.
Utility of Validation Measures Employed in the Present Research:·
Implications for Researchers
108
One of the primary purposes of the present research included the
evaluation of the usefulness of the methods employed. As it has been
noted that conducting validation research in the certification context
may be difficult, or even unfeasible, an effort has been made to
highlight the measures that are most and least useful.
Content-Related Measures
Perhaps the most straightforward and reliable source of content
validity information involves data from individuals who review actual
test questions. However, this type of validation data may be
particularly difficult to obtain, given test security considerations.
For example, it may be neither feasible nor desirable (for test
security reasons) to allow numbers of non-examinees to review actual
test forms. On the other hand, ratings obtained from individuals who
have developed, rated, or classified the test items before may result
in spuriously high validity coefficients. The test validator and the
directors of the certification program must carefully weigh the issues
of security against the integrity of the content validation outcomes
that are obtained. Depending upon test and item disclosure policies,
individual agencies may be more or less receptive to having
"outsiders" review their test item pool.
In addition to weighing the above issues, steps may be taken
which may help to reduce potential biases associated with test
committee reviews of items. In particular, time should elapse between
test construction and content reviews, other non-judged test items
should be considered between test construction and content reviews,
and the fact that groups of items actually comprise a test may be
109
disguised. Despite the measures employed to reduce possible biases in
content-evaluations of items, a high degree of content classification
consistency was obtained from the present research. Unfortunat~ly, it
may not be possible to separate the effects of raters having worked on
an item before, from unbiased ratings.
A second source of content-related validation data involved an
analysis of tasks or competencies on which examinations are based. To
conduct this analysis, the committee that prepares certification
examinations first developed a comprehensive list of competencies that
it believed represented the laboratory practitioner role. The
competencies were designed to reflect the task and knowledge areas
that should be represented by an examination. Practicing
laboratorians were then asked to rate specific tasks, knowledge areas,
and work areas along several dimensions.
In the present research, the results from the task analysis
suggested that different proportions of items would be appropriate in
some content-related sub-categories of the tests. Greater differences
in item proportions were noted for the MT group than for the MLT
group. On this basis, the examination development conunittee would be
advised to carefully consider the results of the time-spent dimensions
of the task analysis and to judge whether or not the test
specifications should be adjusted to accommodate for the findings.
In addition, importance ratings for the work areas and specific
tasks should be reviewed as well. The Committee should ensure that
competencies tested on the examination are rated as "important• by the
practitioner sample. Several of the tasks and work areas evaluated in
the present research did reveal discrepancies between practitioner
ratings of importance and the number of items included in the tests.
Tasks rated low in importance should be carefully considered in terms
of their use in competency assessment.

110
The indirect technique of evaluating the content-appropriateness
of tests is intimately related to examination development. The task
analysis approach is the first step that many test constructors
employ. Although a 30-40% response rate may be expected for similar
populations (using a mail survey methodology), it is essential to
.obtain feedback from practitioners regarding the content
appropriateness of a test. In addition, in the absence of direct
examination reviews, the mail-survey task verification may be the most
practical and effective way of obtaining content validation
information.
Criterion-Related Measures
A primary difference emerged between the MT and MLT groups in
terms of obtaining criterion-related validation data. Several
practical issues limited the amount of MLT data that was obtainable,
while the MT data was more complete. The amount of time that elapsed
both before and after examination was a factor contributing to the
differential sizes of the databases. Regarding pre-examination
supervisor ratings, most of the MLT group had not completed their
clinical internship three months after examination. This situation
occurred because examinees tended to take the MLT test after
completing course work, rather than after completing the entire degree
program. In addition, post-examination ratings were limited because
of the relatively large numbers of MLTs who were not employed three
months after certification (25 out of 70, or 36% of the sampled MLT
group reported that they were not employed three months after
testing). It is suggested that more time should elapse after a test
is administered, before post-examination validation measures are
considered for entry-level practitioners.
In contrast, a high proportion of both pre- and post-examination
performance ratings were obtained for the MT group. The ratings of
performance in particular content areas were useful criteria by which
111
to compare test sub-section scores. Discriminant and convergent
validities may also be assessed by these measures. In addition, an
overall "best/worst technician• scale appeared to order examinee_s in a
manner fairly consistent with total test score. Also of utility, were
ratings of work performance in terms of non-content related measures
(quantity of work, policy compliance, etc.). However, in the present
research, most individuals seemed to be rated either •very good" or
"excellent" in these areas, thus restricting the range of values for a
correlational analysis. Other studies may not encounter this
situation, however.
Perhaps the most difficult aspect involved with collecting post
examination supervisor ratings involves tracking down an examinee's
place of employment. However, once contact is made with a supervisor,
there is a very good chance that usable validation data will be
obtained.
In addition to correlational analyses of test performance and
practical performance, it is also useful to partition the examinee
group in meaningful ways and consider overall group differences. For
example, practical performance comparisons of passing and failing
examinees are of great utility in the validation process. Through
this strategy, the appropriateness of the cut-score and its impact on
selection decisions may be addressed.
Also of utility is a consideration of examinee academic
performance. While transcript data may be the most reliable source of
academic performance data, the test validator must consider the
problem of data source heterogeneity. It is often difficult to place
all transcript information onto a conunon framework. Perhaps the best
way to approach this difficulty is to perform two complete reviews of
the entire body of transcript data. The first review yields only a
detailed set of rules for addressing all transcript types. GPAs and
credit hours should be calculated during the second review. Despite

112
the number of grading systems used by schools, useful validation data
can be gained from this data source.
Construct-Related Measures
A primary method of obtaining construct validation data involved
the assessment of the interrelationships between sub-test and total
battery scores. While an extremely high degree of sub-scale
intercorrelation was apparent for the current examinations, a
consideration of the patterns of relationships was most useful. This
strategy is a practical method for assessing one aspect of construct
validity, and could easily be implemented by most test validators.
An additional method of assessing construct validity included a
factor analysis of examinee performance on a sample of items. The
utility of this strategy is partially contingent upon the number of
examinees taking a particular test. Furthermore, it is suggested that
a factor analysis of item samples may not be the most viable method of
assessing construct validity on this type of examination. Clearly, in
the present research, each sub-test of the examination did not define
a distinct construct. It is possible that a complex underlying factor
structure may_ exist to define the constructs actually tested.
Alternatively, possibly one factor (knowledge/competency) is the only
construct being assessed. However, the results from the present
research do not answer this question.
It is suggested that better criteria for measuring construct
validity on this type of test should be employed. For example, the
use of behavioral measures might be considered in the construct
validation process. However, the measures employed in the present
research, and the assumptions made regarding the factors comprising a
test of laboratory competence do not appear to be relevant for MT and
MLT groups. The findings from the factor analyses do not explain what
the test is tapping. ·Furthermore, if only one factor is being
addressed by the tests, there may be little theoretical justification

113
for adopting a multiple-cut score approach (in which examinees must
pass each and every sub-section independently) for test scoring, as
opposed to a total test battery scoring approach. Additional research
is required to address this issue satisfactorily.
Sunnnary
A comprehensive validation study was conducted for two levels of
laboratory practitioner certification examinations (entry-level MLT,
and experienced MT). Partially derived from criteria outlined by the
National Conunission for Health Certifying Agencies, the content,
criterion-related, and construct validities of the MLT test were
assessed. Several parallel measures were obtained for the MT test.
The research involved a task analysis of working laboratory
practitioners, content classifications of examination items by
subject-matter experts, pre-examination internship supervisor
performance ratings, post-examination supervisor performance ratings,
analyses of interrelationships between test and sub-test performance,
and a factor analysis of test item performance. In addition, the
attributions that examinees make regarding their examination
performance, and the attributions that supervisors make regarding a
practitioner's job performance were considered. The judgment of
"adequate" test validity is subjective to some extent. Overall
considerations of validity appear to involve the expectations of how
the data should array, and relative comparisons of the data with the
validator's expectations. The majority of measures obtained in the
present research were consistent with predictions based on the
assumption of a "valid" test. Supervisors' overall ratings of both MT
and MLT examinees were related to overall test performance. One
exception to the positive findings involved the relationships between
content-related work area performance and scores on respective sub
tests of the examinations. While the total test score seemed to
relate to most performance measures, it is possible that sub-tests,

114
taken one at a time, may lack the power to predict performance in all
respective areas. The outcome of the present research also suggests
which of the validation measures may be more effective, useful,- and
practical for other test validators. The present research applies not
only to the content-based area of medical laboratory practice.
Investigators in other areas may wish to consider the strategies
adopted here for assessing the validity of the tests that they
construct and administer.
REFERENCES
American Educational Research Association, American Psychological Association, National Council for Measurement in Education .. (1985). Standards for educational and psychological testing. Washington, DC: American Psychological Association.
American Society for Medical Technology. (1973). ASMT position paper. Differentiation among MT, MLT, and CLA expected capabilities at career entry. American Journal of Medical Technology, 12.. 362-364.
American Society for Medical Technology. (1976). Competence delineation committee progress report. Report given to the American Society for Medical Technology at Annual Meeting in Chicago.
115
Bradley, D.R., Bradley, T. D., McGrath, S. G., & Cutcomb, S. D. (1979). Type I error rate of the chi-square test of independence in R x C tables that have small expected frequencies. Psychological Bulletin, 86, 1290-1297.
Cooper, H. M., & Burger, J.M. (1980). How teachers explain students'academic performance: A categorization of free response academic attributions. American Educational Resource Journal, 17, 95-109. ~
D'Costa, A. G. (1986). The validity of credentialing examinations. Evaluation and the Health Professions, .2,, 137-169.
Fidler, J. R. (1988). Medical assistants: An analysis of tasks performed in practical settings. Evaluation and the Health Professions, 11, 358-378.
Fleiss, J. L. (1971). Measuring nominal scale agreement among many raters. Psychological Bulletin, 76, 378-382.
Hambleton, R. K. (1984). Validating the test scores. In R. Berk (Ed.), A guide to criterion-referenced test construction. Baltimore: Johns Hopkins Press.
Hecht, K. A. (1979). Current status and methodological problems of validating professional licensing and certification examinations. In M. A. Budra and J. R. Saunders (Eds.), Practices and problems in competency-based education. Washington, DC: National Council on Measurement in Education.
Hedl, J. J. (1988). Simulated grading decisions of allied health educators part II: Variations in causal attributions. Journal of Allied Health, 17, 153-163.
Hedrick, w., & Fiene, M.A. (1975). Task-oriented job restructuring and curriculum development. American Journal of Medical Technology, 41, 50-55.
Jeff, L. H., & West, T. T. (1988). Prerequisite courses as predictors of success in a university-based medical technology program. Clinical Laboratory Science, !,, 51-55.

116
Kettering Medical Center, School of Medical Technology. (1975). Competency identification for levels of laboratory workers - A summary of the Kettering Medical Center Grant Project. Kettering, Ohio: The School.
Lundgren, E. J. (1968). Predicting student success in medical technology and clinical laboratory assistant programs. American Journal of Medical Technology, .di, 349-361.
Lunz, M. E., Gaines, A. R., & Saylor, R. (1986). Concurrent validity · of the ASCP Board of Registry medical technologist certification
examination. Laboratory Medicine, 17, 96-99.
Lynch, B. L. (1976). Clinical evaluation: rating scale development and use - A prograuuned guide. Gainesville: University of Florida Center for Allied Health Instructional Personnel.
Maynard, D., Larimore, D., & Seation, J. (1974). A student data base: an aid to student selection, program evaluation, and management decision making. Journal of Allied Health, l,, 114-117.
Mccure, C. D., & Rausch, V. A. (1969). Vocational interests of premedical technology students. American Journal of Medical Technology, 35, 634-651.
Messick, S. (1981). Evidence and ethics in the evaluation of tests. Educational Researcher, 9-20.
Morgan, M. K., & Irby, D. M. (1978). Evaluating clinical competence in the health professions. St. Louis: The c. v. Mosby Company.
National Couunission for Health Certifying Agencies. (1981). Guidelines for membership criteria: Report on validity. Washington, DC: The Couunission.
National Couunittee for Careers in Medical Laboratories. (1973). Partial analysis made of laboratory task study results. Laboratory Medicine, ,i, 20-21.
Navy Medical Department. (1972). Job analysis techniques for restructuring health manpower education and training in the navy medical department. Technomics, Inc.
Professional Examination Service. (1980). Correlation of performance on clinical laboratory proficiency examinations with performance in clinical laboratory practice. New York: Professional Examination Service.
Professional Examination Service. (1988). The development and administration of clinical laboratory technology proficiency examinations. New York: Professional Examination Service.
Rifken, s. M., Maturen, A., & Bradna, J. (1981). Uniform admissions system for a medical laboratory sciences program. American Journal of Medical Technology, 47, 489-495.
Shimberg, B. (1981). Testing for licensure and certification. American Psychologist, ]&,, 1138-1146.
SPSS Inc. (1983). SPSSx User's Guide. New York: McGraw-Hill Book Company.

Weiner, B. (1980). A theory of motivation for some classroom experiences. In D. Garlitz (Ed.), Perspectives on attribution research and theory. Cambridge, MA: Ballinger.
117
Weiner, B. (1985). An attributional theory of achievement motivation and emotion. Psychology Review, 92, 548-573.

APPENDIX A
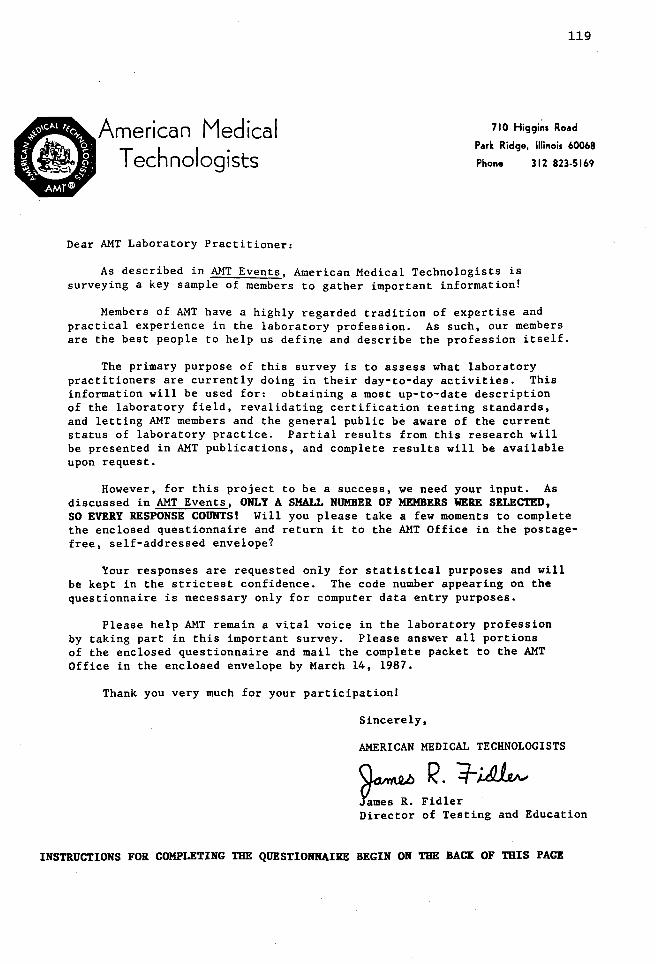
119
American Medical Technologists
710 Higgins Road
Park Ridge, Illinois 60068
Phone 312 823-5169
Dear AMT Laboratory Practitioner:
As described in AMT Events, American Medical Technologists is surveying a key sample of members to gather important information!
Members of AMT have a highly regarded tradition of expertise and practical experience in the laboratory profession. As such, our members are the best people to help us define and describe the profession itself.
The primary purpose of this survey is to assess what laboratory practitioners are currently doing in their day-to-day activities. This information will be used for: obtaining a most up-to-date description of the laboratory field, revalidating certification testing standards, and letting AMT members and the general public be aware of the current status of laboratory practice. Partial results from this research will be presented in AMT publications, and complete results will be available upon request.
However, for this project to be a success, we need your input. As discussed in AMT Events, ONLY A SMALL NUMBER OF MEMBERS WERE SELECTED, SO EVERY RESPONSE COUNTS! Will you please take a few moments to complete the enclosed questionnaire and return it to the AMT Office in the postagefree, self-addressed envelope?
Your responses are requested only for statistical purposes and will be kept in the strictest confidence. The code number appearing on the questionnaire is necessary only for computer data entry purposes.
Please help AMT remain a vital voice in the laboratory profession by taking part in this important survey. Please answer all portions of the enclosed questionnaire and mail the complete packet to the AMT Office in the enclosed envelope by March 14, 1987.
Thank you very much for your participation!
Sincerely,
AMERICAN MEDICAL TECHNOLOGISTS
Fidler Director of Testing and Education
INSTRUCTIONS FOR COMPLETING THE QUESTIONNAIRE BEGIN ON THE BACK OF THIS PAGE
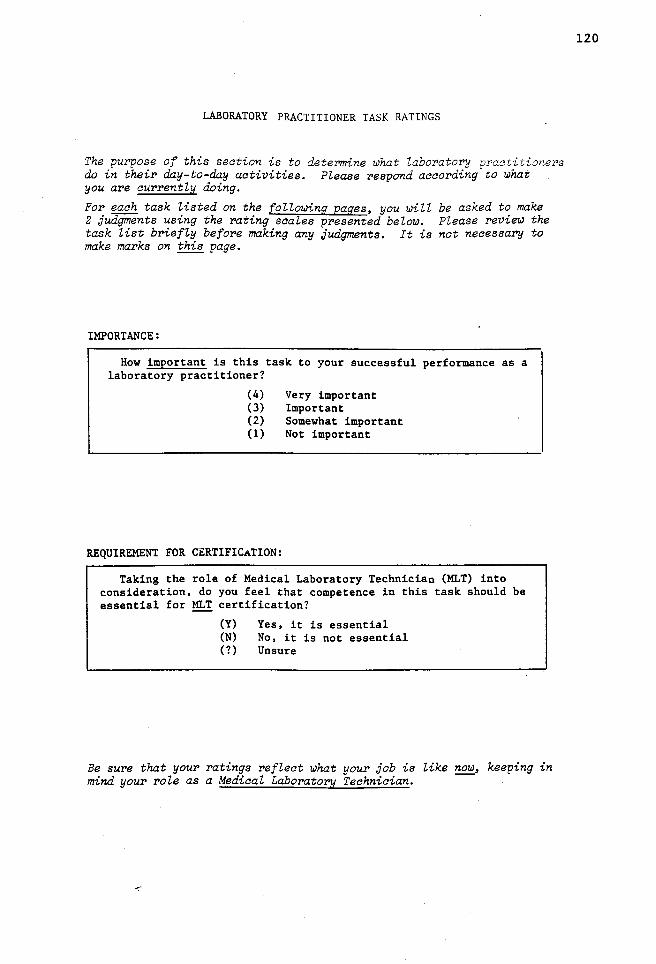
LABORATORY PRACTITIONER TASK RATINGS
The purpose of this section is to detel'ITline what laboratory practitioners do in their day-to-day activities. Please respond according to what you are currently doing.
For each task listed on the following pages, you will 2 judgments using the rating scales presented below. task list briefly before making any judgments. It is make marks on this page.
IMPORTANCE:
be asked to make Please review the not necessary to
How important is this task to your successful performance as a laboratory practitioner?
(4) Very important (3) Important (2) Somewhat important (1) Not important
REQUIREMENT FOR CERTIFICaTION:
Taking the role of Medical Laboratory Technician (MLT) into consideration, do you feel that competence in this task should be essential for MLT certification?
(Y) Yes, it is essential (N) No, it is not essential (?) Unsure
Be sure that your ratings reflect what your job is Zike now, keeping in mind your role as a Medical Laboratory Technician.
120
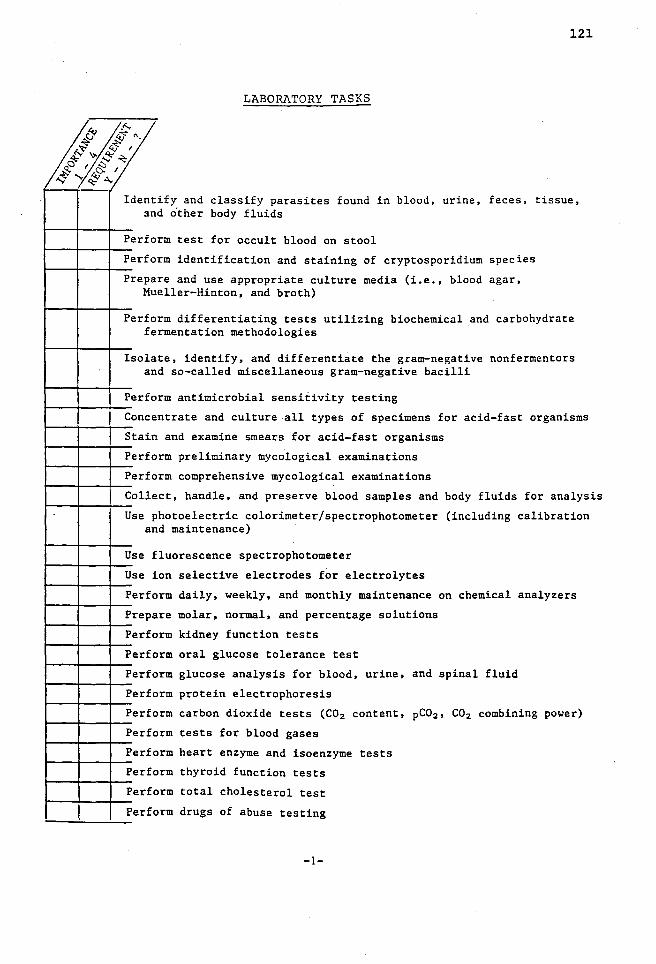
121
LABORATORY TASKS
~r (j ~ "· ~ f;J- I ;; ~~~
E<.Cl1,f5::, -$"~A.
'----
Ident :m
ify and classify parasites found in blood, urine, feces, tissue, d o"ther body fluids
Perfo rm test for occult blood on stool
Perf o
Pre pa Mu
rm identification and staining of cryptosporidium species
re and use appropriate culture media (i.e., blood agar, eller-Hinton, and broth)
Perfo fe
rm differentiating tests utilizing biochemical and carbohydrate rmentation methodologies
Isola an
te, identify, and differentiate the gram-negative nonfermentors d so-called miscellaneous gram-negative bacilli
Perf o rm antimicrobial sensitivity testing
Conce ntrate and culture all types of specimens for acid-fast organisms
Stain and examine smears for acid-fast organisms
Perfo rm preliminary mycological examinations
Perfo rm comprehensive mycological examinations
Colle
Use p
ct, handle, and preserve blood samples and body fluids for analysis
hotoelectric colorimeter/spectrophotometer (including calibration an
Use f
Use i
Perf o
Pre pa
Perf o
Perf o
Perf o
Perfo
Perfo
Perfo
Perf o
Perfo
d maintenance)
luorescence spectrophotometer
on selective electrodes for electrolytes
rm daily, weekly, and monthly maintenance on chemical analyzers
re molar, normal, and percentage solutions
rm kidney function tests
rm oral glucose tolerance test
rm glucose analysis for blood, urine, and spinal fluid
rm protein electrophoresis
rm carbon dioxide tests (C02 content, pC0 2 , C02 combining power)
rm tests for blood gases
rm heart enzyme and isoenzyme tests
rm thyroid function tests
Perfo rm total cholesterol test
Perfo rm drugs of abuse testing
-1-

~r ~"·
I ;; ~ f?..o
~~--Perf o
Perfo
Perfo
Perf o
Re lat
Perf o
Perf o
Perfo
Perfo
Perfo
Perfo
Ident
I dent
Ident
I dent
Perf o
Perfo
Perf o
Perf o
rm.RIA test
rm EIA test
122
rm necessary quality control functions in the clinical laboratory
rm physical, chemical, and microscopic urinalysis
e abnormal urinary findings to disease states
rm specific gravity test
rm protein test
rm ketone test
rm leukocyte esterase test
rm bilirubin test
rm special tests (i.e., porphyrins, SHIA, VMA, steroids, etc.)
ify casts found in urine
ify crystals found in urine
ify spermatozoa in urine, and explain their significance
ify cylindroids in urine, and explain their significance
rm Bence Jones protein test
rm hemoglobin determinations using hemoglobin pipette
rm hemoglobin determinations using Unopette®
rm MCV, MCH, and MCHC using mathematical formulas
Cal cu late leukocytes and erythrocyte counts using mathematical formulas
rm manual thrombocyte count using Rees-Ecker method Perfo
Perfo
Make
Perfo
Corre
Perfo
Perfo
Perfo
Perfo ab
Perfo
Perfo
rm manual thrombocyte count using Unopette®
blood film (smear)
rm WBC differential counts
ct a leukocyte count in the presence of nucleated red blood cells
rm proper maintenance and quality control on cell counters
rm a direct eosinophil count and Thorn test
rm body fluid counts
rm a sperm count including examination for motility, morphological normalities, appearance, and consistency
rm quality control for all immunological tests
rm test employing radialimmunodiffusion
Perf o rm quality control for all procedures related to microbiology
-2-

j(;/(/ ~I ~~~ & I ~~
Perf o
Perf o
Perfo
Perfo
Perf o
Perfo
Perfo
Perfo
Perfo
Perfo
Perfo
Perf o
Use t
rm partial thromboplastin time
rm antinuclear antibody test (ANA)
rm bacterial antigen detection in cerebral spinal fluid
rm a Lee White coagulation time
rm a fibrin degredation product or fibrin split product test
rm fibrinogen test
rm immunohematological enzyme tests
rm direct or forward blood grouping
rm Rh0 (D) typing
rm genotyping
rm crossmatch procedure
rm tests to detect cold agglutinins
Perfo
ests to elute antibodies from red blood cells
rm therapeutic phlebotomy
123
Maint
Perfo
ain proper records of all quality control and procedures in blood bank
rm procedures for transfusion reaction investigation
Please use the blank space below to add any tasks you feel are especially important that were not included in the above list:
-3-

124
ASSESSMENT OF KNOWLEDGE AREAS
In order to perform the above clinical laboratory tasks, background knowledge is often required. For each of the areas below, please indicate how necessary that knowledge is for competent laboratory performance.
NECESSITY SCALE
(4) Complete knowledge is necessary (3) Some knowledge is necessary (2) Minimal knowledge is necessary (1) No knowledge is necessary
0 ~ ~~
cf' / ~~ "- Knowledge Areas
Liver function
Electrolytes and acid-base balance
Kidney anatomy
Urine formation
Physical and chemical properties of urine
Hemopoiesis(such as blood functions, etc.)
Principles of immunological examination
Principles of hemostasis
Immunohematological concepts
Antigens
Blood components and their administration
Blood bank operations
SUPPLEMENTARY INFORMATION
Please check the appropriate response to each question.
How many years have you worked as a laboratory practitioner?
less than 3 years 4-8 9-13 14-18 19 years or more
Which of the following best describes your place of employment?
hospital physician's office(s) reference laboratory independent clinical laboratory other (please specify):~~~~~~~~~~~~~~~~~~~~-
-4-

125
ASSESSMENT OF WORK AREAS
The general work areas below have been suggested to cover tasks carried out by laboratory practitioners. These areas were defined in detail in the previous sections. ?lease es~imate the percentage of time you presently spend carrying out activities in each area, and indicate the importance of each area to your success as a laboratory practitioner.
PERCENT OF TIME
In the "Percent of Time" column, enter a number (or zero) on each line. Make sure your column of numbers adds up to 100.
IMPORTANCE SCALE
(4) Very important (3) Important (2) Somewhat important (1) Not important
Work Area Percent of
Time Importance Chemistry
Bloodbanking
Immunohematology
Microbiology
Parasitology
Mycology
Virology
Immunology-Serology
Urinalysis
Hematology
Laboratory Safety
Hemostasis
%
%
%
%
%
%
%
%
%
%
%
%
= 100%
PLEASE USE THE BLANK SPACE BELOW FOR ANY COMMENTS YOU MAY HAVE:
YOUR NAME (optional):
THANK YOU
-5-

126
•
American Medical Technologists
.
710 Higgins Road
Park Ridge, Illinois 60068
Phone AC 312 823-5169
Dear AMT Laboratory Practitione~:
About two weeks ago, you should have received a questionnaire from AMT asking you to participate in an important survey. This survey concerns the types of tasks that laboratory practitioners are performing.
As all responses are kept confidential, we do not know who has or has not returned the questionnaire.
If you have already responded, THANK YOU VERY MUCH for your cooperation. Your input is an important contribution to our research.
If you have not yet responded, please return the completed questionnaire as soon as possible in the self-addressed postage-paid envelope that was provided. As each response is valued, we would appreciate having your input to include in the final results. ~~
Thank you for your support and participation.
Sincerely, AMERICAN MEDICAL TECHNOLOGISTS
"Pride of the Profession" Incorporated in 1939

APPENDIX B
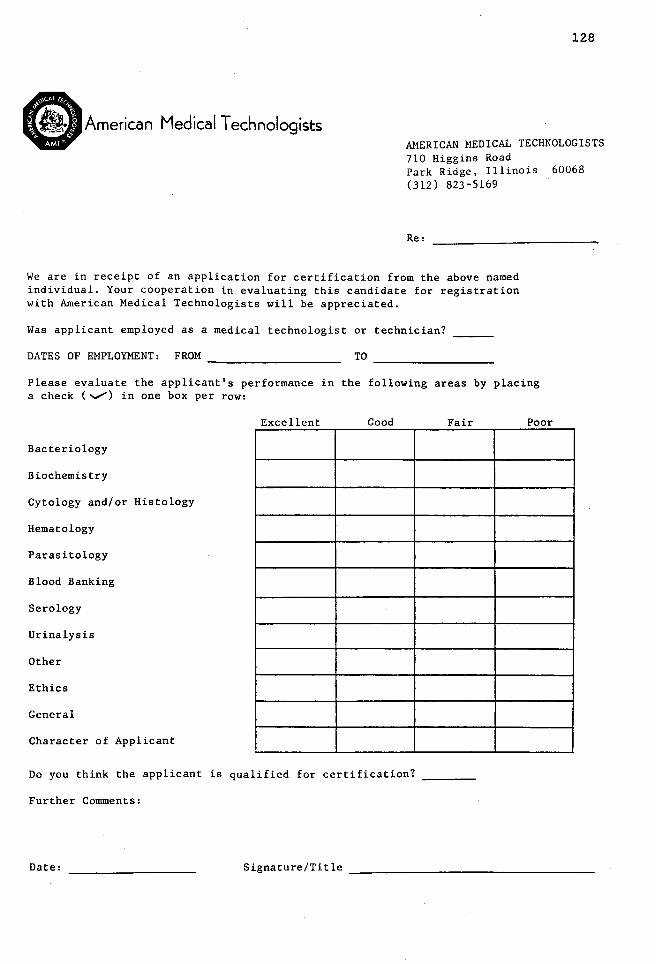
128
American Medical Technologists AMERICAN MEDICAL TECHNOLOGISTS 710 Higgins Road Park Ridge, Illinois 60068 (312) 823-5169
Re:
We are in receipt of an application for certification from the above named individual. Your cooperation in evaluating this candidate for registration with American Medical Technologists will be appreciated.
Was applicant employed as a medical technologist or technician?
DATES OF EMPLOYMENT: FROM ~~~~~~~~~~-
Please evaluate the applicant's performance in the following areas by placing a check(""""") in one box per row:
Excellent Good Fair Poor
Bacteriology
Biochemistry
Cytology and/or Histology
Hematology
Parasitology
Blood Banking
Serology
Urinalysis
Other
Ethics
General
Character of Applicant
Do you think the applicant is qualified for certification?
Further Comments:
Date:

APPENDIX C

.American Medical Technologists
Dear AMT Examinee:
Our records indicate that you sat for the AMT Certification Examination during the November 1987 to February 1988 administration period. We are currently in the process of gathering follow-up information on all individuals who took a certification examination during that period.
We would like to ask your assistance by completing the form below, and and returning it to AMT via the enclosed postage-paid envelope WITHIN ONE WEEK FROM TODAY. Your cooperation is greatly appreciated.
Your Name
Address
City
Current Place of Employment
Address
City
State
State
Name of Laboratory Director, or Supervisor
------
Date you started working in the laboratory
Zip __
Zip __ _
~ Check this box if you are NOT currently employed in a laboratory-related job.
Thank you very much.
130

APPENDIX D

.American Medical Technologists
Dear Laboratory Supervisor:
Our records indicate that you (or a supervisor at your facility) provided employment verification for prior to their taking the American Medical Technologists certification examination. We are now gathering follow-up information on all examinees who took a test during a given period of time.
If the above named individual is still employed at your facility, we would greatly appreciate your assistance in completing the brief evaluation form that is attached WITHIN 10 DAYS. The enclosed, self-addressed envelope may be used for returning your response.
Also enclosed, is a second identical rating form and return envelope. If there is another supervisor at your facility who is familiar with the performance of the above individual, please give the additional form and envelope to that supervisor and ask that he or she complete and return it. All responses are ~trictly confidential.
132
If is no longer employed at your facility, please check the box below and return this cover sheet to American Medical Technologists in the enclosed envelope.
Thank you very much for providing this most important information.
American Medical Technologists
[] I have completed the enclosed rating form.
[] The above named individual no longer works at my facility. He or she is now working at (address, if known):
I Date Signature I Certification Title

LABORATORY PRACTITIONER RATING FORM
Think of the performance of during the last three months. Using the scale below, please rate this individual in terms of each of the areas presented. For each area, place a check (v") in the appropriate box.
PERFORMANCE LEVELS
EXCELLENT: Significantly surpasses standards. Employee's performance with respect to a skill is extraordinary; the best possible to be attained. Contribution to the department is significant.
VERY GOOD: Exceeds standards. Employee's performance exceeds satisfactory level.
AVERAGE:
FAIR:
POOR:
N/A:
Work Area
Improvement and achievement approach the best possible level.
Employee meets objectives, requirements, and expectations that are normally attained for this position. This rating represents good performance, and is the basic standard for rating any skill. Employee needs minimal amount of counsel, guidance, and supervision.
Employee does not meet objectives, requirements, and expectations that are normally attained for this position. Probation indicated unless improvement is made.
Employee's performance is deficient enough to justify release from present job unless improvement is made.
Not applicable to the employee being evaluated.
Excellent Very Good Average Fair Poor
Bacteriology
Parasitology
Cytology/Histology
Biochemistry
Hematology
Blood Banking
Serology
Urinalysis
Other:~~~~~-
Ethics
Character
Overall Rating
133
N/A
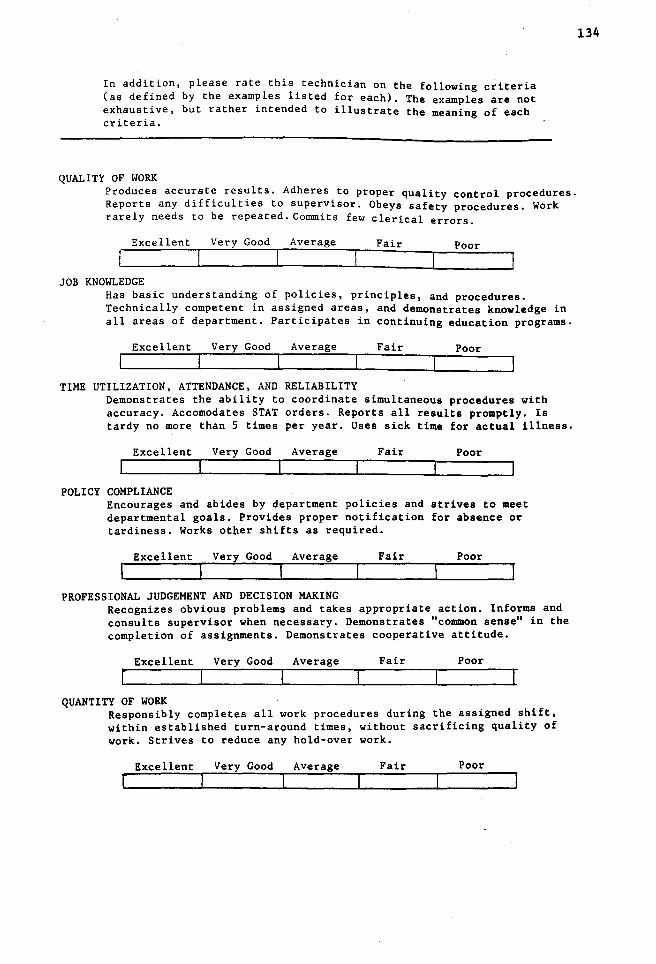
In addition, please rate this technician on the following criteria (as defined by the examples listed for each). The examples are not exhaustive, but rather intended to illustrate the meaning of each criteria.
QUALITY OF WORK Produces accurate results. Adheres to proper quality control procedures. Reports any difficulties to supervisor. Obeys safety procedures. Work rarely needs to be repeated. Commits few clerical errors.
Excellent Very Good Average Fair Poor
JOB KNOWLEDGE Has basic understanding of policies, principles, and procedures. Technically competent in assigned areas, and demonstrates knowledge in all areas of department. Participates in continuing education programs.
Excellent Very Good Average Fair Poor
TIME UTILIZATION, ATTENDANCE, AND RELIABILITY Demonstrates the ability to coordinate simultaneous procedures with accuracy. Accomodates STAT orders. Reports all results promptly. Is tardy no more than 5 times per year. Uses sick time for actual illness.
Excellent Very Good Average Fair Poor
POLICY COMPLIANCE Encourages and abides by department policies and strives to meet departmental goals. Provides proper notification for absence or tardiness. Works otper shifts as required.
Excellent Very Good Average Fair Poor
PROFESSIONAL JUDGEMENT AND DECISION MAKING Recognizes obvious problems and takes appropriate action. Informs and consults supervisor when necessary. Demonstrates "common sense" in the completion of assignments. Demonstrates cooperative attitude.
Excellent Very Good Average Fair Poor
QUANTITY OF WORK Responsibly completes all work procedures during the assigned shift, within established turn-around times, without sacrificing quality of work. Strives to reduce any hold-over work.
Excellent Very Good Average Fair Poor
134

135
OVERALL RATING Taking into consideration the "best" and "worst" technicians that you have encountered, how would you rate the overall performance of this technician during the LAST THREE MONTHS ? (circle the appropriate number)
POOR
1 2 3 4
AVERAGE
5 6 7 8
EXCELLENT
9
To what degree do you believe the following factors may have influenced this technician's on-the-job performance? Indicate the importance of these factors by circling the appropriate number on EACH line. Use the scale below:
0 Not at all important 1 Of little importance 2 Somewhat important 3 Important 4 Extremely important
MOOD- The technician's mood.
TYPICAL EFFORT- The amount of effort the technician usually puts into any task.
TASK DIFFICULTY- The difficulty of the tasks that the technician performs.
LUCK-How chance factors affect the technician's performance.
ABILITY- The ability that the technician has regarding laboratory technology.
SUPERVISOR INFLUENCE- The types of individuals who supervise the technician.
UNUSUAL HELP FROM OTHERS- The help (or support) the technician typically receives from others.
(over)
0
0
0
0
0
0
0
1 2 3
1 2 3
1 2 3
1 2 3
1 2 3
1 2 3
1 2 3
10
4
4
4
4
4
4
4

OTHER COMMENTS
In the blank space below, please describe any other factors that you feel may influence this technician's on-the-job performance.
You may also make any additional comments regarding the technician's general performance.
THANK YOU VERY MUCH for your assistance in providing this information.
136
Please forward this form to American Medical Technologists (710 Higgins Road, Park Ridge, Illinois, 60068) via the enclosed, postage-paid envelope.
I
Date Signature I Certification Title

137
•
American Medical Technologists
.
710 Hi99in1 Road
Park Rid9e, l_llinois 60068
Phone AC 312 823-5169
Dear Laboratory Supervisor:
At some time within the past two weeks, you should have received a yellow "Laboratory Practitioner Rating Form" which asked you to rate the work performance of ~~~~~~~~~~~~~~~~
Our records show that we have not yet received your reply.
If you have already mailed the rating form to the AMT Office, your assistance is greatly appreciated. If you have not yet sent in the form, please cQmplete and mail it to AMT WITHIN THE NEXT FOUR DAYS if possible.
Please return the form even if the above named individual is no longer employed at your facility. If you did not receive a form please notify our office and a copy will be mailed to you.
Thank you very much for providing AMT with this most important information. We appreciate your time and effort in evaluating this practitioner.
AMERICAN MEDICAL TECHNOLOGISTS
"Pride of the Profession" Incorporated in 1939

APPENDIX E

139
.American Medical Technologists
Data entry code
MT and MLT Examinee Questionnaire
In an effort to maintain high standards in the laboratory technology field, American Medical Technologists periodically conducts research regarding the examinations that it administers. In assisting our research effort, we would ask your cooperation by taking two minutes to complete this brief questionnaire.
Although your participation is optional, your input would be highly valued. Please be assured that the information that you provide on this sheet will not affect the outcome of your examination in any way. In addition, your responses are entirely anonymous: the number in the upper right-hand corner of this page will be used for data-coding purposes only. Results will not be identified by using your name.
Please respond to each item below, and place this questionnaire in your examination packet before returning it to the proctor.
1) How well do you think you did on the examination today? (circle one)
Very Likely Failed
Don't Know
Very Likely Passed
-3 -2 -1 0 +l +2 +3
2) To what degree do you believe the following factors may have influenced how well you did on the exam? Indicate the importance of these factors by circling the appropriate number on each line. Use the scale below:
0 Not at all important 1 Of little importance 2 Somewhat important 3 Important 4 Extremely important
Mood - The mood I'm in today.
Typical Effort - The amount of effort that I usually put into any task.
Task Difficulty - The difficulty of the exam I took today.
Luck - How luck affected my test performance today.
IDDBediate Effort - The amount of effort that I put in prepar-
0
0
0
0
ing for, and taking this exam. 0
(OVER, PLEASE)
1 2 3
1 2 3
1 2 3
1 2 3
1 2 3
4
4
4
4
4
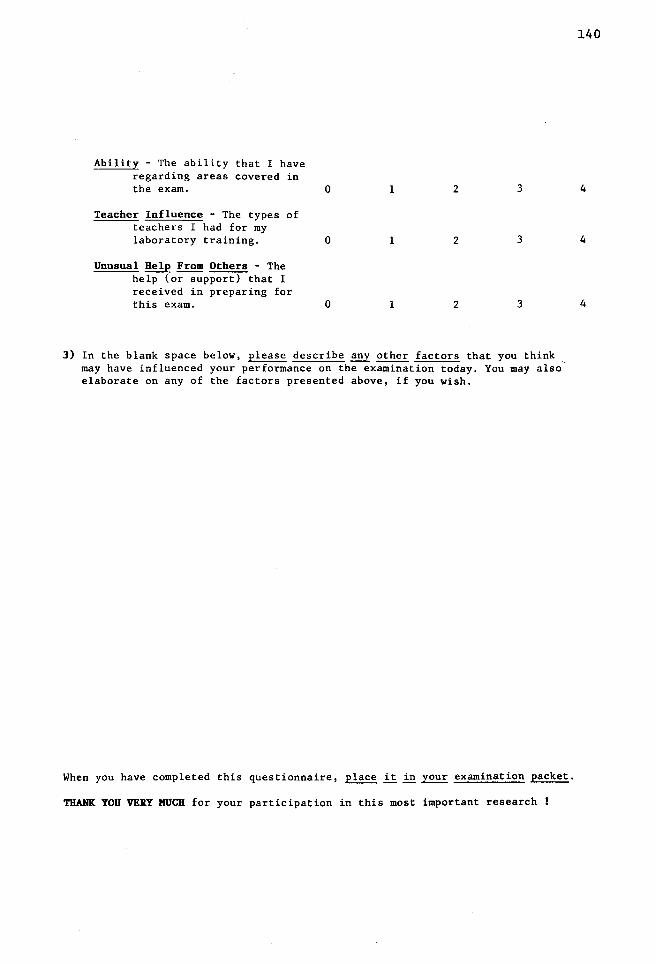
Ability - The ability that I have regarding areas covered in the exam. 0 1 2 3
Teacher Influence - The types of teachers I had for my laboratory training. 0 1 2 3
Unusual Help From Others - The help (or support) that I received in preparing for this exam. 0 1 2 3
3) In the blank space below, please describe ~ other factors that you think , may have influenced your performance on the examination today. You may also elaborate on any of the factors presented above, if you wish.
When you have completed this questionnaire, place it in your examination packet.
THANK YOU VERY MUCH for your participation in this most important research !
140
4
4
4

APPENDIX F

Mean Requirement for Certification, Time Spent, and Imoortance Ratings for Combined MLT Respondents
Microbiology Tasks
ify and classify parasites found in blpod, urine, feces, tissue, and other body fluids
re and examine stool for fats
rm test for occult blood in stool
re and stain permanent smears for ova and parasites using the iron hematoxylin and
rome methods
rm identification and staining of cryptosporidium speces
re, stain, and examine bacterial smears
re and use appropriate culture media (I.e., blood agar, Mueller-Hinton, and broth)
rm differentiating tests utilizing biochemical and carbohydrate fermentation me~hodologies
te and identify the gram-positive cocci
te and identify the gram-positive bacilli
te and identify the gram-negative cocci
te and identify the gram-negative enterobactereacease
te, identify, and differentiate the gram-negative nonfermentors and so-called
llaneous gram-negative bacilli
rm antimicrobial sensitivity testing
re specimens (bloQd, urine, throat, etc.) utilizing appropriate media
ntrate and culture all types of specimens for acid-fast organisms
and examine smears for acid-fast organisms
cultures using type-specific typing sera
I-'
"" N
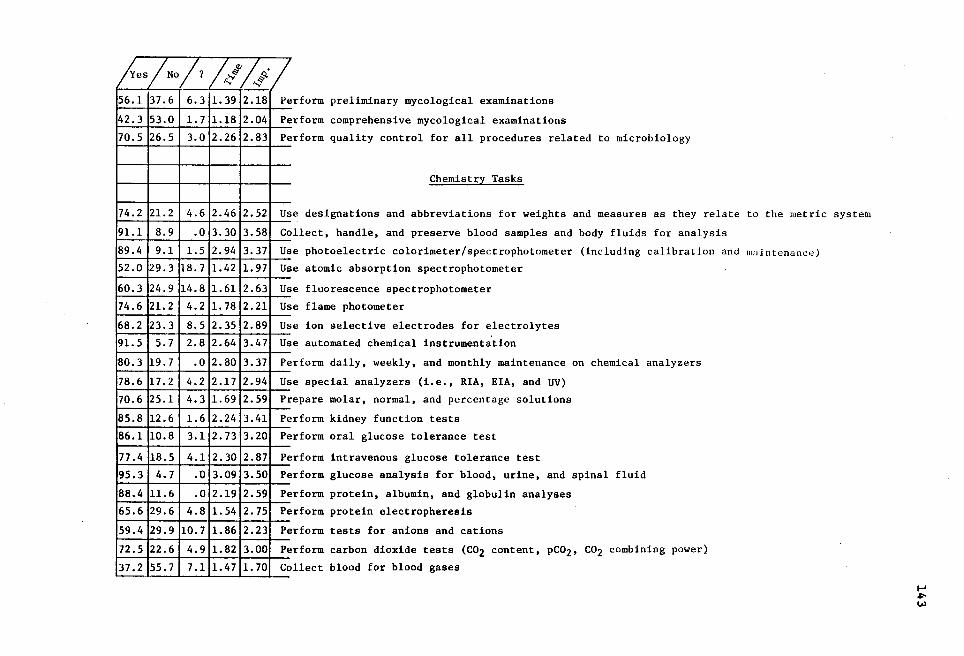
1 {es/No/? ~~1~·1 56.1 37.6 6.3 1. 39
42.3 53.0 1. 7 1.18
70.5 26.5 3.0 2.26
74.2 21. 2 4.6 2.46
91.1 8.9 .o 3.30
89.4 9.1 1.5 2.94
52.0 29.3 18.7 1.42
60.3 24.9 14.8 1.61
74.6 21. 2 4.2 1. 78
68.2 23.3 8.5 2. 35
91. 5 5.7 2.8 2.64
80.3 19.7 .o 2.80
78.6 17.2 4.2 2.17
70.6 25.1 4.3 1. 69
85.8 12.6 1.6 2.24
86.1 10.8 3.1 2.73
77 .4 18.5 4.1 2.30
95.3 4.7 .o 3.09
88.4 11.6 .o 2.19
65.6 29.6 4.8 1.54
59.4 29.9 10.7 1.86
72.5 22.6 4.9 1.82
37.2 55.7 7.1 1.47
2.18
2.04
2.83
2.52
3.58
3.37
1. 97
2.63
2.21
2.89
3.47
3.37
2.94
2.59
3.41
3.20
2.87
3.50
2.59
2.75
2.23
3.00
1. 70
Pe
Pe
Pe
Us
Co
Us
Us
Us
Us
Us
Us
Pe
Us
rform preliminary mycological examinations
rform comprehensive mycological examinations
rform quality control for all procedures related to microbiology
Chemistry Tasks
e designations and abbreviations for weights and measures as they relate to the metric system
llect, handle, and preserve blood samples and body fluids for analysis
e photoelectric colorimeter/spectrophotometer (including calibration and maintenance)
e atomic absorption spectrophotometer
e fluorescence spectrophotometer
e flame photometer
e ion selective electrodes for electrolytes
e automated chemical instrumentation
rform daily, weekly, and monthly maintenance on chemical analyzers
especial analyzers (i.e., RIA, EIA, and UV)
Pt repare molar, normal, and percentage solutions
Pe rform kidney function tests
Pe erform oral glucose tolerance test
p
p
p
p
p
~rform intravenous glucose tolerance test
erform glucose analysis for blood, urine, and spinal fluid
erform protein, albumin, and globulin analyses
erform protein electropheresis
erform tests for anions and cations
p
c ~rform carbon dioxide tests (C02 content, pC02, C02 combining power)
ollect blood for blood gases
...... ~ ~

1 ~es /No /1 !~if
67.8 24.1 8.1 1.61
85.4 13.2 1.4 2.25
93.7 6.3 .o 2.48
88.4 10.2 1.4 2.36
80.9 14.5 4.6 2.30
89.9 10.1 .o 2.25
93.6 6.4 .o 2.56
83.9 16.1 .o 2.00
59.8 29.4 10.8 1.88
75.4 16.0 8.6 2.18
61.5 29.9 12.6 2.06
53.2 32.4 14.4 1.61
94.9 5.1 .o 3.22
77.6 19.6 2.8 2.50
83.8 13.3 2.9 2.31
94.2 5.1 • 7 3.28
73.5 22.0 4.5 2.20
79.9 15.8 4.3 2.50
83.3 13.7 3:0 3.09
90.2 8.4 1. 4 2.95
86.3 12.2 1.5 2.97
93.3 6.7 .0•2.89
86.3 13. 7 .0 2.97
93.3 6.7 .o 2.62
~: 'Y
2.68
2.75
3.31
2.81
3.00
2.56
3.31
2.53
2.46
2. 72
2. 71
2.43
3. 77
3.06
2.84
3.45
2.78
2.66
3.42
2.74
3.55
3.21
3.45
2.88
p erform tests for blood gases
erform pancreatic enzyme tests PE
PE erform heart enzyme and isoenzyme tests
erform liver enzyme and isoenzyme tests
erform thyroid function tests
PE
PE
PE erform uric acid test
erform total cholesterol test P1 p
p
p
p
p
p
p
p
~rform triglyceride test
erform drugs of abuse testing
erform therapeutic drug tests
erform RIA test
erform EIA test
erform necessary quality control functions in the chemical laboratory
erform proper cleaning and maint~nance of glassware and pipetts used in the clinical laboratory
erform liver function tests
Urinalysis Tasks
P1 erform physical, chemical, and microscopic urinalysis
elate abnormal urinary findings to disease states R1
E ,xplain collection of random, midstream, timed, and catheterized specimens
erform specific gravity test p
p erform pH test p
p
p
p
erform protein test
erform glucose test
erform ketone test
erforrn occult blood test
I-' .,,.. .,,..

/~es/No/? h" /.~: 69.7 25.5 4.8 2.06 2.59
83.3 13.9 2.8 2.46 2.64
89.2 10.8 .0 2.76 3.47
64. 7 11.1 4.2 2.59 2. 71
48.9 ·41. 7 9.4 1.21 2.07
94.5 5.5 .0 3.00 3.27
95.5 4.5 .o 3.01 3.52
95.5 3.0 1. 5 3.07 3.39 88.9 8.3 2.8 2.97 2.94
91.8 5.5 2.7 2.41 2.88
71.2 25.8 3.0 2.54 2.60
90.3 8.4 1. 3 2.86 3.09
69.3 24.5 6.2 2.32 2. 77
94.5 4.1 1.4 2.78 3.31
67.6 30.8 1.6 1. 45 2.43
91.6 7.0 1.4 2.76 3.03
67.4 25.4 7.2 1.50 2.13
67.2 27.1 5.-1 1.53 2.16
65.0 22.2 12.8 1.45 2.62
70.4 21.8 7.8 1. 32 2.63
93.0 5.6 1.4 2.81 2.79
85.7 11.1 3.2 1.89 2.82
90.3 8.3 1.4 2.89 3.03
p erform leukocyte esterase test
erform nitrate test PE
p
p
p
I
I
I I
I
erform bilirubin test
erf orm urobilinogen test
erform special tests (i.e., porphyrins, 5HIA, VMA, steroids, etc.)
dentify blood and epithelial cells found in urine
dentify casts found in urine
dentify crystals found in urine dentify amorphous and mucus in urine, and explain their significance
dentify parasites in urine
I
I
dentify spermatozoa in urine, and explain their significance
~entify bacteria in urine, and explain their significance
dentify cylindroids in urine, and explain their significance
erform urine pregnancy test
I p
P1 erform Bence Jones protein test
P1 erform quality control for all urinalysis procedures
p
p
p
p
p
p
p
Hematology Tasks
erform manual red blood count using diluting pipette
erform manual red blood count using Unopette•
erform hemoglobin determinations using hemoglobin pipette
erform hemoglobin determinations using Unopette•
erform hematocrit determinations
erform MCV, MCH, and MCHC using mathematical formulas
erform erythrocyte sedimentation rate procedures
I-'
""" VI
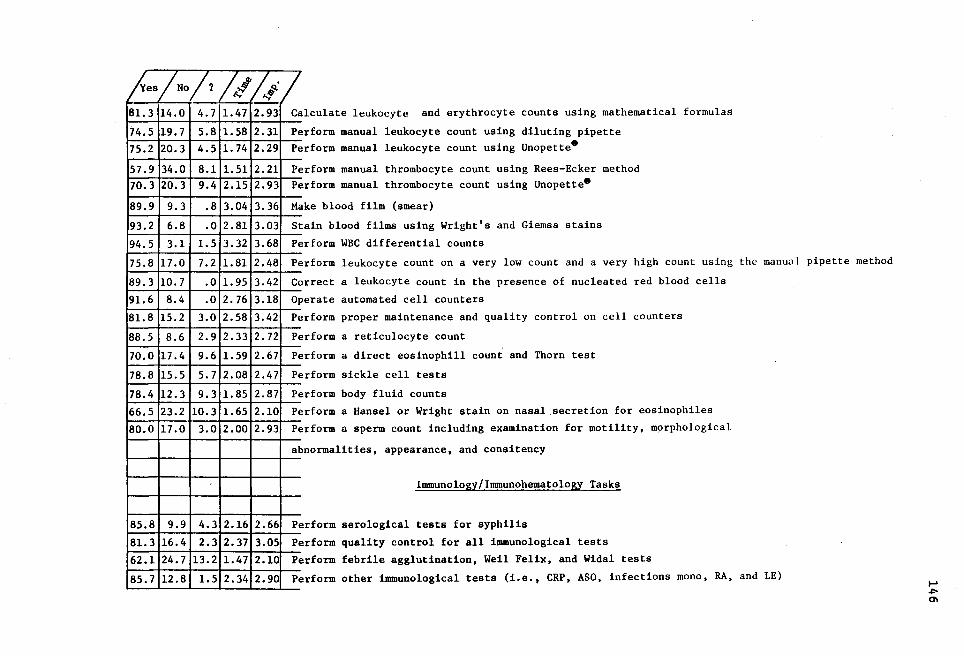
/ {es/No/1 h~ /Q-· 81. 3 14.0 4.7 1.47 2.93
74.5 19.7 5.8 1.58 2.31
75.2 20.3 4.5 1. 74 2.29
57.9 34.0 8.1 1.51 2.21 70.3 20.3 9.4 2.15 2.93
89.9 9.3 .8 3.04 3.36
93.2 6.8 .o 2.81 3.03
94.5 3.1 1. 5 3.32 3.68
75.8 17.0 7.2 1. 81 2.48
89.3 10.7 .o 1. 95 3.42
91.6 8.4 .o 2. 76 3.18
81.8 15.2 3.0 2.58 3.42
88.5 8.6 2.9 2.33 2. 72
70.0 17.4 9.6 1.59 2.67
78.8 15.5 5.7 2.08 2.47
78.4 12.3 9.3 1.85 2.87
66.5 23.2 10.3 1.65 2.10
80.0 17.0 3.0 2.00 2.93
-
85.8 9.9 4.3 2.16 2.66
81.3 16.4 2.3 2.37 3.05
62.1 24.7 13.2 1.47 2.10
85.7 12.8 1.5 2.34 2.90
c p
alculate leukocyte and erythrocyte counts using mathematical formulas
erform manual leukocyte count using diluting pipette p - . erform manual leukocyte count using Unopette
p
p
erform manual thrombocyte count using Rees-Ecker method erform manual thrombocyte count using Unopette8
M ake blood film (smear)
s p
p
c
tain blood films using Wright's and Giemsa stains
erform WBC differential counts
erform leukocyte count on a very low count and a very high count using the manual pipette method
orrect a leukocyte count in the presence of nucleated red blood cells
perate automated cell counters OJ
p
p
p
erform proper maintenance and quality control on cell counters
erf orm a reticulocyte count
erform a direct eosinophill count and Thorn test
erform sickle cell tests PE
p
p
p
erform body fluid counts
erform a Hansel or Wright stain on nasal secretion for eosinophiles
erform a sperm count including examination for motility, m9rphological
al bnormalities, appearance, and consitency
Immunology/Immunohematology Tasks
p erform serological tests for syphilis
p erform quality control for all immunological tests p erform febrile agglutination, Weil Felix, and Widal tests
p erform other immunological tests (i.e., CRP, ASO, infections mono, RA, and LE) ...... .,,. 0\
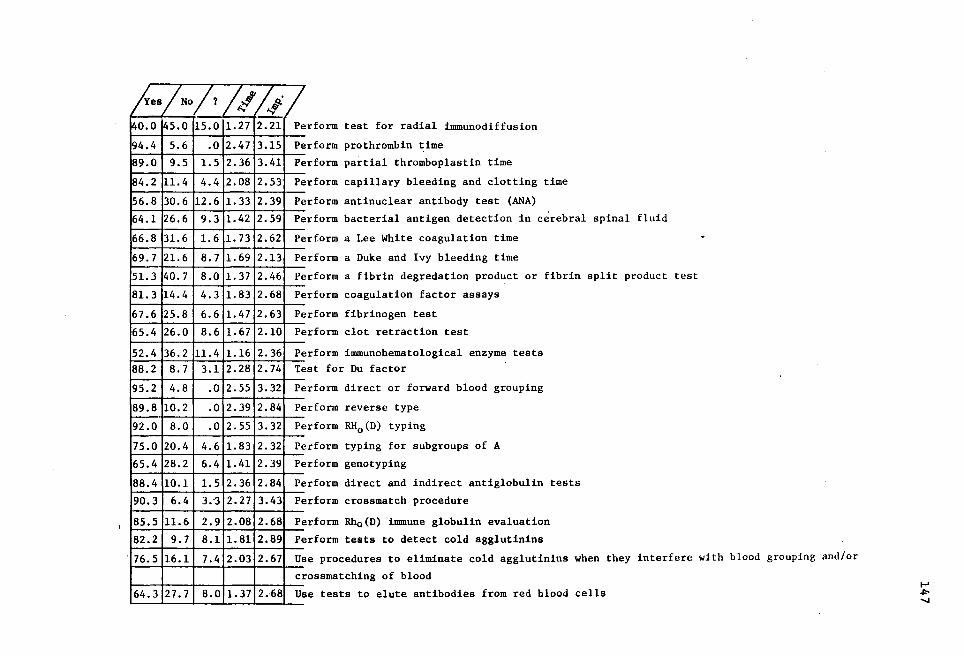
/~es/No/?~~ /,f/ 140.0 45.0 15.0 1.27 2.21 Pe
94.4 5.6 .o 2.47 3.15 Pe
89.0 9.5 1. 5 2.36 3.41 Pe
84.2 11. 4 4.4 2.08 2.53 Pe
56.8 30.6 12.6 1.33 2.39 Pe
64.1 26.6 9.3 1.42 2.59 Pe
66.8 31.6 1.6 1. 73 2.62 Pe
69.7 21. 6 8.7 1.69 2.13 Pe
51. 3 40.7 8.0 1. 37 2.46 Pe
81. 3 14.4 4.3 1.83 2.68 Pe
67.6 25.8 6.6 1.47 2.63 Pe
65.4 26.0 8.6 1. 67 2.10 Pe
52.4 36.2 11.4 1.16 2.36 Pe 88.2 8.7 3.1 2.28 2.74 Te
95.2 4.8 .o 2.55 3.32 Pe
89.8 10.2 .o 2.39 2.84 Pe
92.0 8.0 .o 2.55 3.32 Pe
75.0 20.4 4.6 1.83 2.32 Pe
65.4 28.2 6.4 1.41 2.39 Pe
88.4 10.1 1. 5 2.36 2.84 Pe
90.3 6.4 3. "3 2.27 3.43 Pe
85.5 11.6 2.9 2.08 2.68 Pe
82.2 9.7 8.1 1.81 2.89 Pe
. 76.5 16.1 7.4 2.03 2.67 Us
CI
64.3 27.7 8.0 1.37 2.68 UE
rform test for radial immunodiffusion
rform prothrombin ~ime
rform partial thromboplastin time
rform capillary bleeding and clotting time
rform antinuclear antibody test (ANA)
rform bacterial antigen detection in cerebral spinal fluid
rform a Lee White coagulation time
rform a Duke and Ivy bleeding time
rform a fibrin degredation product or fibrin split product test
rform coagulation factor assays
rform fibrinogen test
rform clot retraction test
rform immunohematological enzyme tests st for Du factor
rform direct or forward blood grouping
rform reverse type
rform RH0 (D) typing
rform typing for subgroups of A
rform genotyping
rform direct and indirect antiglobulin tests
rform crossmatch procedure
rform Rh0 (D) innnune globulin evaluation
rform tests to detect cold agglutinins
e procedures to eliminate cold agglutinins when they interfere with blood grouping and/or
ossmatching of blood
e tests to elute antibodies from red blood cells I-' ~ ......

68.1
60.6
88.2
84.9
78.0
24.7 1 1
Draw blood from donors
31.4
8.9
12.9
17.6
8.0 2.06 2.79 Perform therapeutic phlebotomy
2.9 2.47 2.91 Perform quality control for all reagents, blood bank refrigeration, and deep freeze
2.2 2.41 3.26 Maintain proper records of all quality control and procedures in blood bank
4.4 2.00 3.32 Perform procedures for transfusion reaction investigation ~~--'~~....&-~~ ...... ~--'~~_._~
..... .,,,.. Q)

APPENDIX G

Sub-Score Intercorrelations for Forms 1 through 7
of the HHS Clinical Laboratory Proficiency Examination
150
Section Clinical Chemistry Blood Banking Microbiology
Hematology
Form 1
Form 2
Form 3
Form 4
Form 5
Form 6
Form 7
Clinical Chemistry
Form 1
Form 2
Form 3
Form 4
Form 5
Form 6
Form 7
Blood Banking
Form 1
Form 2
Form 3
Form 4
Form 5
Form 6
Form 7
.59
.52
.59
.62
.61
.64
.68
.56
.49
.55
.56
.53
.57
.61
.54
.53
.55
.58
.57
.63
.66
Note: All correlations are statistically significant (p<.01).
.58
.53
.54
.58
.60
.60
.61
.58
.57
.55
.60
.64
.65
• 71
.54
.54
.52
.57
.58.
.55
.64
Source: Professional Examination Service (1980). Correlation of performance on clinical laboratory proficiency examinations with performance in clinical laboratory practice. New York: Professional Examination Service.

APPROVAL SHEET
The dissertation submitted by James R. Fidler has been read and approved by the following committee:
Dr. John D. Edwards, Director Associate Professor, Department of Psychology Loyola University of Chicago
Dr. Emil J. Posavac Professor & Chairman, Department of Psychology Loyola University of Chicago
Dr. Scott Tindale Assistant Professor, Department of Psychology Loyola University of Chicago
The final copies have been examined by the director of the dissertation and the signature which appears below verifies the fact that any necessary changes have been incorporated and that the dissertation is now given final approval by the Committee with reference to content and form.
The dissertation is therefore accepted in partial fulfillment of the requirements for the degree of Doctor of Philosophy.
NO\}QM\bA l~) ICf i8 Date Director's Signature