The Utilization of Capital Equipment
9
BY MURRAY F. FOSS The Utilization of Capital Equipment: Postwar Compared With Prewar IN, N T CI1EASES in output per unit of input over the long run have been at- tributed to many factors, such as the increased skill and education of labor, the increase in management knowledge, and the greater efficiency of new and existing machines resulting from tech- nological and scientific advances. One element of importance which is related in part to some of the above factors has been the more intensive utilization of capital equipment in the postwar period as compared with prewar. This article is concerned with the measure- ment and significance of changes in hours worked by machinery and equip- ment in some major sectors of the American economy over this period. This particular problem has received relatively little attention as a subject for serious investigation. 1 The topic is of particular interest at present in view of the recent appearance of major theoretical and statistical studies in this general area. The analysis and results in this article should be viewed as exploratory in character since at this time the basic data required for a definitive study are rather limited. Most of this stud}^ deals with hours worked per annum by equipment in manufacturing, in particular, with changes from 1929 to the mid-1950's. It finds that for the bulk of equipment in this important industry division there has been an increase on the order of one-third to one-half in the utilization 1. See Robert M. Solow, "Technical Change and the Ag- gregate Production Function," Review of Economics and Statistics, August 1957; Edward F. Denison, "The Sources of Economic Growth in the United States" (Committee for Economic Development 1962) p. 97. Charles L. Schultze in "Some Effects of Changes in Working Hours on Investment, Output and Real Wages," a paper presented in September 1956 at the American Statistical Association meetings in Detroit, dealt with this problem mainly in terms of changes in multiple-shifting since the turn of the century. rate over this period. No attempt has been made to present similar estimates for the entire stock of fixed capital although the manufacturing experience is by no means unique: the upward shift in equipment utilization lias appeared in other industries which have been examined, whether or not their capital stock is growing or declining. An average unit of generating equip- ment in electric utilities in the mid- 1950's worked about 60 percent more hours per year than in the decade of the 192(rs. In mining, exclusive of petroleum, an average unit of ma- chinery driven by electric motors worked about one-fifth more hours in 1955-57 than in 1929. While there has been no change in relative freight car use over this period, each locomotive in freight service is working about 20 percent more hours, and locomotives in passenger service, which have undergone a drastic decline in numbers, are working about two-thirds more hours per unit per year than they did in the 1920's. In general, the shift away from railroads toward trucking and pipelines has been one in which capital is used with greater intensity. A comparison of the 1920's, particu- larly 1929, with the mid-1950's is considered to be a valid one in analyzing long-run changes; both were periods of high output and high relative resource utilization. To the extent that 1929 may differ from 1955 for cyclical reasons, however, some of the long-run change in equipment hours presented here may be overstated. It has not been possible to demon- strate why these increases in relative equipment use have come about or to quantify the factors underlying the apparent changes, but a few reasons can at least be suggested. For one thing, there has been a definite tendency toward multiple-shift operations 2 —a development that may have been stimu- lated to some extent by the premium- pay-for-overtime provisions instituted by the Fair Labor Standards Act of 1938 and even by the XRA. The World War II experience must have constituted a powerful stimulus to mul- tiple shifting and it is reasonable to assume that the experience acquired by many firms during the war with two- arid three-shift operations was carried over into the postwar years of high- level demand. In fact, some of the illustrations used in this article suggest that the major change in relative equip- ment utilization took place during and immediately after World War IT, and that changes since then (aside from cyclical movements) have been rela- tively small. Also of importance over the long-run has been the advance in knowledge acquired by management in making more efficient use of machines. One example of this has been the efforts by many firms to smooth out within the year the production peaks which come from seasonal or other short-lived peak loads and which frequently entail the use of standby equipment with rela- tively low annual utilization. The suc- cess of the electric utilities in making more intensive use of capacity needed for peak loads—referred to further on— has been outstanding. Moreover, it is probably safe to say that over the long run, there has been a relative reduction in "downtime" for equipment repairs. The diesel locomotive is an excellent example of an innovation that has been successful in no small measure because 2. As suggested, for example, by William Fellnerin Trend and Cycles in Economic Activity, New York, 1956, page 92. Digitized for FRASER http://fraser.stlouisfed.org/ Federal Reserve Bank of St. Louis June 1963
Transcript of The Utilization of Capital Equipment

BY MURRAY F. FOSS
The Utilization of Capital Equipment:Postwar Compared With Prewar
IN,NTCI1EASES in output per unit ofinput over the long run have been at-tributed to many factors, such as theincreased skill and education of labor,the increase in management knowledge,and the greater efficiency of new andexisting machines resulting from tech-nological and scientific advances. Oneelement of importance which is relatedin part to some of the above factorshas been the more intensive utilizationof capital equipment in the postwarperiod as compared with prewar. Thisarticle is concerned with the measure-ment and significance of changes inhours worked by machinery and equip-ment in some major sectors of theAmerican economy over this period.
This particular problem has receivedrelatively little attention as a subjectfor serious investigation.1 The topic isof particular interest at present in viewof the recent appearance of majortheoretical and statistical studies inthis general area. The analysis andresults in this article should be viewedas exploratory in character since atthis time the basic data required for adefinitive study are rather limited.
Most of this stud}^ deals with hoursworked per annum by equipment inmanufacturing, in particular, withchanges from 1929 to the mid-1950's.It finds that for the bulk of equipmentin this important industry division therehas been an increase on the order ofone-third to one-half in the utilization
1. See Robert M. Solow, "Technical Change and the Ag-gregate Production Function," Review of Economics andStatistics, August 1957; Edward F. Denison, "The Sources ofEconomic Growth in the United States" (Committee forEconomic Development 1962) p. 97. Charles L. Schultze in"Some Effects of Changes in Working Hours on Investment,Output and Real Wages," a paper presented in September1956 at the American Statistical Association meetings inDetroit, dealt with this problem mainly in terms of changesin multiple-shifting since the turn of the century.
rate over this period. No attempt hasbeen made to present similar estimatesfor the entire stock of fixed capitalalthough the manufacturing experienceis by no means unique : the upward shiftin equipment ut i l izat ion lias appearedin other industries which have beenexamined, w h e t h e r or not the i r capitalstock is growing or declining.
An average unit of generating equip-ment in electric utilities in the mid-1950's worked about 60 percent morehours per year than in the decade ofthe 192(rs. In mining, exclusive ofpetroleum, an average unit of ma-chinery driven by electric motors workedabout one-fifth more hours in 1955-57than in 1929. While there has been nochange in relative freight car use overthis period, each locomotive in freightservice is working about 20 percent morehours, and locomotives in passengerservice, which have undergone a drasticdecline in numbers, are working abouttwo-thirds more hours per unit peryear than they did in the 1920's. Ingeneral, the shift away from railroadstoward trucking and pipelines has beenone in which capital is used with greaterintensity.
A comparison of the 1920's, particu-larly 1929, with the mid-1950's isconsidered to be a valid one in analyzinglong-run changes; both were periods ofhigh output and high relative resourceutilization. To the extent that 1929may differ from 1955 for cyclicalreasons, however, some of the long-runchange in equipment hours presentedhere may be overstated.
It has not been possible to demon-strate why these increases in relativeequipment use have come about or toquantify the factors underlying theapparent changes, but a few reasons canat least be suggested. For one thing,
there has been a definite tendencytoward multiple-shift operations 2—adevelopment that may have been stimu-lated to some extent by the premium-pay-for-overtime provisions institutedby the Fair Labor Standards Act of1938 and even by the XRA. TheWorld War II experience must haveconstituted a powerful stimulus to mul-tiple shifting and it is reasonable toassume that the experience acquired bymany firms during the war with two-arid three-shift operations was carriedover into the postwar years of high-level demand. In fact, some of theillustrations used in this article suggestthat the major change in relative equip-ment utilization took place during andimmediately after World War IT, andthat changes since then (aside fromcyclical movements) have been rela-tively small.
Also of importance over the long-runhas been the advance in knowledgeacquired by management in makingmore efficient use of machines. Oneexample of this has been the efforts bymany firms to smooth out within theyear the production peaks which comefrom seasonal or other short-lived peakloads and which frequently entail theuse of standby equipment with rela-tively low annual utilization. The suc-cess of the electric utilities in makingmore intensive use of capacity neededfor peak loads—referred to further on—has been outstanding. Moreover, it isprobably safe to say that over the longrun, there has been a relative reductionin "downtime" for equipment repairs.The diesel locomotive is an excellentexample of an innovation that has beensuccessful in no small measure because
2. As suggested, for example, by William Fellnerin Trendand Cycles in Economic Activity, New York, 1956, page 92.
Digitized for FRASER http://fraser.stlouisfed.org/ Federal Reserve Bank of St. Louis
June 1963

June 1963
it has required relatively less time-outfor repairs and has thus increased theavailable working time for locomotives.
Within particular industries therehave undoubtedly been efforts to intro-duce continuous, automatic operationsin which machines tend to be used witha high degree of intensity. Moreover,there has probably been a change inproduct mix toward industries in whichcontinuous operations are important—aluminum, refined petroleum, chemi-cals, and electric power are importantexamples that may be cited.
Significance of findings
What significance can be attached tothe increase in hours worked by equip-ment? First of all, it is important tokeep in mind a few of the major find-ings that have emerged from recentstudies of productivity and economicgrowth. Total output, it has beenfound, has risen at a faster rate thanhas the weighted total of factor inputs.3
Although measured in various ways, inall cases this residual portion of growth—in "total factor productivity" or out-put per unit of input—lias been verysubstantial and a quantitative explana-tion of the many and varied sourceswhich may account for it is difficult.4
Furthermore, as it has been measuredin the framework of such studies, thecontribution of the growth of fixedcapital to the increase in total outputhas been found to be of relatively smallmagnitude.
Against this background, a rise inequipment hours per year from prewarto postwar may be viewed in two ways.On the one hand, it might signify thatthe contribution of fixed capital to long-run output growth is greater (and pro-ductivity correspondingly less) than hasbeen calculated in previous investiga-tions. This is because characteristicallythe changes in the input of fixed capitalhave been measured by the real volumeof capital in place, without adjustmentfor changes in intensity of use.
SURVEY OF CURRENT BUSINESS
An adjustment for capital's contribu-tion, due to increased equipment-hoursworked per year, would be analogousto the adjustment of the labor in-put—'number of persons employed—for changes in labor-hours per year.Possibly not all of the increased equip-ment-hours should be so handled butthat part attributable to the advancein multiple-shift operations woirid seemto warrant such treatment.
According to the second view, the ad-vance in hours worked by equipmentshould not be considered as an increasein the input of capital, which is bettormeasured by capital in place. Instead,it should be looked at as the result(measurable in part) of certain forcesthat have contributed to a rise in totalfactor productivity over time: the ad-vances in management efficiency, forexample, that have grown out of the
9
experience gained from working withmachinery, and from engineeringstudies within the plant; and the gainsfrom science and research as "em-bodied" in new machines of advancedtechnology. It may be that the firstof these elements—the "advance inmanagement knowledge"—bulks largeas an explanatory factor in the increasein equipment hours since one of thefocal points of management has beenthe reduction of idle equipment tune.But increased management knowledgeprovides only part of the answer sinceit is likely that many of the new tech-nologies incorporated in modern ma-chinery go hand in hand with longerhours for equipment; this seems to bea distinguishing characteristic of manynew processes that are labeled "con-tinuous."
With capital input measured b}^ stockof capital in place, a lengthening of
COTTON SPINDLESLong Run Decline in Spindles in PlaceRise in Total Spindle Hours Since the 1920's Reflects Step-Up in Annual Hours Per
Millions
Spindle
Billions140
- 120
H 100
80
60
1922 25
Thousands
4 -
2 -
3. See, for example, John W. Kendrick, "ProductivityTrends in the United States," National Bureau of EconomicResearch, Princeton, 1961.
4. See Denison's study for a comprehensive analysis of thesources of U.S. growth.
FIVHOIspir
E YEAR AVERAGESRS PER YEAR PER
sIDLE IN PLACE
'̂ ''*•:
[A.. . t . . .k. . l . . .J_ \ f 1...1...1. < ? ,l...t...l. ,h i r L.i. 1 i. .L...I.. . * ' t L,,t,J~L i . . . * . . . i.. .1 - t 1 I ! ! .
1925-29 30-34 35-39 40-44 45-49 50-54 55-59
U.S. Department of Commerce. Office of Business Economics
Basic data: Census
687112—63
Digitized for FRASER http://fraser.stlouisfed.org/ Federal Reserve Bank of St. Louis
June 1963

10 SURVEY OF CURRENT BUSINESS June 190-')
equipment hours per year is clearly adevelopment of a capital-saving nature.In this connection, this shift may be apartial explanation for the observeddecline in capital-output ratios from1929 to 1955.
The pages that follow discuss in de-tail the basic data used to demonstratechanges in equipment hours per yearin manufacturing and mining, and in afew other industries for which statisticspertaining to some important types ofequipment were readily available.
Manufacturing
Labor hours of work per year haveshown a fairly steady decline since thelatter part of the 19th century; from1909 to 1957 they declined from about2,700 hours per annum to less than 2,100hours. In manufacturing they fellfrom 44 to 40 per week from the 1920'sto date. But hours of labor do notnecessarily provide a reliable indicationof machinery-hours. In principle, a40-hour week for labor can be consist-ent with 40, 80, or 120 hours a weekfor a machine, depending on whether1, 2, or 3, 40-hour shifts are employed.
To illustrate the use of machine-hours data, we can look at the cottontextile industry, from which the Bureauof the Census has been collectingmonthly statistics on the number ofcotton spinning spindles in place andthe number of spindle-hours operatedfor approximately the past 40 years.For this type of equipment there was a37 percent decline in the number ofspindles in place from 1929 to 1956, butan 88 percent increase in hours workedper spindle in place and thus an 18percent increase in the total numberof spindle-hours worked. The basictrends are illustrated in the chart onpage 9.
As a practical matter, a long-termseries on capacity utilization, in whichshift operations, down-time and prod-uct-mix changes were treated on aconsistent basis, might serve as an in-dex of equipment hours over time, butsuch figures are lacking though recentlyseveral capacity-use series for the post-war period have been published formanufacturing. It should be kept inmind that statistical measures of capac-
ity utilization and of equipment utili-zation are not necessarily identical.An equipment utilization measureshould merely reflect changes in hoursper machine and should be independentof the complications which may possi-bly be introduced by changes over timein output per machine-hour.
Electric motors and electric powerconsumption
Although comprehensive data onmachine hours for overall manufac-turing are lacking, there is a body ofstatistics for manufacturing and min-ing which may yield what is needed,namely, the statistics on power equip-ment and on electricity consumptionfrom the Census of Manufactures andthe Census of Mineral Industries.Very briefly, the statistics provide thebasis for estimates of hours worked byelectric motors and thus hours workedby machinery driven by such motors,which have been the dominant sourceof power in American industry formany years.
For the years 1939 and 1954 Censusstatistics are available for each industryon the number and aggregate horse-power of electric motors in place at theend of each year; also given is aggregateelectric power consumption—for allpurposes—within the year, measuredin kilowatt-hours. Statistics on horse-power of electric motors in place havealso been published for 1929 but theelectric power consumption on a de-tailed industry basis is confined topurchased power, as distinct frompower generated in the manufacturingplant. Overall estimates of total powerconsumption in manufacturing, with abreakdown by broad industrial groupsare obtainable, however, from othersources.
Attention is focused on electricmotors because of the dominant posi-tion of such equipment as a source ofwork in American manufacturing in-dustry. By 1929, according to theCensus Bureau, electric motors ac-counted for some 80 percent of allmechanical work clone in factories.The remaining 20 percent was ac-counted for by "prime movers" suchas steam engines and turbines, gasoline
engines and water wheels—which weredirectly connected to machines. By1954 the electric motor ratio had risento approximately 88 percent. If wecan find out how intensively the motorswere worked we should have an approxi-mation of the intensity with which themachinery driven by the motors hasbeen operated.
Electricity is consumed in factoriesfor four major purposes: (1) for light-ing, (2) for driving motors, (3) as araw material in electro-chemical pro-cesses such as primary aluminum manu-facturing, (4) for heating, as in heat-treatment furnaces. There are othermiscellaneous uses such as welding,hand tools, measuring instruments, etc.,which in aggregate are much lessimportant than any of those shownabove.
While a breakdown of power con-sumption in these uses for the years1929, 1939, and 1954 is lacking, the
Table 1.—Industrial Electric Power: Distri-bution of Electric Energy by Major Uses,by Industry, 1945
Industry
FoodTobacco.Textiles
ApparelLumberFurniture
Paper ._ .Printing and
publishingChemicals
Petroleum andcoal
Rubber .Leather
Stone, clay, andglass
Iron and steelNonferrous
metals
Electricalmachinery
Machinery _ ._ -Automobiles
Transportationequipment
Miscellaneousproducts
Metal miningCoal miningNonmetallic
miningPetroleum and
natural gas
Light-ing Motors
Electro-lytic-cells
Elec-tric-
furnaceOther
Manufacturing
10.614.89.8
34.312 312.2
3.9
20.24.5
5.612.115.2
6 27.2
2.5
19.019.819.4
27.0
18.4
87.384.389.4
64. 685.485.8
93.1
75.044.7
93.787.584. 1
88.072.0
20.2
42.659.268.0
46.6
73.0
1.6.3
(*.)
(*)(*)
2.2
. 521.9
(*)(*)(*)
. 1
.4
61.3
1.9. 5.2
_ 2
2
(*)
0.2
---
.2
2.127.9
(*).2.1
4.418.7
14.6
30.114.37.3
9.4
"). 1
0.5.6,6
1. 12.21.8
.6
2.31.0
2!e
1.31.7
1.3
6.46.25.1
16.7
3.2
Extract wig
2.84.2
4.7
8. 1
96. G92.1
95.0
90.1
(*)0.2
. 1
(*)(*)
(*)
0.53.5
.3
1.6
*Negligible amount, less than 0.05%.Source: Taken from Federal Power Commission, "Indus-
trial Electric Power in the United States, 1939-46" (F.P.C.S-46, Table H, p. XI).
Digitized for FRASER http://fraser.stlouisfed.org/ Federal Reserve Bank of St. Louis
June 1963

June 1963 SURVEY OF CURRENT BUSINESS 11
Federal Power Commission conducteda fairly comprehensive survey coveringthe year 1945, which provides such abreakdown on a 2-digit industry basis.This study, combined with the Censusdata on motors in place and aggregatepower consumed in each industry, pro-vides the basic information for manu-facturing. The statistics from the FPCstudy are shown in table 1.
The figures for a single year—1954—are considered first by way of back-ground, although the main emphasis ofthis article is on change rather than onlevel. These calculations indicate thatan average unit of electric-motor-driven machinery, measured by horse-power, was operated about 35 hours aweek in that year. The computationsused to derive this result are shown inthe right-hand column of table 2.
Given the horsepower of electricmotors in place at the end of 1954(line 1), the first step was to assume thateach electric motor could work continu-ously throughout the year—that is,8,760 hours; this number times horse-power of motors in place gives totalhorsepower-hours of motors availablein a year (line 2). The fact that such atheoretical maximum could never beattained in practice is irrelevant for thepurpose at hand. Horsepower-hourswere then converted to kilowatt-hours;in work measurement, 1 horsepower-hour — 0.746 kilowatt-hours. The re-sults of these calculations were adjustedupward by dividing through by 0.9,since modern electric motors have anefficiency of approximately 90 percent,that is, about 10 percent of power inputinto the motor is dissipated in the formof heat.5 These calculations (line 3)give a theoretical maximum per year,measured in kilowatt-hours, againstwhich actual kilowatt-hours of elec-tricity consumed can be measured.
The proportion of power used forelectric motors in all manufacturing(line 5) was then derived by applyingthe 1945 proportions of power for elec-tric motor use, as given in table 1, tototal power consumed in 1954 in each2-digit industry, as shown in the Censusof Manufactures. From this proce-
5. The adjustment could also have been made by reduc-ing the power consumption (see below) by 10 percent.
Table 2.—Horsepower of Electric Motors, Power Consumption by Electric Motors, andRelative Utilization of Motors, Manufacturing, 1929, 1939, and 1954
(1) Horsepower of electric motors, total, - _ _ _(2) Horsepower hours assuming year-round operation (line
(1)X3,7(>0).(3) Kilowatt-hours of motors (line 2X0.746)^-0.9 1(4) Electric power actually consumed, all purposes(5) Percent of power used for electric motors(6) Power consumed by motors (line 4Xline 5)(7) Percent utilization (line 6 -Mine 3) X 100(8) Number of equivalent 40-hour weeks (line 7X4. 2) -MOO
Unit
Thousand horsepowerMillions
Billions of kilowatt-hoursBillions of kilowatt-hours
Billions of kilowatt-hours
1929
33, 844296, 473
245.855. 171.139.215.9.668
1939
44, 827392, 685
325 470.570.149.415.2.638
1954
94, 1 HI824, 45<v
683 3-"221. 1
64. 6142. 720. 9. 878
1. The 0.9 adjustment was made to take account of the efficiency of electric motors and thus provide comparability withthe power consumption data.
Sources: (1) Table 1. Horsepower of Power Equipment Used in Manufacturing Industries: 1954 and Earlier Years,Bureau of the Census, 1954 Census of Manufactures, Volume I, Summary Statistics, p. 207-2.
The 1954 horsepower figure includes an upward adjustment of 2^ percent to allow for fractional horsepower motors, whichhad been included in the earlier years but omitted from the 1954 Census. The Census had characterized this omission as"insignificant" for the overall totals. The 2j/£ percent figure was based on a British Census of Manufactures for 1951 whichshowed fractional horsepower motors to represent 2.4 percent of all electric motors, measured in horsepower.
(4) 1939 and 1954—Table IA. Fuels and Electric Energy Used in the Manufacturing Industries: 1954 and Earlier Years.1954 Census of Manufactures, Vol. I, p. 208-3. The 1954 Census total (247.7) was reduced by consumption of electric powerfor nuclear energy ( = 26.6 billion) as shown in Series S81-93 of Bureau of the Census, Historical Statistics of the United States,Colonial Times to 19-57, p. 511. The 1929 total for manufacturing is taken from this latter table.
dure, it was found that electric motorsaccounted for 64.6 percent of totalpower consumption in manufacturing in1954, or 142.7 billion kilowatt-hours.Dividing this total by kilowatt-hours ofmotors in place in 1954—assuming year-round operation—indicates a utilizationrate of 20.9 percent. This is theequivalent of 0.88 forty-hour shifts—since there are 4.2 forty-hour shifts ina full week of 168 hours.
Stock of capital is characteristicallymeasured in constant dollars and incombining the utilization rates forindustries, or for different machineswithin a plant, or plants within anindustry, constant dollar weights shouldbe used rather than horsepower. Horse-power may be justified as a basis forweighting, however, on the ground thatthere is probably a fairly good positivecorrelation between the horsepower of amachine and its dollar cost. Tn thispaper no attempt was made to combineindustries conceptually more appropri-ate through the constant dollar weights.
Cross-sectional results
Similar calculations were also run foreach of the 4-digit industries shown inthe 1954 Census of Manufactures. Indoing this, we were limited by the datashown in table 1, so that it was neces-sary to use 2-digit industry factors onpower consumed by motors for all4-digit industries within a given 2-digitgroup. While this procedure intro-duced an element of error, the broadcross-sectional results are nonetheless of
interest. If the figures have any sig-nificance at all, they should yield per-centages well under 100—or 4.2 40-hourshifts—and should not exceed thesemaximum limits. Out of almost 400industries for which calculations couldbe made for the year 1954, there werealmost no industries in which com-pletely impossible results were obtainedfrom this simple calculation. The ex-ceptional cases included primary alumi-num, for example, where electricity isused as a raw material in an electro-chemical process, and where a smallerror in the motor ratio could seriouslybias the results. There was only onesmall industry which could not bebe explained in this fashion.
In the mild recession year of 1954,the unweighted average number of 40-hour shifts for 397 industries turned outto be 0.90, or 36 hours per week. Fordurables, the ratio was 0.74 (30 hours),while for nondurable goods industriesthe ratio was 1.12 (45 hours). Partlythis difference reflects the fact thatdurable goods were relatively depressedin 1954, and partly the fact that innondurables continuous operations aremore common than in durables. Rela-tively higher ratios were obtained forindustries like petroleum, paper, ce-ment, glass, cotton and rayon textiles,and hosiery, and relatively low ratiosfor the metal fabricating and machin-ery industries generally, which charac-teristically work far below full opera-tions, and for seasonal industries suchas fruit and vegetable canning.
Digitized for FRASER http://fraser.stlouisfed.org/ Federal Reserve Bank of St. Louis
June 1963
12 SUEVEY OF CURRENT BUSINESS June 11)03
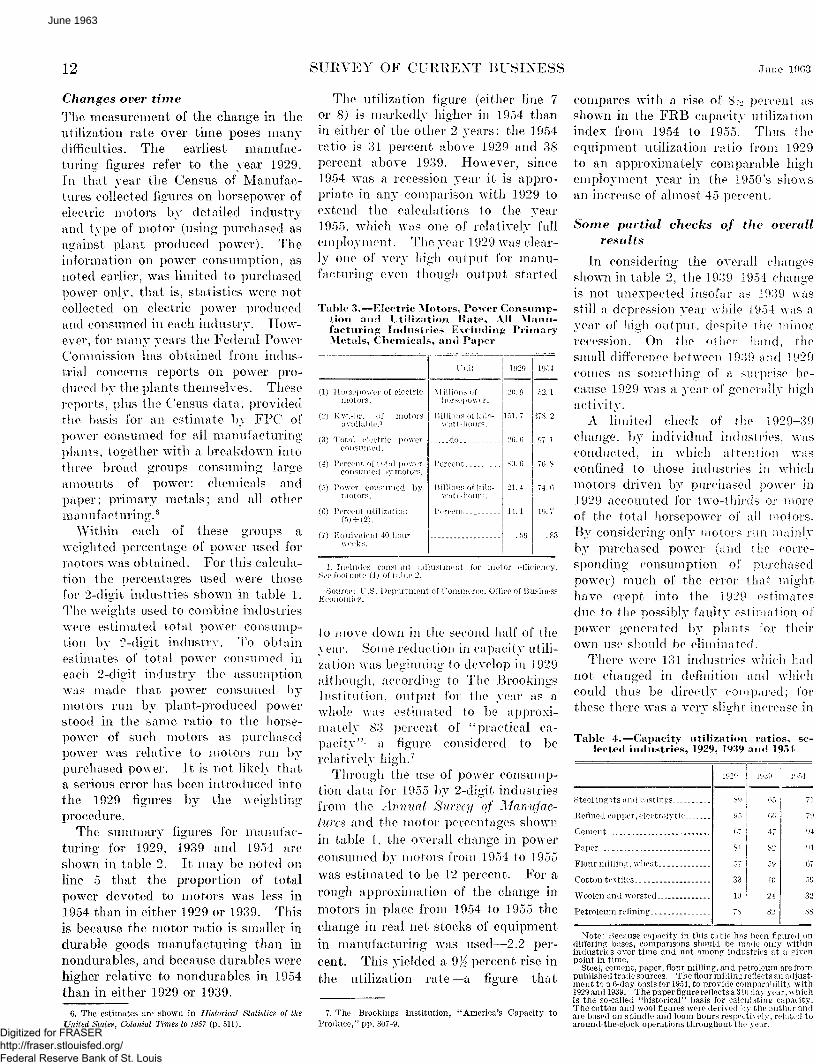
Changes over time
The measurement of the change in theutilization rate over time poses manydifficulties. The earliest manufac-turing figures refer to the year 1929.In that year the Census of Manufac-tures collected figures on horsepower ofelectric motors by detailed industryand type of motor (using purchased asagainst plant produced power). Theinformation on power consumption, asnoted earlier, was limited to purchasedpower only, that is, statistics were notcollected on electric power producedand consumed in each industry. How-ever, for many years the Federal PowerCommission has obtained from indus-trial concerns reports on power pro-duced by the plants themselves. Thesereports, plus the Census data, providedthe basis for an estimate by FPC ofpower consumed for all manufacturingplants, together with a breakdown intothree broad groups consuming largeamounts of power: chemicals andpaper; primary metals; and all othermanufacturing.6
Within each of these groups aweighted percentage of power used formotors was obtained. For this calcula-tion the percentages used were thosefor 2-digit industries shown in table 1.The weights used to combine industrieswere estimated total power consump-tion by 2-digit industry. To obtainestimates of total power consumed ineach 2-digit industry the assumptionwas made that power consumed bymotors run by plant-produced powerstood in the same ratio to the horse-power of such motors as purchasedpower was relative to motors run bypurchased power. It is not likely thata serious error has been introduced intothe 1929 figures by the weightingprocedure.
The summary figures for manufac-turing for 1929, 1939 and 1954 areshown in table 2. It may be noted online 5 that the proportion of totalpower devoted to motors was less in1954 than in either 1929 or 1939. Thisis because the motor ratio is smaller indurable goods manufacturing than innondurables, and because durables werehigher relative to nondurables in 1954than in either 1929 or 1939.
The utilization figure (either line 7or 8) is markedly higher in 1954 thanin either of the other 2 years: the 1954ratio is 31 percent above 1929 and 38percent above 1939. However, since1954 was a recession year it is appro-priate in anty comparison with 1929 toextend the calculations to the year1955, which was one of relatively fullemployment. The year 1929 was clear-ly one of very high output for manu-facturing even though output started
Table 3.—Electric Motors, Power Consump-tion arid Utilization Rate, All Manu-facturing Industries Excluding PrimaryMetals, Chemicals, and Paper
(1) Horsepower of electricmotors.
(4) Percent of total powerconsumed by motors.
1929 1954
151.7 1378.2watt-hours . |
2,6 U.I
21.4 74.6
14.1
.83
Source: U.S. Department of Commerce, Office of BusinessEconomics.
to move down in the second half of theyear. Some reduction in capacity utili-zation was beginning to develop in 1929although, according to The BrookingsInstitution, output for the year as awhole was estimated to be approxi-mately 83 percent of "practical ca-pacity"—a figure considered to berelatively high.7
Through the use of power consump-tion data for 1955 by 2-digit industriesfrom the Annual Survey of Manufac-tures and the motor percentages shownin table 1, the overall change in powerconsumed by motors from 1954 to 1955was estimated to be 12 percent. For arough approximation of the change inmotors in place from 1954 to 1955 thechange in real net stocks of equipmentin manufacturing was used—2.2 per-cent. This yielded a 9K percent rise inthe utilization rate—a figure that
compares with a rise of 8)2 percent asshown in the FRB capacity utilizationindex from 1954 to 1955. Thus theequipment utilization ratio from 1929to an approximately comparable highemployment year in the 1950's showsan increase of almost 45 percent.
Some partial checks of the overallresults
In considering the overall changesshown in table 2, the 1939-1954 changeis not unexpected insofar as 1939 wasstill a depression year while 1954 was ayear of high output , despite the minorrecession. On the other hand, thesmall difference between 1939 and 1929comes as something of a surprise be-cause 1929 was a year of generally highactivity.
A limited check of the 1929-39change, by individual industries, wasconducted, in which attention wasconfined to those industries in whichmotors driven by purchased power in1929 accounted for two-thirds or moreof the total horsepower of all motors.By considering only motors run mainlyby purchased power (and the corre-sponding consumption of purchasedpower) much of the error that mighthave crept into the 1929 estimatesdue to the possibly faulty estimation ofpower generated by plants for theirown use should be eliminated.
There were 131 industries which hadnot changed in definition and whichcould thus be directly compared; forthese there was a very slight increase in
Table 4.—Capacity utilization ratios, se-lected industries, 1929, 1939 and 1954
Steel ingots and castings.
Refined copper, electrolytic.
Cement
Paper
Flour milling, wheat
Cotton textiles
Woolon and worsted .
Petroleum refining...
S9
Q-
07
SI
oq
19
78
r._
OR
47
8°
59
40
24
82
71
94
91
07
59
32
SS
6. The estimates are shown in Historical Statistics of theUnited States, Colonial Times to 1957 (p. 511).
7. The Brookings Institution, "America's Capacity toProduce," pp. 307-9.
Note: Because capacity in this table has been figured ondiffering bases, comparisons should be made only withinindustries over time and not among industries at a givenpoint in time.
Steel, cement, paper, flour milling, and petroleum are frompublished trade sources. The flour milling reflects an adjust-ment to a 6-day basis for 1951, to provide comparability with1929 and 1939. The paper figure re fleets a 310 day year, 'whichis the so-called "historical" basis for calculating capacity.The cotton and wool figures were derived by the author andare based on spindle and loom hours respectively, related toaround-the-clock operations throughout the year.
Digitized for FRASER http://fraser.stlouisfed.org/ Federal Reserve Bank of St. Louis
June 1963

June 1968 SURVEY OF CURRENT BUSINESS 13
the 1939 utilization ratio over 1929,measured by the median change. Overthe 10-year period the durable goodsratio was a little lower while the non-durables ratio was somewhat higher,and a proper weighting system wouldprobably yield a small overall de-crease, approximately in line with theaggregate change shown in table 2.
For a second check primary metals,paper and chemicals were excludedfrom the calculations since these in-dustries are very large power consumersand errors in any of the 1929 estimatescould bias the 1929 results. The totalafter these exclusions, however, yieldeda change of 40 percent from 1929 to1954, or more than the change shownby the overall manufacturing totals.Results of these calculations appear intable 3, which is partly condensed.
As another crude kind of check of thecalculations presented in tables 2 and3, the few direct measures available oncapacity utilization can be examined.They show rather large declines from1929 to 1939 in steel, cement, and re-fined copper but are about unchangedor somewhat higher in nondurables.About all that can be said is that theydo not point to uniformly higher ca-pacity utilization rates in 1929 asagainst 1939. (table 4).
The changes from 1929 to 1954 yielda clearer picture. With the exceptionof copper and steel, all the capacityutilization rates are higher in 1954; ifthe comparison were shifted from 1954to a high-level demand period, such as1955, the steel industry also would showa higher utilization ratio than in 1929.It is of interest to note that in the caseof cotton textiles the utilization ratioderived from spindles and spindle-hours increased 41 percent from 1939to 1954, whereas the correspondingutilization ratio derived from the elec-tric power and motor calculationsincreased 34 percent.
In considering the 1929-39 com-parison, it should be kept in mind thatcapital formation in the decade of the1930's was extremely low; OBE esti-mates of the net stock of equipment inmanufacturing were actually a bitlower in 1939 than in 1929, and theratio of stocks to output was essentiallyunchanged over the period.
Some qualifications
In using the change in electric motorutilization as outlined in this article tomeasure changes in equipment utiliza-tion, the assumption has been made thatthere has been no change in the techni-cal efficiency of motors over the periodunder consideration. According to elec-trical engineers, the electric motor hasnot changed much in this respect, main-ly because its efficiency—in the neigh-borhood of 90 percent—was alreadyvery high even as long as a generationago. Obviously the results would bebiased if more power were required torun a motor of a given horsepowerrating a given length of time today asagainst the 1920's. If anything, theremay be a bias in the opposite direction
because there has been some increase inthe efficiency of very large motors.
It has also been assumed that in agiven 2-digit industry the proportion oftotal power consumed by motors hasnot changed from 1929 to 1954. Asidefrom the few industries that are verylarge consumers of power—•aluminum,steel and certain chemicals—the mainuse of electric power other than motorsin manufacturing industry has tradi-tionally been for lighting. The littleevidence that bears on this point wouldnot invalidate the above assumption.In a study made for Westing-house Elec-tric Corporation in 1954, the authorsestimated that the lighting share ofpower sales made to industrial usersrose moderately from 1937 to the waryears and very early postwar years,
Table 5.—Electric Motors, Electric Power Consumption and Utilization Ratios, MineralIndustries 1, 1929, 1939, and 1954
Electricmotors
(1)Millions of
horsepower
Availablekilowatt-hours ofmotors 2
(2)Billions
Totalelectricpower
consumed
(3)Billions ofkilowatt-
hours
Percentused formotors
(4)
Electricpower
consumedby motors
(5)Billions ofkilowatt-
hours
Utilizationratio
(5) -=-(2)
(6)
Equivalent40-hourweeks
(6)><4.2
(7)
Total i
1929 . _19391954
Bituminous coal and lignite
19291939 '1954
Pennsylvania anthracite
192919391954 __
Iron ore
19291939 _ -1954
Major non ferrous ores 3
192919391954
All other *
192919391954
6 167 07
10 14
2.833 073 78
0. 89.91.91
0 32. 39
1 02
0.881 211.68
1.241.492.75
44 7551 3373 68
20. 5722 2897 4<>
6. 456. 646. 58
2 312. 827.44
6. 398.79
12.22
9.0310.8019. 95
7 4(57 56
12 79
2 51
3 76
0. 95.95.84
0 48.37
1. 17
2.472.463.06
1.061.233.96
92 192 192 l
92.192.192. 1
96 696.696 6
96.696.696.6
95 095.095.0
7 047 13
1? 09
2 312 373 46
0.87.88
0 46.36
1. 13
2.392.382.96
1.011.153.77
0 157139164
0 112106126
0. 136.132. 118
0 199. 127. 152
0. 373.271.242
0. Ill.106.189
0 665869
0 474553
0. 57. 55. 50
0 84.53.64
1.571. 141.02
0.47.45.79
1. Excludes crude petroleum and natural gas extraction industries.2. Includes constant adjustment for motor efficiency. See footnote (1) of table 2.3. Gold, silver, copper, lead, and zinc.4. Chiefly nonmetallic minerals.
Source: U.S. Department of Commerce, Office of Business Economics.
Digitized for FRASER http://fraser.stlouisfed.org/ Federal Reserve Bank of St. Louis
June 1963

14 SURVEY OF CURRENT BUSINESS
moved back to the 1937 proportion by1950-51 and was projected to movemoderately lower over the next decade.8
While lighting standards underwent avery marked improvement as a result ofthe war, it should be kept in mind thatthe substitution of the fluorescent lampfor the incandescent lamp, starting inthe early 1940's, meant a decline of 60percent in power consumption for agiven amount of light. There are nostatistics available on electricity usedfor lighting in manufacturing going-back to 1929.
Another factor that has been ignoredhas been the increased use of measuring,metering and control instruments, whichhave grown more rapidly than ma-chinery generally. There was no wayof taking account of this developmentin the present calculations. Some ofthe larger pieces of measuring and con-trol equipment, no doubt, have motorsattached to them and to this extentwould not bias the results shown here.
As noted earlier, the figures presentedhere take no account of machinerydirectly powered by internal combus-tion engines, steam engines and tur-bines, etc. In 1929 prime movers notattached to generators—that is, directlytied to factory equipment—accountedfor about 20 percent of horsepower inplace and by 1954 the proportion hadfallen to 12 percent. The problemhere is to determine the change in theutilization rate of machinery poweredby sources other than electric motors.In 1954 about two-thirds of the primemovers not driving generators were inchemicals, petroleum refining and blastfurnaces, steel works and rolling mills-It would probably be fair to say thatthe relative use of such equipmentincreased somewhat less than the over-all rise of 31 percent from 1929 to 1954shown for all manufacturing. In pe-troleum refining, where the steam tur-bine is predominant, the industry'soperating rate, according to published
data, rose from 78 percent in 1929 to 88percent in 1954, or by 1.3 percent. Onthe other hand, in an industry likesteel, equipment direct!}7 driven bysteam engines in 1954 was probabty ofrather ancient vintage, arid probablyrepresented high-cost, stand-by equip-ment that saw relatively little use ascompared with the modern continuousrolling mills powered by electric motors.
Finally, the calculations have ignoredcompletely equipment such as furnaces,ovens, storage bins, furniture, handtools, as well as transport equipment ofall types.9 To the extent that furnacesand ovens are used continuously, theirrelative use over time has changed onlyto the extent that the proportion of idleto active equipment has changed. Inthe case of transport equipment, handtools, etc., it would probably be reason-able to assume that the same factorsleading to more intensive use of electricmotor-driven equipment—the trend tomultiple shift work, the rationalizationof equipment use—have been operatinghere. As for office furniture and relateditems, a rather unimportant categoryfor manufacturing as a whole, its use
June 1903
has probably declined to the extentthat the workweek for office workershas declined.
Other Industries
Mining
The data for mining are less com-prehensive than for manufacturing.Although horsepower and electric powerconsumption statistics have been col-lected in each Census of Mineral Indus-tries, statistics pertaining to the extrac-tion of crude petroleum and naturalgas were omitted from the 1929 Census.In addition, electric motors account foronly two-thirds of the horsepower inplace in mining, exclusive of petroleumand natural gas, and in the latter theyare quite unimportant as a powersource.
Table 5 presents the basic statisticson horsepower of electric motors andelectricity consumption for all indus-tries combined, excluding crude petro-leum and natural gas, and for a few ofthe major industry groups for the years1929, 1939 and 1954. According to theFPC study (table 1), about 95 percent
INSTALLED GENERATING CAPACITY OF PRIVATELY OWNEDELECTRIC UTILITIES
Annual Hours Per Unit of Installed Capacity Have Increased Since the 1920's
Million Kw.
150
Thousand Hours
100 h
50 h
8. The Lighting Market, a Report for Westinghouse ElectricCorporation, Ebasco Services, Inc., April 1954, p. 6.
9. In 1947 purchases of new "production machinery andequipment" represented 87 percent of all purchases of newmachinery and equipment by manufacturing plants, accord-ing to the Census of Manufactures. The remaining 13 per-cent covered office furniture, machines and fixtures, motorvehicles, cafeteria furnishings, etc. Of course, not all "pro-duction machinery and equipment" is run by electricity.
Five Year AveragesHours Per Year Per Kw. of InstalledGenerating Capacity in. Place(right scale)
1920-24 25-29
-J 4
H 2
1912 17 20 25 30
U.S. Department of Commerce, Office of Business Economics
50 55 60Data: Derived from Electric Institute
6 3 - 6 - 6
Digitized for FRASER http://fraser.stlouisfed.org/ Federal Reserve Bank of St. Louis
June 1963

Juno 1963 SURVEY OF CURRENT BUSINESS 15
of all electricity consumed in miningis used to run motors.
For the group as a whole there was arise in the utilization rate of only 4percent from 1929 to 1954. Mining-out put, however, while comparativelyhigh in 1929, was quite depressed in1954 because of the recession, so thatit seems quite appropriate to make someadjustment on this account. Miningoutput, exclusive of crude petroleumand natural gas, rose 22K percent from1954 to 1955-57, according to FederalReserve data. If two-thirds of thisrise were taken as a rough approxima-tion of the increase in the relativeoperating rate, this would yield a 19percent rise from 1929 to the mid-1950Js.One explanation for the apparentlysmaller rise as compared with manufac-turing is that multiple-shift operationshave historically been common in manymining industries.
Electric utilities
Since electric utilities are required tofurnish power to satisfy customer peakloads, generating capacity in place,which accounts for about 40 percentof gross depreciable assets of electricutilities, has characteristically beenconsiderably in excess of average use.While the ratio of output to capacityfor privately-owned utilities increasedup to World War I, little progress wasmade during the 1920's when average
Table 6.—Hours per Year per Freight Carand Locomotive in Service, Class I Rail-roads
1921-̂ 4
1925-29
1930-34
1934-39 _._
1940-44
1945-49
1950-54
1955-59
I960
1961
1962
Freightcars *
874
969
635
754
1,152
1,102
981
928
871
852
895
Locomotives
Freight
1,765
1,811
1,186
1.320
2,036
1.937
1,816
2,174
2,195
2,115
2,233
Passen-ger
1,537
1,524
1,111
1,239
1,664
1,743
1.905
2,498
2,484
2, 42?
2,600
Switch-ing
(2)
(2)
(2)
(=0
(2)
4,779
5,036
5,576
5, 345
5,018
5,139
1. Time traveling, empty and loaded. Excludes timein terminals.
2. Not available.
Source: U.S. Department of Commerce, Office of BusinessEconomics. Estimated from data in Railroad Transporta-tion, Association of American Railroads.
Locomotives in Service and Average Hours Per Year, Freight andPassenger Service Combined, Class I Railroads
Thousand Units Thousand Hours
60 I ~l 3
40
20
Number of Locomofives in Service
Average for Year (left scale)
55-59
Five Year Averages
Hours Per Locomotive Per Year ,(r/gfif scale)
1921 25 30 35 40
U.S. Department of Commerce, Office of Business Economics
usage was in the neighborhood of 3,000hours per kilowatt of installed capacity,or about 35 percent of the 8,760 hourannual maximum. The ratio began toincrease in the late 1930's until about1948 and for the next decade fluctuatedin the neighborhood of 55-58 percent.
An important factor in the 60 percentrise in the utilization factor from the1920's to the 1950's has been the move-ment toward interconnection, by meansof which plants within the same systemand systems over wide geographicalareas have been interconnected, so thatthe need for standby generating capac-ity in individual systems has beenconsiderabhT reduced.
Railroads
Changes in the intensity of utiliza-tion of railroad equipment show amixed picture. The relative utilizationof freight cars has undergone littlechange from the 1920's to date and hasremained at a comparatively low level.Measured in terms of traveling time—both empty and loaded—the averagefreight car was used 1,000 hours in 1926and 995 hours in 1956. It may wellbe that if time spent waiting for un-loading and loading were taken intoaccount, average usage might in factshow some decrease over this period,
55 60Data: Derived from ICC & AAR Statistics
6 3 - 6 - 7
though firm data on this point arelacking.
Locomotive use is another matter.The shift from steam to diesel locomo-tives over the past generation has beenaccompanied by a clear-cut increasein relative utilization. Indeed, thischange has come about mainly becauseof the superior operating performanceof the diesel as compared with thesteam engine, and, among other things,has taken the form of reduced time-out for maintenance and repairs.Hours per locomotive assigned to freightservice in 1926, for example, averaged1,896 in 1926 as against 2,288 in 1956,an increase of approximately 20 percent.
With passenger service falling toexceptionally low levels, locomotivesassigned to passenger service havefallen by 80 percent from the mid-1920'sto the mid-1950's. Hours per locomo-tive have risen, however, from about1,500 to approximately 2,500 overthis period.
Locomotives in yard switching serv-ice find their most intensive use. Dataare not available back to the 1920's butthe available statistics suggest a con-siderable increase over time, given theprevalence and relative inefficiency ofthe steam locomotive in the earlierperiod. (Table 6.)
Digitized for FRASER http://fraser.stlouisfed.org/ Federal Reserve Bank of St. Louis
June 1963

16 SURVEY OF CURRENT BUSINESS June 1063
AppendixThe availability of some limited
information on employment by shiftsuggested the possibility of an alterna-tive approach to the estimation ofequipment hours of work in miningand manufacturing.
The 1939 Census of Mineral Indus-tries published, by detailed industry,employment by shifts, average numberof hours per shift, and the average num-ber of equivalent full-days that opera-tions were active in the year 1989.Table 7 presents a comparison of theequivalent number of 40-hour shiftsworked by equipment as derived fromthe two approaches, for all miningindustries (excluding crude petroleumand natural gas) and for a few of thelarger industries in which shift work isimportant (coal, iron ore, certain non-ferrous ores).
The calculations making use of theshift data are shown below for allmining industries. Employment is ex-pressed in terms of man-shifts (one manworking one shift per day). Averagehours per shift in 1939 were 7.3.
Man-shifts Average j Total daily(millions'1 ; t l - . i i l y hours hours
: " | (millions)
First Shift
Second Shift
Third Shift
Total
107. 0i
22 7 i!
4.5 i
13-1.2 : _
7.3
7.3
7.3
781. 1
1<K) 7
32. S
979. 6
On the assumption that machinesused per shift vary directly withemployment and that first shift ma-chines represent the maximum avail-able, we get an average utilization ofmachines of 9.16 hours per day.(979.6-4-107.0). However, the Censusalso reported that mines and relatedplants were active 203 equivalent full-time days in 1939, that is, 55.6 percentof 365 days. Multiplying 9.16 by .556gives 5.09 hours per day, which is 64percent of one 8-hour day. This com-pares with a ratio of 58 percent asderived from the horsepower and elec-tric power consumption data.
For manufacturing, productionworker employment data by shifts areavailable on overall basis for the yearending June 30, I960.10 According tothis study of the Bureau of Labor Sta-tistics, which was confined to employ-
1.0. "Supplementary Wage Benefits in Metropolitan Areas,1959-60," Monthly Labor Review, April 1961, Table 2, page 382.
merit in metropolitan areas, 77.2 per-cent of all production workers wereemployed on the first sh i f t , 16.4 on thesecond, and 6.4 on the third and othershifts. On the same assumption usedfor mining, we get from this calculation51.8 hours per week for machinery(0.772 X 40 4- 0.164 X 40 + 0.064 X40) -^- 0.772. This figure was movedback from 1959-60 to 1954 through theuse of some recently published data onmanufacturing capacity utilization,making some allowance for the strike inthe summer and fall of 1959. Thisrough adjustment of 5 percent yielded afigure of 49.1 hours.11
Since the motor calculations weremade with respect to a theoretical 365day capacity, a similar ad jus tmentmust be made for the employment cal-culations, though there is little infor-mation for such an adjustment. Thefact that Saturday and Sunday aretypically not workdays and the fact ofpart-time employment are already re-flected in the average weekly hoursfigure. One downward adjus tment of 5percent was made to allow for hourspaid for but not w or Iced because ofvacations, holidays, sick leave, etc. Asecond adjus tment was necessary toallow for the fact that even on the firstshift not all work stations could be con-sidered occupied. Since 1954 followed ayear of near-capacity operations, it wasdecided to measure this slack by thechange in employment from May 1953,the cyclical peak in manufacturing em-ployment, to the average level in 1954.This yielded a 10 percent decline. Onthis very crude basis we get an averageof 41.7 hours per week as against 35hours, the figure obtained from theaggregate calculations derived from themotor and power consumption compu-tations shown in table 2.
There are at least two major short-comings with these calculations formanufacturing. First of all it is prob-ably not appropriate to assume thatmachine hours by shift would be pro-portional to employment by shift. Forsome industries, such as metal fabricat-ing, employment on late-shifts tends tobe overweighted with maintenanceworkers rather than machinery-opera-
tives. In the case of continuous indus-tries like petroleum and industrialchemicals, however, the reverse is true.In a 1952 study it was found that onlyone-third of "production" workers inrefineries were employed on late shifts,even though refineries are run on a 24-hour basis through the year (aside frommaintenance shut-downs). On bal-ance, the employment shift data inin anuf act uring probably underst at e late-shift operations of equipment.12
Table 7.—Number of Equivalent 40-HourShifts Worked by Equipment in SelectedMining Industries as Estimated fromEmployment Data by Snifts and fromMotor'Utilization Data, 1939
All mining industries !
Bituminous coal and litrnite...
Pamsylvania anthraci te
Iron ore
Cor-por ore
Lead and zinc oves
Gold ore
From em-ploymentby 'shifts
0 fi4
.."4
1 3D
93
1 IS
Frommotor uti-
lization
0 58
.45
.53
1 10
95
1 31
11. Estimates were prepared by Frank DcLeeuw of theFederal Reserve and appear on page 129 of "Measures ofProductive Capacity" in Hearings before the Subcommittee onEconomic Statistics of the Joint Economic Committee, 1962.
The second major difficulty concernsthe assumption that all machines on thefirst shift represent total machines avail-able and can be appropriately adjusteddownward by the 10 percent figure basedon the change in employment from the1953 peak to 1954. Only fragmentaryevidence is available on this point forscattered time periods. In some un-published BLS studies made in early1951 covering metalworking industries,it was found that actual employment onthe first shift was approximately three-fourths of the maximum that could beemployed on the first shift with theavailable equipm ent. In t extiles, where3-shift work is common, Census figuresindicate that first shift looms active atthe end of 1962 as a percent of looms inplace were 97 percent for cotton mills,87 percent for man-made fiber and silkmills, and 76 percent for woolen mills.The rough 10 percent adjustment usedabove for all manufacturing is probablytoo low, but the resultant of the twomajor data biases discussed in thisAppendix cannot be determined.
12. This is brought out by Alan Strout in an unpublishedpaper prepared for the Harvard Economic Research Projectand Resources for the Future, Inc. (1961).
Digitized for FRASER http://fraser.stlouisfed.org/ Federal Reserve Bank of St. Louis
June 1963