The use of satellite data in Polar Regions - ECMWF...ECMWF Seminar on Polar Meteorology, 4-8...
12
ECMWF Seminar on Polar Meteorology, 4-8 September 2006 103 The use of satellite data in Polar Regions Tony McNally ECMWF, Reading, U.K. 1. Introduction Harsh environmental conditions in polar regions severely restrict the possibilities for in-situ measurement of the surface and atmospheric state. There is thus a great emphasis placed upon optimizing the exploitation of remotely sensed satellite observations. This paper reviews the types of satellite data available for NWP and highlights the strengths and some particular difficulties associated with their use in polar regions. The satellite observations currently used by ECMWF in polar regions are summarized in table 1. Note that data from geostationary satellites are not usable above 60 degrees of latitude and as a result very high temporal resolution satellite observations are not possible. The observation time sampling is restricted to successive overpasses of polar orbiting spacecraft. However, a unique feature of the poles is that the return time is typically only 100 minutes and when a particular instrument is carried on a number of different platforms (e.g. the AMSUA is currently on 5 satellites) the time sampling is significantly enhanced. Thus a major advantage of using satellite data in polar regions is the very dense space and time sampling that can be achieved. Satellite Agency Platforms Instruments USA NOAA N15 / N16 / N17 / N18 AMSUA/AMSUB/MHS/HIRS/SBUV NASA AQUA / TERRA AIRS / MODIS-AMV / AMSUA EUMETSAT METOP-A* AMSUA / MHS / HIRS / IASI USA Navy DMSP F13 / F14 / F15 / F16* SSM/I(S) ESA ENVISAT MIPAS / GOMOS / SCIAMACHY NASA QuikSCAT SeaWinds GFZ (Germany) CHAMP GPS USA (UCAR) / Taiwan COSMIC GPS Table 1 Polar satellite observations used by ECMWF. An * indicates pre-operational usage. Data from instruments in italics are assimilated as pre-converted retrieved products. The majority of satellite observations assimilated at ECMWF are radiance data from passive nadir-looking instruments (infrared and microwave) and the use of these will be the main focus of this paper. However, in some cases the raw instrument data are pre-converted to retrieved products (usually generated external to ECMWF by the data provider). Retrieved products are used if direct assimilation of the raw measurement involves a particularly complex observation operator (e.g. ultraviolet radiative transfer for ozone observations) or if it is impractical to transmit large raw data volumes to ECMWF in real time (in the case of MODIS AMW winds). 2. Satellite radiance assimilation It is very important to understand that satellite instruments do not measure temperature (or indeed any of the other geophysical quantities often associated with satellite remote sensing). The instruments measure the
Transcript of The use of satellite data in Polar Regions - ECMWF...ECMWF Seminar on Polar Meteorology, 4-8...

ECMWF Seminar on Polar Meteorology, 4-8 September 2006 103
The use of satellite data in Polar Regions
Tony McNally
ECMWF, Reading, U.K.
1. Introduction Harsh environmental conditions in polar regions severely restrict the possibilities for in-situ measurement of the surface and atmospheric state. There is thus a great emphasis placed upon optimizing the exploitation of remotely sensed satellite observations. This paper reviews the types of satellite data available for NWP and highlights the strengths and some particular difficulties associated with their use in polar regions.
The satellite observations currently used by ECMWF in polar regions are summarized in table 1. Note that data from geostationary satellites are not usable above 60 degrees of latitude and as a result very high temporal resolution satellite observations are not possible. The observation time sampling is restricted to successive overpasses of polar orbiting spacecraft. However, a unique feature of the poles is that the return time is typically only 100 minutes and when a particular instrument is carried on a number of different platforms (e.g. the AMSUA is currently on 5 satellites) the time sampling is significantly enhanced. Thus a major advantage of using satellite data in polar regions is the very dense space and time sampling that can be achieved.
Satellite Agency Platforms Instruments USA NOAA N15 / N16 / N17 / N18 AMSUA/AMSUB/MHS/HIRS/SBUV NASA AQUA / TERRA AIRS / MODIS-AMV / AMSUA EUMETSAT METOP-A* AMSUA / MHS / HIRS / IASI USA Navy DMSP F13 / F14 / F15 / F16* SSM/I(S) ESA ENVISAT MIPAS / GOMOS / SCIAMACHY NASA QuikSCAT SeaWinds GFZ (Germany) CHAMP GPS USA (UCAR) / Taiwan COSMIC GPS
Table 1 Polar satellite observations used by ECMWF. An * indicates pre-operational usage. Data from instruments in italics are assimilated as pre-converted retrieved products.
The majority of satellite observations assimilated at ECMWF are radiance data from passive nadir-looking instruments (infrared and microwave) and the use of these will be the main focus of this paper. However, in some cases the raw instrument data are pre-converted to retrieved products (usually generated external to ECMWF by the data provider). Retrieved products are used if direct assimilation of the raw measurement involves a particularly complex observation operator (e.g. ultraviolet radiative transfer for ozone observations) or if it is impractical to transmit large raw data volumes to ECMWF in real time (in the case of MODIS AMW winds).
2. Satellite radiance assimilation It is very important to understand that satellite instruments do not measure temperature (or indeed any of the other geophysical quantities often associated with satellite remote sensing). The instruments measure the

MCNALLY, TONY: THE USE OF SATELLITE DATA IN POLAR REGIONS
104 ECMWF Seminar on Polar Meteorology, 4-8 September 2006
radiation reaching the top of the Earth’s atmosphere in a number of different spectral bands (or channels). In its simplest form this radiation is a result of emission from the Earth’s atmosphere and underlying surface (by virtue of its temperature) modified by absorption in the atmosphere. The latter depends on the atmospheric composition of absorbing gas species and the presence clouds. In cloud free conditions the radiation L measured in a channel for which the primary absorbing species concentration is well mixed and known (e.g. microwave radiances in the 50GHz oxygen band) is a function of the atmospheric temperature profile T(z) alone,
0
dL B T zdzτ νν ν
∞ ⎡ ⎤= ⎢ ⎥⎣ ⎦∫( )( ) ( , ( )) dz
where B is the Planck function and t(v) is the atmospheric transmission at frequency v. It can be seen that the radiance is essentially a weighted vertical integral of the atmospheric temperature profile where the weighting is determined by the derivative of the transmittance with height - the so called “weighting function”. Channels located in parts of the spectrum where the absorption is weak have a peak sensitivity low in the atmosphere and provide information on the lower tropospheric and surface temperature (see figure 1a).
a) b)
Figure 1: Examples of radiance observations from (a) AMSUA channel 3 - sensitive to the lower troposphere and surface and (b) AMSUA channel 14 - sensitive to the upper stratosphere (in both cases red colours indicate warm
scenes and blue colours indicate cold scenes.
Channels located in parts of the spectrum where the absorption is strong have a peak sensitivity higher in the atmosphere and provide information on stratospheric temperatures (see figure 1b). A summary of the channel sensitivities for three important instruments (HIRS: High-resolution InfraRed Sounder, AMSUA: Advanced Microwave Sounding Unit, AIRS: Atmospheric InfraRed Sounder) can be seen in the weighting functions of figure 2.

MCNALLY, TONY: THE USE OF SATELLITE DATA IN POLAR REGIONS
ECMWF Seminar on Polar Meteorology, 4-8 September 2006 105
Figure 2 Weighting functions for the HIRS, AMSUA and AIRS instruments describing the sensitivity of the radiance
in a given channel to different parts of the atmosphere.
In general satellite instruments are designed to measure radiation in a range of channels so as to give a good vertical sampling of information on atmospheric temperature from the surface to the stratosphere. However, it can be seen in figure 2 that individual channel weighting functions are broad and there is significant overlap between channels. A consequence of this is that these nadir-looking satellite sounding systems cannot provide high vertical resolution information on atmospheric temperature.
The radiance observations are assimilated directly within the 4D-Var analysis (see Andersson 2007 for details of the analysis system), but there are a number of issues specific to the polar regions which must be considered:
• radiative transfer at high latitudes
• quality control (cloud detection) over complex surfaces
• systematic errors in the observations and NWP model
3. Radiative transfer in polar regions The radiative transfer equation describes the link between the sate of the atmosphere (i.e. its temperature and composition) and the radiance measured by a satellite. For radiance assimilation it becomes the observation operator and is a crucial element of the analysis.
The radiative transfer models used in radiance assimilation are usually fast regression parameterizations (e.g. RTTOV - Eyre 1991) from much more accurate, but prohibitively slow, line-by-line radiation models. In extremely cold and dry polar atmospheres care must be taken to ensure that the domain in which the regressions were originally trained has not been exceeded and that the fast RT model is still sufficiently accurate. Similarly, assumptions made about trace gas concentrations must also be checked for validity in extreme polar cases, as should other approximations such as ignoring the effect of Zeeman splitting on microwave radiances (given the large magnetic field strengths and lapse rates - see Han 2006 ).
An aspect of the radiative transfer requiring great care is the modelling of surface emissivity - particularly at microwave frequencies. Snow and ice have highly variable and complex emissivities even in their pure form (see

MCNALLY, TONY: THE USE OF SATELLITE DATA IN POLAR REGIONS
106 ECMWF Seminar on Polar Meteorology, 4-8 September 2006
figure 3). It can be seen that near 50GHz, where the most important satellite temperature sounding channels are located, the emissivity can vary between 0.5 and 1.0 depending on the particular type of ice cover.
Figure 3 Variation in ice surface emissivity at different microwave frequencies (from Yan et al 2004).
For a microwave window channel almost exclusively sensitive to the surface emission this uncertainty can change the radiance by tens of Kelvin. However, even for a microwave temperature sounding channel that has just a 1% sensitivity to the surface this can result in a error of a few degrees Kelvin - far in excess of the useful atmospheric signal in such channels. The situation can be further complicated when the sub-satellite surface is heterogeneous compared to the pixel size (typically a few tens of Km). Mixtures of snow and ice, and the common occurrence of large melt-ponds of open water present an extremely challenging problem for emissivity modeling (Fig. 4).
Figure 4: IR imagery from MODIS showing large melt-ponds of open water over polar ice
4. Radiance quality control in polar regions With modern operational satellite instruments QC is more concerned with identifying cases where our assumptions in the assimilation are invalid (e.g. that the scene is free from clouds) rather than the identification of bad observations (which are rare). Cloud detection for infrared radiances and precipitation detection for

MCNALLY, TONY: THE USE OF SATELLITE DATA IN POLAR REGIONS
ECMWF Seminar on Polar Meteorology, 4-8 September 2006 107
microwave data are extremely important as the impact of undetected cloud and rain on the observations can far exceed the useful atmospheric signals in the temperature sounding channels.
A primary difference between cloud detection for infrared observations over polar regions compared to other areas is that the effect of cloud on the radiances can have the opposite sign to that expected. At low latitudes a cold cloud usually obscures a warm atmosphere / surface below and produces a cold anomaly in infrared window channels (the basis of many cloud detection checks). However, at high polar latitudes the cloud may be significantly warmer than the cold underlying atmosphere / surface and produce a warm anomaly in the window channel check (see figure 5). Simple single channel checks may fail to identify cloud contamination in such conditions, but more complex pattern recognition algorithms (such as that used for AIRS, McNally and Watts 2005) have been found to be more robust.
Figure 5 Infrared (11 micron) MODIS image showing a warm cloud over a cold ice surface
The detection of clouds and rain may be further complicated if we have a poor knowledge of the underlying surface emissivity and / or skin temperature. Most schemes assume some prior knowledge of these to be provided by the NWP model. Uncertainties in either introduce errors in the computed window channel radiance which may (in the worst case) completely mask the computed window channel anomaly and lead the scene being incorrectly flagged cloud free.
Another aspect of cloud detection particular to polar regions is the need to identify if the scene is contaminated by polar stratospheric clouds (PSC). These are very common phenomena when stratospheric temperatures are sufficiently low. However they are optically thin clouds and would generally not be picked up by simple window channel based cloud detection schemes.

MCNALLY, TONY: THE USE OF SATELLITE DATA IN POLAR REGIONS
108 ECMWF Seminar on Polar Meteorology, 4-8 September 2006
a)
b)
Figure 6 (a) PSC distribution detected by MIPAS - clouds indicated by the red pixels and (b) cold radiance departures due to the clouds shown in blue for AIRS channel 75 (around 15 microns)
If not detected they introduce significant perturbations in channels sensitive to the stratosphere which may be incorrectly aliased into temperature / ozone adjustments in the analysis (see figure 6). Again pattern recognition methods which examine all channels for the signature of clouds are most robust in the detection of PSCs, particularly when applied to high spectral resolution sounders such as AIRS.
5. Systematic errors in polar regions Uncorrected biases in satellite observations or the radiative transfer model are a serious problem as they can very quickly propagate into large scale biases in the analysis. Satellite bias corrections have traditionally been evaluated by monitoring mean departures of the observed data from values computed from the NWP short-range forecast background (so called innovation or O minus B departures). Corrections evaluated in this way implicitly

MCNALLY, TONY: THE USE OF SATELLITE DATA IN POLAR REGIONS
ECMWF Seminar on Polar Meteorology, 4-8 September 2006 109
assume the NWP model is free from bias and attribute any systematic disagreement to bias in the observations. This assumption probably least valid in polar regions.
Figure 7 shows mean O minus B departures for AMSUA channel 14 and AIRS channel 75 averaged over a one month period in July 2004. Both channels are sensitive to temperature in the upper stratosphere / mesosphere, but one is in the oxygen microwave band (53GHz) and the other in the carbon dioxide infrared band (15micron).
Figure 7 Mean O minus B departures for AMSUA channel 14 and AIRS channel 75 averaged over a one month
period in July 2004
Despite being in completely different parts of the spectrum and having very different radiative transfer models, the two channels display very similar patterns of systematic disagreement with the NWP model - most noticeably the large cold bias at the southern winter pole. An obvious interpretation of this result is that it is not the satellite observations that are biased, but the NWP model (this conclusion is supported by other observational evidence not shown).
Another less obvious impact of NWP model systematic error upon the satellite monitoring is the evaluation of scan dependent biases. Most nadir-looking satellite instrument scan perpendicular to the direction of flight to build up a swath of radiance observations (rather than data just at the sub-satellite point). Biases are often observed which depend on the scan position and are usually attributed to problems of instrument alignment or interference with the spacecraft. However, large systematic errors in the NWP model’s representation of the atmospheric temperature lapse rate can also force a “false limb effect” in the computed radiances which then

MCNALLY, TONY: THE USE OF SATELLITE DATA IN POLAR REGIONS
110 ECMWF Seminar on Polar Meteorology, 4-8 September 2006
manifests as a scan dependent bias in the departure statistics (see figure 8). The effect can be large and asymmetric (due to the uneven latitude sampling for the instrument left and right side views).
Figure 8 Asymmetric scan dependent biases resulting from NWP model systematic errors
Even when there is strong evidence to suggest that a particular component of the observed bias originates from NWP model systematic error it is not necessarily clear what is the best cause of action. Obviously applying an erroneous correction to the observations to compensate for a model error is the wrong thing to do. It will produce a biased analysis and may actually reinforce the model error problem (by weakening the influence of other uncorrected observations). In principle the component of bias could be left uncorrected. Then, assimilation of the (unbiased) satellite observations would generate mean analysis increments which would correct the NWP bias. However, this can be problematic as data assimilation systems are usually not tuned to allow systematic (forced) adjustments. An example of this is shown in figure 9 where stratospheric radiances from AMSUA channel 14 and AIRS channel 75 are used with no correction applied. As expected the assimilation of these data corrects the large cold temperature bias near the top of the model, but in doing so has introduce spurious oscillations (ringing) in the analysis below.
Figure 9 Spurious temperature oscillations forced by the assimilation of uncorrected stratospheric radiances
6. Examples of the successful exploitation of satellite data in Polar Regions Despite the particular challenges of assimilating radiance data in polar regions there are a number of well documented examples that demonstrate the significant benefits of using satellite observations in these areas. A number of these are listed below:
MCNALLY, TONY: THE USE OF SATELLITE DATA IN POLAR REGIONS
ECMWF Seminar on Polar Meteorology, 4-8 September 2006 111
Validation of ERA-40 and operational analyses suggest that the majority of satellite radiance observations are used well in polar areas and are a vital component of the observing system (King 2007- this volume)
Surface mapping products are now taken for granted and are a main-stay of polar ice / glacial climate studies (Drinkwater 2007- this volume)
Satellite based real-time monitoring / forecasting sudden warming of the polar stratosphere (see below)
Satellite observations are the main-stay of polar ozone analysis / parameterization validation (see below)
MODIS AMV winds products have a strong positive impact on polar wind field (Andersson 2007- this volume)
Temperature sounding radiances known to provide a strong constraint on the polar wind field (see below)
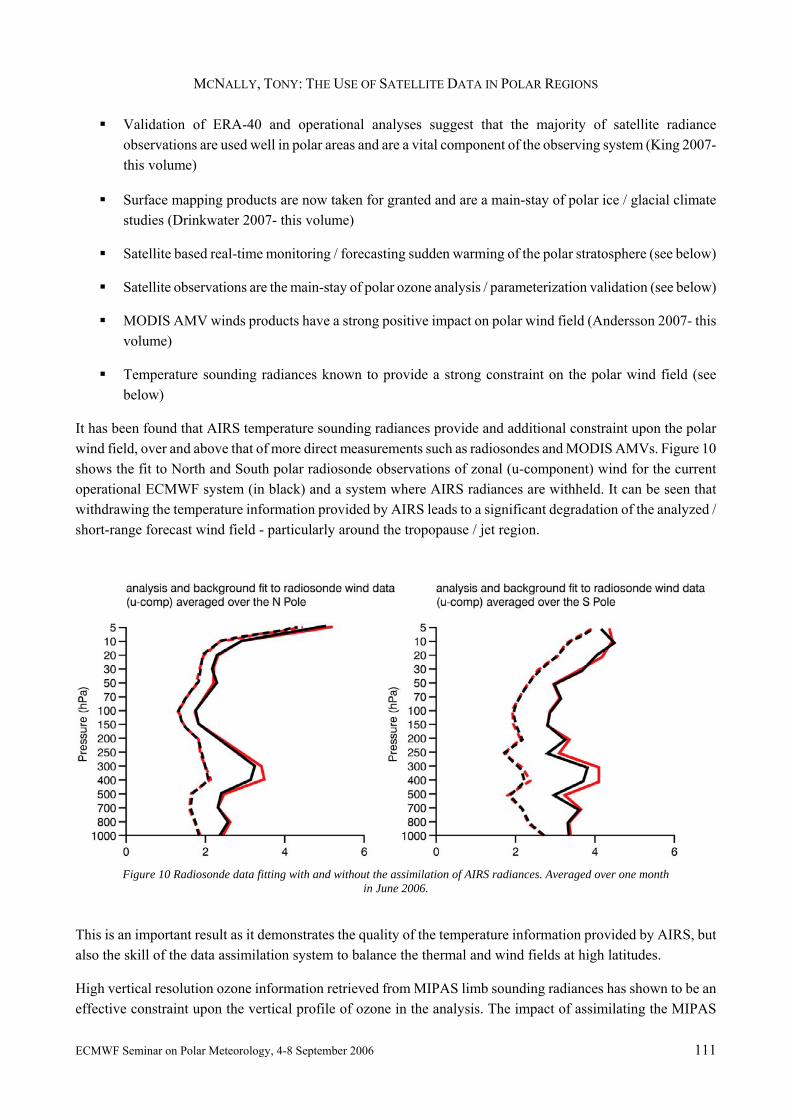
It has been found that AIRS temperature sounding radiances provide and additional constraint upon the polar wind field, over and above that of more direct measurements such as radiosondes and MODIS AMVs. Figure 10 shows the fit to North and South polar radiosonde observations of zonal (u-component) wind for the current operational ECMWF system (in black) and a system where AIRS radiances are withheld. It can be seen that withdrawing the temperature information provided by AIRS leads to a significant degradation of the analyzed / short-range forecast wind field - particularly around the tropopause / jet region.
Figure 10 Radiosonde data fitting with and without the assimilation of AIRS radiances. Averaged over one month
in June 2006.
This is an important result as it demonstrates the quality of the temperature information provided by AIRS, but also the skill of the data assimilation system to balance the thermal and wind fields at high latitudes.
High vertical resolution ozone information retrieved from MIPAS limb sounding radiances has shown to be an effective constraint upon the vertical profile of ozone in the analysis. The impact of assimilating the MIPAS

MCNALLY, TONY: THE USE OF SATELLITE DATA IN POLAR REGIONS
112 ECMWF Seminar on Polar Meteorology, 4-8 September 2006
retrievals is seen in figure 11 where analyses with and without MIPAS are compared to verifying in situ ozone measurements made from the Neumayer station. The MIPAS produces an analysis in much better agreement, capturing significant vertical detail.
Figure 11 Analyses with MIPAS (red) and without MIPAS (blue) compared verifying ozone observations from the Neumayer station (black dash) in September 2003
Sudden warmings of the stratosphere are a dramatic phenomenon regularly observed in the northern polar winter and are well documented in climate data records. Satellite sounding observations give us an additional insight into the timing and vertical structure of these events. Figure 12a shows a time series of polar microwave radiance observations from the NOAA-15 satellite for a number of winter seasons 1999 to 2002. The sudden warmings are the conspicuous spikes in the time series. A closer inspection of one particular event (in figure 12b) shows an interesting lag in the onset of the warming event - first seen in AMSUA channel 14 (peaking around 1hPa) and propagating down to AMSU channel 12 (peaking around 20hPa). After the warming has decayed the coincidence of the observed radiance in all four channels indicates the atmosphere has entered an isothermal state.
a) b)
Figure 12 Time series of AMSUA brightness temperatures averaged over the North Pole (> 70) for (a) from November 1998 to January 2002 and (b) a detailed view of the sudden warming event in January 1999.

MCNALLY, TONY: THE USE OF SATELLITE DATA IN POLAR REGIONS
ECMWF Seminar on Polar Meteorology, 4-8 September 2006 113
Apart from providing useful diagnostics describing the structure of sudden warmings, it is believed that satellite data have a strong influence upon the successful forecasting of these events. Sudden warmings in Antarctica are rare, but a very dramatic event took place on September 25 2002 (Simmons et al. 2003). Figure 13 shows the ECMWF analysis of the event when (a) radiosonde data are withheld and (b) when satellite sounding radiances are withheld. Superficially the two analyses appear very similar, but the 120 hour forecasts made five days prior to the event are very different. Without the satellite data the forecast is quite unrealistic whereas with the satellite data (even with the radiosonde observations removed) the forecast verifies remarkable well. These results suggests that radiosonde data may be sufficient to detect and analyse this particular event after it has happened, but that satellite data are crucial to capturing the environmental conditions needed to forecast the event.
Figure 13 ECMWF analyses and 5 day forecasts of the 2002 Southern sudden warming event when radiosonde data are withheld (left panels) and when satellite radiance data are withheld (right panels)
7. Summary and Conclusions There is a huge volume of very high spatial resolution and moderately high temporal resolution satellite data available for NWP in polar regions. The variety of spectral sampling (both in the microwave and infrared) combining nadir and limb geometry observations also provides a good vertical sampling of the atmosphere.

MCNALLY, TONY: THE USE OF SATELLITE DATA IN POLAR REGIONS
114 ECMWF Seminar on Polar Meteorology, 4-8 September 2006
In addition to extremes of temperature and composition, the polar surface presents some particular problems for the use of nadir-viewing sounding radiances due to the highly variable and often unknown surface emissivity. This limits the accuracy of the radiative transfer calculations, but may also compromise the ability to detect clouds and precipitation in the radiance data.
Systematic errors in the NWP model polar stratosphere can detract from our ability to detect and correct biases in the observations. Great care must be taken in the diagnosis / attribution of bias.
Despite the difficulties satellite data is already a proven main-stay of polar meteorology.
7.1. Aknowledgements
The author wishes to thank numerous members of the ECMWF satellite section who have contributed to the seminar presentation and this text.
8. References Bormann, N. and J.-N. Thépaut, 2004: Impact of MODIS Polar Winds in ECMWF's 4DVAR Data Assimilation System. Mon. Wea. Rev., 132, 929-940.
Bouttier, F., 2001:The development of 12-hourly 4D-Var. ECMWF Tech. Memo. 348, pp 21.
Eyre J.R., 1991, A fast RT model for satellite sounding systems ECMWF Tech. Memo. 186
Han Y, 2006 A fast RT model for SSM/IS upper air sounding channels affected by Zeeman Splitting. Proc XV International TOVS Study Conference, Maratea Italy (in press)
Healy, S. B., J. R. Eyre, M. Hamrud and J.-N. Thépaut, 2006: Assimilating GPS radio occultation measurements with two-dimensional bending angle observation operators. EUMETSAT/ECMWF Fellowship Programme Research Reports, 16, pp 21.
Key, J. R., D. Santek, C.S. Velden, N. Bormann, J.-N. Thépaut, L.P. Riishojgaard, Y. Zhu and W. P. Menzel, 2003: Cloud-drift and water vapor winds in the polar regions from MODIS. IEEE Trans. Geosci. Remote Sens., 41, 482-492.
Simmons, A. J. and A. Hollingsworth, 2002: Some aspects of the improvement in skill of numerical weather prediction. Q. J. R. Meteorol. Soc. 128, 647-677.
Simmons, A., M. Hortal, G. Kelly, A. McNally, A. Untch and S .Uppala 2003 ECMWF analyses of stratospheric winter polar vortex break up: September 2002 in the Southern Hemisphere and related events. J.Atmos. Sc., 62, 668-689
Thépaut, J.N. and E. Andersson, 2003: Assimilation of high-resolution satellite data. ECMWF Newsletter, 97, 6-12.
Uppala, S. M., P. W. Kållberg, A. J. Simmons, U. Andrae, V. da Costa Bechtold, M. Fiorino, J. K. Gibson, J. Haseler, A. Hernandez, G. A. Kelly, X. Li, K. Onogi, S. Saarinen, N. Sokka, R. P. Allan, E. Andersson, K. Arpe, M. A. Balmaseda, A. C. M. Beljaars, L. van de Berg, J. Bidlot, N. Bormann, S. Caires, F. Chevallier, A. Dethof, M. Dragosavac, M. Fisher, M. Fuentes, S. Hagemann, E. Hólm , B. J. Hoskins, L. Isaksen, P. A. E. M. Janssen, R. Jenne, A. P. McNally, J.-F. Mahfouf, J.-J. Morcrette, N. A. Rayner, R. W. Saunders, P. Simon, A. Sterl, K. E. Trenberth, A. Untch, D. Vasiljević, P. Viterbo and J. Woollen, 2005: The ERA-40 re-analysis. Q. J. R. Meteorol. Soc. 131, 2961-3012.
Yan B., F. Weng, K.Okamoto 2004 Improved Estimation of Snow Emissivity from 5 to 200 GHz, submitted to IEEE Trans. on Geosc. and Remote Sensing.