The use of personality test norms in work settings ...
23
University of Nebraska - Lincoln DigitalCommons@University of Nebraska - Lincoln Management Department Faculty Publications Management Department 9-2009 e use of personality test norms in work seings: Effects of sample size and relevance Robert P. Te University of Tulsa, [email protected] Jenna R. (Fitzke) Pieper University of Nebraska-Lincoln, [email protected] Patrick L. Wadlington Pearson Testing, Bloomington, Minnesota Sco A. Davies Pearson Testing, Bloomington, Minnesota Michael G. Anderson CPP Inc., Mountain View, California See next page for additional authors Follow this and additional works at: hp://digitalcommons.unl.edu/managementfacpub Part of the Applied Behavior Analysis Commons , Business Administration, Management, and Operations Commons , Community Psychology Commons , Human Resources Management Commons , Industrial and Organizational Psychology Commons , Management Sciences and Quantitative Methods Commons , Organizational Behavior and eory Commons , Personality and Social Contexts Commons , and the Strategic Management Policy Commons is Article is brought to you for free and open access by the Management Department at DigitalCommons@University of Nebraska - Lincoln. It has been accepted for inclusion in Management Department Faculty Publications by an authorized administrator of DigitalCommons@University of Nebraska - Lincoln. Te, Robert P.; Pieper, Jenna R. (Fitzke); Wadlington, Patrick L.; Davies, Sco A.; Anderson, Michael G.; and Foster, Jeff, "e use of personality test norms in work seings: Effects of sample size and relevance" (2009). Management Department Faculty Publications. 114. hp://digitalcommons.unl.edu/managementfacpub/114
Transcript of The use of personality test norms in work settings ...

University of Nebraska - LincolnDigitalCommons@University of Nebraska - Lincoln
Management Department Faculty Publications Management Department
9-2009
The use of personality test norms in work settings:Effects of sample size and relevanceRobert P. TettUniversity of Tulsa, [email protected]
Jenna R. (Fitzke) PieperUniversity of Nebraska-Lincoln, [email protected]
Patrick L. WadlingtonPearson Testing , Bloomington, Minnesota
Scott A. DaviesPearson Testing , Bloomington, Minnesota
Michael G. AndersonCPP Inc., Mountain View, California
See next page for additional authorsFollow this and additional works at: http://digitalcommons.unl.edu/managementfacpubPart of the Applied Behavior Analysis Commons, Business Administration, Management, and
Operations Commons, Community Psychology Commons, Human Resources ManagementCommons, Industrial and Organizational Psychology Commons, Management Sciences andQuantitative Methods Commons, Organizational Behavior and Theory Commons, Personality andSocial Contexts Commons, and the Strategic Management Policy Commons
This Article is brought to you for free and open access by the Management Department at DigitalCommons@University of Nebraska - Lincoln. It hasbeen accepted for inclusion in Management Department Faculty Publications by an authorized administrator of DigitalCommons@University ofNebraska - Lincoln.
Tett, Robert P.; Pieper, Jenna R. (Fitzke); Wadlington, Patrick L.; Davies, Scott A.; Anderson, Michael G.; and Foster, Jeff, "The use ofpersonality test norms in work settings: Effects of sample size and relevance" (2009). Management Department Faculty Publications.114.http://digitalcommons.unl.edu/managementfacpub/114
AuthorsRobert P. Tett, Jenna R. (Fitzke) Pieper, Patrick L. Wadlington, Scott A. Davies, Michael G. Anderson, and JeffFoster
This article is available at DigitalCommons@University of Nebraska - Lincoln: http://digitalcommons.unl.edu/managementfacpub/114

639
Published in Journal of Occupational and Organizational Psychology 82:3 (September 2009), pp. 639–659; doi: 10.1348/096317908X336159Copyright © 2009 The British Psychological Society. Used by permission.Submitted May 31, 2007; revised June 4, 2008.
The use of personality test norms in work settings: Effects of sample size and relevance
Robert P. Tett,1 Jenna R. Fitzke,2 Patrick L. Wadlington,3 Scott A. Davies,3 Michael G. Anderson,4 and Jeff Foster 5
1. Department of Psychology, University of Tulsa, Tulsa, Oklahoma2. University of Wisconsin–Madison, Madison, Wisconsin3. Pearson Testing, Bloomington, Minnesota4. CPP Inc., Mountain View, California5. Hogan Assessment Systems, Tulsa, Oklahoma
Corresponding author — Dr. Robert P. Tett, Department of Psychology, Uni-versity of Tulsa, Tulsa, OK 74104-3189, USA, email [email protected]
AbstractThe value of personality test norms for use in work settings depends on norm sample size (N) and relevance, yet research on these criteria is scant and corresponding standards are vague. Using basic statistical principles and Hogan Personality Inventory (HPI) data from 5 sales and 4 trucking sam-ples (N range = 394–6,200), we show that (a) N >100 has little practical impact on the reliability of norm-based standard scores (max=±10 percen-tile points in 99% of samples) and (b) personality profiles vary more from using different norm samples, between as well as within job families. Aver-aging across scales, T-scores based on sales versus trucking norms differed by 7.3 points, whereas maximum differences averaged 7.4 and 7.5 points within the sets of sales and trucking norms, respectively, corresponding in each case to approximately ±14 percentile points. Slightly weaker results obtained using nine additional samples from clerical, managerial, and finan-cial job families, and regression analysis applied to the 18 samples revealed demographic effects on four scale means independently of job family. Per-sonality test developers are urged to build norms for more diverse popu-lations, and test users, to develop local norms to promote more meaning-ful interpretations of personality test scores.
Personality test scores are often interpreted in employment settings with refer-ence to scale norms (i.e. means and standard deviations; Bartram, 1992; Cook et al., 1998; Muller & Young, 1988; Van Dam, 2003). Accordingly, the accuracy of norm-transformed scores in capturing an individual’s relative standing on a set of personality scales rests on the quality of the underlying norms. Two critical and generally recognized concerns regarding norm use are (a) the size of the nor-mative sample (N) and (b) the relevance of the normative sample to the popula-tion to which the given test taker belongs. Despite being recognized as important,
digitalcommons.unl.edu

640 Te T T e T a l . i n J o u r n a l o f oc c u pat i o n a l a n d or g a n i z at i o n a l p s y c h o l o g y 82 (2009)
sample size and population relevance (i.e. representativeness) have received lit-tle research attention and standards regarding these qualities are ambiguous. In this article, we show what happens when personality profiles are generated un-der varying conditions regarding the size and source of the normative sample, with the overall aim of refining best practices in the use of personality test norms. We begin by considering how such norms are used in work settings.
Uses of personality test norms in the workplaceA scale score, by itself, reveals little as to the location of an individual on the mea-sured dimension. Standard scores, such as z or T, use a norm sample mean and standard deviation to clarify where an individual respondent falls on the mea-sured construct relative to other people. Personality test norms have several work-related applications. First, they can facilitate individualized developmen-tal feedback. For example, workers may be better prepared to interact with others in a team or with customers if they have a clearer understanding of their relative standing on traits relevant to such interactions (e.g. emotional control, sociabil-ity, tolerance). Second, personality test norms can facilitate selection decisions. Top-down hiring does not require test norms, but exclusionary strategies based on test score cut-offs (e.g. hiring from among applicants scoring above a given cut-off) call for normative comparisons. Norms are especially important in hiring when applicants are few in number, as this mitigates reliance on top-down meth-ods. Third, norms can help an organization judge the overall standing of a tar-geted work-group (e.g. a sales team) relative to a larger, more general, job-rele-vant population (e.g. American sales people), as a basis, perhaps, for determining future hiring standards. Success in all such norm applications rests on norm qual-ity. Best practices in this area are reviewed next.
Best practices regarding test normsVirtually every book on psychological testing offers recommendations on the use of test norms (e.g. Anastasi & Urbina, 1997; Crocker & Algina, 1986; Kline, 1993). The most consistent message is that the norm sample should be relevant to the in-dividual whose scores are being interpreted. Some (e.g. Croker & Algina, 1986; Kline, 1993) articulate further that norm samples are more credible if stratified in terms of variables most highly correlated with the test. Accordingly, to permit reasoned judgments of norm relevance, test developers are urged to report key demographic characteristics (e.g. mean age, gender composition, job category). Also important to report are the sampling strategies used, the time frame of norm data collection, and the response rate, as all such information speaks to the rep-resentativeness of the normative sample with respect to the targeted population.
The 1999 Standards for Educational and Psychological Testing specify that:Norms, if used, should refer to clearly described populations. These populations should include individuals or groups to whom test users will ordinarily wish to compare their own examinees (Standard 4.5, p. 55)
Reports of norming studies should include precise specification of the population that was sampled, sampling procedures and participation rates, any weighting of the sample, the dates of testing, and descriptive statistics. The information provided should be sufficient to enable users to judge the appropriateness of the norms for in-terpreting the scores of local examinees. Technical documentation should indicate the precision of the norms themselves. (Standard 4.6, p. 55).
Th e u s e o f p e r s o n a l i T y T e s T n o r m s i n wo r k s e T T i n g s 641
Local norms1 should be developed when necessary to support test users’ intended interpretations. (Standard 13.4, p. 146)
Focusing on test use for the purpose of hiring, the Principles for the Validation and Use of Personnel Selection Procedures (SIOP, 2003) state that:
Normative information relevant to the applicant pool and the incumbent population should be presented when appropriate. The normative group should be described in terms of its relevant demographic and occupational characteristics and presented for subgroups with adequate sample sizes. The time frame in which the normative re-sults were established should be stated (p. 48).
Two points warrant discussion here. First, the issue of sample size is raised in the Principles, but what counts as ‘adequate’ N is unclear. Statistical theory (read-ily confirmed in practice) tells us that the reliability of norms is closely tied to N. Lacking specifics, practitioners are left to define ‘adequate’ on their own, which undermines standardization of sound testing practice and norm use. Second, the Standards encourage development of local norms ‘when necessary to support test users’ intended interpretations’. Ambiguity, again, precludes standardized prac-tice. Our primary aim in this article is to clarify what counts as ‘adequate’ N and ‘sufficient’ representativeness in a normative sample, as a basis for refining use of personality norms in work settings.
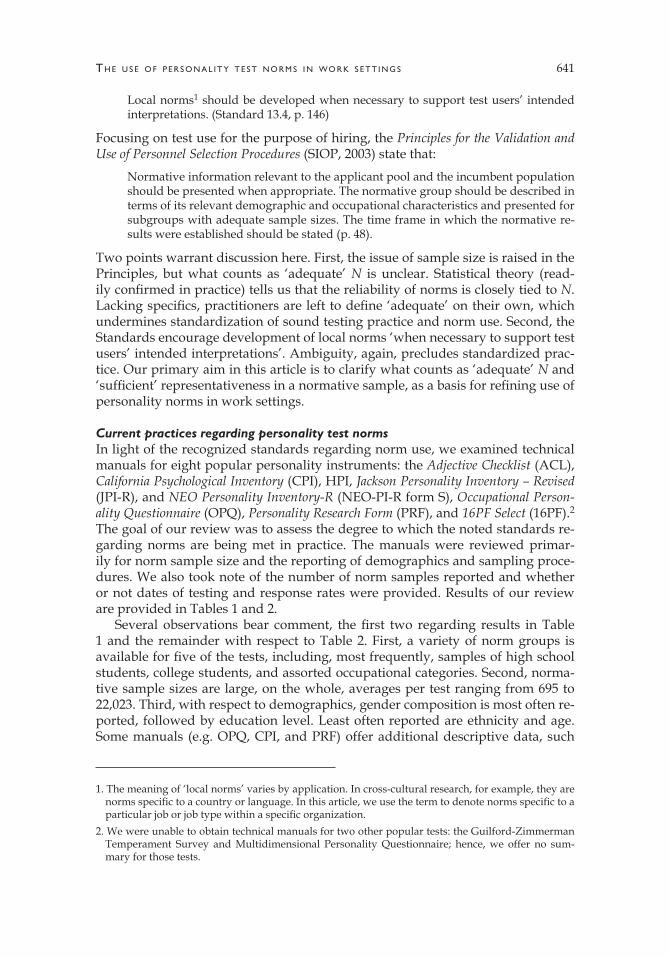
Current practices regarding personality test normsIn light of the recognized standards regarding norm use, we examined technical manuals for eight popular personality instruments: the Adjective Checklist (ACL), California Psychological Inventory (CPI), HPI, Jackson Personality Inventory – Revised (JPI-R), and NEO Personality Inventory-R (NEO-PI-R form S), Occupational Person-ality Questionnaire (OPQ), Personality Research Form (PRF), and 16PF Select (16PF).2 The goal of our review was to assess the degree to which the noted standards re-garding norms are being met in practice. The manuals were reviewed primar-ily for norm sample size and the reporting of demographics and sampling proce-dures. We also took note of the number of norm samples reported and whether or not dates of testing and response rates were provided. Results of our review are provided in Tables 1 and 2.
Several observations bear comment, the first two regarding results in Table 1 and the remainder with respect to Table 2. First, a variety of norm groups is available for five of the tests, including, most frequently, samples of high school students, college students, and assorted occupational categories. Second, norma-tive sample sizes are large, on the whole, averages per test ranging from 695 to 22,023. Third, with respect to demographics, gender composition is most often re-ported, followed by education level. Least often reported are ethnicity and age. Some manuals (e.g. OPQ, CPI, and PRF) offer additional descriptive data, such
1. The meaning of ‘local norms’ varies by application. In cross-cultural research, for example, they are norms specific to a country or language. In this article, we use the term to denote norms specific to a particular job or job type within a specific organization.
2. We were unable to obtain technical manuals for two other popular tests: the Guilford-Zimmerman Temperament Survey and Multidimensional Personality Questionnaire; hence, we offer no sum-mary for those tests.
642 Te T T e T a l . i n J o u r n a l o f oc c u pat i o n a l a n d or g a n i z at i o n a l p s y c h o l o g y 82 (2009)
Tabl
e 1.
Sum
mar
y of
nor
m s
ampl
es r
epor
ted
in e
ight
per
sona
lity
test
man
uals
Sa
mpl
e si
ze
Mea
sure
N
of s
ampl
es
Sam
ple
com
posi
tion
M
ean
R
ange
AC
L
7
Hig
h sc
hool
stu
dent
s, co
llege
stu
dent
s, gr
adua
te s
tude
nts,
med
ical
stu
dent
s, 1,
340
10
2–4,
078
de
linqu
ents
, psy
chia
tric
pat
ient
s, an
d ad
ults
CPI
6
Ba
sic
norm
ativ
e sa
mpl
e, h
igh
scho
ol s
tude
nts,
colle
ge s
tude
nts,
grad
uate
3,
841
56
7–10
,845
stud
ents
, occ
upat
iona
l sam
ples
, and
oth
er s
ampl
es
HPI
1
To
tal s
ampl
e
22,0
23
N/A
JPI-R
5
H
igh
scho
ol s
tude
nts,
colle
ge s
tude
nts,
blue
col
lar,
exec
utiv
es, a
nd
1,21
3 55
5–2,
555
co
mbi
ned
(col
lege
, blu
e co
llar,
and
exec
utiv
es)
NEO
-PI-R
2
A
mer
ican
adu
lts fr
om t
hree
sub
popu
latio
ns, C
anad
ian
and
Am
eric
an c
olle
ge s
tude
nts
69
5
389–
1,00
0
OPQ
a
6
UK
gen
eral
pop
ulat
ion,
UK
man
ager
ial a
nd p
rofe
ssio
nal s
ampl
e, U
K
999
32
9–2,
028
st
anda
rdiz
atio
n sa
mpl
e, U
S st
anda
rdiz
atio
n sa
mpl
e, a
nd U
S m
anag
eria
l and
prof
essi
onal
sam
ple
PRF
17
Tw
o co
llege
stu
dent
sam
ples
, em
ploy
men
t ag
ency
wor
kers
, hitc
hhik
ers,
educ
atio
n 76
3
42–2
,775
stud
ents
, nur
ses,
phys
ical
edu
catio
n st
uden
ts, v
arsi
ty a
thle
tes,
non-
vars
ity a
thle
tes,
sc
hool
child
ren
and
adol
esce
nts,
high
sch
ool s
tude
nts,
juve
nile
offe
nder
s, ad
ults
,
mili
tary
(en
liste
d se
lect
ees)
, mili
tary
(of
ficer
can
dida
tes)
, mili
tary
(ai
r tr
affic
cont
rol o
ffice
rs),
and
mili
tary
(en
liste
d pe
rson
nel)
16PF
Sel
ect
1
To
tal s
ampl
e
10,2
61
N/A
AC
L =
Adj
ectiv
e C
heck
list
(Gou
gh &
Hei
lbru
n, 1
983)
; CPI
= C
alifo
rnia
Psy
chol
ogic
al In
vent
ory
(Gou
gh &
Bra
dley
, 199
6); H
PI =
Hog
an P
erso
nalit
y In
vent
ory
(Hog
an &
Hog
an, 1
995)
; JPI
-R =
Jack
son
Pers
onal
ity In
vent
ory
– R
evis
ed (J
acks
on, 1
994)
; NEO
-PIR
= N
EO P
erso
nalit
y In
vent
ory-
R (F
orm
S; C
osta
& M
cCra
e,
1992
); O
PQ =
Occ
upat
iona
l Per
sona
lity
Que
stio
nnai
re (
SHL
Gro
up, 2
006)
; PR
F =
Pers
onal
ity R
esea
rch
Form
( Ja
ckso
n, 1
999)
; 16P
F Se
lect
(Ke
lly, 1
999)
. a.
Stan
dard
izat
ion
sam
ples
rep
orte
d he
re o
nly;
86 n
orm
gro
ups
from
diff
eren
t co
untr
ies
are
also
pre
sent
ed in
the
OPQ
tec
hnic
al m
anua
l.

Th e u s e o f p e r s o n a l i T y T e s T n o r m s i n wo r k s e T T i n g s 643
Tabl
e 2.
Sum
mar
y of
nor
m s
ampl
e de
mog
raph
ics
and
data
col
lect
ion
cond
ition
s re
port
ed in
eig
ht p
erso
nalit
y te
st m
anua
ls
R
epor
ted
dem
ogra
phic
s
Con
ditio
ns
N
umbe
r of
N
umbe
r of
mal
es
Age
(M
and
/or
Educ
atio
n
Dat
es o
f
Sam
plin
g
Res
pons
eM
easu
re
sa
mpl
es r
epor
ted
an
d fe
mal
es (
%)
ra
nge)
(%
) E
thni
city
(%
)
leve
l (%
)
tes
ting
(%)
pro
cedu
res
(%)
ra
te (
%)
AC
L 7
100
0 0
57
0 14
0
CPI
6
100
0 0
60
0 0
0
HPI
1
100
100
100
0 0
0 0
JPI-R
5
100
0 0
40
0 40
0
NEO
-PI-R
2
100
100
50
100
50
50
0
OPQ
a 6
100
100
100
100
100
100
0
PRF
17
71
24
0 41
12
47
0
16PF
Sel
ect
1 10
0 10
0 10
0 10
0 10
0 10
0 0
AC
L =
Adj
ectiv
e C
heck
list
(Gou
gh &
Hei
lbru
n, 1
983)
; CPI
= C
alifo
rnia
Psy
chol
ogic
al In
vent
ory
(Gou
gh &
Bra
dley
, 199
6); H
PI =
Hog
an P
erso
nalit
y In
vent
ory
(Hog
an &
Hog
an, 1
995)
; JPI
-R =
Jack
son
Pers
onal
ity In
vent
ory
– R
evis
ed (J
acks
on, 1
994)
; NEO
-PI-R
= N
EO P
erso
nalit
y In
vent
ory-
R (F
orm
S; C
osta
& M
cCra
e,
1992
); O
PQ =
Occ
upat
iona
l Per
sona
lity
Que
stio
nnai
re (
SHL
Gro
up, 2
006)
; PR
F =
Pers
onal
ity R
esea
rch
Form
( Ja
ckso
n, 1
999)
; 16P
F Se
lect
(Ke
lly, 1
999)
.a.
Stan
dard
izat
ion
sam
ples
onl
y re
port
ed h
ere;
86
norm
gro
ups
from
diff
eren
t co
untr
ies
are
furt
her
pres
ente
d in
the
OPQ
tec
hnic
al m
anua
l.

644 Te T T e T a l . i n J o u r n a l o f oc c u pat i o n a l a n d or g a n i z at i o n a l p s y c h o l o g y 82 (2009)
as work functions, industries, and job titles, which is more informative than sim-ply ‘adults’ or ‘managers’. Fourth, few manuals report specific sampling proce-dures (e.g. random, cluster, stratified). Along the same lines, many of the norm groups are convenience samples. For example, the ACL was normed, in part, on ‘local’ school systems. Fifth, dates (e.g. years) of testing and participation rates are rarely reported. The OPQ and 16PF manuals are the only sources consistently providing dates of testing.
All told, our review of personality test manuals yields mixed results regard-ing compliance with recognized standards of norm use. On the plus side, the majority of norm samples appear to be ample in size, norms for most tests are available for a variety of populations, and basic descriptive information is of-fered in most cases. More challenging are the lack of descriptions of sampling procedures, reliance on convenience samples, and failure to report dates of test-ing and participation rates. A more fundamental question, however, is whether or not these things matter when a test user turns to available norms as a frame of reference for interpreting the scores of a given individual or group. It is this lat-ter question that the current article seeks to address. In particular, we focus on both norm sample size and population relevance with respect to how each can affect an individual’s personality profile.
Research questions and overviewWe assessed the effects of sampling error and population relevance in terms of the standardized T-score distribution. T is defined as
T = [10(X – M)/s + 50
where X is an individual’s raw test score, and M and s are the normative mean and standard deviation, respectively. A person’s true T-score is derived when M and s are accurate estimates of μ and σ.3 Thus, to the degree a given sample mean (M) over- or underestimates μ, a person’s observed T-score will be inaccurate. If M underestimates μ, T will be overestimated, and if M overestimates μ, T will be underestimated.
It is well understood that random error in estimating μ decreases monotoni-cally as sample size (N) increases. This is directly evident in the equation for the standard error of the mean:
SEM = s √N
which is the expected standard deviation of means from multiple samples of size N drawn randomly from a population. We used the standard error to determine upper and lower estimates of μ (as M) under different Ns and different levels of certainty. Wider intervals, at any specified level of certainty, pose greater con-cerns in interpreting a given norm-transformed score. What is considered an ac-ceptable margin of error in estimating μ, however, is unclear. We suggest that an interval of 5 T-score points (i.e. ±2.5), representing the middle 20% of the nor-mal distribution (i.e. ±10% around μ), is worthy of concern, as error of that mag-nitude could be expected to alter test score interpretations in practically mean-ingful terms. Thus, for example, underestimating a person’s T-score by 2.5 points
3. Error in s as an estimate of σ is less than error in M as an estimate of μ and is ignored in the current undertaking. Inaccuracies arising from measurement error are ignored here, as well.

Th e u s e o f p e r s o n a l i T y T e s T n o r m s i n wo r k s e T T i n g s 645
(due to overestimating μ by 2.5 points) would place that person up to 10 percen-tile units lower on the scale. In a selection situation, this means that 1 in 10 ap-plicants could be falsely rejected based on the test score cut-off. If the T-score is overestimated by 2.5 points (due to underestimating μ by 2.5 points), the individ-ual stands a 1-in-10 better chance of being selected based on the cut-off. In brief, error in estimating μ undermines the fidelity of the test score cut-off, increasing the likelihood of either hiring an unqualified applicant or not hiring a qualified applicant.4 Similar concerns arise in developmental applications.
The degree of over- or underestimation in percentile units varies along the T-score continuum, owing to the curvilinear relationship between T (a transform of z) and percentiles. This is revealed in Table 3 for the case where μ is under or over-estimated (as M) by 2.5 T-score points. The noted 10% difference occurs only at the middle of the distribution. Specifically, if an individual’s true T-score is 50 and M overestimates μ by 2.5 points, then the individual’s observed T-score will be 47.5, dropping that individual’s standing by 9.87 percentiles. The same degree of overes-timation of μ has less impact in percentile units for people whose true T-scores de-part from 50. For example, as indicated in Table 3, someone with a true T-score of 45 (and where μ is overestimated by 2.5 points) will fall 8.19 percentiles below his or her true percentile of 30.85. The drop in percentiles reduces to around one when true T=30. We advocate the ±2.5 T-score difference between M and μ as a bench-mark, notwithstanding the smaller difference in percentiles that occurs at extreme values of T, because it is unclear at what point along the scale personality score cut-offs are most often invoked, and the mid-point, where the maximum 10 percentile point difference occurs, seems a reasonable expectation in many hiring situations.
The question of population relevance concerns the representativeness of a nor-mative sample regarding the population to which the individual test taker belongs. Comparing an individual’s test score to a sample mean representing an irrelevant population defeats the purpose of norm-based comparisons, fostering inaccurate interpretations. Unlike the effects of sampling error, which are random, the ef-fects of population relevance are tied to systematic differences between popula-tions, including demographic (e.g. age, sex) and situational variables (e.g. job type). We assessed the question of population relevance directly by deriving personal-ity profiles using norms from multiple sales and truck driver populations, allowing comparisons both between and within job types. Differences in profiles between job types would confirm the widely held belief that norms are specific to job types. Notable differences within job types would raise concerns about the value of job-type-specific norms derived from convenience samples, calling for local norming.
Method
Data sourcesThe data were derived from a large archival database of HPI responses at Hogan Assessment Systems (HAS). The HPI was the first measure of normal personality developed explicitly to assess the Five Factor Model in occupational settings. The measurement goal of the HPI is to predict real-world outcomes, and it is an original
4. What one considers an acceptable margin of error in practical terms is subjective. Readers targeting error rates below 10% will seek a T-score margin less than ±2.5 units in width, calling for normative samples larger and more representative of the test-taker’s population than the standards advanced in the current article.

646 Te T T e T a l . i n J o u r n a l o f oc c u pat i o n a l a n d or g a n i z at i o n a l p s y c h o l o g y 82 (2009)
Tabl
e 3.
Dro
ps a
nd li
fts in
per
cent
iles
asso
ciat
ed w
ith o
ver
and
unde
rest
imat
ion
of μ
by
2.5
T-sc
ore
poin
ts
Tr
ue T
Con
ditio
n 2
0 2
5 3
0
35
40
45
50
55
6
0
65
70
75
80
μ =
50
Obs
. T
20.0
0 25
.00
30.0
0 35
.00
40.0
0 45
.00
50.0
0 55
.00
60.0
0 65
.00
70.0
0 75
.00
80.0
0
z 23
.00
22.5
0 22
.00
21.5
0 21
.00
20.5
0 0.
00
0.50
1.
00
1.50
2.
00
2.50
3.
00
perc
entil
e 0.
13
0.62
2.
28
6.68
15
.87
30.8
5 50
.00
69.1
5 84
.13
93.3
2 97
.72
99.3
8 99
.87
M(o
ver)
= 5
2.5
Obs
. T
17.5
0 22
.50
27.5
0 32
.50
37.5
0 42
.50
47.5
0 52
.50
57.5
0 62
.50
67.5
0 72
.50
77.5
0
z 23
.25
22.7
5 22
.25
21.7
5 21
.25
20.7
5 20
.25
0.25
0.
75
1.25
1.
75
2.25
2.
75
perc
entil
e 0.
06
0.30
1.
22
4.01
10
.56
22.6
6 40
.13
59.8
7 77
.34
89.4
4 95
.99
98.7
8 99
.70
perc
entil
e dr
opa
0.07
0.
32
1.06
2.
67
5.31
8.
19
9.87
9.
28
6.79
3.
88
1.73
0.
60
0.17
M(u
nder
) =
47.5
Obs
. T
22.5
0 27
.50
32.5
0 37
.50
42.5
0 47
.50
52.5
0 57
.50
62.5
0 67
.50
72.5
0 77
.50
82.5
0
z 22
.75
22.2
5 21
.75
21.2
5 20
.75
20.2
5 0.
25
0.75
1.
25
1.75
2.
25
2.75
3.
25
perc
entil
e 0.
30
1.22
4.
01
10.5
6 22
.66
40.1
3 59
.87
77.3
4 89
.44
95.9
9 98
.78
99.7
0 99
.94
perc
entil
e lif
tb 0.
17
0.60
1.
73
3.88
6.
79
9.28
9.
87
8.19
5.
31
2.67
1.
06
0.32
0.
07
a. Pe
rcen
tile
drop
= (
perc
entil
e ba
sed
on μ
= 5
0) /
(per
cent
ile b
ased
on
M =
52:
5).
b. P
erce
ntile
lift
= (p
erce
ntile
bas
ed o
n M
= 4
7:5)
/ (p
erce
ntile
bas
ed o
n m
= 5
0).

Th e u s e o f p e r s o n a l i T y T e s T n o r m s i n wo r k s e T T i n g s 647
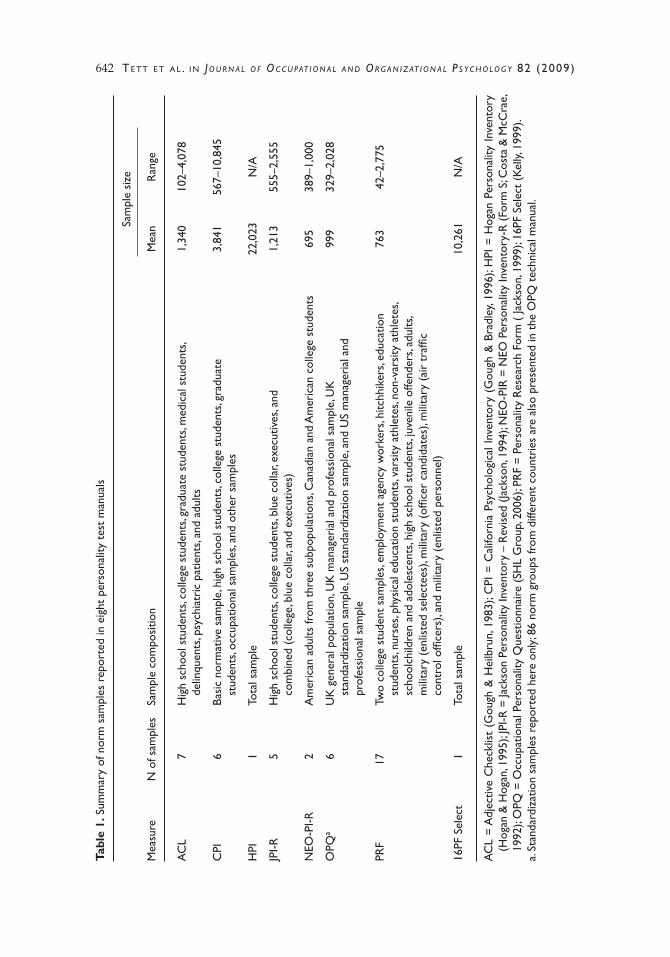
and well-known measure of the Five Factor Model. Eleven normative samples were used in the main analyses. Five are from sales people, four are from truck drivers, and the remaining two are, respectively, the combination of the five sales samples and the four trucking samples, using the N-weighted mean and the standard devi-ation for combined groups (Ferguson, 1959). Sales and trucking jobs were targeted, in part, due to the availability of multiple subsamples within each job family and because the job families were expected to yield distinct norms.5 The subsamples in both jobs were selected only because they were the largest available, ranging in N from 953 to 6,200 in the case of sales (mean=2,977), and from 394 to 2,520 in the case of truckers (mean=971). Total Ns for the two broader samples are 14,885 (sales) and 3,885 (truckers). Means and standard deviations for the seven HPI scales in the main samples are reported in Table 4. Norms for nine additional samples, three from each of the clerical, managerial, and financial job families, were drawn from the HAS database using the same criteria to assess the generalizability of the main results. These additional norms, based on Ns ranging from 609 to 13,450, are pro-vided in Table 5. All samples consist entirely of job applicants. Alpha reliabilities range from .30 to .87 across scales and samples, with median=.77.6
Data analysisEffects of sampling error in estimating the normative population mean were as-sessed using T-scores with μ = 50 and σ = 10, at 5 levels of certainty: 50%, (cor-responding to z = ±0.67 standard errors), 68% (z = ±1.0), 80% (z = ±1.28), 95% (z = ±1.96), and 99% (z = ±2.58). Standard errors were generated using the equa-tion provided earlier, for selected Ns ranging from 5 to 10,000, and with σ = 10. Lower bound estimates of μ were calculated by subtracting from 50 the product of the standard error and the z associated with the given level of certainty (e.g. 1.96 for 95% certainty), and upper bound estimates of μ were calculated by add-ing that product to 50.
Effects of population relevance were assessed by deriving HPI profiles for each of the 11 primary normative samples, assuming the individual scored at the mean on each scale. Profile comparisons between the overall sales and trucking norms would speak to gross misapplications (e.g. applying trucking norms to raw scores for salespeople), whereas comparisons within sets would permit eval-uation of less obvious misuses (e.g. applying sales norms from one organization to the raw scores of a salesperson from another organization). In the between-set comparison, the sales profile was generated using the combined trucking sample as the norm sample, and the trucking profile was generated using the combined sales sample as the norm sample. In the within-sales and within-trucking com-parisons, profiles for each sample were generated by comparing scores falling at the mean for that sample against the combined norms from the remaining sam-ples in the given job category. Lack of bias would be evident in a profile forming a flat line falling at the 50 T-score mark. We adopted the ±2.5 T-score benchmark,
5. As the main point here is to examine the variability in norms across samples within job families, be-tween job differences serve more as a benchmark for comparison than as a key focus of study per se.
6. The lowest alphas are for Likeability (LIK: range = .30–.57, median = .41; all other scales: range = .59–.87, median = .78). In addition to being more heterogeneous in content, LIK is also the shortest scale, with 22 items relative to 37 in adjustment, the longest scale. (Correcting to 37-item length, us-ing the Spearman–Brown formula, yields range = .42–.69, median = .53). Of particular relevance to the current effort, the modest alphas for LIK suggest that normative differences between samples on that scale underestimate those expected for more reliable scales targeting similar constructs.

648 Te T T e T a l . i n J o u r n a l o f oc c u pat i o n a l a n d or g a n i z at i o n a l p s y c h o l o g y 82 (2009)
Tabl
e 4.
Nor
mat
ive
mea
ns a
nd s
tand
ard
devi
atio
ns fo
r fiv
e sa
les
and
four
tru
ckin
g sa
mpl
es
Sa
les
peop
le
A
(N
= 6
,200
)
B (N
= 4
,934
)
C (
N =
1,4
55)
D
(N
= 1
,343
)
E (N
= 9
53)
A
lla (N
= 1
4,88
5)H
PI s
cale
M
ean
SD
M
ean
SD
M
ean
SD
M
ean
SD
M
ean
SD
M
ean
SD
Adj
ustm
ent
31.7
4 4.
33
32.3
8 3.
82
32.4
5 3.
89
31.3
8 4.
41
31.0
9 4.
38
31.9
5 4.
16A
mbi
tion
25.9
3 3.
18
28.0
5 1.
44
27.5
5 2.
02
27.1
8 2.
49
27.4
3 1.
98
27.0
0 2.
65So
ciab
ility
14
.31
4.46
18
.29
3.52
15
.51
4.28
15
.26
4.48
17
.47
3.41
16
.03
4.46
Like
abili
ty
20.7
8 1.
31
20.9
4 1.
10
20.5
6 1.
32
20.4
8 1.
46
20.7
5 1.
15
20.7
8 1.
26Pr
uden
ce
23.8
3 3.
80
23.2
8 3.
49
24.2
3 3.
54
23.6
1 3.
58
22.5
5 3.
45
23.5
8 3.
66In
telle
ctan
ce
17.0
7 4.
33
18.1
8 3.
86
16.6
1 4.
28
16.3
7 4.
55
17.9
2 3.
99
17.3
8 4.
23Le
arni
ng a
ppro
ach
10.3
6 2.
91
10.8
8 2.
47
10.8
5 2.
53
10.4
0 2.
70
10.8
8 2.
31
10.6
2 2.
69
Tr
uck
driv
ers
A
(N
= 2
; 520
)
B (N
= 5
20)
C
(N
= 4
51)
D
(N
= 3
94)
A
lla (N
= 3
, 885
)H
PI s
cale
M
ean
SD
Mea
n SD
M
ean
SD
Mea
n SD
M
ean
SD
Adj
ustm
ent
31.6
0 4.
49
30.4
6 4.
64
30.2
7 4.
94
29.7
1 4.
86
31.1
0 4.
66A
mbi
tion
25.9
6 3.
45
24.9
4 3.
53
24.1
1 3.
78
23.7
3 3.
89
25.3
8 3.
64So
ciab
ility
13
.26
4.59
11
.68
4.30
10
.46
4.20
11
.54
4.19
12
.55
4.59
Like
abili
ty
20.3
7 1.
60
20.1
8 1.
80
19.8
9 1.
97
19.8
4 1.
99
20.2
3 1.
73Pr
uden
ce
23.7
6 3.
62
22.9
4 3.
92
24.0
0 3.
59
23.6
1 3.
69
23.6
7 3.
68In
telle
ctan
ce
16.3
9 4.
42
15.0
8 4.
58
14.5
1 4.
50
14.8
0 4.
58
15.8
4 4.
53Le
arni
ng a
ppro
ach
10.3
6 2.
87
8.00
3.
36
8.45
3.
49
8.31
3.
52
9.62
3.
25
a. A
ll gr
oups
com
bine
d; M
ean,
N-w
eigh
ted
mea
n; S
D, s
tand
ard
devi
atio
n of
com
bine
d gr
oups
.
Th e u s e o f p e r s o n a l i T y T e s T n o r m s i n wo r k s e T T i n g s 649
corresponding to the middle 20% of cases in a normal distribution, in offering practical guidance on norm use. We adopted a similar strategy in replication us-ing the nine samples from clerical, managerial, and financial job families. Rather than draw comparisons between jobs, however, we focused on within job com-parisons, creating profiles for individuals falling at the HPI means from one sam-ple using norms combined across the remaining two samples per job family.
Results
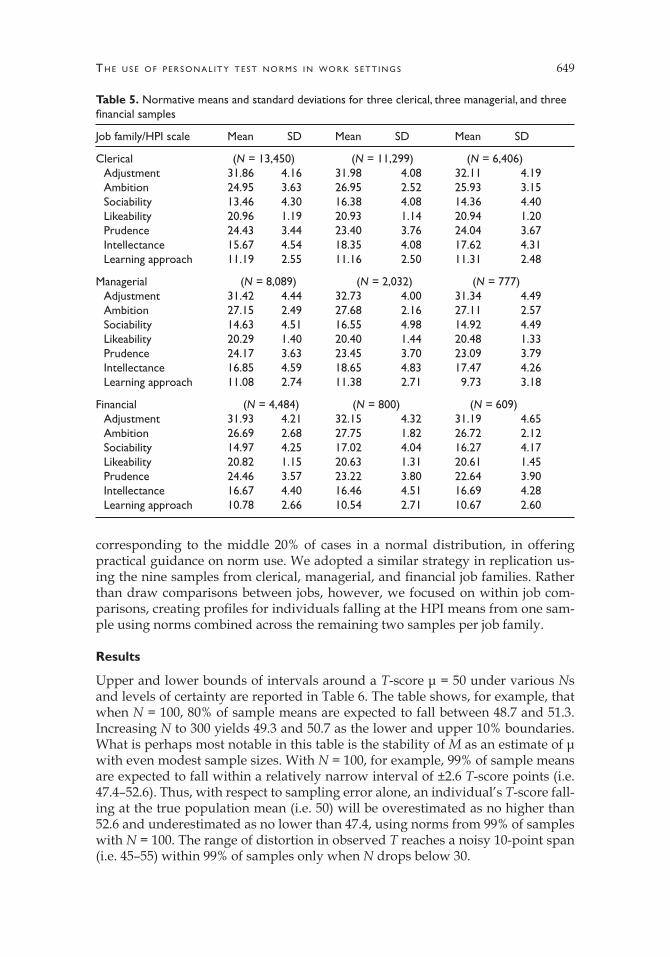
Upper and lower bounds of intervals around a T-score μ = 50 under various Ns and levels of certainty are reported in Table 6. The table shows, for example, that when N = 100, 80% of sample means are expected to fall between 48.7 and 51.3. Increasing N to 300 yields 49.3 and 50.7 as the lower and upper 10% boundaries. What is perhaps most notable in this table is the stability of M as an estimate of μ with even modest sample sizes. With N = 100, for example, 99% of sample means are expected to fall within a relatively narrow interval of ±2.6 T-score points (i.e. 47.4–52.6). Thus, with respect to sampling error alone, an individual’s T-score fall-ing at the true population mean (i.e. 50) will be overestimated as no higher than 52.6 and underestimated as no lower than 47.4, using norms from 99% of samples with N = 100. The range of distortion in observed T reaches a noisy 10-point span (i.e. 45–55) within 99% of samples only when N drops below 30.
Table 5. Normative means and standard deviations for three clerical, three managerial, and three financial samples
Job family/HPI scale Mean SD Mean SD Mean SD
Clerical (N = 13,450) (N = 11,299) (N = 6,406)Adjustment 31.86 4.16 31.98 4.08 32.11 4.19Ambition 24.95 3.63 26.95 2.52 25.93 3.15Sociability 13.46 4.30 16.38 4.08 14.36 4.40Likeability 20.96 1.19 20.93 1.14 20.94 1.20Prudence 24.43 3.44 23.40 3.76 24.04 3.67Intellectance 15.67 4.54 18.35 4.08 17.62 4.31Learning approach 11.19 2.55 11.16 2.50 11.31 2.48
Managerial (N = 8,089) (N = 2,032) (N = 777)Adjustment 31.42 4.44 32.73 4.00 31.34 4.49Ambition 27.15 2.49 27.68 2.16 27.11 2.57Sociability 14.63 4.51 16.55 4.98 14.92 4.49Likeability 20.29 1.40 20.40 1.44 20.48 1.33Prudence 24.17 3.63 23.45 3.70 23.09 3.79Intellectance 16.85 4.59 18.65 4.83 17.47 4.26Learning approach 11.08 2.74 11.38 2.71 9.73 3.18
Financial (N = 4,484) (N = 800) (N = 609)Adjustment 31.93 4.21 32.15 4.32 31.19 4.65Ambition 26.69 2.68 27.75 1.82 26.72 2.12Sociability 14.97 4.25 17.02 4.04 16.27 4.17Likeability 20.82 1.15 20.63 1.31 20.61 1.45Prudence 24.46 3.57 23.22 3.80 22.64 3.90Intellectance 16.67 4.40 16.46 4.51 16.69 4.28Learning approach 10.78 2.66 10.54 2.71 10.67 2.60

650 Te T T e T a l . i n J o u r n a l o f oc c u pat i o n a l a n d or g a n i z at i o n a l p s y c h o l o g y 82 (2009)
Tabl
e 6.
Und
er-
and
over
estim
atio
n of
μ f
or s
elec
ted
Ns
and
leve
ls o
f cer
tain
ty
μ =
50.0
0σ
= 10
.00
5
0% z
= ±
0.67
68%
z =
±1.
00
8
0% z
= ±
1.28
9
0% z
= ±
1.65
95%
z =
±1.
96
9
9% z
= ±
2.58
SE
Lo
wer
U
pper
Lo
wer
U
pper
Lo
wer
U
pper
Lo
wer
U
pper
Lo
wer
U
pper
Lo
wer
U
pper
N
m
ean
25%
25
%
16%
16
%
10%
10
%
5%
5%
2.5%
2.
5%
0.5%
0.
5%
5 4.
47
47.0
53
.0
45.5
54
.5
44.3
55
.7
42.6
57
.4
41.2
58
.8
38.5
61
.510
3.
16
47.9
52
.1
46.8
53
.2
45.9
54
.1
44.8
55
.2
43.8
56
.2
41.9
58
.115
2.
58
48.3
51
.7
47.4
52
.6
46.7
53
.3
45.8
54
.2
44.9
55
.1
43.3
56
.720
2.
24
48.5
51
.5
47.8
52
.2
47.1
52
.9
46.3
53
.7
45.6
54
.4
44.2
55
.825
2.
00
48.7
51
.3
48.0
52
.0
47.4
52
.6
46.7
53
.3
46.1
53
.9
44.8
55
.230
1.
83
48.8
51
.2
48.2
51
.8
47.7
52
.3
47.0
53
.0
46.4
53
.6
45.3
54
.740
1.
58
48.9
51
.1
48.4
51
.6
48.0
52
.0
47.4
52
.6
46.9
53
.1
45.9
54
.150
1.
41
49.0
51
.0
48.6
51
.4
48.2
51
.8
47.7
52
.3
47.2
52
.8
46.4
53
.675
1.
15
49.2
50
.8
48.8
51
.2
48.5
51
.5
48.1
51
.9
47.7
52
.3
47.0
53
.010
0 1.
00
49.3
50
.7
49.0
51
.0
48.7
51
.3
48.4
51
.6
48.0
52
.0
47.4
52
.615
0 0.
82
49.4
50
.6
49.2
50
.8
49.0
51
.0
48.7
51
.3
48.4
51
.6
47.9
52
.120
0 0.
71
49.5
50
.5
49.3
50
.7
49.1
50
.9
48.8
51
.2
48.6
51
.4
48.2
51
.830
0 0.
58
49.6
50
.4
49.4
50
.6
49.3
50
.7
49.1
50
.9
48.9
51
.1
48.5
51
.540
0 0.
50
49.7
50
.3
49.5
50
.5
49.4
50
.6
49.2
50
.8
49.0
51
.0
48.7
51
.350
0 0.
45
49.7
50
.3
49.6
50
.4
49.4
50
.6
49.3
50
.7
49.1
50
.9
48.8
51
.275
0 0.
37
49.8
50
.2
49.6
50
.4
49.5
50
.5
49.4
50
.6
49.3
50
.7
49.1
50
.91,
000
0.32
49
.8
50.2
49
.7
50.3
49
.6
50.4
49
.5
50.5
49
.4
50.6
49
.2
50.8
2,50
0 0.
20
49.9
50
.1
49.8
50
.2
49.7
50
.3
49.7
50
.3
49.6
50
.4
49.5
50
.55,
000
0.14
49
.9
50.1
49
.9
50.1
49
.8
50.2
49
.8
50.2
49
.7
50.3
49
.6
50.4
10,0
00
0.10
49
.9
50.1
49
.9
50.1
49
.9
50.1
49
.8
50.2
49
.8
50.2
49
.7
50.3

Th e u s e o f p e r s o n a l i T y T e s T n o r m s i n wo r k s e T T i n g s 651
The effects of population relevance on HPI profiles are depicted in Figures 1–3. In Figure 1, HPI T-score profiles are plotted for both the combined sales and the combined trucking samples, based on hypothetical raw scores falling at the mean on each scale and using the other combined group as the reference sample in each case. Differences between samples vary across HPI scales. The largest dif-ference arises on sociability (15.4 T-score points) and the smallest difference on prudence (.4 points). The average difference is 7.3 T-score points. Figure 2 depicts profiles for the five sales samples and Figure 3, for the four trucking samples. No-table differences are evident within each figure. T-scores on ambition and socia-bility in the sales group, in particular, vary considerably across samples (range = 40.0–55.4 for ambition; 42.7–57.6 for sociability). The largest differences within the trucking norm set arise for learning approach (range = 44.1–56.1). The aver-age maximum differences in the sales and trucker groups (i.e. averaging across the seven scales in each case) are 7.4 and 7.5, respectively.
Within job family differences in HPI profiles for each of the clerical, manage-rial, and financial job families are depicted in Figure 4. The largest differences are evident in the clerical samples, where, for example, T-scores on ambition, socia-bility, and intellectance vary by more than 10 points between samples A and B. The largest differences in the managerial samples are for sociability (7.2 points), intellectance (7.0), and learning approach (6.6); and the largest differences in the financial samples are for sociability (8.6), prudence (8.4), and ambition (7.1). Av-eraging differences across all seven HPI scales within job families yields 5.5 for clerical jobs, 5.2 for managerial jobs, and 4.6 for financial jobs. These are smaller than the averages from sales and trucking (i.e. 7.4 and 7.5), but 10 of the 21 HPI scales-in-jobs exceed the ±2.5-point standard adopted here, corresponding to a 10% decision error rate with a T = 50 cut-score.
Discussion
Our goal was to clarify best practices regarding use of personality tests in work settings by assessing the impact of normative sample N and population relevance on the reliability of judged personality test scores. Where personality scores are
Figure 1. HPI profiles for sales and trucking.

652 Te T T e T a l . i n J o u r n a l o f oc c u pat i o n a l a n d or g a n i z at i o n a l p s y c h o l o g y 82 (2009)
standardized using norms (e.g. expressed here in terms of T-scores), we found that over and underestimation of μ due to random sampling error is relatively minor as N exceeds 100. Clearly, such errors will decrease as N increases, but the gains diminish quite rapidly in practical terms at N = 300 and above. We suggest that, with respect to sampling error alone, norms based on Ns as low as 100 need not raise serious concerns regarding norm-based test score interpretations. This may be surprising to some test users, as test developers typically tout normative sample sizes well in excess of 500 in their test manuals in a spirit of ‘more is bet-ter’. Although precisely true, the practical merit of samples exceeding N = 100 is generally weaker than the effect of choosing one norm sample over another, even from within the same job category.
T-score profiles generated using sales and trucking norm sets in the current undertaking revealed a mix of similarities and differences. Profiles based on the combined sales and combined trucking norms (see Figure 1) are notably discrep-ant, exceeding the ±2.5 T-score point benchmark (corresponding to ±10 percen-
Figure 2. HPI profiles from five sales samples.
Figure 3. HPI profiles from four trucker samples.

Th e u s e o f p e r s o n a l i T y T e s T n o r m s i n wo r k s e T T i n g s 653
Figure 4. HPI profiles from three clerical, three managerial, and three financial samples.
654 Te T T e T a l . i n J o u r n a l o f oc c u pat i o n a l a n d or g a n i z at i o n a l p s y c h o l o g y 82 (2009)
tile points at the middle of the distribution) for five of the seven HPI scales (all but prudence and adjustment). The average difference of 7.3 T-score points cor-responds to ±14 percentile points. HPI sociability yielded a difference of 15.4 T-score points, corresponding to ±28 percentile points. Such errors support the widely held belief that an individual’s test scores bear comparison to norms rep-resenting the same job category to which that person belongs.
Notably, however, similar differences are evident within both the sales group and the trucking group (averages = 7.4 and 7.5 T-score points). Large differences were observed for both ambition and sociability among the sales groups (15.3 and 14.9, respectively), corresponding in each case to approximately ±27 percen-tile points. Thus, someone falling at the mean of their local cohort on either of these two scales could be judged as falling as low as the 23rd percentile or as high as the 77th percentile when compared to others in the same job category at other organizations combined. (The situation worsens if norms are based on any single organization rather than combining across organizations as the latter averages out extreme values.) Such discrepancies are especially problematic given that am-bition and sociability are arguably among the most relevant traits in selecting and developing sales people and are, therefore, likely to be prime targets of concern.
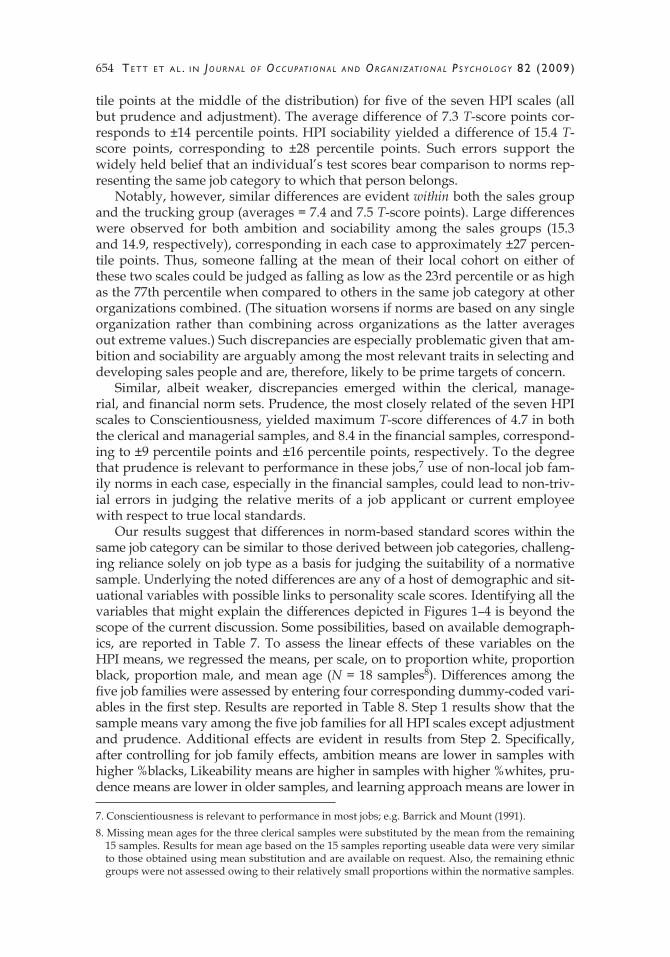
Similar, albeit weaker, discrepancies emerged within the clerical, manage-rial, and financial norm sets. Prudence, the most closely related of the seven HPI scales to Conscientiousness, yielded maximum T-score differences of 4.7 in both the clerical and managerial samples, and 8.4 in the financial samples, correspond-ing to ±9 percentile points and ±16 percentile points, respectively. To the degree that prudence is relevant to performance in these jobs,7 use of non-local job fam-ily norms in each case, especially in the financial samples, could lead to non-triv-ial errors in judging the relative merits of a job applicant or current employee with respect to true local standards.
Our results suggest that differences in norm-based standard scores within the same job category can be similar to those derived between job categories, challeng-ing reliance solely on job type as a basis for judging the suitability of a normative sample. Underlying the noted differences are any of a host of demographic and sit-uational variables with possible links to personality scale scores. Identifying all the variables that might explain the differences depicted in Figures 1–4 is beyond the scope of the current discussion. Some possibilities, based on available demograph-ics, are reported in Table 7. To assess the linear effects of these variables on the HPI means, we regressed the means, per scale, on to proportion white, proportion black, proportion male, and mean age (N = 18 samples8). Differences among the five job families were assessed by entering four corresponding dummy-coded vari-ables in the first step. Results are reported in Table 8. Step 1 results show that the sample means vary among the five job families for all HPI scales except adjustment and prudence. Additional effects are evident in results from Step 2. Specifically, after controlling for job family effects, ambition means are lower in samples with higher %blacks, Likeability means are higher in samples with higher %whites, pru-dence means are lower in older samples, and learning approach means are lower in
7. Conscientiousness is relevant to performance in most jobs; e.g. Barrick and Mount (1991).8. Missing mean ages for the three clerical samples were substituted by the mean from the remaining
15 samples. Results for mean age based on the 15 samples reporting useable data were very similar to those obtained using mean substitution and are available on request. Also, the remaining ethnic groups were not assessed owing to their relatively small proportions within the normative samples.

Th e u s e o f p e r s o n a l i T y T e s T n o r m s i n wo r k s e T T i n g s 655
samples with higher %males. Whether or not these findings replicate in larger sam-ple sets (i.e. with N>18 samples) is a matter for further research. Our point here is that comparing an individual to norms from the same job family can, nonetheless, pose uncertainties owing to other characteristics of the norm sample that may also be related to personality scale scores.
Independent research supports current findings suggesting that personality scores are related to job category (e.g. RIASEC; Barrick, Mount, & Gupta, 2003) and demographic characteristics most often described in test manuals (Roberts, Walton, & Viechtbauer, 2006). Other work-related correlates of personality have recently been identified. Judge and Cable (1997) report that personality is related to organi-zational culture preferences such that, for example, conscientious people prefer de-tail-oriented and results-oriented cultures. Thus, means for conscientiousness (and more specific traits falling within that category) can be expected to be elevated in organizations with those types of cultures. Similar results linking personality with organizational culture preferences have been reported by Warr and Pierce (2004) and Ang, van Dyne, and Koh (2006). Along similar lines, Furnham, Petrides, and Tsaousis (2005) found that the Big Five, especially Openness to Experience, are re-lated to work values pertaining to cultural diversity. To the degree that organiza-
Table 7. Norm sample demographics
Ethnicity (%) Gender (%)
Sample White Black Hisp. Asian Native Amer. Male Female Mean age
SalesA 46.1 40.0 10.9 2.4 0.6 44.5 55.5 33.1B 85.1 6.9 4.3 3.0 0.6 57.3 42.7 33.3C 73.9 17.3 5.0 3.4 0.3 48.6 51.4 30.4D 67.4 16.1 15.2 0.6 0.6 47.4 52.6 28.3E 66.7 16.7 8.3 8.3 0.0 36.8 63.2 34.3Weighted mean 65.0 23.2 8.4 2.9 0.5 48.9 51.1 32.5
TruckingA 81.0 9.5 4.8 4.8 0.0 59.1 40.9 37.5B 79.6 11.8 6.1 0.4 2.1 98.8 1.2 36.9C 50.5 33.8 15.7 0.0 0.0 99.2 0.8 39.2D 25.9 35.5 35.5 2.6 0.4 96.8 3.2 36.8Weighted mean 71.7 15.3 9.3 3.4 0.3 72.9 27.1 37.5
ClericalA 78.3 4.1 10.4 6.2 1.0 11.5 88.5 NAB 60.1 7.4 22.1 7.7 2.7 44.0 56.0 NAC 56.4 10.4 23.0 6.9 3.3 28.1 71.9 NAWeighted mean 67.2 6.6 17.2 6.9 2.1 26.7 73.3 NA
ManagerialA 50.6 27.4 19.1 2.3 0.7 56.3 43.7 32.7B 50.9 43.4 3.8 1.9 0.0 49.1 50.9 36.6C 69.0 15.7 10.4 3.4 1.5 67.1 32.9 36.0Weighted mean 52.0 29.5 15.6 2.3 0.6 55.7 44.3 33.7
FinancialA 66.0 21.0 7.7 5.2 0.1 38.3 61.7 27.7B 77.1 10.8 6.8 5.2 0.2 67.6 32.4 37.0C 86.0 2.4 6.4 5.2 0.0 9.5 90.5 34.3Weighted mean 69.5 17.7 7.4 5.2 0.1 39.3 60.7 29.6

656 Te T T e T a l . i n J o u r n a l o f oc c u pat i o n a l a n d or g a n i z at i o n a l p s y c h o l o g y 82 (2009)
tional culture and work values each affect personality scores independently of job type, personality test developers are urged to report details of norm sample culture preferences and values as a basis for judging norm relevance in work settings.
A potentially more important variable affecting normative means on personal-ity scales may be reliance on job applicants versus incumbents. The question of fak-ing in personality assessment has been a dominant focus of investigation for many years. There is now general consensus that people can fake when instructed to do so (e.g. Viswesvaran & Ones, 1999). More recently, the focus has shifted to whether or not people actually do fake in selection settings. Some (e.g. Arthur, Woehr, & Graziano, 2000; Hogan, Barrett, & Hogan, 2007; Hough & Schneider, 1996; Ones & Viswesvaran, 1998; Viswesvaran & Ones, 1999) downplay the effects of volun-tary faking, whereas others (Griffith, Chmielowski, & Yoshita, 2007; Rosse, Stecher, Miller, & Levin, 1998; Stark, Chernyshenko, Chan, Lee, & Drasgow, 2001; Tett & Christiansen, 2007) argue that it is indeed problematic. Summarizing the ‘do-fake’ literature in selection contexts, Tett et al. (2006) report a meta-analytic mean d ef-fect size of .35, averaging across the Big Five (excluding Openness, whose effect is close to 0, yields a mean of 0.52). This result supports the applicant/incumbent dis-tinction raised in the SIOP Principles regarding norm use, and clarifies that test de-velopers and publishers need to differentiate norms based on this distinction. Spe-cifically, if a personality test is being used in hiring, the relevant norm group is one drawn from an applicant sample, as norms based on incumbents can be expected to yield (mostly) lower means and, hence, elevated T-scores (or their equivalent) in applicants.9 If targeted for use in developing personnel, on the other hand, person-ality test scores bear comparison to norms derived from incumbents, as reliance on applicant norms will likely underestimate individuals’ true standing.
9. All norm samples presented here, drawn from the HAS database, include only job applicants; the applicant/incumbent distinction may be relevant to other tests used in work settings, particularly those lacking applicant norms.
Table 8. Regression results for effects of job family and demographic variables on HPI scale means (N = 18 samples)
Step 1a Step 2b
Job family %white, %black, %male, mean agec
Change inHPI scale Adjusted R2 Adjusted R2 adjusted R2 Sig. predictor β
Adjustment .02 Ambition .61** .70 .09 %black –.37*Sociability .60**Likeability .76** .81 .05 %white .25*Prudence –.19 .15 .34 mean age –.78*Intellectance .45*Learning approach .63** .73 .10 %male –.53*
* p < .05 ; ** p < .01 < two-tailed.a. Forced entry.b. Stepwise entry.c. Mean substitution for three clerical samples.

Th e u s e o f p e r s o n a l i T y T e s T n o r m s i n wo r k s e T T i n g s 657
That personality scores may be related to a diverse array of demographic and situational factors and, plausibly, to interactions among those variables, raises concerns regarding the generalizability of normative samples as, with increas-ing numbers of distinct correlates, comes a decreasing likelihood that a norma-tive sample reported in a test manual is relevant to any individual not included in that sample. This goes beyond the issue of whether or not the norm sample is described in detail; the point is that, regardless of such descriptive detail, norm samples are inherently specific to populations identified mostly by convenience, which are very likely to be different from the population of interest in specific norm applications, namely, in the case of selection, the population of local appli-cants, or, in the case of personnel development, local incumbents. The concept of representativeness in judging norm suitability is, in this light, a fleeting ideal, and assuming representativeness given only a limited set of norm sample descriptors (e.g. job type, age, race, and gender composition) is likely to engender false inter-pretations regarding an individual’s or group’s standing on targeted personality traits relative to the true local population.
Our findings are generally consistent with the spirit of the Standards and SIOP Principles regarding norms, noted in the introduction. They are particularly sup-portive of more restrictive recommendations offered in conjunction with the in-ternational personality item pool ( http://ipip.ori.orgnewNorms.htm ), which ex-plicitly offers no norms:
One should be very wary of using canned ‘norms’ because it isn’t obvious that one could ever find a population of which one’s present sample is a representative subset. Most ‘norms’ are misleading, and therefore they should not be used.
Far more defensible are local norms, which one develops oneself. For example, if one wants to give feedback to members of a class of students, one should relate the score of each individual to the means and standard deviations derived from the class itself.
Conclusions
Our review of current standards and practice regarding use of personality test norms and our findings driven by basic statistical principles and real data sug-gest the following conclusions.
1. Sample size has little practical impact on the reliability of normative means and on standard scores and corresponding percentiles thereby derived, once an N of around 300 is reached. Test users need not be overly wary of norms based on N of even 100. Test developers are urged to seek norms for more diverse groups based on modest Ns rather than seeking larger samples per se.
2. Beyond N = 100, norm sample composition becomes the more important con-sideration. Notable discrepancies in personality profiles are likely not only between job families (e.g. sales vs. trucking in the present case) but also within job families (based on samples from different organizations). Such dif-ferences within categories raise concerns about the usefulness of norms pro-vided in test manuals, which typically offer little more than job category and basic demographic descriptors as bases for judging norm suitability.
3. Personality scores vary for reasons other than those targeted in standards and principles regarding norm use. Organizational culture, work values, and in-cumbent versus applicant settings, all of which vary independently of job category and basic demographics, are also worthy of consideration in judg-ments of norm relevance.

658 Te T T e T a l . i n J o u r n a l o f oc c u pat i o n a l a n d or g a n i z at i o n a l p s y c h o l o g y 82 (2009)
4. The diversity and complexity of factors affecting personality scale scores en-courage use of local norms over those provided in test manuals. That N need not be impractically large (e.g. 100) favors such efforts in furthering organiza-tionally meaningful personality test score interpretations, especially for use in personnel development and selection.
5. Use of general norms may have merit at the group level (e.g. assessing where the sales group at Company A stands in relation to national sales people). Special efforts are required, however, to ensure that the general population, defined explicitly in terms of diverse personality correlates (e.g. job category, demographics, applicant vs. incumbent, organizational culture, work values), is suitably represented by the normative sample. Strategies for developing such norms are worthy of future research.
Acknowledgments — An earlier version of this article was presented at the 21st Annual Conference of the Society for Industrial and Organizational Psychology, May, 2006, Dal-las, TX.
References
American Psychological Association (1999). Standards for Educational and Psychological Test-ing. Washington, DC: American Psychological Association.
Anastasi, A., & Urbina, S. (1997). Psychological Testing. Upper Saddle River, NJ: Prentice Hall.
Ang, S., van Dyne, L., & Koh, C. (2006). Personality correlates of the four-factor model of cultural intelligence. Group and Organization Management, 31, 100–123.
Arthur, W., Woehr, D. J., & Graziano, W. G. (2000). Personality testing in employment set-tings: Problems and issues in the application of typical selection practices. Personnel Re-view, 30, 657–676.
Barrick, M. R., & Mount, M. K. (1991). The big five personality dimensions and job perfor-mance: A meta-analysis. Personnel Psychology, 44, 1–26.
Barrick, M. R., Mount, M. K., & Gupta, R. (2003). Meta-analysis of the relationship between the five-factor model of personality and Holland’s occupational types. Personnel Psy-chology, 56, 45–74.
Bartram, D. (1992). The personality of UK managers: 16PF norms for short-listed appli-cants. Journal of Occupational and Organizational Psychology, 65, 159–172.
Cook, M., Young, A., Taylor, D., O’Shea, A., Chitashvili, M., Lepeska, V., et al. (1998). Per-sonality profiles of managers in former Soviet countries: Problem and remedy. Journal of Managerial Psychology, 13, 567–579.
Costa, P. T., & McCrae, R. R. (1992). NEO PI-R Professional Manual. Lutz, FL: Psychological Assessment Resources, Inc.
Crocker, L., & Algina, J. (1986). Norms and Standard Scores. In Introduction to Classical and Modern Test Theory (Chapter 19). New York: Harcourt, Brace, and Jovanovich.
Ferguson, G. A. (1959). Statistical Analysis in Psychology and Education. New York: McGraw-Hill.
Furnham, A., Petrides, K. V., & Tsaousis, I. (2005). A cross-cultural investigation into the relationships between personality traits and work values. Journal of Psychology: Interdis-ciplinary and Applied, 139, 5–32.
Gough, H. G., & Bradley, P. (1996). California Psychological Inventory Manual. Palo Alto, CA: Consulting Psychologists Press.
Gough, H. G., & Heilbrun, A. B., Jr. (1983). The Adjective Checklist Manual. Mountain View, CA: Consulting Psychologists Press.

Th e u s e o f p e r s o n a l i T y T e s T n o r m s i n wo r k s e T T i n g s 659
Griffith, R. L., Chmielowski, T., & Yoshita, Y. (2007). Do applicants fake? An examination of the frequency of applicant faking behavior. Personnel Review, 36, 341–355.
Hogan, J., Barrett, P., & Hogan, R. (2007). Personality measurement, faking, and employ-ment selection. Journal of Applied Psychology, 92, 1270–1285.
Hogan, R., & Hogan, J. (1995). Hogan Personality Inventory Manual, 2nd ed. Tulsa, OK: Ho-gan Assessment Systems.
Hough, L. M., & Schneider, R. J. (1996). Personality traits, taxonomies and applications in organizations. In K. R. Murphy, ed., Individual Differences and Behavior in Organizations (pp. 31–88). San Francisco, CA: Jossey-Bass.
Jackson, D. N. (1994). Jackson Personality Inventory – Revised Manual. Port Huron, MI: Sigma Assessment Systems.
Jackson, D. N. (1999). Personality Research Form Manual. Port Huron, MI: Sigma Assessment Systems.
Judge, T. A., & Cable, D. M. (1997). Applicant personality, organizational culture, and or-ganizational attraction. Personnel Psychology, 50, 349–394.
Kelly, M. L. (Ed.). (1999). 16PF Select manual. Champaign, IL: Institute for Personality and Ability Testing.
Kline, P. (1993). The Handbook of Psychological Testing. New York: Routledge. Muller, J., & Young, R. (1988). An evaluation of psychological tests in the selection process for EEG technician trainees. American Journal of EEG Technology, 23, 147–158.
Ones, D. S., & Viswesvaran, C. (1998). The effects of social desirability and faking on per-sonality and integrity assessment for personnel selection. Human Performance, 11, 245–269.
Roberts, B. W., Walton, K. E., & Viechtbauer, W. (2006). Patterns of mean-level change in personality traits across the life course: A meta-analysis of longitudinal studies. Psycho-logical Bulletin, 132, 1–25.
Rosse, J. G., Stecher, M. D., Miller, J. L., & Levin, R. A. (1998). The impact of response dis-tortion on preemployment personality testing and hiring decisions. Journal of Applied Psychology, 83, 634–644.
SHL Group (2006). Occupational Personality Questionnaire 32 Technical Manual. Thames Dit-ton: SHL Group.
Society for Industrial and Organizational Psychology (2003). Principles for the Validation and Use of Personnel Selection Procedures, 4th ed. Bowling Green, OH: SIOP.
Stark, S., Chernyshenko, O. S., Chan, K., Lee, W. C., & Drasgow, F. (2001). Effects of the testing situation on item responding: Cause for concern. Journal of Applied Psychology, 86, 943–953.
Tett, R. P., Anderson, M. G., Ho, C. L., Yang, T. S., Huang, L., & Hanvongse, A. (2006). Seven nested questions about faking on personality tests: An overview and interaction-ist model of item-level response distortion. In R. Griffith, ed., A Closer Examination of Applicant Faking Behavior. Greenwich, CT: Information Age Publishing.
Tett, R. P., & Christiansen, N. D. (2007). Personality tests at the crossroads: A response to Morgeson, Campion, Dipboye Hollenbeck, Murphy, and Schmitt (2007). Personnel Psy-chology, 60, 967–993.
Van Dam, K. (2003). Trait perception in the employment interview: A five-factor model perspective. International Journal of Selection and Assessment, 11, 43–55.
Viswesvaran, C., & Ones, D. S. (1999). Meta-analyses of fakability estimates: Implications for personality measurement. Educational and Psychological Measurement, 59, 197–210.
Warr, P., & Pearce, A. (2004). Preferences for careers and organizational cultures as a func-tion of logically related personality traits. Applied Psychology: An International Review, 53, 423–435.