The Use of Medicare Enrollment Data in the 2010 ...€¦ · The Use of Medicare Enrollment Data in...
29
The Use of Medicare Enrollment Data in the 2010 Demographic Analysis Estimates Kirsten West, Jason Devine, Bethany DeSalvo and Katherine Condon Population Division U.S. Census Bureau Working Paper No. 89 This paper was prepared for the U.S. Census Bureau Workshop: 2010 Demographic Analysis Technical Review, Suitland, Maryland, January 8, 2010. This report is released to inform interested parties of ongoing research and to encourage discussion of work in progress. Any views expressed on statistical, methodological, or technical issues are those of the authors and not necessarily those of the U.S. Census Bureau. Population Division Working Paper
Transcript of The Use of Medicare Enrollment Data in the 2010 ...€¦ · The Use of Medicare Enrollment Data in...

The Use of Medicare Enrollment Data in the 2010
Demographic Analysis Estimates
Kirsten West, Jason Devine, Bethany DeSalvo and Katherine Condon
Population Division
U.S. Census Bureau
Working Paper No. 89
This paper was prepared for the U.S. Census Bureau Workshop: 2010 Demographic Analysis Technical Review, Suitland,
Maryland, January 8, 2010.
This report is released to inform interested parties of ongoing research and to encourage discussion of work in progress. Any
views expressed on statistical, methodological, or technical issues are those of the authors and not necessarily those of the U.S.
Census Bureau.
Population Division
Working Paper

Abstract
This paper was prepared along with three companion documents to facilitate discussion during a
Demographic Analysis (DA) technical review workshop.1 The paper focuses on Medicare
enrollment as a source for estimating the population aged 65 and older on April 1, 2010. Three
major issues are discussed:
Not all United States residents aged 65 and older are enrolled in Medicare - either by law,
or by preference. Correction factors need to be applied to the Medicare Enrollment
Database (MEDB) to obtain an accurate estimate of the size and distribution of the
United States population on April 1, 2010 by single year of age, sex, and race.
There are records in the MEDB that should be excluded from the DA estimates. This
includes people under 65 who qualify for Medicare, enrollees with residences outside of
the United States, and records for people who were deceased as of April 1.
The MEDB contains records with unknown and missing race codes. Also, Hispanic
origin is recorded as a race category in the MEDB. These records need to be assigned a
race code of Black or non-Black.
The paper proposes strategies for meeting the challenges associated with these issues.
1 The companion documents are: 1) "Coverage of Population in Census 2000 Based on Demographic Analysis:
The History Behind the Numbers," by J. Gregory Robinson; 2) "The Use of Vital Statistics in the 2010
Demographic Analysis Estimates," by Jason Devine, Larry Sink, Bethany Desalvo, and Rachel Cortes;
and 3) "Estimates of Net International Migration for the 2010 Demographic Analysis Estimates,” by Renuka
Bhaskar, Melissa Scopilliti, Frederick Hollmann, and David Armstrong. They were presented at the U.S. Census
Bureau Workshop: 2010 Demographic Analysis Technical Review, Suitland, Maryland, January 8, 2010.

Introduction
This paper: 1) identifies key issues related to the use of Medicare data in Demographic Analysis
(DA), 2) describes how estimates of underenrollment are developed to account for those who
delay enrollment or will never enroll, 3) outlines issues related to race characteristics in the
Medicare Enrollment Database (MEDB) including options for improvements, and 4) provides an
overview of ongoing research.
Demographic Analysis estimates are produced through a basic demographic bookkeeping
equation involving administrative records of vital population events or program participation and
other information related to population change. The DA estimates are produced for the nation by
single year of age, sex, and for two race categories, Black and non-Black using separate
methodologies for two different age segments of the population.1
For the population under age
65, birth cohorts are followed as they age and experience loss through deaths and emigration or
growth through immigration.
For the population aged 65 and older, a stock estimate is derived from aggregated Medicare
enrollment records.2 The demographic component estimates for the population under 65 are then
combined with the Medicare-based estimate for the population aged 65 and older to produce the
DA estimate for the total population.
The steps in the development of the estimates for the population aged 65 and older using the
MEDB are provided in Appendix A.
1 DA estimates are developed for the Black population, and all other races combined (referred to here as non-Black).
Black is used throughout this report to refer to the Black or African American population. 2 A different approach is used for the population aged 65 and older primarily because of the lack of completeness of
the birth records for the older age groups.

2
Key Issues With Enrollment Data
When using the MEDB to estimate the population, the quality of the data must be carefully
evaluated. Accounting for omissions because of delayed enrollment or because an individual
will never enroll and erroneous inclusion of the deceased in the MEDB are areas of concern.
Methods for estimating omissions are outlined first, followed by a discussion of erroneous
inclusions of individuals in the MEDB. Finally, the race information in the MEDB is presented
and strategies for enhancing this information using data from Census 2000 are described.
Eligibility and Coverage
Historically, the DA estimates developed from the Medicare data have indicated nearly complete
census coverage for ages 65 and over, with net overcounts for some age groups (Table 1). The
overcount was estimated to be 1.2 percent (or 404,000) in Census 2000; a negligible net
undercount was measured in 1990 (rounded to 0.0 percent). In the 1990 Census, it was estimated
that males were undercounted starting at age 70, as were females ages 75 and over. In Census
2000, males in the age group 65-69 were slightly undercounted (0.2 percent), while females were
overcounted in each age group.
Based on preliminary processing of the unadjusted 2007 Medicare data, there were 35.8 million
persons aged 65 and older enrolled in Medicare. The Census Bureau‟s July 1, 2007 estimate of
the population aged 65 and older was 37.9 million.
In general, U.S. citizens or permanent residents are eligible for Medicare benefits if they have
worked for at least ten years in a job that has paid money into the Medicare system. The
eligibility rule also applies to spouses. If either spouse paid money into the Medicare system,
then they are both covered at full or partial cost.
Persons with at least 40 quarters (10 years) of Social Security covered employment are
eligible for Medicare, at no cost for the Hospitalization Insurance (Part A).
3
Persons with 30 to 39 quarters of Social Security covered employment are eligible for
Medicare, but at partial cost for Part A.3
Federal employees with at least 40 quarters of federal employment are eligible for Medicare,
at no cost for Part A.
U.S. citizens with less than 30 quarters of Social Security covered employment are eligible
for Medicare, but at the full age-based actuarial cost.
Legal immigrants with at least 5 years continuous residency in the United States and with
less than 30 quarters of Social Security covered employment are eligible for Medicare, but at
the full age-based actuarial cost.
Our tabulation from the MEDB for use in DA includes all persons in the MEDB except:
those not residing in the United States;
those who are not aged 65 and older as of April 1 of the estimate year (some individuals
under age 65 may be eligible for Medicare if diagnosed with permanent disability or
permanent kidney failure that requires dialysis or a kidney transplant);
those with no date of birth;
those with a date of death before April 1 of the estimate year (Kim and Sater, 2001a; Kim
and Sater, 2001b; Sater, 2001a; Sater 2001b).
Medicare enrollment is generally presumed to be a nearly complete source of information on the
size of the U.S. resident population aged 65 and older. In the late 1990s, the Social Security
Administration estimated the Medicare coverage of the population to be about 96 percent (U.S.
House of Representatives Committee on Ways and Means, 1998). Research by Kim and Sater
(2001a) puts the estimate of overall coverage at about 95 to 97 percent of the population.
3 The 2009 Medicare premium for persons with 30-39 quarters is $244 per month. For persons with less than 30
quarters, the cost is $433 per month. Full age-based actuarial costs are calculated by taking into account the
estimated cost of benefits for age-specific cohorts. Source: http://www.cms.hhs.gov.

4
Estimates of Underenrollment
Because registration in Medicare is not 100 percent complete, estimates of those who are not
enrolled need to be developed to estimate the total population aged 65 and older. The
adjustments for underenrollment must also account for differences in enrollment rates by age,
sex, and race (Black/non-Black). For DA in 2000, there were two components of the estimates
of underenrollment: an estimate of those who delayed enrolling past their initial age of
eligibility, and an estimate of those who would never enroll. Information from the MEDB itself
on age at the time of enrollment was used to estimate the number of people who delayed their
enrollment. Data from the Current Population Survey (CPS) were used to derive an estimate of
those who will never enroll. Details of how the estimates are developed are provided in the
following sections.
Delayed Enrollment
To use the MEDB as a source for the DA population estimates, adjustments for underenrollment
need to account for differences in enrollment at each age to ensure that the single year of age
distribution derived from the MEDB is representative of the age distribution in the United States
resident population at ages 65 and over. Eligibility for Medicare coverage starts at age 65 (three
months before your 65th
birthday to three months after). If an individual does not enroll at that
time, then the individual must wait until the general enrollment period, which is January 1 to
March 1 each year. Some individuals delay their entry into the Medicare program past the
month in which they turn age 65 even though they will eventually enroll in Medicare. We call
this “delayed enrollment.”
We derive information on delayed enrollment from the Medicare database itself using current
age and age at enrollment to estimate the number that have not enrolled but eventually will, by
single year of age, sex, and race. Assuming that above a certain age those enrolled represent a
closed population (i.e., individuals on the file represent the entire population above that age and
they were all eligible to enroll at each younger year of age) allows us to estimate the number of
people that have not enrolled but eventually will (classified by single year of age, sex, and race).

5
In 2000, ages 65-72 were excluded from the derivation of the delayed enrollment estimate
because the age at enrollment for these ages would only reflect the limited number of years when
they were able to enroll.
It should be noted that since the estimates of delayed enrollment are based on information from
those currently enrolled above a certain age, the estimates are sensitive to changes in enrollment
patterns.
To show how information on age at enrollment could be used, a tabulation of age at first
enrollment for all enrollees from the 2000 MEDB is provided in Table 2. Of the 33.2 million
persons in the 2000 MEDB, 30.6 million (or 92.2 percent) enrolled within the first month of their
65th
birthday. A total of 2.6 million delayed their enrollment into the Medicare program. As
might be expected, the pace of enrollment declines with age: 763,000 (2.3 percent) enroll when
they are age 65, another 411,000 (1.2 percent) enroll at age 66, and 0.8 percent enroll at age 67.
The enrollment percents become very small beyond the mid-70‟s.
Expressed differently, for any given age, the cumulative percent that enroll at that age or after is
derived by summing the percents (Table 2, column 4). For example, at age 66, 5.5 percent of the
Medicare population enrolls at age 66 or after. Because of the relatively high rates of enrollment
between ages 65 and 69, the cumulative delayed enrollment at age 70 drops to 2.4 percent. By
age 80, only another 0.6 percent of persons will enroll at that age or later. It is assumed that no
one enrolls after age 85.
The cumulative delayed enrollment factors derived from the MEDB provide an empirical basis
for inflating the Medicare enrolled population at each age for those who are not in the MEDB
because they are delaying their enrollment.
Table 3 shows the DA 2000 delayed enrollment adjustment factors for the total population,
summed across age groups. The delayed enrollment rates are higher for males (2.6 percent) than
females (1.8 percent), highest for Black males (4.3 percent), and lowest for non-Black females
(1.6 percent).

6
Estimates of the Number of Persons Who Never Enroll in Medicare
Conceptually, the delayed enrollment adjustments relate to the population that ultimately enrolls
in Medicare at some age. In order to estimate the total population not enrolled, we also need an
estimate of those who will never enroll. Previous research has assumed that individuals who
delay enrollment will have enrolled by age 85. Thus, we use the percent of the age 85 and over
population that is not enrolled in Medicare to derive an estimate of the population aged 65 and
older who will never enroll in Medicare.
The CPS Annual Social and Economic Supplement (ASEC)-Health Insurance Data have been
used as the source for the development of the never-enrolled adjustment factor.4 For 2000, this
correction factor was assumed to account for the entire population 65 and over residing in the
United States who would never enroll. The CPS ASEC produces national and state-level
estimates of health insurance coverage. The CPS ASEC respondents are asked whether they had
any medical insurance coverage during the previous calendar year based on interviews conducted
in February-April of the survey year. A specific question on the survey inquires about
enrollment in Medicare (See Appendix B). For 2010, we plan to develop the correction factors
from the CPS and we are currently compiling the data for the years 2002-2008 to examine the
trend in this decade.
In the 2000 DA, the percentages not enrolled in Medicare at ages 85 and over were 3.5 for Black
males; 2.5 for Black females; 2.0 for non-Black males; and 1.5 for non-Black females (see last
row of Table 4). The percents were based on the CPS estimates of Medicare coverage by age,
sex, and race. Given the issue of sampling variability, an average of the CPS estimates for the
1990s for the population aged 75 and over was used to determine the percent that will never
enroll in Medicare (at ages 85 and over). The CPS estimates for 75 and over and 85 and over
were similar overall (this is expected based on the low percent who enroll after age 75); possibly
due to the small sample for each age, the individual estimates for ages 85 and over exhibited
much variability from year to year and were not consistent across sex-race categories.
4 The Current Population Survey (CPS) is a monthly survey of about 50,000 households conducted by the Bureau of
the Census for the Bureau of Labor Statistics. The survey has been conducted for more than 50 years.

7
Those who will never enroll must also be accounted for in the ages 65-84. For non-Black males
and non-Black females, the percents for the 85 and over population in 2000 were used (2.0 and
1.5 percent, respectively). For the 85 and over Black male and Black female population, the
percents were higher than for non-Black males and females. In 2000, the never enrolled rate at
age 65-69 for Black males and females was assumed to be higher and set at 0.5 percentage points
above the percent for the corresponding non-Black populations. As shown in Table 4, the
percent never enrolled for Black males drops from 3.5 for age 85 and over in 2000 to 2.5 for age
65-69; the percent for Black females moves slightly from 2.5 for age 85 and over to 2.0 for age
65-69. The never enrollment rates for ages 70-84 for Black males and females were interpolated.
Total Corrections to the Medicare Enrollment Database (MEDB)
As described, the series of correction factors that are applied to the Medicare data to derive an
estimate of the total population aged 65 and older consists of a combination of estimates of those
who are delaying enrollment and those who will never enroll. The percents for both the delayed
enrollment factor and never enrolled factor are added to derive the total percent unenrolled,
specific to each single year of age, sex, and race (Black, non-Black) combination. The Medicare
enrollment total (by age, sex, race) is divided by the enrollment rate (100 minus percent
unenrolled divided by 100) to produce the DA estimates.
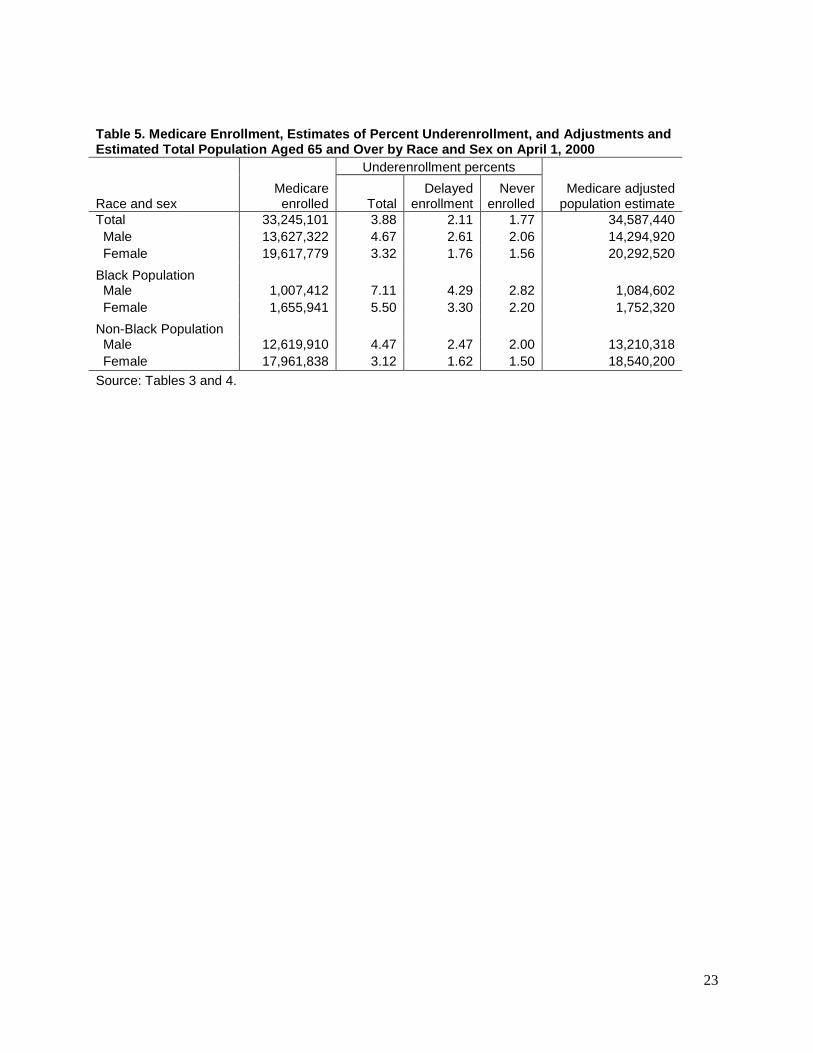
Table 5 summarizes the derived underenrollment factors used in the 2000 DA estimates, for sex
and race categories. The overall underenrollment in the MEDB is estimated to be 3.9 percent (or
1.3 million). The delayed enrollments (2.1 percent) and never enrollments (1.8 percent) are of a
similar magnitude. The estimated total Medicare underenrollment was highest for Blacks (7.1
percent for Black males, 5.5 for Black females); the delayed enrollment component was the
largest piece of the estimate of underenrollment.
Table 6 shows the total underenrollment rates by single years of age, sex, and race used for DA
in 2000. For all race-sex groups, the incompleteness in the MEDB is most pronounced at the
ages immediately after turning 65, especially for Blacks. The rates exceed 10 percent for Black
8
males under age 68, for Black females under age 67, and for non-Black men at age 65. The
underenrollment percents fall with advancing age as more persons sign up for Medicare each
year after turning 65. By age 74, the underenrollment rates are less than 5 percent for all groups;
the percents at ages over age 85 reflect the assumptions about the populations who never enroll.
Other Issues Associated With Underenrollment
Two “universe” issues impact the estimates of underenrollment described in this section. First,
the estimates of the percent of population who never enroll in Medicare (see Table 5) are derived
from CPS data. The universe of the CPS is the civilian noninstitutionalized population, so
military personnel or those residing in institutions (including nursing homes) are not surveyed.
The military is not a factor for the older population; however, the institutionalized population is,
especially for the population age 85 and over which is the key estimate for developing the never-
enrolled factors. About 21.4 percent of females age 85 and over were enumerated in institutions
in 2000 (primarily nursing homes); the percent was 12.1 for males. The underenrollment rates in
Table 5 will be biased to the extent that the rates of elderly residents in institutions differ
appreciably from the rates for the household population.
Second, no explicit allowance is made for undocumented immigrants aged 65 and older living in
the country. A portion of this population would not be enrolled in Medicare or picked up by any
of the underenrollment factors (those who delay their enrollment and those who never enroll in
Medicare). Some could be long-term residents and included in the Medicare system.
Undercoverage of this population in the CPS and the Medicare data would cause the DA
estimates for the population at ages 65 and over to be too low.
Erroneous Inclusion in the Medicare Enrollment Database
The reported dates of death in the MEDB are used to exclude persons that were deceased as of
April 1 of the estimate year from the DA Medicare-based estimates. Some records in the MEDB
have invalid dates or a date of death after April 1 of the year of the cut for the data extract. Also,

9
some records have missing values for this variable, even though their date of birth implies they
are deceased.
Work by Kim and Sater (2001a) and Sater (2001a) showed a small number of missing values for
date of deaths at the uppermost ages (ages 100 and older). However, at these ages where the
population is small, a small number of cases with missing dates of death might have an impact,
especially if the end goal is census coverage evaluation. This overstatement is evident in
comparing the Census 2000 count of the population age 100 and over (50,454) with the number
based on the 2000 MEDB (129,518). Given that the census count may overstate the “true”
number of centenarians (Krach and Velkoff, 1999), the Medicare total is clearly too high and
includes a relatively large number of deceased persons.
Assignment of Race to Records in the Medicare Enrollment Database
Information on race obtained from the Social Security Administration (SSA) is available from
the MEDB. While only a small percentage has missing, unknown, or invalid race codes (less
than 0.2 percent in 2007) a larger issue for DA is the categories for which the information is
available. In the MEDB, Hispanic origin is included as an additional race category, rather than
as an ethnicity. The MEDB also includes an “Other” category. Together, in 2007, these two
categories represent almost 4 percent of the records on the file.
The DA estimates are produced for two race categories: Black and non-Black, making it
necessary to identify a method to redistribute records that cannot be directly assigned to either
the Black or non-Black categories.
For DA in 2010, we are looking to the Census Bureau‟s Person Characteristics File (PCF) as a
data source that could be used to improve how records in the MEDB are assigned to the Black
and non-Black categories. We are researching the option of utilizing the linkages between the
PCF, Social Security data, and the MEDB to obtain the Census 2000 and a modeled race for each
of the Medicare records.

10
Background for Assignment of Race
In order to understand how information from the PCF could improve the estimates by race from
the MEDB it is useful to know the process through which race was obtained for the Medicare
records and the history of the race categories on the current MEDB (McBean, 2006).5
The Centers for Medicare and Medicaid Services (CMS) is responsible for enrollment in the
Medicare program. The SSA provides demographic information (including race) about
individuals enrolled in Medicare to CMS and also certifies that an individual is eligible to enroll
in Medicare. The SSA collects information on race at the time of application for a Social
Security Number (SSN).
The information from SSA is maintained on the SSA Master Beneficiary Record (MBR) and
provided to the CMS for inclusion in the MEDB.
From 1936 (the beginning of Social Security) to 1980, race data were collected in only three race
categories: White, Black, and Other with an additional category of Unknown race. Starting in
1980, the race category „Other‟ was split into: 1) Asian, Asian American or Pacific Islander,
2) Hispanic, and 3) American Indian or Alaskan Native. However, the MBR does not have
provisions for these additional race categories. In the MBR, the information is collapsed to the
original format and maintained as „Other‟ race.
In 1980, SSA established a master file of SSN holders, (known as the Numident file). In 1994,
the Numident race was incorporated into the MEDB for all current Medicare beneficiaries.
Since 2000, updates have occurred annually. The 2007 MEDB has race distributed in the five
1980 race categories plus Other, Unknown, and Blank (missing). However, for the majority of
those enrolled in Medicare who applied for a Social Security card before 1980, their race
classification will not be updated from the three pre-1980 race categories unless they submit a
new application, for example to change their name or request a replacement card. Despite some
5 A Medicare Brief from the National Academy of Social Insurance served as the source for the background
information on race available from the Medicare Enrollment Database (McBean, 2006).
11
efforts to update the race information in the MEDB, there is no process for updating the race
information when the standards for categorizing race and ethnicity are revised by the Office of
Management and Budget (OMB).6
In the MEDB, some records are classified as race unknown or have an assigned race because the
enrollees did not come in through the regular application route. Below are four examples of how
Social Security card holders could have no race classification or an assigned race in the MEDB.
Former railroad workers enrolled through the Railroad Retirement Board. The Board did
not collect information on race and ethnicity.
Since 1984, many newborn infants have been assigned an SSN through a process known
as Enumeration at Birth. In the 1990‟s this became a requirement to get a child deduction
by the Internal Revenue Service (IRS). The information is provided from the vital
statistics office in each state. There is no race information generated in this process.
When these persons become eligible for Medicare, they will need to have a race assigned.
This will not impact DA for 2010.
If an individual is enrolled in Medicare through the Medicare Health Plan there is no
requirement to report information regarding the race and ethnicity of plan members.
There are also enrollees with an assigned race. Beneficiary spouses who never applied
for an SSN of their own have their race variable information populated by the race of
their wage-earner spouse. This race may or may not accurately reflect the race/ethnicity
they would have provided. It is estimated that as many as 18 percent of all Medicare
beneficiaries (not all enrollees are aged 65 and older) fall into this category (Arday et al.,
2000).
6 CMS does attempt to update the race information for some enrollees. CMS gets quarterly updates on American
Indians and Alaska Natives from the files of the Indian Health Service (McBean, 2006). Also, in 1997, CMS
initiated a mailing to those beneficiaries classified as other or unknown and to those with Hispanic surname (as
identified by an algorithm developed by the Census Bureau). The CMS asked 2.2 million beneficiaries to provide
their race and Hispanic origin. More than 850,000 replies were received.

12
The Census Bureau’s Person Characteristics File
In 1997, the Office of Management and Budget (OMB) revised the standards for categorizing
race and Hispanic origin. The revision created five main race categories: 1) White, 2) Black or
African American, 3) Asian, 4) American Indian or Alaskan Native, and 5) Native Hawaiian or
Other Pacific Islander. The revision also allowed for the selection of one or more categories.
Hispanic origin was collected as a separate category and someone who selected Hispanic could
be of any race. The U.S. Census Bureau adopted the revised standards for Census 2000.
Over the last decade, the Census Bureau has built a person-level file from administrative records
primarily for application to decennial census research and development. The file starts with the
SSA‟s Numident file. This file is processed to produce a file of unique SSNs, the 100 percent
Census Numident file.7 The file is then enhanced with demographic data to create the Person
Characteristics File (PCF) (see Miller, Judson, and Sater, 2000 for a more complete description
and analysis of the demographic properties of this file).
The race information in the MEDB could be enhanced by matching the Census 2000 file to the
MEDB through the link with the Census Numident file. The Census 2000 race and Hispanic
origin would then be available for each matched Medicare record. A modeled race based on
information contained in the PCF would also be available for each record in the MEDB. For a
more detailed discussion of the use of administrative records to model race and Hispanic origin,
see Resnick, 2002.
With the availability of the PCF, we have an opportunity to improve the assignment of the
Medicare enrollees to the Black and non-Black categories by merging the Medicare and the PCF
file to obtain two additional race variables for each matched record: Census 2000 race and
modeled race.
7 The SSNs are replaced by randomly assigned Protected Identity Keys (PIKs) to maintain confidentiality (Farber
and Miller, 2002).

13
Ongoing Research
More effort is being directed towards using the information obtained from the PCF file. Two
options are outlined below. The only difference between the two options is the order in which
either the Census or the modeled race is used. If the race in the MEDB is Hispanic, Unknown, or
Blank, Option 1 turns to the Census race first, and then if both the Medicare and Census race
cannot be classified as being in either the Black or non-Black race categories the modeled race is
used. In Option 2, the modeled race is used if the Medicare race is Hispanic, Unknown, or
Blank. If both Medicare and modeled race cannot be classified as either Black or non-Black,
then the information is obtained from the census form. A third option would be to use the PCF
to replace the Medicare race altogether.

14
Option 1: Use the Medicare race first, the Census race second, and then the modeled race.
Race
Medicare Census Modeled Assigned as
White
Asian
American Indian
Other
Not used
Not used
Non-Black
Black Not used Not used Black
Hispanic
Unknown
Blank
White
Asian
Pacific Islander
American Indian
Not used
Non-Black
Black Not used Black
Multiple
Unknown
Blank
White
Asian
Pacific Islander
American Indian
Non-Black
Black Black
Multiple
Blank
Distributed
Proportionally

15
Option 2: Use the Medicare race first, the modeled race second, and then the Census race.
Race
Medicare Modeled Census Assigned as
White
Asian
American Indian
Other
Not used
Not used
Non-Black
Black Not used Not used Black
Hispanic
Unknown
Blank
White
Asian
Pacific Islander
American Indian
Not used
Non-Black
Black Not used Black
Multiple
Blank
White
Asian
Pacific Islander
American Indian
Non-Black
Black Black
Multiple
Unknown
Blank
Distributed
Proportionally
Other Sources for Benchmarking the Medicare Estimates
We are examining other sources of health insurance coverage measures, particularly from the
American Community Survey (ACS), the Health and Retirement Study (HRS), the Medical
Expenditure Panel Study (MEPS), and the National Health Interview Survey (NHIS) to get
several benchmarks for coverage.

16
The Medicare-based DA estimates of the population 65 and over can also be benchmarked
against estimates developed using the age-period-cohort approach used by Preston et al. (1998)
to analyze the size of the Black population in 1990. For 1990 (the last year available in their
reconstructed estimates), Preston et al.‟s estimates of the Black population for ages 65 and over
were based on an age-period-cohort model that included historical census counts and adjustments
to account for the error in each census. While their estimates differed from the Medicare-based
DA estimate for ages 65 to 84 by only 0.3 percent, the discrepancies were larger for individual 5-
year age groups. An evaluation of the Preston et al. estimates and the DA estimates was
conducted as part of the review of the DA estimates in 2000 (McDevitt et al., 2001). The work
of Preston et al. or a similar approach could serve as a benchmark for the population aged 65 and
older or replace the Medicare-based estimates altogether.
Overlap between the Vital Statistics Based Estimates and the Medicare Based Estimates
The Medicare data have been used in previous DA efforts because of the incompleteness of the
vital statistics data prior to 1935. With those born in 1935 turning 75 in 2010, it is now possible
to extend the vital statistics based DA estimates to age groups older than age 65. The age group
overlap will allow for an assessment of the Medicare estimates for the 65 to 74 year old
population that was not possible in 2000.
Summary
When using the MEDB to estimate the population aged 65 and older corrections
must be made for delayed enrollment, persons who never enroll, and persons who should no
longer be on the file. Furthermore, race characteristics derived from the MEDB may be different
from those of other data sources. In this paper, we have described how we can use information
from the MEDB and the Current Population Survey to compensate for persons who will never
enroll. We also have described how we might use the Census Bureau‟s Person Characteristics
File to enhance the race information in the MEDB. When these measures are utilized, the DA
estimates for the population aged 65 and older will be combined with the DA estimates for the
population less than age 65 to produce a benchmark for census evaluation.

17
References
Arday, S.L., D. Arday, S. Monroe, and J. Zhang. 2000. “HCFA‟s Racial and Ethnic Data:
Current Accuracy and Recent Improvements.” Health Care Financing Review 21.4: 107-116.
Farber, J. and E. Miller. 2002. “Matching Census 2000 to Administrative Records.” Proceedings
of the 2002 Joint Statistical Meeting. Alexandria, VA.
Kim, M. and D.K. Sater. 2001a. “An Introduction to Medicare Data and the U.S. Census
Bureau‟s Use of Medicare Data.” Unpublished Census Bureau Paper.
_____. 2001b. “Defining the Medicare Data Universe for the Population Estimates Program: A
First Look.” Unpublished Census Bureau Paper.
Krach, C. and V.A. Velkoff. 1999. Centenarians in the United States. U.S. Bureau of the Census,
Current Population Reports, P23-199RV. Washington, DC: U.S. Government Printing Office.
McBean, M. A. 2006. “Improving Medicare‟s Data on Race and Ethnicity.” National Academy
of Social Insurance. Medicare Brief, No 15.
McDevitt, T., N. Jones, C. Joyce, M. O'Connell, and A. S. Smith. 2001. “Births and Deaths
Evaluation.” Unpublished Census Bureau Paper.
Miller, E.R., D.H. Judson, and D.K. Sater. 2000. “The 100% Census Numident”. Paper
presented at the Annual Meeting of the Southern Demographic Association. New Orleans, LA,
October 26-28.
Preston, S.H., I.T. Elo, A. Foster, and H. Fu. 1998. “Reconstructing the Size of the African
American Population by Age and Sex, 1930–1990.” Demography, 35.1: 1-21.
18
Resnick, D.M. 2002. “Improving the Accuracy of Race and Hispanic Origin in Administrative
Records.” Proceedings of the 2002 Joint Statistical Meeting. Alexandria, VA.
Robinson, J.G., A. Adlakha, and K.K. West. 2002. “Coverage of Population in Census 2000:
Results from Demographic Analysis.” Paper presented at the Annual Meeting of the Population
Association of America. Atlanta, GA, May 8-11.
Sater, D.K. 2001a. “Defining the Medicare Data Universe for the Population Estimates Program:
A Second Look.” Unpublished Census Bureau Paper.
_____. 2001b. “Data Content, Quality, and Consistency of Data in the Medicare Micro-data
Files.” Unpublished Census Bureau Paper.
U. S. House of Representatives Committee on Ways and Means. 1998. 1998 Green Book -
Background Material and Data on Programs within the Jurisdiction of the Committee on Ways
and Means. Washington, DC: U.S. Government Printing Office.

19
Table 1. Demographic Analysis Estimates of Percent Coverage Error by Age and Sex: 1990 and 2000
Age
Total Male Female
1990 2000 1990 2000 1990 2000
65+ 0.0 1.2 0.3 0.8 -0.3 1.4
65-69 1.5 0.9 1.6 -0.2 1.5 1.9
70-74 0.3 1.2 -0.1 0.5 0.6 1.8
75+ -1.4 1.3 -0.6 1.7 -1.9 1.0
Note: A minus sign denotes a net undercoverage. Source: Robinson et al., 2002
.

20
Table 2. Age at Time of Medicare Enrollment: 2000
Age at time of first enrollment Number enrolled
Percent enrolled at specified age
Cumulative percent enrolled at specified age
or later (1) (2) (3) (4)
65+ 33,245,101
651 30,645,122 92.18 100.00
652 762,704 2.29 7.82
66 410,854 1.24 5.53 67 258,157 0.78 4.29 68 185,982 0.56 3.51 69 173,865 0.52 2.95 70 108,713 0.33 2.43 71 79,747 0.24 2.10 72 69,499 0.21 1.86 73 61,355 0.18 1.66 74 55,493 0.17 1.47 75 52,875 0.16 1.30 76 47,453 0.14 1.15 77 45,376 0.14 1.00 78 43,100 0.13 0.87 79 41,538 0.12 0.74 80 39,201 0.12 0.61 81 37,625 0.11 0.49 82 34,597 0.10 0.38 83 31,444 0.09 0.28 84 30,319 0.09 0.18 85 30,083 0.09 0.09
Note: Enrollment is assumed to be zero after age 85. 1
Enrolled within the first month of turning 65 or earlier. 2 Enrolled between one month after turning 65 and before age 66.
Source: U.S. Census Bureau, tabulations of Medicare enrollment data.

21
Table 3. Estimates of Delayed Underenrollment of Medicare Enrollees by Race and Sex: 2000
Race and sex Medicare enrolled Delayed enrollment
percent
Total 33,245,101 2.11
Male 13,627,322 2.61
Female 19,617,779 1.76
Black
Male 1,007,412 4.29
Female 1,655,941 3.30
Non-Black
Male 12,619,910 2.47
Female 17,961,838 1.62
Source: U.S. Census bureau, tabulations from Medicare enrollment data.

22
Table 4. Estimates of the Percent of Population Aged 65 and Over Who Never Enroll in Medicare by Age, Race, and Sex: 2000
Age Black male
Black female
Non-Black male
Non-Black female
Total male
Total female
65+ 2.82 2.20 2.00 1.50 2.06 1.56
65-69 2.50 2.00 2.00 1.50 2.04 1.55
70-74 2.75 2.13 2.00 1.50 2.06 1.55
75-79 3.00 2.25 2.00 1.50 2.07 1.55
80-84 3.25 2.38 2.00 1.50 2.08 1.55
85+ 3.50 2.50 2.00 1.50 2.11 1.58
Source: Based on Estimates of Medicare Coverage from the Current Population Survey, 2000.
23
Table 5. Medicare Enrollment, Estimates of Percent Underenrollment, and Adjustments and Estimated Total Population Aged 65 and Over by Race and Sex on April 1, 2000
Underenrollment percents
Race and sex Medicare enrolled Total
Delayed enrollment
Never enrolled
Medicare adjusted population estimate
Total 33,245,101 3.88 2.11 1.77 34,587,440
Male 13,627,322 4.67 2.61 2.06 14,294,920
Female 19,617,779 3.32 1.76 1.56 20,292,520
Black Population
Male 1,007,412 7.11 4.29 2.82 1,084,602
Female 1,655,941 5.50 3.30 2.20 1,752,320
Non-Black Population
Male 12,619,910 4.47 2.47 2.00 13,210,318
Female 17,961,838 3.12 1.62 1.50 18,540,200
Source: Tables 3 and 4.

24
Table 6. Estimates of Percent Underenrollment in the Medicare File, by Age, Sex, and Race: 2000
Age
Black male
Black female
Non-Black male
Non-Black female
65+ 7.12 5.50 4.47 3.12
65-69 11.68 10.05 7.16 5.49
70-74 5.50 4.93 4.12 3.16
75-79 4.27 3.57 3.20 2.39
80-84 3.73 2.86 2.50 1.85
85+ 3.52 2.51 2.02 1.51
65 17.53 14.90 10.18 7.91
66 12.96 11.25 7.83 6.04
67 10.29 9.05 6.58 5.06
68 8.61 7.62 5.80 4.44
69 7.37 6.61 5.23 3.99
70 6.51 5.89 4.64 3.60
71 5.83 5.26 4.30 3.33
72 5.33 4.82 4.07 3.12
73 4.96 4.43 3.86 2.94
74 4.64 4.12 3.67 2.78
75 4.64 3.98 3.50 2.63
76 4.40 3.74 3.33 2.49
77 4.21 3.52 3.17 2.37
78 4.03 3.33 3.02 2.25
79 3.87 3.15 2.87 2.14
80 3.95 3.11 2.73 2.03
81 3.81 2.97 2.59 1.93
82 3.70 2.82 2.46 1.83
83 3.53 2.69 2.34 1.74
84 3.44 2.58 2.22 1.66
85 3.61 2.59 2.11 1.58
86 3.50 2.50 2.00 1.50
87 3.50 2.50 2.00 1.50
88 3.50 2.50 2.00 1.50
89 3.50 2.50 2.00 1.50
90+ 3.50 2.50 2.00 1.50
Source: U.S. Census Bureau, tabulations of Medicare enrollment data.

25
Appendix A. Historical Steps for Processing the Medicare Data
The process for producing population estimates of the population aged 65 and older by age, race,
and sex for Demographic Analysis purposes from the MEDB has traditionally been as follows:
1. tabulate the number of living Medicare enrollees aged 65 and older from the Medicare
micro-data files by age, age at first enrollment, sex, and race and limit to the enrollees
living in the United States, not territories;
2. summarize the age by age at time of first enrollment tabulation to define an adjustment
factor for persons who delay their enrollment in Medicare past the month in which they
turn age 65;
3. develop an adjustment factor for persons that will never enroll in Medicare from annual
Current Population Survey data or other sources; and
4. apply the enrollment adjustment factors to the tabulated number of Medicare enrollees to
obtain an estimate of the total population.
For the 1990 DA estimation, two additional steps were included:
1. further adjust the Medicare estimate based on differences between the sex ratio for the
Medicare estimate and historical sex ratios of the population; and
2. create a “final” Medicare estimate by adding an estimate of undocumented immigration
to the sex ratio adjusted Medicare estimate.

26
Appendix B. The Current Population Survey (CPS) and American Community Survey
(ACS) Health Insurance Questions
The Current Population Survey (CPS) is a monthly survey that the Census Bureau conducts for
the Bureau of Labor Statistics to provide data on labor force participation and unemployment.
Data on health insurance coverage are collected through the Annual Social and Economic
(ASEC) Supplement on Health Insurance. The questions are asked at the household level and
then if it applies, at the individual level. The respondent is asked to report about the prior year.
“What type of insurance (was/were) (name/you) covered by in the last year?”
1. NIU
2. Medicare
3. Medicaid
4. Tricare or Champus
5. CAMPVA
6. VA health care
7. Military health care
8. Children's health insurance program (chip)
9. Indian Health Service
10. Other government health care
11. Employer/union-provided (policyholder)
12. Employer/union-provided (as dependent)
13. Privately purchased (policyholder)
14. Privately purchased (as dependent)
15. Plan of someone outside the household
16. Other
The Health Insurance question on the 2008 American Community Survey (ACS) asks the
household respondent to report each household member‟s coverage at the time of the survey by
marking “yes” or “no” for each of eight types listed.

27
“Is this person currently covered by any of the following types of health insurance or health
coverage plans?”
1. Insurance through a current or former employer or union (of this person or another
family member)
2. Insurance purchased directly from an insurance company (by this person or another
family member)
3. Medicare, for people 65 and older, or people with certain disabilities
4. Medicaid, Medical Assistance, or any kind of government-assistance plan for those
with low incomes or disability
5. TRICARE or other military health care
6. VA (including those who have ever used or enrolled for VA health care)
7. Indian Health Service
8. Any other type of health insurance or health coverage plan – Specify