Importance-Performance Matrix Analysis of the Factors Influencing ...
Zeszyty Naukowe
Quality. Production. Improvement
No. 2(3)
2015
pp. 124-136
- 124 -
Manuela Ingaldi1, Martin Kotus
2
THE USE OF IMPORTANCE/PERFORMANCE
ANALYSIS IN EVALUTION OF TRANPOSPORT
SEVICE
Abstract: Services quality, because of their specificity, it is difficult to evaluate,
especially since there is no their materiality, it can't be seen. Usually the gap between the
expectations of customer and his perceptions in relation to a particular service is observed.
In the chapter evaluation of transport service quality in chosen transport company in south
of Poland was made. For this purpose the Importance/Performance analysis was used.
First of all a survey was created. The same survey and its results were already used to
evaluate quality management according to Servqual method in another paper (INGALDI M.,
WYWIAL S. 2015). In this case pairs of evaluations (Performance; Importance) were
placed on Importance/Performance map. In this way the evaluation of the transport
service was possible.
Key words: service quality, transport service, Importance/Performance analysis (IPA)
1. Introduction
A quality of a product or service refers to the perception (experience)
of the degree to which the product or service meets the customer's
expectation.
The quality analysis in case of the services is not as obvious as in
case of the products. Examining the quality of the product we have
tangible evidence of the level of quality. We can examine their
dimensions, weight, the chemical, physical and mechanical properties,
colour, smell, taste (INGALDI M., JURSOVA S. 2013; INGALDI M.,2013).
1 Dr inż., Politechnika Częstochowska, Wydział Zarządzania, Instytut Inżynierii
Produkcji, e-mail: [email protected] 2 Doc. Ing. PhD., Slovak University of Agriculture in Nitra, Faculty of Engineering,
Department of Quality and Engineering Technologies, , e-mail: [email protected]
Zeszyty Naukowe
Quality. Production. Improvement
No. 2(3)
2015
pp. 124-136
- 125 -
Service quality very often is defined as comparison of customer
expectation towards the service with its performance, e.g. reality. So
service quality evaluation is the evaluation of how well a delivered
service conforms to the customer's expectations.
Lots of scientists, working on service quality, decide to use some
typical methods, such as Servqual, mystery shopping or critical incident
technique (CIT). While Importance/Performance analysis (IPA), which is
enough easy to conduct and is not time-consuming, is often skipped.
The Importance/Performance analysis, or importance/implementation
analysis is a simple method used to measure the quality of services. This
method is designed to determine the validity of the characteristics of the
service and their evaluation by customers. Martilla and James, who were
authors of this method, designed a measurement of the expectation and
the significance of factors, variables affecting the quality of services,
from the point of view of the purchasers (MARTILLA J.A., JAMES J.C.
1977).
IPA has been widely used in service industries such as travel and
tourism, education, hospitals, and other sectors (WONG M.S., HIDEKI N.,
GEORGE P. 2011).
Nowadays, most people are focused on their continuous movement.
They like to spend their free time far away from home, they want to run
their business not only in the place of work, employers want to send their
employees to the conferences, fairs, exhibitions, social events. For this
purpose they use their own cars or decide to use public or private
transport. So they benefit from a wide range of services offered by
different transport companies. On the market there are many companies
which offer such services. It is important that the customer based on his
experiences or experiences of his friends, available information is able to
choose the offer of high quality.
The purpose of this chapter is to evaluate the quality of transport
services offered by one of companies from southern Poland. For this
purpose the authors decided to use the Importance/Performance analysis. The analysis allowed to determine what is the level of services offered by
Zeszyty Naukowe
Quality. Production. Improvement
No. 2(3)
2015
pp. 124-136
- 126 -
the research company, according to customers and to provide suggestions
for future directions of the company's activities.
2. Methodology
Customers responding to two types of scaled questions, make a
double evaluation of the same dimensions of the service quality (which
are the evaluation criteria from the point of view of the customers) - once
because of their importance in the process of service delivery and second
time, in terms of the level of implementation of these dimensions; which
means that the first group of questions concerns the importance of each
feature of offers in customers' selection decisions (expectation according
to Servqual method), while the second group refers to the same features,
but in relation to one specific offer of a service provider (perception
according to Servqual method) (STOMA M. 2012). So partly the
Importance/Performance analysis coincides with the Servqual method.
The results obtained with this analysis are summarized in the form of
Importance/Performance map. In this way two evaluations of parameters
mentioned earlier can be determined. The closer to the diagonal of the
map the point is located, the more its performance is correlated with the
needs of customers.
The two dimensional IPA model is divided into four quadrants with
performance on the x-axis and importance on the y-axis. Model of IPA
form of Importance/Performance map was presented in Figure 1.
Quadrant I is labelled as “Concentrate Here”. Attributes that fall into
this quadrant represent key areas that need to be improved with top
priority. Quadrant I is called “the area of urgent needs”. It is very
important that the provider will focus special attention on them.
Quadrant II is labelled as “Keep up the good work”. All attributes
that fall into this quadrant are the strength and pillar of the organisations,
and they should be the pride of the organisations. Quadrant II does not
require from the service provider any serious action, only those necessary

Zeszyty Naukowe
Quality. Production. Improvement
No. 2(3)
2015
pp. 124-136
- 127 -
to maintain the current level of services. It is called “the area of
reasonable property of needs”.
Quadrant I
(High Importance/Low
Performance)
Quadrant II
(High Importance/High
Performance)
Quadrant III
(Low Importance/Low
Performance)
Quadrant IV
(Low Importance/High
Performance)
Fig. 1. Importance/Performance map.
Source: STOMA M. 2012
Quadrant III is labelled as “Low Priority”. Thus, any of the attributes
that fall into this quadrant are not important and pose no threat to the
organisations. Quadrant II is called “the area of the improvement of
service properties”.
Quadrant IV is labelled as “Possible Overkill”. It denotes attributes
that are overly emphasized by the organisations; therefore, organisations
should reflect on these attributes, instead of continuing to focus in this
quadrant, they should allocate more resources to deal with attributes that
reside in quadrant I. Quadrant IV is often called “the area of quality
excess” (WONG M.S., HIDEKI N., GEORGE P. 2011).
The Importance/Performance analysis was modified many times,
what can be exemplified with SWOT analysis (URBANIAK A. M. 2013).
Model technique is a way to study the factors that affect the quality of the
offer perceived by customers in the face of competing offers
(RADKOWSKI K. 2005).
In the research presented in this chapter 134 customers of chosen
transport company took part. The research had a form of the Internet
survey about which fulfilment were asked customers after using the

Zeszyty Naukowe
Quality. Production. Improvement
No. 2(3)
2015
pp. 124-136
- 128 -
services offered by the research company. Electronic form provides
greater anonymity, and at the same time facilitates data collection and
sorting of results.
The proper preparation of the survey is very important element of the
research. It should be remembered that the survey must be written in
simple language that everyone can easily understand, and questions
should not be too long, not to be boring for the respondent. Appropriate
questions must also provide as much information about the quality of the
test service as possible (LESTYÁNSZKA ŠKŮRKOVÁ K., INGALDI M. 2014;
DZIUBA S.T., SZOŁTYSEK K., KOZYRA C. 2011).
The research was performed with the research of Servqual method
presented in paper (INGALDI M., WYWIAL S. 2015). At the beginning
customers had to evaluate their expectations for the transport service
taking into account 22 statements (Table 1). These evaluations are
Importance. Then they evaluated the actual service on the basis of these
same statements, but in relation to the research transport company, e.g.
Performance. Measurement of the service quality is made with a seven
semantic rating scale (Likert scale), where the lowest level of the scale is:
weak, and the highest: excellent (Table 2).
The average values of evaluations of all individual questions from
both part of the Survey were calculated. Then the averages values for pair
of statements (Performance; Importnance) were placed on the
Importance/Perforance map.
Zeszyty Naukowe
Quality. Production. Improvement
No. 2(3)
2015
pp. 124-136
- 129 -
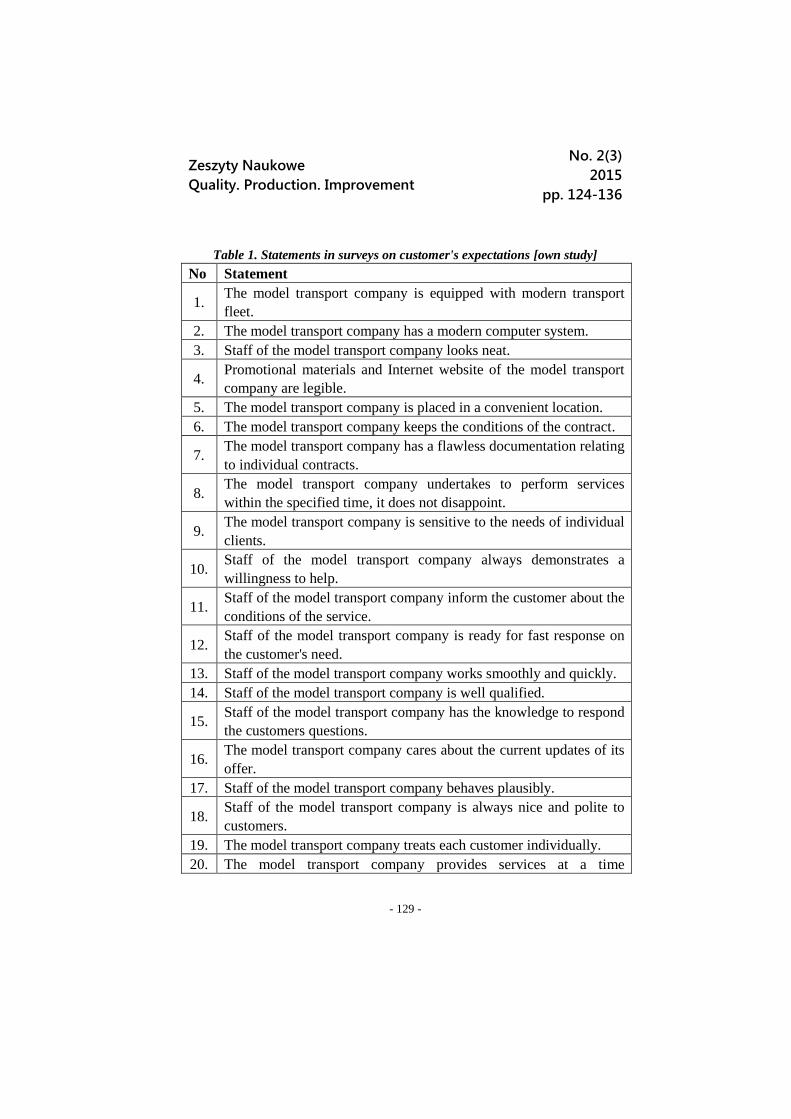
Table 1. Statements in surveys on customer's expectations [own study]
No Statement
1. The model transport company is equipped with modern transport
fleet.
2. The model transport company has a modern computer system.
3. Staff of the model transport company looks neat.
4. Promotional materials and Internet website of the model transport
company are legible.
5. The model transport company is placed in a convenient location.
6. The model transport company keeps the conditions of the contract.
7. The model transport company has a flawless documentation relating
to individual contracts.
8. The model transport company undertakes to perform services
within the specified time, it does not disappoint.
9. The model transport company is sensitive to the needs of individual
clients.
10. Staff of the model transport company always demonstrates a
willingness to help.
11. Staff of the model transport company inform the customer about the
conditions of the service.
12. Staff of the model transport company is ready for fast response on
the customer's need.
13. Staff of the model transport company works smoothly and quickly.
14. Staff of the model transport company is well qualified.
15. Staff of the model transport company has the knowledge to respond
the customers questions.
16. The model transport company cares about the current updates of its
offer.
17. Staff of the model transport company behaves plausibly.
18. Staff of the model transport company is always nice and polite to
customers.
19. The model transport company treats each customer individually.
20. The model transport company provides services at a time
Zeszyty Naukowe
Quality. Production. Improvement
No. 2(3)
2015
pp. 124-136
- 130 -
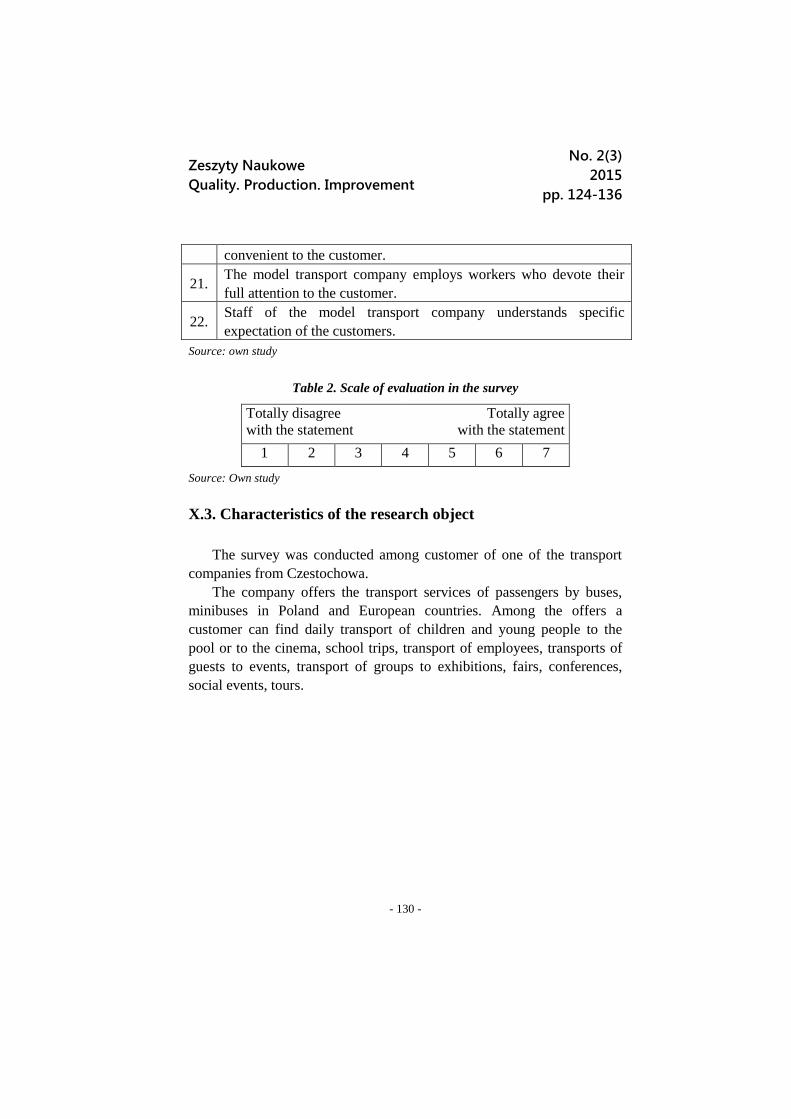
convenient to the customer.
21. The model transport company employs workers who devote their
full attention to the customer.
22. Staff of the model transport company understands specific
expectation of the customers.
Source: own study
Table 2. Scale of evaluation in the survey
Totally disagree
with the statement
Totally agree
with the statement
1 2 3 4 5 6 7
Source: Own study
X.3. Characteristics of the research object
The survey was conducted among customer of one of the transport
companies from Czestochowa.
The company offers the transport services of passengers by buses,
minibuses in Poland and European countries. Among the offers a
customer can find daily transport of children and young people to the
pool or to the cinema, school trips, transport of employees, transports of
guests to events, transport of groups to exhibitions, fairs, conferences,
social events, tours.
Zeszyty Naukowe
Quality. Production. Improvement
No. 2(3)
2015
pp. 124-136
- 131 -
X.4. Results
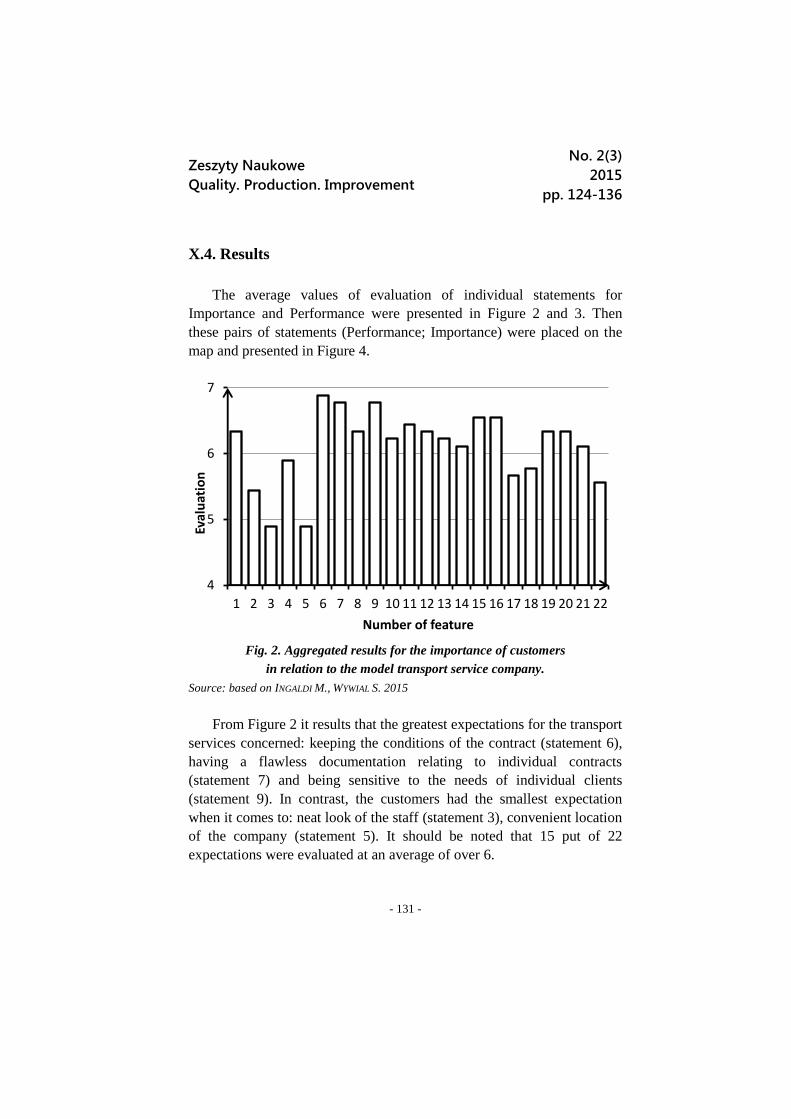
The average values of evaluation of individual statements for
Importance and Performance were presented in Figure 2 and 3. Then
these pairs of statements (Performance; Importance) were placed on the
map and presented in Figure 4.
4
5
6
7
1 2 3 4 5 6 7 8 9 10 11 12 13 14 15 16 17 18 19 20 21 22
Eval
uat
ion
Number of feature
Fig. 2. Aggregated results for the importance of customers
in relation to the model transport service company.
Source: based on INGALDI M., WYWIAL S. 2015
From Figure 2 it results that the greatest expectations for the transport
services concerned: keeping the conditions of the contract (statement 6),
having a flawless documentation relating to individual contracts
(statement 7) and being sensitive to the needs of individual clients
(statement 9). In contrast, the customers had the smallest expectation
when it comes to: neat look of the staff (statement 3), convenient location
of the company (statement 5). It should be noted that 15 put of 22
expectations were evaluated at an average of over 6.
Zeszyty Naukowe
Quality. Production. Improvement
No. 2(3)
2015
pp. 124-136
- 132 -
3
4
5
6
7
1 2 3 4 5 6 7 8 9 10 11 12 13 14 15 16 17 18 19 20 21 22
Eval
uat
ion
Number of feature
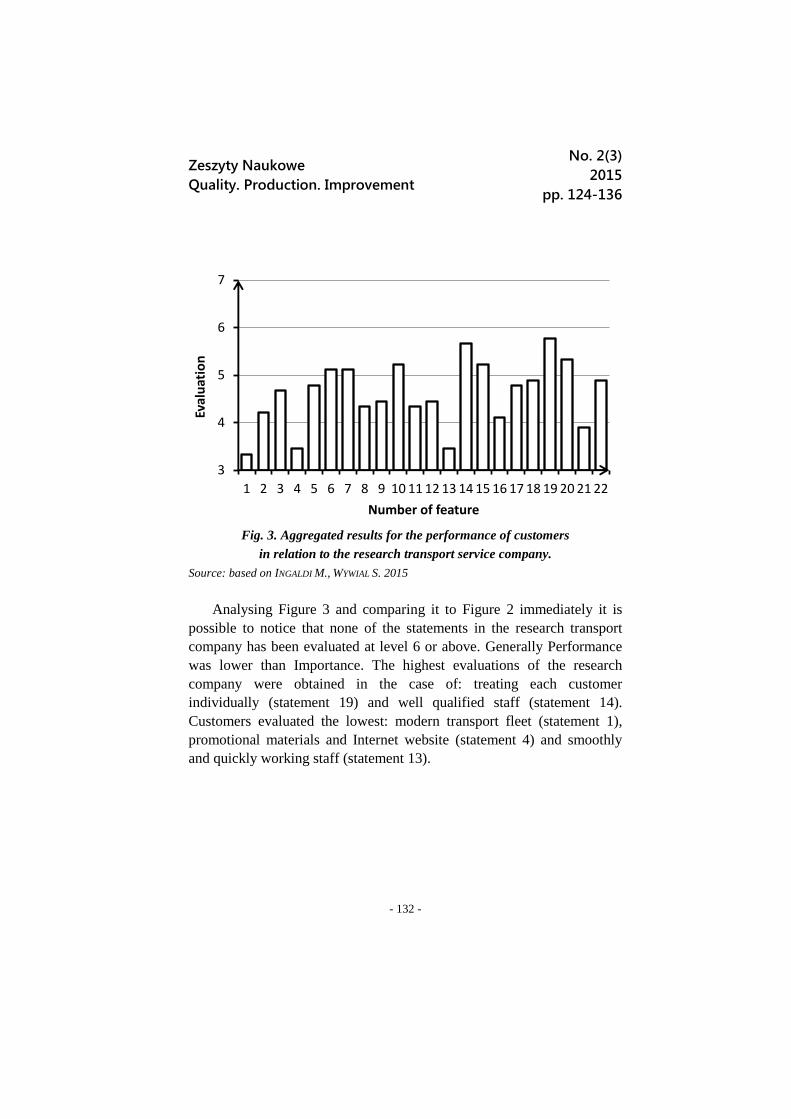
Fig. 3. Aggregated results for the performance of customers
in relation to the research transport service company.
Source: based on INGALDI M., WYWIAL S. 2015
Analysing Figure 3 and comparing it to Figure 2 immediately it is
possible to notice that none of the statements in the research transport
company has been evaluated at level 6 or above. Generally Performance
was lower than Importance. The highest evaluations of the research
company were obtained in the case of: treating each customer
individually (statement 19) and well qualified staff (statement 14).
Customers evaluated the lowest: modern transport fleet (statement 1),
promotional materials and Internet website (statement 4) and smoothly
and quickly working staff (statement 13).
Zeszyty Naukowe
Quality. Production. Improvement
No. 2(3)
2015
pp. 124-136
- 133 -
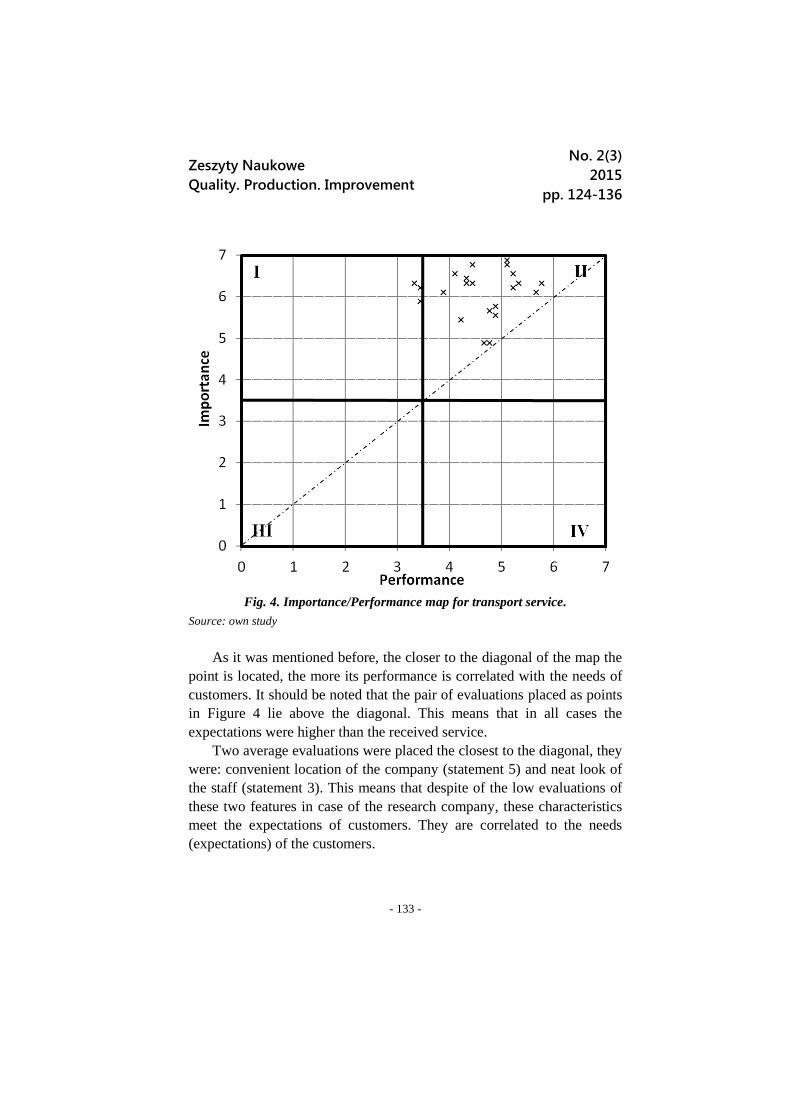
Fig. 4. Importance/Performance map for transport service.
Source: own study
As it was mentioned before, the closer to the diagonal of the map the
point is located, the more its performance is correlated with the needs of
customers. It should be noted that the pair of evaluations placed as points
in Figure 4 lie above the diagonal. This means that in all cases the
expectations were higher than the received service.
Two average evaluations were placed the closest to the diagonal, they
were: convenient location of the company (statement 5) and neat look of
the staff (statement 3). This means that despite of the low evaluations of
these two features in case of the research company, these characteristics
meet the expectations of customers. They are correlated to the needs
(expectations) of the customers.

Zeszyty Naukowe
Quality. Production. Improvement
No. 2(3)
2015
pp. 124-136
- 134 -
Most of the points (pairs of evaluations) were placed in Quadrant II
labelled as “Keep up the good work”, notated as High Importance/High
Performance. This means that the characteristics of transport services
offered by the research company are in the area of reasonable property of
needs.
The research company should not be worried too much about the
level of its services despite the large differences between the expectations
of customers' towards to transport service and its actual performance. Of
course it can think about correction in the fields where the differences
were high but it is not quickly required.
4. Summary
In the chapter the analysis of the transport services offered by the
company from southern Poland was conducted. For this purpose the
Importance/Performance analysis was used. The conducted research
revealed that the quality of the transport service was placed in Quadrant
II: High Importance/High Performance. This means that the improvement
of the quality by raising the level of implementation of individual
statements of the transport services is not necessary.
The research showed that the validity of the use of
Importance/Performance analysis. The research with use of Servqual
method presented in paper (INGALDI M., WYWIAL S. 2015) showed that
many of the features of the transport service (statements contained in the
questionnaire) need to be improved, as noted major difference between
customer expectations and the perceptions of the transport service
delivered by research company. However, the use of
Importance/Performance analysis showed that indeed, efforts to improve
the relationship between these expectation and perception can be
improved. But from the point of view of the quality of research transport
services, it is not quite as necessary as it may seem.
Perhaps it is worth to consider whether conducting research with use
of the Servqual method, the same time not to use additionally
Zeszyty Naukowe
Quality. Production. Improvement
No. 2(3)
2015
pp. 124-136
- 135 -
Importance/Performance analysis. The data used in Servqual method can
be analyzed with use of the Importance/Performance analysis. What is
important, this analysis can show whether the changes are really
necessary, and the method Servqual will show what changes should apply
at first.
Bibliography
1. DZIUBA S.T., SZOŁTYSEK K., KOZYRA C. 2011. Application of FAM - Fail
Assessment Method - to optimization of unit costs of producing flours for .
special purposes. [In:] Improvement of Production Process. Ed. Borkowski
S., Krynke M., Publisher TRIPSOFT, Trnava, pp.28-39.
2. INGALDI M. 2013. The implementation of the Servqual method in the courier
services company. International Journal Transport & Logistics, Issue 26,
volume 13.
3. INGALDI M., JURSOVA S. 2013. Wykorzystanie metody Servqual do badania
satysfakcji klientów punktu obsługi indywidualnego klienta dystrybucji gazu.
Rynek Energii, No 4 (107), pp. 43-47.
4. INGALDI M., WYWIAL S. 2015. Ocena jakości usług przewozowych z
wykorzystaniem metody Servqual. [In:] XXIII Międzynarodowa Konferencja
Naukowo-Techniczna "Produkcja i Zarządzanie W Przemyśle" Zakopane, 1
- 3.07.2015 – article in press.
5. LESTYÁNSZKA ŠKŮRKOVÁ K., INGALDI M. 2014. Recycling process of the
aluminium cans as an example of the renewable material sources.
Advanced. Materials Research. Vol. 1001, pp 103-108.
6. MARTILLA J.A., JAMES J.C. 1977. Importance – Performance Analysis.
Journal of Marketing. January, pp. 77-79.
7. RADKOWSKI K. 2005. Metody i techniki badan jakości w sferze usług. [In:]
Rynkowe mechanizmy kształtowania jakości. Wyd. URz. Rzeszów.
8. STOMA M. 2012. Modele i metody pomiaru jakości usług. Q&R Polska Sp. z
o.o., Lublin.
9. URBANIAK A. M. 2013. Zastosowanie metody SERVQUAL do oceny jakości
usług rekreacyjnych. Zeszyty Naukowe Uczelni Vistula. Poznań.

Zeszyty Naukowe
Quality. Production. Improvement
No. 2(3)
2015
pp. 124-136
- 136 -
10. WONG M.S., HIDEKI N., GEORGE P. 2011. The Use of Importance-
Performance Analysis (IPA) in Evaluating Japan's E-government Services.
Journal of Theoretical and Applied Electronic Commerce Research. Vol. 6,
Issue 2, August, pp. 17-30.