The use of GPS and compass loggers to reconstruct high ... · Stefano Focardi ISPRA - Italy Jacopo...
20
Photos by Bruno D’Amicis Stefano Focardi ISPRA - Italy Jacopo G. Cecere LIPU–BirdLife partner - Italy The use of GPS and compass loggers to reconstruct high-resolution trajectories in Cory’s shearwaters (Calonectris diomedea) to investigate search strategies We acknowledge the Ministry of Environment and LIPU-UK for funding this research and a group of enthusiastic friends who helped us in the field and during data analysis
Transcript of The use of GPS and compass loggers to reconstruct high ... · Stefano Focardi ISPRA - Italy Jacopo...

Phot
os b
y Br
uno
D’Am
icis
Stefano Focardi ISPRA - Italy
Jacopo G. Cecere LIPU–BirdLife partner - Italy
The use of GPS and compass loggers to reconstruct high-resolution trajectories in Cory’s shearwaters
(Calonectris diomedea) to investigate search strategies
We acknowledge the Ministry of Environment and LIPU-UK for funding this research and a group of enthusiastic friends who
helped us in the field and during data analysis

Arcipelago Toscano
Tremiti
Linosa
The studied colonies
The Cory’s shearwater: a “strictly” pelagic bird

Compass-loggers
Compass bearings records angles of movement with a a resolution of < 0.1° and collect data each 5 s. 1 excursion per bird during incubation and chick-rearing.

Main device used for this study. Fixes were collected each 10 min. 1 excursion per bird during incubation and chick-rearing.
GPS-loggers
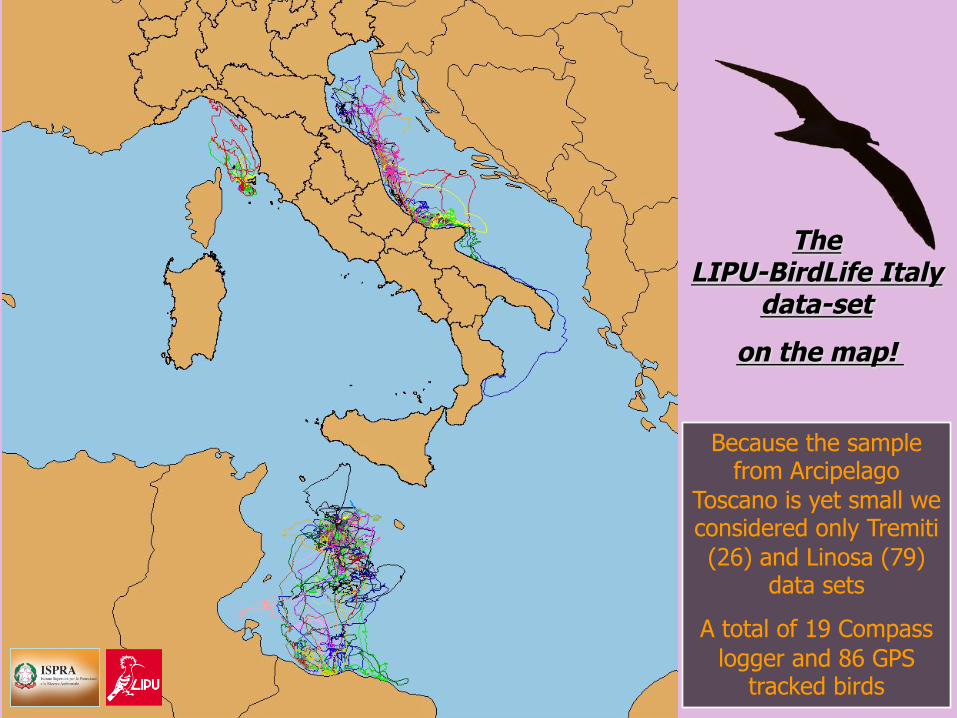
The LIPU-BirdLife Italy
data-set
on the map!
Because the sample from Arcipelago
Toscano is yet small we considered only Tremiti (26) and Linosa (79)
data sets
A total of 19 Compass logger and 86 GPS
tracked birds

Introduction
Our aim is to analyse the foraging excursions of a central place forager recorded by compass- and GPS-loggers
How can we represent an excursion?
Strong undersampling of long displacements
Classical approach: uniform sampling in time
Let us suppose this is the actual path…
This displacement is artificially divided in 4 smaller segment
Too many turning angles around 0°

Introduction
How can we represent an excursion?
Let us suppose this is the actual path…
How identify important turning points?
Which is to say: how to understand any a change of motivation?
Another approach: Sampling at turning points

Introduction
Simple correlated random walk CRW (Turchin 1998) 1
αd
Turning angles α have mean 0 and the distribution is wrapped normal or wrapped Cauchy or Mardia’s in [‒π ,π]
Diplacements, d≥0, are exponentially distributed
ρ to be estimated controls the dispersion of the angular distribution
Bayesian analysis can help but we have to formulate explicit hypotheses about search mechanisms used.
We consider 3 different models

Introduction
Bayesian analysis can help but we have to formulate explicit hypotheses about search mechanisms used.
We consider 3 different models
αd
This model predicts area-restricted search
ρ small ρ large => α near to 0
Adaptive correlated random walk (Benhamou 2007): a mixture of two different wrapped-Cauchy distributions. One (ρ large) characterises the movement among patches, the second (ρ small) the movement within patches.
2

Introduction
Within each “d” the bird performs a CRW
Reorientation exhibits a uniform α distribution; d is power-tailed distributed (Lévy walk)
d α
Intermittent movement sensu Bartumeus & Levin (2008): birds shift between two behavioral modes: reorientation and scanning. A Lévy modulated CRW
3
Bayesian analysis can help but we have to formulate explicit hypotheses about search mechanisms used.
We consider 3 different models
This model predicts area-restricted search

Introduction
We have considered the angles collected with gps- and compass-logger as a mixing of angular distributions. 3 different models:
)2)1(
))cos(21(21log( 2
2
3 παρρπρ wwF −
+−−
−=
)))cos(21(2
1log( 2
2
1 αρρπρ−−
−=F
]))cos(21(2
1)1())cos(21(2
1log[2
22
22
121
21
2 αρρπρ
αρρπρ
−−
−−+
−−
−= wwF
We used Montecarlo Markov Chains for estimating ρ and w (the fraction of a distribution)
correlated random walk
adaptive correlated random walk
Intermittent movement

Results. Hypothesis 1: how much turning angles are homogenous?
I compass loggers are characterised by a larger % of Intermittent (F3) movement tactics than GPS loggers (χ2=6.6 P=0.03)
Both methods show the presence of different movement tactics during foraging excursions of Cory’s shearwaters
GPS loggers Compass loggers
3 0 CRW
3.5% 0.0% 38 3
Adaptive CRW 44.2% 15.8%
45 16 Intermittent
52.3% 84.2% Total 86 19
Now we focus on these birds and try to see whether or not displacements are Lévy distributed

We assume that the largest angles represent turning points
Results. Hypothesis 2: How to identify turning points in intermittent movements?
Given that the MCMC analysis yields the fraction of angles derived from an uniform distribution
)ˆ1( w−
Yellow vectors have angles near 0 from wrapped Cauchy
Red vectors have large angles from an uniform distribution
Does it work? This is the problem …..

Results. Hypothesis 2: How to identify turning points in intermittent movements?
We have used simulations (with µ assigned) to check for method’s reliability:
We estimated from simulations
µ̂
µ−= addP )(A Lévy distribution reads:
µ
µµ ˆ−=bias
Bias is usually low (average 4%) and its variance decreases with excursion length

Rank frequency (survival) plot
Results. Hypothesis 3: Which kinds of movement tactics are used by Cory’s shearwaters?
Blue lines represent the Lévy walk over imposed to the actual walk (red line)
Displacements < 500 m not considered. We model the tail of this distribution
Truncation due to the fact that this birds are central place foragers and Mediterranean is small
A good linear function indicates presence of a Levy walk
Maximum likelihood analysis
Power tail AIC=1889.5
Exponential AIC=1970.8 µ = 1.57±0.06

Results. Hypothesis 3: Which kinds of movement tactics are used by Cory’s shearwaters?
Movement tactics is correlated to excursion lenght
Both adaptive correlated random walk AND Lévy modulated CRW were observed
µ=1.68±0.02
We Integrate angular and displacement analyses (from GPS sensor)

Results. Hypothesis 4: Which are the main correlates of movement tactics?
We used generalised linear models with generalised logit link & multinomial distrbution. AIC model selection
Main model uses 3 explanatory variables:
- total excursion lenght, - island (Linosa vs Tremiti) - period (incubation vs chick-rearing) DF χ2 Pr
Excursion length 1 3.73 0.0534 Island 1 4.40 0.0360 Period 1 3.84 0.0500
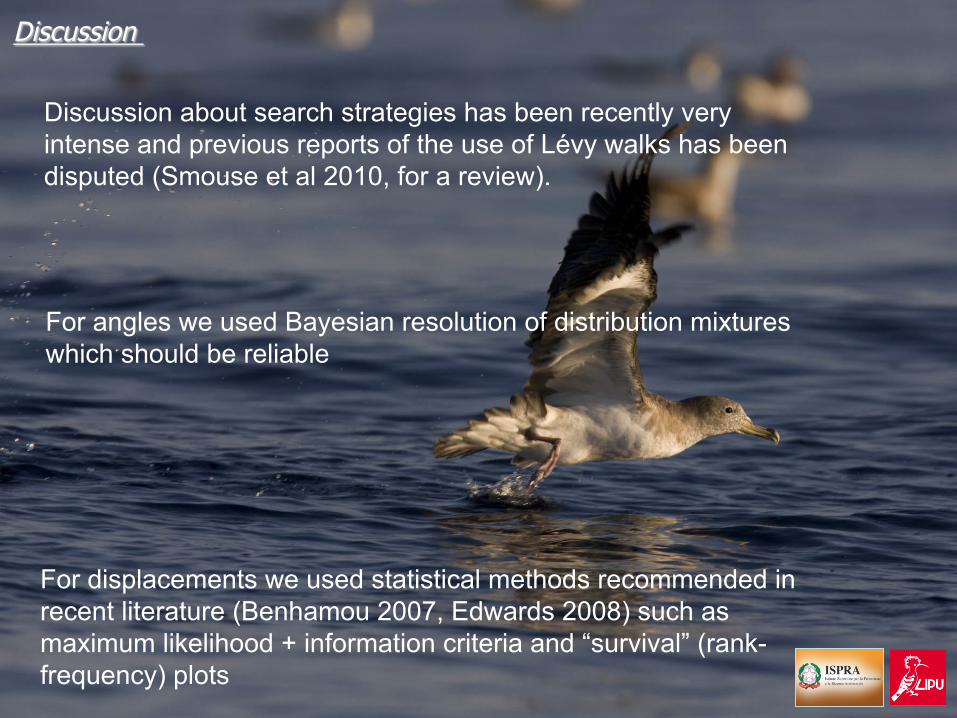
Discussion
Discussion about search strategies has been recently very intense and previous reports of the use of Lévy walks has been disputed (Smouse et al 2010, for a review).
For displacements we used statistical methods recommended in recent literature (Benhamou 2007, Edwards 2008) such as maximum likelihood + information criteria and “survival” (rank-frequency) plots
For angles we used Bayesian resolution of distribution mixtures which should be reliable

Discussion
We performed analyses both on angles and displacements: integrating results, we recognise 4 movement tactics
We showed that foraging tactics may depend on ecological factors such as excursion length, colony and reproductive period.
In future our aim is to better understand the adaptive value of these movement tactics
1) Improving analysis of covariates
2) Verify eventual difference in foraging efficiency among the observed movement tactics
3) Use of switching- and edge- Bayesian models