The Use of Financial Derivatives and Risks of U.S. Bank ... · PDF fileThe Use of Financial...
49
30 July 2014 The Use of Financial Derivatives and Risks of U.S. Bank Holding Companies* Shaofang Li** University of Ljubljana Matej Marinč*** University of Ljubljana and University of Amsterdam Abstract This article examines the impact of financial derivatives on systematic risk of publicly listed U.S. bank holding companies (BHCs) from 1997 to 2012. We find that the use of financial derivatives is positively and significantly related to BHCs’ systematic risk exposures. Higher use of interest rate derivatives, exchange rate derivatives, and credit derivatives corresponds to greater systematic interest rate risk, exchange rate risk, and credit risk. The positive relationship between derivatives and risks persists for derivatives for trading as well as for derivatives for hedging. We also analyze the role of BHCs’ size and capital and the impact of the global financial crisis on the relationship between derivatives and risks. Keywords: Financial Derivatives, Interest Rate Derivatives, Exchange Rate Derivatives, Credit Derivatives, Systematic Risk JEL codes: G20, G21, G28 ____________________________ * The authors would like to thank the editor Brian Lucey, two anonymous referees, Giuseppe Galloppo, Iftekhar Hasan, Joon Ho Hwang, Marko Košak, Igor Lončarski, Nadia Massoud, Thu Hang Nguyen, and Min-Teh Yu, and the participants at the Midwest Finance Association Conference 2013 in Chicago, the 9th Conference of Asia-Pacific Association of Derivatives (APAD2013) in Busan, the AIDEA 2013 Bicentenary conference in Lecce, and the INFINITI 2014 in Prato for their valuable comments and suggestions. All errors remain our own. ** Faculty of Economics, University of Ljubljana, Kardeljeva ploščad 17, 1000 Ljubljana, Slovenia, E-mail: [email protected]. *** Faculty of Economics, University of Ljubljana, Kardeljeva ploščad 17, 1000 Ljubljana, Slovenia, E-mail: [email protected], and Amsterdam Center for Law & Economics (ACLE), Faculty of Economics and Business, University of Amsterdam, Roetersstraat 11, 1018WB Amsterdam, Netherlands, E-mail: [email protected].
Transcript of The Use of Financial Derivatives and Risks of U.S. Bank ... · PDF fileThe Use of Financial...

30 July 2014
The Use of Financial Derivatives and Risks of U.S. Bank
Holding Companies*
Shaofang Li**
University of Ljubljana
Matej Marinč***
University of Ljubljana and University of Amsterdam
Abstract
This article examines the impact of financial derivatives on systematic risk of publicly listed U.S. bank
holding companies (BHCs) from 1997 to 2012. We find that the use of financial derivatives is positively
and significantly related to BHCs’ systematic risk exposures. Higher use of interest rate derivatives,
exchange rate derivatives, and credit derivatives corresponds to greater systematic interest rate risk,
exchange rate risk, and credit risk. The positive relationship between derivatives and risks persists for
derivatives for trading as well as for derivatives for hedging. We also analyze the role of BHCs’ size and
capital and the impact of the global financial crisis on the relationship between derivatives and risks.
Keywords: Financial Derivatives, Interest Rate Derivatives, Exchange Rate Derivatives, Credit
Derivatives, Systematic Risk
JEL codes: G20, G21, G28
____________________________
* The authors would like to thank the editor Brian Lucey, two anonymous referees, Giuseppe Galloppo, Iftekhar Hasan, Joon
Ho Hwang, Marko Košak, Igor Lončarski, Nadia Massoud, Thu Hang Nguyen, and Min-Teh Yu, and the participants at the
Midwest Finance Association Conference 2013 in Chicago, the 9th Conference of Asia-Pacific Association of Derivatives
(APAD2013) in Busan, the AIDEA 2013 Bicentenary conference in Lecce, and the INFINITI 2014 in Prato for their valuable
comments and suggestions. All errors remain our own.
** Faculty of Economics, University of Ljubljana, Kardeljeva ploščad 17, 1000 Ljubljana, Slovenia, E-mail:
*** Faculty of Economics, University of Ljubljana, Kardeljeva ploščad 17, 1000 Ljubljana, Slovenia, E-mail:
[email protected], and Amsterdam Center for Law & Economics (ACLE), Faculty of Economics and Business, University
of Amsterdam, Roetersstraat 11, 1018WB Amsterdam, Netherlands, E-mail: [email protected].

The Use of Financial Derivatives and Risks of U.S. Bank
Holding Companies
Abstract
This article examines the impact of financial derivatives on systematic risk of publicly listed U.S. bank
holding companies’ (BHCs) from 1997 to 2012. We find that the use of financial derivatives is positively
and significantly related to BHCs’ systematic risk exposures. Higher use of interest rate derivatives,
exchange rate derivatives, and credit derivatives corresponds to greater systematic interest rate risk,
exchange rate risk, and credit risk. The positive relationship between derivatives and risks persists for
derivatives for trading as well as for derivatives for hedging. We also analyze the role of BHCs’ size and
capital, and the impact of the global financial crisis on the relationship between derivatives and risks.
Keywords: Financial Derivatives, Interest Rate Derivatives, Exchange Rate Derivatives, Credit
Derivatives, Systematic Risk
JEL codes: G20, G21, G28

1
1. Introduction
Banks have drastically increased the use of financial derivatives in recent decades. The notional principal
amount of financial derivatives held by U.S. bank holding companies (BHCs) rose from less than $18
trillion at the end of 1995 to nearly $270 trillion at the end of 2012.1 Increased activity in financial
derivatives markets was generally looked upon favorably before the 2007–2010 global financial crisis.
Greenspan (1999) noted that “the value added of derivatives themselves derives from their ability to
enhance the process of wealth creation.” Trichet (2007) further explained that “[p]rice discovery in the
credit derivatives market reduces the risk of mispricing loans.” Recently, however, the perspective has
turned around because the risks of financial derivatives have become more evident. The Financial Stability
Board (2010) concluded that “the crisis demonstrated the potential for contagion arising from the
interconnectedness of OTC derivatives market participants and the limited transparency of counterparty
relationships.” The unanswered question is whether banks use financial derivatives for hedging or for
speculative purposes.
This article analyzes why BHCs use financial derivatives and, more specifically, whether financial
derivatives expose BHCs further towards more or fewer risks. In particular, we measure whether the use of
financial derivatives is related to the risk exposures of BHCs towards systematic interest rate risk, exchange
rate risk, and credit risk.
We collected on–balance-sheet and off–balance-sheet financial data and stock prices of publicly traded
U.S. BHCs from 1997 to 2012. Financial derivatives activity in the U.S. financial market is dominated by a
small group of large financial institutions (i.e., the top 25 BHCs hold 99.8% of the financial derivatives,
Office of the Comptroller of the Currency, 2012). We split our sample BHCs into large and small BHCs
(asset size more vs. less than $50 billion). Figures 1 and 2 depict the notional principal amounts of interest
rate, exchange rate, and credit derivatives held by large BHCs and small BHCs in our sample.
1 FRB of Chicago, holding company data, https://www.chicagofed.org/applications/bhc_data/bhcdata_index.cfm.

2
<Insert Figure 1 and Figure 2 here>
Our analysis shows that a BHC’s use of financial derivatives is associated with its higher exposure
towards systematic interest rate risk, exchange rate risk, and credit risk (i.e., nondiversifiable risk exposures
that investors cannot trade away on the financial markets). Interestingly, the positive relationship between
financial derivatives and systematic risk exposure seems stronger for large BHCs than for small BHCs.
These results may indicate that large BHCs with their main operations such as prime brokerage, asset
management, proprietary trading, and market making primarily use financial derivatives to derive
trading-related gains and that these activities (and the related involvement in derivatives) further expose
them to systematic risk. In comparison, the results may indicate that small BHCs (with their main
operations in deposit taking and commercial lending) employ financial derivatives to a larger extent to
hedge against systematic risk.
To further analyze what impact financial derivatives have on systematic risk exposures, we decompose
financial derivatives according to their reported purposes. Since March 1995, BHCs are required to report
whether their financial derivatives activity is for trading purposes or for purposes other than trading (i.e.,
for hedging). In Figures 3 and 4, we report the use of financial derivatives according to their reported
purposes in the subsamples of large BHCs and small BHCs.
<Insert Figure 3 and Figure 4 here>
Our findings show that derivatives held for trading and derivatives held for hedging purposes are both
positively and significantly related to BHCs’ systematic risk exposures (in the case of interest rate
derivatives, exchange rate derivatives, and credit derivatives). This result suggests that the use of financial
derivatives might not be aligned with the reported (hedging vs. trading) purposes, and that even financial
derivatives classified for hedging purposes are associated with higher rather than lower systematic risks.
We also analyze the impact of the global financial crisis on the use of financial derivatives. In the
global financial crisis, the relationship between interest rate derivatives and exchange rate derivatives and
risk exposures became stronger than in normal times, and the positive relationship between credit
derivatives and credit risk became less pronounced.
This article is organized as follows. Section 2 reviews the literature on financial derivatives and forms

3
hypotheses. Section 3 presents the data selection and provides a basic data description. Section 4 describes
the empirical methodology. Section 5 contains the main empirical findings. We analyze how the use of
financial derivatives affects BHCs’ systematic risk exposures. Section 6 concludes the article.
2. Relation to the Literature and Hypothesis Formation
2.1. Relation to the Literature
Empirical literature has been inconclusive about the relationship between financial derivatives use and the
risks of BHCs. Choi and Elyasiani (1997) find that the use of financial derivatives further exposes BHCs to
risks and that this effect is particularly pronounced for exchange rate risk. Hirtle (1997) finds evidence for
the positive relationship between interest rate derivatives and systematic interest rate risk of a BHC (see
also Choi, Elyasiani, and Kopecky (1992) and Gunther and Siems (2002)). More recently, Yong, Faff, and
Chalmers (2009) were unable to confirm any impact of financial derivatives on exchange rate risk on a
sample of Asia-Pacific banks. However, they found that interest rate derivatives activities are positively
associated with long-term interest rate risk exposure but negatively associated with short-term interest rate
exposure.
Chaudhry et al. (2000) analyze how different types of exchange rate derivatives affect BHCs’ exposure
to risks. They find that exchange rate options tend to increase risk whereas swaps are mainly used to
mitigate risk exposures. Carter and Sinkey (1998) focus on large community banks that act as end-users of
interest rate derivatives. They find that interest rate derivatives are positively associated with interest rate
risk. Cyree, Huang, and Lindley (2012) show that financial derivatives contributed neither to the increase in
bank values in times of growth nor to the depletion of bank values during the global financial crisis. Minton,
Stulz, and Williamson (2009) argue that the use of credit derivatives by banks is limited and question the
benefits of credit derivatives used for hedging purposes.
Gorton and Rosen (1995) find that banks, especially large dealer banks, use interest rate derivatives
mainly to hedge against interest rate risk. Duffee and Zhou (2001) argue that credit derivatives hedge a
bank against financial distress and that this additional flexibility allows the bank to avoid the lemon

4
problem due to bank information superiority. In a recent study, Norden, Buston, and Wagner (2011) also
find that banks use credit derivatives to improve their credit risk management. Mayordomo,
Rodriguez-Moreno, and Peña (2014) analyze the impact of financial derivatives on bank systemic risk.
Our main contribution is to disentangle systematic (i.e., undiversifiable) risk into three
components—systematic interest rate, exchange rate, and credit risk—at the same time. This allows us to
jointly analyze the impact of interest rate derivatives, exchange rate derivatives, and credit derivatives on
the corresponding systematic risks. In addition, we analyze how bank-specific characteristics (i.e., the size
and capital of a BHC), the purpose of the financial derivatives (i.e., hedging vs. trading), and the global
financial crisis impact the relationship between financial derivatives and systematic risks.
2.2. Hypothesis Formation
Broadly speaking, banks may employ financial derivatives to follow two objectives that sometimes conflict.
First, banks may use financial derivatives for hedging purposes to lower their risk exposures. Second,
banks may use financial derivatives for speculative purposes to collect revenues and fees (mostly related to
financial derivatives trading and origination), which may increase banks’ risk exposures.
According to risk management theory (Froot et al., 1993; Stulz, 1996), banks would employ hedging
strategies to lower the costs associated with costly external funding. Raising external funds may be costly
for a bank, especially in an unfavorable external environment (see Admati et al. (2012)). A bank partially
avoids a refinancing need by hedging uncontrollable risks (Froot et al., 1993), especially interest rate risk
and exchange rate risk, lowering its funding costs. In the spirit of Diamond (1984), banks use financial
derivatives to hedge against uncontrollable risks, such that they can focus on their core activity: monitoring
their borrowers. Boot and Thakor (1991) argue that banks with large off–balance-sheet activities (e.g., loan
commitments) lower their risk exposures compared to banks that lend on a spot market. Their result dwells
on the observation that a loan commitment locks a bank into the current interest rate, which mitigates the
asset substitution problem of the bank’s borrowers if the interest rates rise in the future. If the hedging
purpose of financial derivatives prevails, we anticipate that higher derivatives use is associated with lower
systematic risk exposures of a BHC.

5
However, hedging with financial derivatives also has a dark side. Morisson (2005) argues that the
informational value of a bank loan ceases to exist if banks can trade on the credit derivatives market. More
specifically, when the bank obtains credit default protection, it is no longer exposed to the borrower’s
potential default. Consequently, the bank can no longer commit to monitoring and screening its borrowers,
which increases its risk.2
Large investment banks in particular see their core business in generating and trading financial
derivatives and other innovative financial products (Boot and Marinč, 2008). Their engagement in financial
derivatives business may then be driven by profit motives rather than by hedging objectives. Banks may
use financial derivatives to expose themselves to additional systematic risk exposures and herd with other
banks (Acharya and Yorulmazer, 2008). Boot (2014) argues that information technology and related
financial innovations, such as the plethora of financial derivatives that originated in the securitization
process, have promoted market-driven behavior of banks (see also Boot and Thakor (2010) and Marinč
(2013)). Banks have become increasingly exposed to systematic risks on financial markets (and, vice-versa,
financial markets are largely affected by banks; see Fiordelisi and Marques-Ibanez (2013)). If this
speculative purpose of financial derivatives prevails, we anticipate that financial derivatives will be
associated with higher systematic risk exposures of BHCs.
To analyze whether financial derivatives are used for hedging or speculative purposes, we set up the
following first hypothesis.
H1: Financial derivatives (i.e., interest rate derivatives, exchange rate derivatives, and credit
derivatives) impact the (systematic interest rate, exchange rate, and credit) risk of a BHC.
To further analyze the relationship between financial derivatives and risk, we use the classification
from Accounting Standards SFAS 133 (Statement of Financial Accounting Standards 133, Accounting for
Derivative Instruments and Hedging Activities; FASB (1998)), which demands that banks classify
2 In addition, the adverse selection problem may also be present. A bank may want to buy credit protection against the
borrowers it perceives as most risky. This is aligned with empirical evidence from Dahiya, Puri, and Saunders (2003) that identifies
a significant negative stock price reaction for a borrower when a bank announces that the borrower’s loan is to be sold. Dewally
and Shao (2012) find that the use of financial derivatives by BHCs increases their opacity.

6
derivatives into two categories: for hedging and for trading purposes. Derivatives are classified for hedging
if they are of a certain type (i.e., if they hedge against the changes in the value or cash flows) or if they
hedge risks from specific exposures.3 In addition, the mitigating relationship between the financial
derivative and the hedged risk exposures needs to be proven. This may suggest that financial derivatives for
hedging are generally associated with lower risks of a BHC. However, SFAS 133 requires the
establishment of the hedging relationship at the level of a specific risk exposure rather than at the enterprise
level. It may happen that financial derivatives for hedging may hedge a bank against the specific risk
exposure, but increase the risk at the enterprise level. In addition, banks may strive to classify their
financial derivative holdings as financial derivatives for hedging rather than for trading due to more
favorable regulatory treatment.4 Our task is to determine whether derivatives for hedging will lower risks
at the level of a BHC.
H1a: Financial derivatives for hedging impact risks of a BHC.
In addition to hedging purposes, banks also use financial derivatives for trading purposes. Bank
derivatives for trading can typically be decomposed into proprietary derivative positions, customer-related
derivatives, and positions used for hedging purposes. Whereas proprietary trading in derivatives is
considered a profit-generating activity without an expressed hedging objective, the customer-related
derivatives and positions used for hedging also have a hedging dimension attached to them. For example,
revenues from trading derivatives come from generated fee income and stronger customer relationships. If
used for hedging purposes, financial derivatives can prevent financial distress of bank customers that buy
them (e.g., small banks and nonfinancial firms), increasing the stability of bank revenues. The direction of
relationship between derivatives for trading and a BHC’s risk is therefore ambiguous.
H1b: Financial derivatives for trading impact risks of a BHC.
3 See Ahmed, Kilic, and Lobo (2011) for further description of SFAS 133 and detailed comparison with previous accounting
standards SFAS 52 and SFAS 80, including the impact of the accounting change on the hedging effectiveness of derivatives.
4 Our analysis may relate to the scant literature on regulatory compliance. Bajo et al. (2009) find that family firms and firms
with an established corporate ethos comply with regulations more often than others. Considering that family firms are typically
small, we anticipate that smaller size of a BHC might better support regulatory compliance in classification of financial derivatives.

7
We also aim to analyze the determinants of the relationship between financial derivatives and risks.
Undercapitalized banks in particular may use financial derivatives to lower the probability of default and in
this way avoid the costs of financial distress (e.g., due to a bank run; see Bauer and Ryser (2004)). In this
view, banks would especially hedge the risks that exacerbate the costs of financial distress (see Smith and
Stulz (1985) and Stulz (2003)). Consistent with this theory, Purnanandam (2007) shows empirically that
banks closer to financial distress hedge against interest rate risk more aggressively.
Rampini and Viswanathan (2010) provide an alternative risk management theory. In their view,
financially constrained firms have little leeway in scraping together resources for current investment.5
Engaging in costly risk management practices would further exhaust their investment capabilities and more
current investment would be foregone. Rampini and Viswanathan (2010) predict that capital-constrained
firms hedge less than well-capitalized firms. In our setting, weakly-capitalized BHCs would hedge less than
well-capitalized BHCs.
H2: The relationship between financial derivatives and risks is affected by a BHC’s capital strength.
Another determinant of the relationship between derivatives and risks may be a BHC’s size. Bank
involvement in dealing and trading in financial derivatives markets requires a substantial investment in
capital, skilled employees, and good reputation, which all act as entry barriers for small banks. Tufano
(1989) analyzes financial innovations and the first-mover advantage in investment banking in light of the
substantial costs associated with the development of a new product. Hunter and Timme (1986) argue that
size and technical efficiencies allow large banks to take a lead in financial innovations. Consequently,
trading activities of financial derivatives are limited to a set of large banks, whereas smaller banks have
little chance to provide full-size risk management services and a broad range of financial derivatives
products to their clients.
Thakor (2012a) builds a theory of financial innovation in which banks offer innovative products that
are opaque to investors. Opaqueness of innovations allows for higher profit in a highly competitive banking
5 Géczy, Minton, and Schrand (1997) show that corporations use exchange rate derivatives to mitigate cash flow variations,
such that they are able to exploit profitable growth opportunities. For further determinants of corporate hedging, see Nance, Smith,
and Smithson (1993) and Mian (1996).

8
sector but at the same time gives rise to refinancing risk, potentially precipitating a financial crisis. Thakor
(2012a) predicts a positive relationship between bank opaqueness and financial innovation. Under the
assumption that larger banks are also more opaque, the empirical prediction would be that the relationship
between financial derivatives and risks is more pronounced for larger banks.
H3: The positive relationship between financial derivatives and risks intensifies for larger BHCs.
3. Data Sources, Sample Selection, and Data Description
We combine data from several sources. For financial derivatives data, we collected firm-level data from the
FR Y-9C report (Consolidated Financial Statements for Holding Companies) from 1997 to 2012.6 We use
historical BHCs’ stock prices from the Center for Research in Security Prices (CRSP) at the University of
Chicago. Macroeconomic data were obtained from the Federal Reserve Board of Governors.7 Stock price
and macroeconomic data are monthly data between 1997 and 2012. We also split BHCs into large BHCs
(whose total assets are equal to or higher than $50 billion) and small BHCs (whose total assets are less than
$50 billion).8 Table 1 presents the variables, their definitions, and sources.
<Insert Table 1 here>
Table 2 summarizes the use of financial derivatives held by BHCs in the fourth quarter of 2012.
Following Guay and Kothari (2003) and Cyree et al. (2012), we use notional principal amounts to depict a
BHC’s derivatives position. Panel A of Table 2 provides a breakdown of financial derivatives by contract
types for all U.S. BHCs included in the FR Y-9C report (column 1), the BHCs included in our sample
(column 2), and the large BHCs in our sample (column 4). In the fourth quarter of 2012, BHCs’ assets
6 These data are available at: https://www.chicagofed.org/applications/bhc_data/bhcdata_index.cfm.
7 These data are available at: http://www.federalreserve.gov/econresdata/default.htm.
8 Our decomposition is consistent with the classification of sections 165 and 166 of the Dodd–Frank Act, in which BHCs
with $50 billion or more in consolidated assets are automatically considered to be systemically important institutions (Dodd–Frank
Wall Street Reform and Consumer Protection Act and Independent Commission on Banking (2011)). See also
http://www.federalreserve.gov/newsevents/testimony/gibson20120516a.htm.

9
reached $17.6 trillion and held nearly $270 trillion of financial derivative contracts, indicating that the size
of financial derivative contracts was more than fifteen times that of the BHCs’ total assets. Interest rate
derivative contracts (including futures, forwards, swaps, and options) accounted for more than $228 trillion
and nearly 84% of the total amount of financial derivatives. Exchange rate derivative contracts and credit
derivative contracts accounted for $31.3 trillion and $10.3 trillion, respectively. Among the interest rate
derivative contracts, swaps were the largest individual derivative contract type. They accounted for more
than $155 trillion and nearly 57% of interest rate contracts. Among the exchange rate derivative contracts,
exchange rate forwards were the most important individual contract type. The value of exchange rate
forwards was $14.3 trillion, nearly 46% of all exchange rate derivative contracts. Credit default swaps
accounted for 95% of all credit derivatives held by U.S. BHCs.
<Insert Table 2 here>
Column 2 of Panel A summarizes financial derivatives data in the BHCs in our sample and compares
them to the total U.S. BHCs (column 3). The total assets of the BHCs in our sample were almost $11.9
trillion, which accounted for 68% of the total assets of total reported U.S. BHCs. The financial derivative
contracts used by the BHCs in our sample were more than $221 trillion; that is, 82% of the total amount.
This indicates that our sample BHCs are a good reflection of U.S. BHCs and the U.S. financial derivatives
market.
Column 4 of Panel A summarizes financial derivatives by the large BHCs in our sample and compares
this to the total U.S. BHCs (column 5) and to the BHCs in our sample (column 6). Large BHCs held $11.2
trillion of total assets, accounting for 64% of the total assets of all U.S. BHCs and 94% of total assets of the
BHCs in our sample. Large BHCs held more than $182 trillion of financial derivative contracts, which
accounts for 68% of the total BHCs’ financial derivative contracts and 82% of the financial derivative
contracts in our sample. This shows that large BHCs are the main participants in the U.S. financial
derivatives market.
Panel B of Table 2 presents the breakdown of financial derivatives with respect to their reported
purposes (trading vs. hedging). More than $253 trillion (out of $270 trillion held by BHCs in total) of
financial derivative contracts were held for trading, which accounts for over 94% of all financial derivative

10
contracts. The financial derivatives held for trading were mainly (i.e., 71% of them) concentrated in large
BHCs. Concentration of financial derivatives in large BHCs was less pronounced for financial derivatives
held for hedging purposes. Large BHCs held 65.6% of all financial derivatives for hedging purposes. The
implication is that the small BHCs in our sample predominantly act as end-users in the financial derivatives
market and mainly classify financial derivatives for hedging purposes.
Table 3 compares the means of on–balance-sheet and off–balance-sheet variables for the total sample
BHCs and the two subsamples (i.e., large BHCs and small BHCs) from 1997 to 2012. We report the means,
the difference in means, and t statistics based on unequal group variance. Panel A depicts the use of interest
rate derivatives. Large BHCs have a lower interest margin ratio, more loans and deposit, and more interest
rate derivatives than small BHCs. Panel B focuses on exchange rate variables. Large BHCs have more
foreign currency assets and deposits, and are more active in the exchange rate derivatives market than small
BHCs. Panel C depicts credit risk variables. Large BHCs have higher market liquidity and funding liquidity,
more loan charge-offs, and more loan provisions and non-performing loans, and they hold more credit
derivatives than small BHCs. Panel D presents control variables. Large BHCs’ total assets are thirty times
higher than those of small BHCs, they have a lower capital ratio, and they hold more financial derivatives.
<Insert Table 3 here>
Table 3 indicates that large BHCs mainly focus on trading-related activities in the financial derivatives
business, whereas small BHCs use financial derivatives products mainly for hedging purposes as end-users.
4. Empirical Methodology
The empirical analysis employs a two-stage time-series cross-section regression model to examine the
relationship between systematic risk and the use of financial derivatives. The regression proceeds in two
stages (consistent with Fama and French (1992)). In the first stage, the stock return of each BHC is
regressed against the changes in the market return, interest rate, exchange rate, and credit spread. In this
way we obtain risk betas that measure the BHC’s systematic (i.e., nondiversifiable) risk exposure towards
market risk, interest rate risk, exchange rate risk, and credit risk. In the second-stage regression, the risk

11
betas are regressed against the on–balance-sheet variables and financial derivatives variables.
First-Stage Regression: The monthly stock returns of publicly traded BHCs are used to measure
systematic exposures of each bank towards market risk, interest rate risk, exchange rate risk, and credit risk.
Such a multi-factor model has also been employed by Flannery and James (1984), Choi and Elyasiani
(1997), and Hirtle (1997). The first-stage regression is as follows:
𝑆𝑡𝑜𝑐𝑘 𝑅𝑒𝑡𝑢𝑟𝑛𝑖𝑡 = αi + βMarket,𝑖𝑡𝑀𝑎𝑟𝑘𝑒𝑡 𝑅𝑒𝑡𝑢𝑟𝑛𝑖𝑡 + βInterest,𝑖𝑡𝐼𝑛𝑡𝑒𝑟𝑒𝑠𝑡 𝑅𝑎𝑡𝑒𝑖𝑡 + βExchange,𝑖𝑡𝐸𝑥ℎ𝑐𝑎𝑛𝑔𝑒 𝑅𝑎𝑡𝑒𝑖𝑡 +
βCredit,𝑖𝑡𝐶𝑟𝑒𝑑𝑖𝑡 𝑅𝑖𝑠𝑘𝑖𝑡 + ϵ𝑖𝑡 (1)
where βMarket,𝑖𝑡, βInterest,𝑖𝑡 , βExchange,𝑖𝑡, βCredit,𝑖𝑡 are systematic risk exposures of BHC i towards
market risk, interest rate risk, exchange rate risk, and credit risk at time t, respectively; αi are constant error
terms, and εit are random error terms.
The dependent variable Stock Return is the excess rate of stock return over the risk-free rate (i.e.,
annualized rate on three-month U.S. treasury bills). The independent variable Market Return denotes the
excess rate of return on the Standard and Poor’s 500 index over the risk-free rate; Interest Rate is defined as
the rate of change in the price of the three-month U.S. treasury bill rate (i.e., (√1+r𝑡−1
1+r𝑡
4− 1)), where r is the
annualized rate on three-month U.S. treasury bills; following Francis, Hasan, and Hunter (2008), Exchange
Rate is the rate of change in the inverse of the nominal broad dollar index (i.e., (et−et−1) / et−1), where et is
the value of basket of foreign currencies against the U.S. dollar at time t,9 and Credit Risk is defined as the
change of BBB bond yield (i.e., (bt−bt−1) / bt−1), where bt is the five-year corporate BBB bond yield in the
U.S. market at time t. All data are calculated on a monthly basis.
To adjust for possible bias due to cross-equation dependencies, the regression equations for each BHC
are estimated as a simultaneous equation system, using a modified seemingly unrelated technique (SUR).
9 The nominal broad dollar index is a weighted average of the foreign exchange value of the U.S. dollar against the currencies of a
broad group of major U.S. trading partners. Weights for the broad index can be found at
http://www.federalreserve.gov/releases/H10/Weights. For more information on exchange rate indexes for the U.S. dollar, see
“Indexes of the Foreign Exchange Value of the Dollar,” Federal Reserve Bulletin, 91:1 (Winter 2005), pp. 1–8
(http://www.federalreserve.gov/pubs/bulletin/2005/winter05_index.pdf).

12
The modified SUR technique, developed by Chamberlain (1982), MaCurdy (1982), and Choi and Elyasiani
(1997), is a variation of the standard SUR method and produces asymptotically efficient estimates without
imposing either conditional homoskedasticity or serial independence restrictions on disturbance terms.10
The market model regressions are performed quarterly by using a four-year rolling window between
1997 and 2012 to estimate quarterly-varying beta coefficients for each BHC. This process results in
separate risk betas for each BHC for each quarter in the sample.11
The values of βMarket,it, βInterest,it, βExchange,it,
and βCredit,it are therefore quarterly and bank-specific data, and are treated as panel data in the second-stage
regression.
Second-Stage Regression: In the second stage, we follow Hutson and Stevenson (2009), Choi and
Jiang (2009), and Bredin and Hyde (2011), and regress betas (i.e., interest rate risk βInterest,it, exchange rate
risk βExchange,it, and credit risk βCredit,it) generated in the first stage in a panel data regression against
bank-specific on–balance-sheet and off–balance-sheet (i.e., financial derivatives) variables. To increase the
accuracy of second-stage estimation, we follow Doidge, Griffin, and Williamson (2006) and Chue and
Cook (2008) and weight each observation by the inverse of the standard errors of βInterest,it, βExchange,it, and
βCredit,it, obtained in the first stage. With this procedure, the betas that are estimated more precisely in the
first-stage regression receive a heavier weight in the second-stage regression.
The equations can be written as follows:
βInterest,𝑖𝑡 = γ𝑖 + ∑ δ𝑗X𝑗𝑖𝑡 + ∑ (η𝑗j𝑗 + μjZ𝑗𝑖𝑡)Y𝑗𝑖𝑡 + ∑ 𝜚𝑗𝑗 𝑍𝑗𝑖𝑡 + v YEAR𝑡 + ϵ𝑖𝑡 (2)
where Xjit are on–balance-sheet variables (including Interest Margin, C&I Loans, Mortgage Loans, Other
Loans, and Domestic Deposits) and three control variables (Size, Capital Ratio, and GDP Growth), and Yjit
are the notional principal amounts of interest rate derivatives used. In a slightly changed specification, Yjit
can be Interest Rate Derivatives for Trading and Interest Rate Derivatives for Hedging. Potential
10 The SUR regression has been employed in recent studies by Viale, Kolari, and Fraser (2009), Yong et al. (2009), Ammer,
Vega, and Wongswan (2010), Białkowski, Etebari, and Wisniewski (2012), and Lim, Sum, and Khun (2012).
11 A number of BHCs drop out of the sample because of mergers and failures during our sample period.
13
determinants of the relationship between financial derivatives and risks are included in Zjit and include the
crisis dummy variable Crisist, the level of regulatory capital ratio Capital Ratioit and Tier 1 Ratioit, size
variables Sizeit, and the dummy variable SIFIi, denoting a large BHC (see Table 1 for precise definition of
variables). The regression also includes the bank-specific fixed effects and yearly dummy variables to
control for macroeconomic factors that may vary over time. Standard errors (εit) are
heteroskedasticity-consistent.
βExchange,𝑖𝑡 = Ф𝑖 + ∑ ξ𝑗A𝑗𝑖𝑡 + ∑ (ς𝑗j𝑗 + ωjZ𝑗𝑖𝑡)B𝑗𝑖𝑡 + ∑ 𝜑𝑗𝑗 𝑍𝑗𝑖𝑡 + ρ YEAR𝑡 + ϵ𝑖𝑡 (3)
where Аjit are on–balance-sheet variables (including Assets in Foreign Currencies and Foreign Exchange
Deposits) and three control variables (Size, Capital Ratio, and GDP Growth) and Вjit are the notional
principal amounts of exchange rate derivatives used. In a slightly changed specification, Вjit can be
Exchange Rate Derivatives for Trading and Exchange Rate Derivatives for Hedging.
βCredit,𝑖𝑡 = ψ𝑖 + ∑ μ𝑗O𝑗𝑖𝑡 + ∑ (ν𝑗j𝑗 + τjZ𝑗𝑖𝑡)P𝑗𝑖𝑡 + ∑ 𝜅𝑗𝑗 𝑍𝑗𝑖𝑡 + σ YEAR𝑡 + ϵ𝑖𝑡 (4)
where Оjit are on–balance-sheet variables (including Market Liquidity, Funding Liquidity, Non-Performing
Loans, Loan Charge-Offs, and Loan Loss Provisions) and three control variables (Size, Capital Ratio, and
GDP Growth), and Рjit are the notional principal amounts of credit derivatives used. In a slightly changed
specification, Рjit can be Gross Credit Protection and Net Credit Protection Bought.
5. Empirical Results
5.1. First-Stage Regression Results
In the first stage, we estimate the beta coefficients of market risk, interest rate risk, exchange rate risk, and
credit risk for each BHC in each quarter in our sample.
<Insert Table 4 here>

14
Correlations between the first-stage variables are shown in Table 4. We observe from Table 4 that
excess stock returns are significantly negatively correlated with changes in bond yields but significantly
positively correlated with changes in interest rate and exchange rate. Excess stock returns are positively and
significantly correlated with excess market returns for the total sample and small BHCs, whereas the
relationship is insignificant for large BHCs.
In Table 5, we report the results of the multifactor index model based on the entire sample period for
the total sample, large BHCs, and small BHCs. The results indicate that market risk beta (βMarket) and
interest rate beta (βInterest) are statistically significant (at the 1% level on two-tailed tests) for the total sample
and for two subsamples (large BHCs and small BHCs). Exchange rate beta (βExchange) is significant at the 1%
level for the total sample and small BHCs, but for the large BHCs at a lower level (10%). Credit risk beta
(βCredit) is significant in all cases (at least at the 5% level).
<Insert Table 5 here>
Table 5 compares risk betas across large and small BHCs. Market risk beta (βMarket) is higher for large
BHCs, followed by the total sample and small BHCs. This is consistent with the popular notion that large
BHCs, acting as market makers and holding a large proportion of financial derivatives for trading purposes,
are more exposed to market risk (Standard and Poor's, 2011). In contrast, small BHCs are more sensitive to
systematic interest rate risk, exchange rate risk, and credit risk than large BHCs. Higher sensitivity to
systematic interest rate risk and credit risk is aligned with the notion that lending (and associated credit risk)
is the core business of small BHCs.
In Table 6, we focus on a subset of BHCs that started using the financial derivatives (interest rate
derivatives, exchange rate derivatives, or credit derivatives) during the sample period and compare their
risk exposures before and after the use of the financial derivatives. The BHCs are exposed to a higher level
of systematic interest rate risk, exchange rate risk, credit risk, and market risk if they start using interest
rate derivatives, exchange rate derivatives, and credit derivatives (see Table 6). The changes in systematic
risks are statistically significant in the case of interest rate derivatives and exchange rate derivatives, but
not for credit derivatives.
<Insert Table 6 here>

15
Figures 5 through 8 depict the average systematic interest rate risk, exchange rate risk, credit risk,
market risk exposures, and their 10% confidence interval for all BHCs and for large and small BHCs.
Systematic interest rate risk, credit risk, and market risk exposures of BHCs increased substantially during
the global financial crisis. Consistent with hypothesis H3, large BHCs are more exposed to higher
systematic interest rate risk, exchange rate risk, credit risk, and market risk exposures than small BHCs,
especially during the global financial crisis (see Figures 5, 6, 7, and 8). In contrast, idiosyncratic risk was
lower during the financial crisis and small BHCs are exposed to higher idiosyncratic risk than large BHCs
(see Figure 9).
<Insert Figure 5 to Figure 9 here>
Figures 10 through 12 provide the first inspection of the impact of financial derivatives (i.e., interest
rate derivatives, exchange rate derivatives, and credit derivatives) on systematic risk exposures. BHCs are
split into tertiles according to how intensively they use financial derivatives (interest rate derivatives / total
assets, exchange rate derivatives / total assets, and credit derivatives / total assets). Figure 10 shows that the
top tertile of BHCs (i.e., the BHCs with the most intensive use of interest rate derivatives) were exposed to
the highest systematic interest rate risk during the global financial crisis. Figures 11 and 12 show that the
tertile of BHCs with the highest use of exchange rate derivatives and credit derivatives were exposed to the
highest systematic exchange rate risk and credit risk exposures during the global financial crisis.
<Insert Figure 10 to Figure 12 here>
5.2. Bank-Specific Determinants of Risk Betas: Initial Analysis
We now present the second-stage regression using the fixed effects panel data regression model based on
(2), (3), and (4).12
Correlations among the variables used in the second-stage estimation are presented in
Table 7. Correlations among on–balance-sheet variables and off–balance-sheet variables related to interest
rate risk (in Panel A) are generally low, whereas the correlations among BHCs’ size and interest rate
derivatives variables (interest rate derivatives for trading, interest rate derivatives for hedging, and interest
12 The Hausman test indicates that a fixed effects model should be used rather than a random effects model.

16
rate derivatives) are higher (above 0.2). This indicates that there is no multicollinearity problem between
the on–balance-sheet variables and that a BHC’s size is an important driver of the use of interest rate
derivatives. The correlations between variables related to exchange rate risk and credit risk are presented in
Panels B and C of Table 7, respectively.
<Insert Table 7 here>
As a robustness check, we also employ an instrumental-variables estimator. We are concerned about
the potential endogeneity of the financial derivatives variables in the fixed effects model. In particular, the
changes of risk betas of BHCs may not be driven by financial derivatives alone, but also by other
unidentified variables that also affect financial derivatives. For example, BHCs may respond to the
increased exposure to trading revenues by employing more financial derivatives. To deal with this
endogeneity, we need to find valid instruments that are uncorrelated with the error term but correlated with
our dependent variable.
We account for potential endogeneity of financial derivatives variables by instrumenting them with
their one-quarter lagged terms, exposure variables from trading revenues (Interest Rate Exposures, Foreign
Exchange Exposures, and Credit Exposures), and Income Tax Rate.13
Following Baum (2006), we employ
the two-stage least squares (2SLS) estimator to obtain a consistent and efficient estimation in the presence
of non-i.i.d. errors. Using the Anderson and Rubin (1949) test of the validity of the instruments, the
hypothesis that the instruments are not valid is rejected at the 5% level for all regression models based on
(2), (3), and (4). Hansen’s J statistics, reported at the bottom of the tables, provide a test for the joint
validity of instruments. We never reject the null hypothesis that the overidentifying restrictions are correct.
In addition to this, the underidentification test (measured by the Kleibergen–Paap rk LM statistic;
(Kleibergen and Paap, 2006) and weak identification test (measured by the Cragg–Donald Wald F statistic
(Cragg and Donald, 1993), and Kleibergen–Paap Wald rk F statistic (Baum et al., 2007)) also confirm the
validity of instrumental variables.
As an additional robustness check, we use a dynamic panel-data setup to account for potential
13 Berger and Bouwman (2013) use corporate income tax rates as an instrument for the level of bank capital.

17
endogeneity of our dependent variables risk betas in (2), (3), and (4). If lagged risk beta is correlated with
the panel-level effects, the estimator may become inconsistent. We use the two-step difference generalized
method of moments (GMM) procedure of Arellano and Bond (1991) for the estimation of (2), (3), and (4),
in which the lagged levels of the regressor are instruments for the equations in first differences. The
Arellano–Bond estimator is useful for obtaining unbiased and efficient estimates in short dynamic panels
with lagged endogenous variables as an explanatory variable. Our sample has a large sample dimension and
short time dimension. We employ a robust estimator to account for potentially non-i.i.d. errors and to
obtain consistent standard error estimates even in the presence of heteroskedasticity or autocorrelation
within panels. We use one-quarter lagged risk beta variables and financial derivatives variables as
endogenous instruments and exposures variables from trading revenue (Interest Rate Exposures, Foreign
Exchange Exposures, and Credit Exposures), Income Tax Rate and all other regressors as exogenous
instruments (in line with Roodman (2009)).14
We use sets of lags (from 2 to 5) to mitigate the
overidentification problem of endogenous instruments.
Table 8 provides the regression results. Panel A in Table 8 shows that the use of Interest Rate
Derivatives is positively and significantly (at 1%) associated with systematic interest rate risk exposure for
the total sample and two subsamples. This indicates that interest rate derivatives are mainly used
speculatively rather than for a hedging purpose: they may be used for fee-generating business such as
trading. This result is consistent with previous studies (e.g., Hirtle, 1997; Reichert and Shyu, 2003; Yong et
al., 2009).
The results from Panel A show that C&I Loans, Size, and Capital Ratio are positively and significantly
associated with systematic interest rate risk for the total sample. This is consistent with previous findings
by Elyasiani and Mansur (1998, 2004), Saporoschenko (2002), Reichert and Shyu (2003), and Faff,
14 To ensure that interest rate, foreign exchange, and credit exposures are significantly related to financial derivatives and
uncorrelated with the risk betas, we have taken the following approach in Table 8. In Panel A, the interest rate derivatives are
instrumented with foreign exchange and credit exposures. In Panel B, the exchange rate derivatives are instrumented with interest
rate and credit exposures. In Panel C, the credit derivatives are instrumented with interest rate and foreign exchange exposures.

18
Hodgson, and Kremmer (2005), and indicates that especially large BHCs with higher lending activities are
exposed to higher systematic interest rate risk exposure. GAP Ratio is negatively associated with
systematic interest rate risk for the total sample and two subsamples. GDP Growth has a significant and
negative impact on systematic interest rate risk exposure for small BHCs.
<Insert Table 8 here>
Panel B in Table 8 analyzes systematic exchange rate risk of BHCs. Exchange Rate Derivatives are
positively and significantly (at 1%) associated with systematic exchange rate risk for the total sample, large
BHCs, and small BHCs. This demonstrates that BHCs are exposed to higher systematic exchange rate risk
when they use more exchange rate derivatives. In addition, the economic impact of exchange rate
derivatives on systematic exchange rate risk is more pronounced for small BHCs than for large BHCs,
indicating that the speculative purpose of exchange rate derivatives is stronger for small BHCs.
Panel B in Table 8 also shows that Foreign Exchange Deposits are positively associated with
systematic exchange rate risk exposure for the total sample and small BHCs, whereas Assets in Foreign
Currencies are negatively associated with systematic exchange rate risk exposure for large BHCs but
positively for small BHCs. The explanation may be that small BHCs are restricted by their small size and
international business, and can hardly combine foreign exchange deposit-taking with lending in the same
foreign currencies and hedge against systematic exchange rate risk exposure as large BHCs. We also see
that Size is negatively and significantly associated with systematic exchange rate risk exposure. This may
suggest that large BHCs in particular match assets in foreign currencies and foreign exchange deposits in
order to lower systematic exchange rate risk exposures.
Panel C of Table 8 depicts the systematic credit risk exposure of BHCs. The use of Credit Derivatives
is positively and significantly related to systematic credit risk exposure for the total sample, large BHCs,
and small BHCs. The relationship is stronger for large BHCs than for the total sample or small BHCs. This
may indicate that especially large BHCs use credit derivatives predominantly not to hedge but to further
expose themselves towards higher systematic credit risk exposure.
Market Liquidity is negatively and significantly (at 1%) associated with systematic credit risk exposure.
The explanation may be that liquid funds help BHCs mitigate their exposure to systematic credit risk.

19
Non-Performing Loans and Loan Charge-Offs are negatively associated with systematic credit risk
exposure. Loan Loss Provisions are positively and significantly associated with systematic credit risk
exposure. Size and GDP Growth are positively and statistically significantly (at 1%) related to systematic
credit risk exposure for the total sample and two subsamples.
In short, the use of interest rate derivatives, exchange rate derivatives, and credit derivatives is
positively and significantly related to systematic interest rate, exchange rate, and credit risk. This points to
the positive relationship between financial derivatives and risks in Hypothesis 1.
5.3. Purposes of Financial Derivatives and Systematic Risk Exposures
To further depict the relationship between risks and financial derivatives, we analyze how financial
derivatives for trading and financial derivatives for hedging affect systematic interest rate risk, exchange
rate risk, and credit risk exposures, and we analyze the impact of bank capital ratio and bank size.1516
<Insert Table 9 here>
Panel A in Table 9 shows that the positive relationship between financial derivatives and systematic
interest rate risk is more pronounced for BHCs with a higher total capital ratio and tier 1 ratio. Interest Rate
Derivatives for Trading and Interest Rate Derivatives for Hedging are both positively and significantly
related to systematic interest rate risk (column 5). For BHCs with higher Capital Ratio, Tier 1 Ratio, and
Size, the positive impact of Interest Rate Derivatives for Trading on systematic interest rate risk becomes
stronger, whereas the impact of Interest Rate Derivatives for Hedging weakens (or is insignificant).
Panel B in Table 9 shows that the positive relationship between exchange rate derivatives and
15 Bank regulatory reports separate financial derivatives (interest rate, foreign exchange, commodity, and equity derivatives)
held for trading purposes and for purposes other than trading, but do not separately report credit derivatives held for trading and for
hedging purposes. Hence, similar to Minton, Stulz, and Williamson (2009) and Hirtle (2009), we use net credit protection bought,
which is the difference between the notional principal of credit derivatives on which the bank is a beneficiary (Credit Protection
Bought) and the notional principal amount of credit derivatives on which the bank is a guarantor (Credit Protection Sold) as a
measure of the extent to which BHCs use credit derivatives to hedge credit risk.
16 We also included the dummy variable SIFI in the regression, but it was dropped from the model due to collinearity.

20
systematic exchange rate risk is more pronounced for larger BHCs. Exchange Rate Derivatives for Trading
and Exchange Rate Derivatives for Hedging are both significantly and positively related to systematic
exchange rate risk. For large BHCs and for BHC with higher Capital Ratio and Tier 1 Ratio, the positive
relationship between Exchange Rate Derivatives for Trading and systematic exchange rate risk becomes
more pronounced, whereas the positive relationship between Exchange Rate Derivatives for Hedging and
systematic exchange rate risk weakens (or the impact is insignificant).
Panel C in Table 9 shows that the positive relationship between credit derivatives and systematic credit
risk becomes more pronounced for larger BHCs and for BHCs with lower Capital Ratio and Tier 1 Ratio.
Gross Credit Protection and Net Credit Protection Bought are significantly and positively related to
systematic credit risk, but this positive relationship becomes less pronounced for BHCs with higher Capital
Ratio and Tier 1 Ratio. The positive relationship between Gross Credit Protection and systematic credit risk
weakens for larger BHCs (but with low statistical significance), whereas the positive relationship between
Net Protection Bought and systematic credit risk becomes more pronounced.
Consistent with our expectations in Hypotheses 1a and 1b, both financial derivatives for hedging and
financial derivatives for trading impact systematic risks of BHCs. We show that this relationship is positive
and highly statistically significant. This result suggests that the real impact of financial derivatives for
hedging on systematic risk exposure is inconsistent with their reported purpose.
Our empirical findings support Hypothesis 3, which states that the positive relationship between
financial derivatives and risks is stronger for larger BHCs (especially for Exchange Rate Derivatives and
Credit Derivatives). We also find empirical support for Hypothesis 2, which states that the relationship
between financial derivatives and risk is influenced by the BHC’s capital strength. The sign of the
relationship, however, changes across the types of the financial derivatives. Capital Ratio and Tier 1 Ratio
significantly strengthen the positive relationship between Interest Rate Derivatives and systematic interest
rate risk, and weaken the positive relation between Credit Derivatives and systematic credit risk. High
capital reinforces the positive relationship between financial derivatives for trading and systematic risks,
but weakens the positive relationship between financial derivatives for hedging and systematic risk. This
may indicate that weakly capitalized banks classify more derivatives as hedging derivatives to be treated
21
more favorably by the regulator, which strengthens the positive relation between financial derivatives for
hedging and systematic risk.
5.4. The Global Financial Crisis and Financial Derivatives
We now analyze the impact of the global financial crisis on the relationship between financial derivatives
and systematic risk exposures. Table 10 shows that the positive relationship between financial derivatives
and systematic risk exposures remains unchanged when we include the crisis dummy Crisis. Crisis has a
negative (but largely insignificant) impact on systematic interest rate risk, a positive and insignificant
impact on systematic exchange rate risk, and a positive and highly significant impact on systematic credit
risk. During the global financial crisis, the positive relationship between Interest Rate Derivatives and
systematic interest rate risk intensifies, whereas the positive relation between Credit Derivatives and
systematic credit risk becomes less pronounced. Crisis increases the positive relationship between financial
derivatives for hedging and systematic interest rate risk, whereas it decreases the positive relationship
between Gross Credit Protection and systematic credit risk. This provides some (but limited) evidence that
during the crisis BHCs strove to classify more financial derivatives as derivatives for hedging purposes,
which strengthens the positive relationship between derivatives for hedging and systematic risks.
<Insert Table 10 here>
5.5. The Impact of Financial Derivatives on Idiosyncratic Risk and Market Risk
We now test the impact of financial derivatives on idiosyncratic risk (Table 11) and market risk (Table 12).
Given the bounded nature of idiosyncratic risk (1 − R²), we use its logistic transformation risk (i.e.,
log (1−R2
R2 )) as the dependent variable in Table 11. Table 11 shows that larger and well-capitalized BHCs face
higher idiosyncratic risk than smaller and weakly-capitalized BHCs. The relationship between total
financial derivatives and idiosyncratic risk is negative and significant (especially for financial derivatives
for trading). The negative relationship exists between exchange rate derivatives and idiosyncratic risk.
Interest rate derivatives are negatively related to idiosyncratic risk for total BHCs and for large BHCs, but
positively for small BHCs. Credit derivatives are positively associated with idiosyncratic risk for total

22
BHCs but negatively for small BHCs.
<Insert Table 11 and Table 12 here>
Table 12 indicates that larger BHCs and BHCs with higher capital ratios are exposed to higher market
risk. The relationship between financial derivatives and market risk varies across types of financial
derivatives: Exchange Rate Derivatives are negatively and significantly related to market risk, whereas
Interest Rate Derivatives are positively related to market risk.17
6. Conclusions
We examine whether financial derivatives magnify or mitigate systematic interest rate risk, exchange
rate risk, and credit risk of publicly traded U.S. BHCs from 1997 to 2012. In the first-stage regression, we
obtain betas that measure systematic interest rate risk, exchange rate risk, and credit risk. In the second
stage, we regress risk betas generated in the first stage against financial derivatives variables.
We show that financial derivatives are positively and significantly related to systematic risk exposures
of BHCs. Higher use of interest rate derivatives, exchange rate derivatives, and credit derivatives
corresponds to greater systematic interest rate risk, exchange rate risk, and credit risk. The positive
relationship strengthens with the size of a BHC. We establish a positive relationship between trading
derivatives and risks as well as between hedging derivatives and risks.
Policy implications immediately follow. Our analysis shows that further caution is needed regarding
BHCs’ engagement in the derivatives business, giving further support for limiting the use of financial
derivatives across BHCs. Many recent regulatory attempts aim to separate commercial banking from more
risky banking activities such as engagement in proprietary trading (see the Volker rule under the Dodd–
Frank Wall Street Reform and Consumer Protection Act and Independent Commission on Banking (2011)
17 To assess the reliability of our results, we conducted several robustness checks. We used the change in the difference
between BBB bond yield and the risk-free rate in the first-stage regression as an alternative definition of Credit Risk. In addition,
we used several different instrument variables in our estimations. Our findings are qualitatively robust compared to alternative
specifications. The results are available upon request.

23
and Boot and Ratnovski (2013) for theoretic analysis). Regulators need to think how to reverse the positive
relationship between derivatives and systematic risks and at the same time preserve the efficiency of bank
risk management (see also Thakor (2012b)). In this light, regulators aim to separate financial derivatives
that are used for hedging from the ones generated in the proprietary trading business. The problem that may
occur is that it is difficult to determine when financial derivatives are used for trading purposes and when
for hedging purposes. We show that financial derivatives for hedging (and trading) purposes are associated
with higher systematic risks of BHCs. This indicates that prohibiting financial derivatives for trading may
give a false sense of safety because risks may then concentrate in financial derivatives for hedging
purposes.

24
References
Acharya, V. V., & Yorulmazer, T. (2008). Information Contagion and Bank Herding. Journal of Money,
Credit and Banking, 40(1), 215-231.
Admati, A., DeMarzo, P., Hellwig, M., & Pfleiderer, P. (2012). Debt Overhang and Capital Regulation.
Rock Center for Corporate Governance at Stanford University Working Paper No. 114, MPI Collective
Goods Preprint, No. 2012/5.
Ahmed, A. S., Kilic, E., & Lobo, G. J. (2011). Effects of SFAS 133 on the Risk Relevance of
Accounting Measures of Banks' Derivative Exposures. The Accounting Review, 86(3), 769-804.
Ammer, J., Vega, C., & Wongswan, J. (2010). International Transmission of US Monetary Policy
Shocks: Evidence from Stock Prices. Journal of Money, Credit and Banking, 42, 179-198.
Anderson, T. W., & Rubin, H. (1949). Estimation of the Parameters of a Single Equation in a
Complete System of Stochastic Equations. The Annals of Mathematical Statistics, 20(1), 46-63.
Arellano, M., & Bond, S. (1991). Some Tests of Specification for Panel Data: Monte Carlo Evidence
and an Application to Employment Equations. The Review of Economic Studies, 58(2), 277-297.
Bajo, E., Bigelli, M., Hillier, D., & Petracci, B. (2009). The Determinants of Regulatory Compliance:
An Analysis of Insider Trading Disclosures in Italy. Journal of Business Ethics, 90(3), 331-343.
Bauer, W., & Ryser, M. (2004). Risk Management Strategies for Banks. Journal of Banking &
Finance, 28(2), 331-352.
Baum, C. F. (2006). An Introduction to Modern Econometrics Using Stata: Stata Corp.
Baum, C. F., Schaffer, M. E., & Stillman, S. (2007). Enhanced Routines for Instrumental
Variables/GMM Estimation and Testing. Stata Journal, 7(4), 465-506.
Berger, A. N., & Bouwman, C. H. (2013). How Does Capital Affect Bank Performance During
Financial Crises? Journal of Financial Economics, 146(1),146-176.
Białkowski, J., Etebari, A., & Wisniewski, T. P. (2012). Fast Profits: Investor Sentiment and Stock
Returns During Ramadan. Journal of Banking & Finance, 36(3), 835-845.
Boot, A. W. A. (2014). Financial Sector in Flux. Journal of Money, Credit and Banking, 46(s1),
129-135.
Boot, A. W. A., & Marinč, M. (2008). The Evolving Landscape of Banking. Industrial and Corporate
Change, 17(6), 1173-1203.
Boot, A. W. A., & Ratnovski, L. (2013). Banking and Trading, Working Paper, April 30.
Boot, A. W. A., & Thakor, A. V. (1991). Off-Balance Sheet Liabilities, Deposit Insurance and Capital
Regulation. Journal of Banking & Finance, 15(4), 825-846.
Boot, A. W. A., & Thakor, A. V. (2010). The Accelerating Integration of Banks and Markets and Its
Implications for Regulation In Berger, A., Molyneux, P. and Wilson, J. (Eds.), The Oxford Handbook of

25
Banking (pp. 58-90): Oxford: Oxford University Press.
Bredin, D., & Hyde, S. (2011). Investigating Sources of Unanticipated Exposure in Industry Stock
Returns. Journal of Banking & Finance, 35(5), 1128-1142.
Carter, D. A., & Sinkey, J. F. (1998). The Use of Interest Rate Derivatives by End-Users: The Case of
Large Community Banks. Journal of Financial Services Research, 14(1), 17-34.
Chamberlain, G. (1982). Multivariate Regression Models for Panel Data. Journal of Econometrics,
18(1), 5-46.
Chaudhry, M., Christie-David, R., Koch, T., & Reichert, A. (2000). The Risk of Foreign Currency
Contingent Claims at US Commercial Banks. Journal of Banking & Finance, 24(9), 1399-1417.
Choi, J. J., & Elyasiani, E. (1997). Derivative Exposure and the Interest Rate and Exchange Rate
Risks of US Banks. Journal of Financial Services Research, 12(2), 267-286.
Choi, J. J., Elyasiani, E., & Kopecky, K. J. (1992). The Sensitivity of Bank Stock Returns to Market,
Interest and Exchange Rate Risks. Journal of Banking & Finance, 16(5), 983-1004.
Choi, J. J., & Jiang, C. (2009). Does Multinationality Matter? Implications of Operational Hedging for
the Exchange Risk Exposure. Journal of Banking & Finance, 33(11), 1973-1982.
Chue, T. K., & Cook, D. (2008). Emerging Market Exchange Rate Exposure. Journal of Banking &
Finance, 32(7), 1349-1362.
Cragg, J. G., & Donald, S. G. (1993). Testing Identifiability and Specification in Instrumental Variable
Models. Econometric Theory, 9(2), 222-240.
Cyree, K. B., Huang, P., & Lindley, J. T. (2012). The Economic Consequences of Banks’ Derivatives
Use in Good Times and Bad Times. Journal of Financial Services Research, 41(3), 121-144.
Dahiya, S., Puri, M., & Saunders, A. (2003). Bank Borrowers and Loan Sales: New Evidence on the
Uniqueness of Bank Loans. The Journal of Business, 76(4), 563-582.
Dewally, M., & Shao, Y. (2012). Financial Derivatives, Opacity, and Crash Risk: Evidence from Large
US Banks. Journal of Financial Stability, 9(4), 565-577
Diamond, D. (1984). Financial Intermediation and Delegated Monitoring. The Review of Economic
Studies, 51(3), 393-414.
Doidge, C., Griffin, J., & Williamson, R. (2006). Measuring the Economic Importance of Exchange
Rate Exposure. Journal of Empirical Finance, 13(4), 550-576.
Duffee, G. R., & Zhou, C. (2001). Credit Derivatives in Banking: Useful Tools for Managing Risk?
Journal of Monetary Economics, 48(1), 25-54.
Elyasiani, E., & Mansur, I. (1998). Sensitivity of the Bank Stock Returns Distribution to Changes in
the Level and Volatility of Interest Rate: A GARCH-M Model. Journal of Banking & Finance, 22(5),
535-563.
Elyasiani, E., & Mansur, I. (2004). Bank Stock Return Sensitivities to the Long-Term and Short-Term
Interest Rates: A Multivariate GARCH Approach. Managerial Finance, 30(9), 32-55.

26
Faff, R. W., Hodgson, A., & Kremmer, M. L. (2005). An Investigation of the Impact of Interest Rates
and Interest Rate Volatility on Australian Financial Sector Stock Return Distributions. Journal of Business
Finance & Accounting, 32(5‐6), 1001-1031.
Fama, E. F., & French, K. R. (1992). The Cross-Section of Expected Stock Returns. The Journal of
Finance, 47(2), 427-465.
Financial Accounting Standards Board (FASB). (1998). Accounting for Derivative Instruments and
Hedging Activities. Statement of Financial Accounting Standards No. 133. Stamford, CT: FASB.
Fiordelisi, F., & Marques-Ibanez, D. (2013). Is Bank Default Risk Systematic? Journal of Banking &
Finance, 37(6), 2000-2010.
Flannery, M., & James, C. (1984). The Effect of Interest Rate Changes on the Common Stock Returns
of Financial Institutions. The Journal of Finance, 39(4), 1141-1153.
Francis, B. B., Hasan, I., & Hunter, D. M. (2008). Can Hedging Tell the Full Story? Reconciling
Differences in United States Aggregate-and Industry-Level Exchange Rate Risk Premium. Journal of
Financial Economics, 90(2), 169-196.
Froot, K. A., Scharfstein, D. S., & Stein, J. C. (1993). Risk Managements Coordinating Corporate
Investment and Financing Policies. The Journal of Finance, 48(5), 1629-1658.
Géczy, C., Minton, B., & Schrand, C. (1997). Why Firms Use Currency Derivatives. The Journal of
Finance, 52(4), 1323-1354.
Gorton, G., & Rosen, R. (1995). Banks and Derivatives. NBER Macroeconomics Annual, 10, 299-339.
Greenspan, A. (1999). Financial Derivatives. Before the Futures Industry Association, Boca Raton,
Florida. March 19, 1999
Guay, W., & Kothari, S. P. (2003). How Much Do Firms Hedge with Derivatives? Journal of
Financial Economics, 70(3), 423-461.
Gunther, J. W., & Siems, T. F. (2002). The Likelihood and Extent of Banks' Involvement with Interest
Rate Derivatives as End Users. Research in Finance, 19, 125-142
Hirtle, B. (1997). Derivatives, Portfolio Composition, and Bank Holding Company Interest Rate Risk
Exposure. Journal of Financial Services Research, 12(2), 243-266.
Hirtle, B. (2009). Credit Derivatives and Bank Credit Supply. Journal of Financial Intermediation,
18(2), 125-150.
Hunter, W., & Timme, S. (1986). Technical Change, Organizational Form, and the Structure of Bank
Production. Journal of Money, Credit and Banking, 18(2), 152-166.
Hutson, E., & Stevenson, S. (2009). Openness, Hedging Incentives and Foreign Exchange Exposure:
A Firm-Level Multi-Country Study. Journal of International Business Studies, 41(1), 105-122.
Independent Commission on Banking. (2011). Final Report Recommendations. London.
Kleibergen, F., & Paap, R. (2006). Generalized Reduced Rank Tests Using the Singular Value

27
Decomposition. Journal of Econometrics, 133(1), 97-126.
Lim, S., Sum, V., & Khun, C. (2012). Interest Rate Sensitivity of Stock Returns: Effects across the
Maturity Profile and Direction of Interest Rate Changes. International Research Journal of Applied
Finance, 3(8), 1151-1162.
MaCurdy, T. E. (1982). The Use of Time Series Processes to Model the Error Structure of Earnings in
a Longitudinal Data Analysis. Journal of Econometrics, 18(1), 83-114.
Marinč, M. (2013). Banks and Information Technology: Marketability vs. Relationships. Electronic
Commerce Research, 13(1), 71-101.
Mayordomo, S., Rodriguez-Moreno, M., & Peña, J. I. (2014). Derivatives Holdings and Systemic Risk
in the US Banking Sector. Journal of Banking & Finance, 45, 84-104.
Mian, S. (1996). Evidence on Corporate Hedging Policy. Journal of Financial and Quantitative
Analysis, 31(03), 419-439.
Minton, B. A., Stulz, R., & Williamson, R. (2009). How Much Do Banks Use Credit Derivatives to
Hedge Loans? Journal of Financial Services Research, 35(1), 1-31.
Morrison, A. D. (2005). Credit Derivatives, Disintermediation, and Investment Decisions. The Journal
of Business, 78(2), 621-648.
Nance, D., Smith Jr, C., & Smithson, C. (1993). On the Determinants of Corporate Hedging. The
Journal of Finance, 48(1), 267-284.
Norden, L., Buston, C. S., & Wagner, W. (2011). Banks’ Use of Credit Derivatives and the Pricing of
Loans: What Is the Channel and Does It Persist under Adverse Economic Conditions. Erasmus University
Rotterdam and Tilburg University Working paper.
Office of the Comptroller of the Currency. (2012). OCC's Quarterly Report on Bank Trading and
Derivatives Activities Fourth Quarter 2012.
http://www.occ.gov/topics/capital-markets/financial-markets/trading/derivatives/dq411.pdf
Purnanandam, A. (2007). Interest Rate Derivatives at Commercial Banks: An Empirical Investigation.
Journal of Monetary Economics, 54(6), 1769-1808.
Rampini, A. A., & Viswanathan, S. (2010). Collateral, Risk Management, and the Distribution of Debt
Capacity. The Journal of Finance, 65(6), 2293-2322.
Reichert, A., & Shyu, Y. (2003). Derivative Activities and the Risk of International Banks: A Market
Index and VaR Approach. International Review of Financial Analysis, 12(5), 489-511.
Roodman, D. (2009). How to Do Xtabond2: An Introduction to Difference and System GMM in Stata.
The Stata Journal 9(1), 86-136.
Saporoschenko, A. (2002). The Sensitivity of Japanese Bank Stock Returns to Economic Factors: An
Examination of Asset/Liability Differences and Main Bank Status. Global Finance Journal, 13(2),
253-270.
Smith, C., & Stulz, R. (1985). The Determinants of Firms' Hedging Policies. Journal of Financial and
28
Quantitative Analysis, 20(4), 391-405.
Standard and Poor's. (2011). Industry Risk for Investment Banking Is Generally Higher Than for
Other Financial Institutions. January 6.
Stulz, R. M. (1996). Rethinking Risk Management. Journal of Applied Corporate Finance, 9(3), 8-25.
Stulz, R. M. (2003). Risk Management & Derivatives: Southwestern Publishing. Cincinnati, Ohio.
Thakor, A. V. (2012a). Incentives to Innovate and Financial Crises. Journal of Financial Economics,
103(1), 130-148.
Thakor, A. V. (2012b). The Economic Consequences of the Volcker Rule. Report by the US Chamber’s
Center for Capital Market Competitiveness.
The Financial Stability Board. (2010). Implementing OTC Derivatives Market Reforms: Financial
Stability Board.
Trichet, J. C. (2007). Some Reflections on the Development of Credit Derivatives. Keynote Address at
the 22nd Annual General Meeting of the International Swaps and Derivatives Association (ISDA), Boston.
Tufano, P. (1989). Financial Innovation and First-Mover Advantages. Journal of Financial Economics,
25(2), 213-240.
Viale, A. M., Kolari, J. W., & Fraser, D. R. (2009). Common Risk Factors in Bank Stocks. Journal of
Banking & Finance, 33(3), 464-472.
Yong, H. H. A., Faff, R.W., & Chalmers, K. (2009). Derivative Activities and Asia-Pacific Banks’
Interest Rate and Exchange Rate Exposures. Journal of International Financial Markets, Institutions and
Money, 19(1), 16-32.

29
Table 1 Description of Variables
Variable Definition Data Sources First-Stage Variables
Stock Return Measured by the excess rate of return of stock price over the risk-free rate Center for Research in Security Prices Market Return Measured by the excess rate of return on market portfolio S&P 500 over the risk-free rate Center for Research in Security Prices Interest Rate Measured by the percentage changes of the price of three-month U.S. treasury bills H.15, Federal Reserve Board of Governors Exchange Rate Measured by the change in the inverse of nominal broad dollar index G.5, Federal Reserve Board of Governors Credit Risk Measured by the change of five-year BBB bond yield Center for Research in Security Prices Second-Stage Variables
Interest Margin (Interest margin) / average interest earning assets FR Y-9C, BHCK4074 / earning assets) C&I Loans Commercial and industrial loans / total assets FR Y-9C, (BHCK1763 + BHCK1764) / total assets Mortgage Loans Mortgage loans / total assets FR Y-9C, (BHCK1410 + BHCK1590) / total assets Other Loans (Loans – commercial and industrial loans -- mortgage loans) / total assets FR Y-9C, (BHCK2122 − BHCK1766 − BHCK1410 − BHCK1590) / total assets Domestic Deposits Domestic deposits / total assets FR Y-9C, (BHDM6631 + BHDM6636) / total assets GAP Ratio Interest sensitive assets that are repriceable within one year or mature within one year / interest
rate-sensitive liabilities that are repriceable within one year or mature within one year
FR Y-9C, BHCK3197 / BHCK3296
Interest Rate Exposures Interest rate exposures / total assets FR Y-9C, BHCK8757 / total assets Interest Rate Derivatives for Trading Notional principal amounts of interest rate contracts for trading purposes / total assets FR Y-9C, BHCK A126 / total assets Interest Rate Derivatives for Hedging Notional principal amounts of interest rate contracts for other-than-trading purposes / total assets FR Y-9C, BHCK 8725 / total assets Interest Rate Derivatives Notional principal amounts of interest rate contracts / total assets FR Y-9C, (BHCK A126 + BHCK 8725) / total assets Assets in Foreign Currencies Assets in foreign offices / total assets FR Y-9C, (BHCK0397 + BHCK1742 + BHCK1746 + BHCK2081 + BHCK1296) / total assets Foreign Exchange Deposits Deposits denominated in foreign currencies and in foreign offices / total assets FR Y-9C, (BHFN6631 + BHFN6636) / total assets Foreign Exchange Exposures Foreign exchange exposures / total assets FR Y-9C, BHCK8758 / total assets Exchange Rate Derivatives for Trading Notional principal amounts of exchange rate contracts for trading purposes / total assets FR Y-9C, BHCK A127 / total assets Exchange Rate Derivatives for Hedging Notional principal amounts of exchange rate contracts for other-than-trading purposes / total
assets
FR Y-9C, BHCK 8726 / total assets Exchange Rate Derivatives Notional principal amounts of exchange rate contracts / total assets FR Y-9C, (BHCK A127 + BHCK 8726) / total assets Market Liquidity (Cash + securities + fed funds lent) / total assets FR Y-9C, (BHCK0081 + BHCK0395 + BHCK0397 + BHCK1754 + BHCK1773) / total assets Funding Liquidity (Federal funds sold + securities purchased under agreements) / total assets FR Y-9C, (BHDMB987 + BHCKB989) / total assets Non-Performing Loans (Total amount of loans classified as non-performing ) / total assets FR Y-9C, (BHCK5524 + BHCK5525 + BHCK5526) / total assets Loan Charge-Offs Loan charge-offs / total assets FR Y-9C, BHCK4635 / total assets Loan Loss Provisions Loan loss provisions / total assets FR Y-9C, BHCK4230 / total assets Credit Exposures Credit exposures / total assets FR Y-9C, F186 / total assets Credit Protection Sold Notional principal amounts of credit risk protection sold / total assets FR Y-9C, (BHCKC968 + BHCKC970 + BHCKC972 + BHCKC974) / total assets Credit Protection Bought Notional principal amounts of credit risk protection bought / total assets FR Y-9C, (BHCKC969 + BHCKC971 + BHCKC973 + BHCKC975) / total assets Gross Credit Protection (Credit risk protection bought + Credit risk protection sold) / 2 FR Y-9C, ((BHCKC969 + BHCKC971 + BHCKC973 + BHCKC975) / 2 + (BHCKC968 + BHCKC970 + BHCKC972 +
BHCKC974) / 2) / total assets
Net Credit Protection Bought (Credit risk protection bought − Credit risk protection sold) FR Y-9C, ((BHCKC969 + BHCKC971 + BHCKC973 + BHCKC975) − (BHCKC968 + BHCKC970 + BHCKC972 +
BHCKC974)) / total assets
Credit Derivatives (Credit risk protection bought + Credit risk protection sold) FR Y-9C, ((BHCKC969 + BHCKC971 + BHCKC973 + BHCKC975) + (BHCKC968 + BHCKC970 + BHCKC972 +
BHCKC974)) / total assets
Size log (total assets) FR Y-9C, log (BHCK2170) Capital Ratio Total risk-based capital ratio FR Y-9C, BHCK7205 Tier 1 Ratio Tier 1 capital ratio FR Y-9C, BHCK8274 / BHCK2170 GDP Growth GDP growth in each state http://www.bea.gov/regional/ Income Tax Rate Corporate income tax rates in each state; because the data before 2000 are missing, we use the
income tax rate in 2000 to measure the corporate income tax rates from 1997 to 1999
www.taxfoundation.org
Crisis Equals 1 during the financial crisis (i.e., from the third quarter of 2007 to the fourth quarter of
2010) and 0 otherwise.
SIFI Equals 1 if the asset of the BHCs is larger than or equal to $50 billion, and 0 otherwise. Total Financial Derivative Interest Rate Derivatives + Exchange Rate Derivatives + Credit Derivatives Financial Derivatives for Trading Interest Rate Derivatives for Trading + Exchange Rate Derivatives for Trading + Gross Credit
Protection
Financial Derivatives for Hedging Interest Rate Derivatives for Hedging + Exchange Rate Derivatives for Hedging + Net Credit
Protection Bought

30
Table 2 Financial Derivatives Used by U.S. BHCs (Notional principal amounts, $ billion)
U.S. BHCs Included
in FR Y-9C Report
BHCs in Our Sample Large BHCs in Our Sample
Panel A: Types of Financial Derivatives
Value Value
% of Total
Value % of Total
% of Sample
Interest Rate Contracts 1 2 3 4 5 6
Futures 5,820 3,830 65.81 3,810 65.46 99.48
Forwards 34,900 30,900 88.54 26,500 75.93 85.76
Exchange-Traded Option 3,060 2,430 79.41 2,420 79.08 99.59
OTC 5,350 4,130 77.20 3,580 66.92 86.68
Swaps 155,000 128,000 82.58 101,000 65.16 78.91
Total Interest Rate Contracts 228,000 187,000 82.02 153,000 67.11 81.82
Exchange Rate Contracts
Futures 100 91 91.00 84 84.00 92.31
Forwards 14,300 12,000 83.92 11,700 81.82 97.50
Exchange-Traded Contracts 58 47 81.66 44 76.30 93.43
OTC 5,342 4,112 76.97 3,642 68.18 88.57
Swaps 11,500 9,850 85.65 7,530 65.48 76.45
Total Exchange Rate Contracts 31,300 26,100 83.39 23,000 73.48 88.12
Credit Derivatives
Credit Default Swaps 9,840 7,790 79.17 5,910 60.06 75.87
Total Return Swaps 192 91.7 47.76 86.2 44.90 94.00
Credit Options 193 164 84.97 116 60.10 70.73
Other Credit Derivatives 105 98.6 96.19 101 93.90 97.62
Total Credit Derivatives 10,330 8,144.3 78.84 6,213.2 60.15 76.29
Total Assets 17,600 11,900 67.61 11,200 63.64 94.12
Total Financial Derivatives 269,630 221,244 82.05 182,213 67.58 82.36
Panel B: Financial Derivatives for Different Purposes
Interest Rate Contracts Held For
Trading
223,000 184,000 82.51 149,000 66.82 80.98
Interest Rate Contracts Held for
Hedging
4,110 3,270 79.56 3,250 79.08 99.29
Foreign Exchange Contracts Held For
Trading
30,400 25,500 83.88 22,400 73.68 87.84
Foreign Exchange Contracts Held for
Hedging
861 609 70.73 599 69.57 98.37
Credit Protection Sold 9,910 7,900 79.72 6,000 60.54 75.59
Credit Protection Bought 10,100 7,940 78.61 6,040 59.80 76.07
Source: The financial data is for 4th quarter 2012 from FR Y-9C.

31
Table 3 Difference in Means: Financial Characteristics of BHCs, Large BHCs, and Small BHCs
Group Means Difference in Means
Variable Total Sample Large (L) BHCs Small (S) BHCs L - S t statistic p value
Panel A: Interest Rate Variables
Interest Margin Ratio 0.021 0.019 0.022 −0.003 −9.543***
0.0000
C&I Loans 0.108 0.143 0.106 0.037 15.623***
0.0000
Mortgage Loans 0.473 0.301 0.484 −0.183 −48.421***
0.0000
Other Loans 0.074 0.147 0.069 0.078 32.690***
0.0000
Domestic Deposits 0.734 0.548 0.746 −0.198 −36.013***
0.0000
GAP Ratio 0.051 0.302 0.051 0.269 3.135***
0.0021
Interest Rate Options Bought 0.040 0.250 0.026 0.223 13.217***
0.0000
Interest Rate Options Written 0.035 0.249 0.021 0.229 13.024***
0.0000
Interest Rate Forwards & Futures 0.058 0.443 0.031 0.412 14.009***
0.0000
Interest Rate Swaps 0.219 1.956 0.101 1.855 13.187***
0.0000
Interest Rate Derivatives for Trading 0.303 2.699 0.140 2.559 12.901***
0.0000
Interest Rate Derivatives for Hedging 0.039 0.158 0.031 0.127 20.847***
0.0000
Interest Rate Derivatives 0.352 2.902 0.179 2.724 13.647***
0.0000
Panel B: Exchange Rate Variables
Assets in Foreign Currencies 0.004 0.033 0.002 0.031 15.866***
0.0000
Foreign Currency Deposits 0.010 0.070 0.005 0.065 21.162***
0.0000
Exchange Rate Options Bought 0.005 0.036 0.003 0.033 13.005***
0.0000
Exchange Rate Options Written 0.006 0.036 0.003 0.033 12.465 ***
0.0000
Exchange Rate Forwards & Futures 0.043 0.410 0.017 0.393 16.435***
0.0000
Exchange Rate Swaps 0.009 0.077 0.005 0.072 12.554***
0.0000
Spot Exchange Rate 0.005 0.037 0.002 0.035 16.087***
0.0000
Exchange Rate Derivatives for Trading 0.061 0.545 0.028 0.517 17.055***
0.0000
Exchange Rate Derivatives for Hedging 0.002 0.012 0.001 0.011 16.416***
0.0000
Exchange Rate Derivatives 0.063 0.560 0.029 0.531 17.346***
0.0000
Panel C: Credit Risk Variables
Market Liquidity 0.263 0.246 0.264 −0.018 −5.095***
0.0000
Funding Liquidity 0.014 0.027 0.013 0.014 9.4566***
0.0000
Non-Performing Loans 0.019 0.017 0.019 −0.002 −3.175***
0.0004
Loan Charge-Offs 0.003 0.004 0.003 0.001 9.497***
0.0000
Loan Loss Provisions 0.003 0.004 0.003 0.001 4.993***
0.0000
Total Return Swaps 0.0005 0.0033 0.0002 0.0003 9.497***
0.0000
Credit Option 0.0002 0.0011 0.0002 0.0010 5.593***
0.0000
Other Credit Derivatives 0.0002 0.0022 0.0001 0.0021 10.268***
0.0000
Credit Protection Sold 0.009 0.071 0.005 0.066 8.999***
0.0000
Credit Protection Bought 0.010 0.076 0.004 0.072 9.376***
0.0000
Credit Derivatives 0.019 0.147 0.010 0.137 9.210***
0.0000
Panel D: Control Variables
Total Assets ($ billion) 25.3 275 8.54 253.59 20.804***
0.0000
Capital Ratio (%) 14.08 12.77 14.17 −1.40 −9.568***
0.0000
GDP Growth (%) 1.79 1.81 1.78 0.031 0.395 0.6927
Tier 1 Ratio (%) 8.684 7.412 8.771 −1.360 −22.231***
0.0000
Income Tax Rate (%) 41.90 42.11 41.88 0.23 3.435***
0.0001
Note: *p < 0.10 **p < 0.05, ***p < 0.01.
Source: The financial data is between 1997 and 2012 and collected from the Financial Statement of FR Y-9C. The t statistics are based on unequal group variances. Variables used are described in Table 1.

32
Table 4 Correlation Coefficients between Macroeconomic Factors
This table indicates the extent of multicollinearity, if any, between the various variables used to determine the
interest rate, exchange rate, and CREDIT sensitivities for all bank holding companies (BHCs), the top group
BHCs, the median group BHCs, and the bottom BHCs in Panel A, B, C, and D, respectively. The variables are
the excess stock returns (SR), the excess market return (MKT), the changes on the price of three-month U.S.
treasury bills (IR), the change in the inverse of nominal broad dollar index (FX), and the change in the BBB bond
yield (CREDIT).
Panel A: Total Sample
SR MKT IR FX CREDIT
SR 1
MKT 0.395*** 1
IR 0.0424*** −0.178*** 1
FX 0.232*** 0.526*** −0.0633*** 1
CREDIT −0.0783*** −0.284*** 0.00590 −0.432*** 1
Panel B: Large Group
SR MKT IR FX CREDIT
SR 1
MKT 0.515*** 1
IR −0.00359 −0.176*** 1
FX 0.281*** 0.517*** −0.0617*** 1
CREDIT −0.127*** −0.281*** 0.00226 −0.428*** 1
Panel C: Small Group
SR MKT IR FX CREDIT
SR 1
MKT 0.348*** 1
IR 0.0607*** −0.179*** 1
FX 0.213*** 0.529*** −0.0639*** 1
CREDIT −0.0593*** −0.286*** 0.00733 −0.433*** 1
Note: *p < 0.10, **p < 0.05, ***p < 0.01
Sources: Various risk exposures are computed from the four-factor model using data from the Center for
Research in Security Prices (CRSP) database and Federal Reserve monthly Statistical Releases between 1997 and
2012.
Table 5 First-Stage Estimation of Risks Betas
Panel A: Regression Results
Intercept βMarket βInterest βExchange βCredit
Total Sample BHCs 0.00352*** 0.893*** 0.654*** 0.340*** 0.132***
(4.42) (44.32) (15.10) (5.35) (6.89)
Large BHCs (L) 0.00328** 1.155*** 0.504*** 0.203* 0.0759**
(2.32) (32.55) (6.58) (1.81) (2.23)
Small BHCs (S) 0.00362*** 0.788*** 0.713*** 0.400*** 0.155***
(3.79) (32.51) (13.69) (5.25) (6.70)
Group Difference (L − S) −0.00034 0.367 −0.209 −0.197 −0.0791
[p value: L = S] [0.299] [0.000***] [(0.000***) ([0.049**] [0.000***]
Panel B:Regression Statistics Total Sample BHCs Large BHCs Small BHCs
R-Square 0.173 0.273 0.142
N 14102 3982 10120
Note: The t statistics are in parentheses. *p < 0.10, **p < 0.05, ***p < 0.01. The p values for the test of equality of
coefficients for large BHCs and small BHCs are reported in brackets.
Sources: The individual computation is based on data from the Center for Research in Security Prices (CRSP) database
and Federal Reserve monthly Statistical Releases between 1997 and 2012.

33

34
Table 6 Difference between Risk Betas: Before and after Use of Financial Derivatives After Use (A) Before Use (B) Group Difference (A − B)
(p value: A = B)
Panel A: New Users of Interest Rate Derivatives βMarket 0.894*** 0.408*** 0.486***
(39.13) (20.51) [0.000] βInterest 0.623*** 0.266*** 0.357***
(14.07) (6.10) [0.000]
βExchange 0.163** 0.128* 0.035 (2.37) (1.84) [0.614]
βCredit 0.142*** −0.0743*** 0.2163*** (7.38) (−3.58) [0.000]
Panel B: New Users of Exchange Rate Derivatives βMarket 0.853*** 0.747*** 0.106*** (20.87) (22.87) [0.009]
βInterest 0.715*** 0.486*** 0.229*** (8.12) (6.75) [0.009]
βExchange 0.549*** −0.0185 0.568***
(4.08) (−0.17) [0.000] βCredit 0.196*** 0.0606* 0.1354***
(5.25) (1.78) [0.000)]
Panel C: New Users of Credit Derivatives βMarket 1.039*** 0.812*** 0.227*** (22.27) (26.68) [0.000]
βInterest 0.632*** 0.535*** 0.097
(6.74) (7.62) [0.299] βExchange 0.300** 0.0988 0.2012
(2.07) (0.96) [0.165] βCredit 0.0932** 0.0924*** 0.0008
(2.21) (2.91) [0.984] Note: The t statistics are in parentheses. *p < 0.10, **p < 0.05, ***p < 0.01. The p values for the test of equality of coefficients before and after use of financial derivatives are reported in brackets.
Source: The individual computation is based on data from the Center for Research in Security Prices (CRSP) database and Federal Reserve monthly Statistical Releases.

35
Table 7 Correlation between On– and Off–Balance-Sheet BHCs’ Specific Variables
The common variables are the natural log of total assets (Size), which was scaled by 1,000, total risk-based capital ratio (RiskRatio), GDP growth (GDP), and corporate income tax rate (CPtax) in each state. Panel A variables are the interest rate sensitivity (INT), interest margin ratio (IM), commercial & industrial loans (CIL), mortgage loans (MORT), other loans (OtherLoan), domestic deposits (DEPOSIT), one-year maturity gap (GAP), interest rate derivatives for trading (IRT), interest rate derivatives for hedging (IRH), total interest rate derivatives (IRD), and interest rate exposures (IRE). Panel B variables are the exchange
rate sensitivity (FX), assets in foreign currencies (FOA), foreign currency deposits (FXDEP), exchange rate derivatives for trading (ERT), exchange rate derivatives for hedging (ERH), total exchange rate derivatives (ERD), and exchange rate exposures (IRE). Panel C variables are credit risk sensitivity (Credit),
market liquidity (FLIQ), funding liquidity (MLIQ), loan charge-offs (LCO), loan loss provisions (LLP), non-performing loans (NPL), credit protection sold (CPS), credit protection bought (CPB), net credit protection bought (NetPB), credit derivatives (CDD), and credit exposures (CreditE).
Panel A: Interest Rate Sensitivity
INT IM CIL MORT OtherLoan DEPOSIT GAP Size RiskRatio CPTax IRT IRH IRD Crisis IRE GDPgrowth
INT 1
IM −0.00735 1
CIL −0.00660 0.0955*** 1
MORT 0.0106 0.0848*** −0.289*** 1
OtherLoan 0.0581*** 0.0504*** 0.0688*** −0.510*** 1
DEPOSIT −0.0417*** 0.188*** 0.126*** 0.417*** −0.172*** 1
GAP −0.00633 −0.0124* −0.0447*** −0.0848*** −0.00528 −0.157*** 1
Size 0.164*** −0.100*** 0.135*** −0.441*** 0.348*** −0.544*** 0.0742*** 1
RiskRatio 0.00710 −0.00702 −0.0648*** −0.116*** 0.0135* −0.118*** 0.0455*** −0.00326 1
CPTax −0.0637*** −0.0465*** −0.0953*** −0.0871*** 0.0335*** −0.122*** 0.00939 0.0350*** 0.0149* 1
IRT −0.00654 −0.0949*** −0.0350*** −0.229*** 0.0722*** −0.354*** 0.0200*** 0.390*** 0.000689 0.0202*** 1
IRH 0.0505*** −0.0023 −0.00205 −0.0490*** 0.0580*** −0.216*** 0.00364 0.263*** −0.00893 0.00762 0.0812*** 1
IRD −0.00458 −0.0943*** −0.0311*** −0.235*** 0.0792*** −0.369*** 0.0199*** 0.410*** 5.19E−05 0.0219*** 0.997*** 0.153*** 1
Crisis 0.197*** −0.101*** −0.0382*** 0.227*** −0.167*** 0.00474 6.98E−05 0.0363*** −0.00427 −0.0067 0.0159** −0.00852 0.0127* 1
IRE −0.0171* −0.0264*** 0.0151* −0.102*** 0.0296*** −0.150*** −0.00435 0.139*** 0.0287** −0.0103 0.148*** 0.0661*** 0.153*** 0.0182** 1
GDPgrowth −0.0935*** 0.102*** 0.0406*** −0.141*** 0.0787*** 0.0303*** −0.00193 −0.0048 0.00584 −0.00248 0.00275 −0.0149** 0.00491 −0.425*** −0.0267*** 1
Panel B: Exchange Rate Sensitivity
FX FOA FXDEP Size RiskRatio CPTax ERT ERH ERD Crisis ERE GDPgrowth
FX 1
FOA 0.0492*** 1
FXDEP 0.0185** 0.621*** 1
Size −0.0396*** 0.337*** 0.405*** 1
RiskRatio 0.00855 0.0541*** −0.0035 −0.00326 1
CPTax −0.0231*** 0.0662*** 0.0420*** 0.0350*** 0.0149* 1
ERT 0.0368*** 0.519*** 0.655*** 0.421*** 0.00387 0.0597*** 1
ERH 0.00286 0.190*** 0.181*** 0.211*** 0.0124 0.0462*** 0.212*** 1
ERD 0.0366*** 0.526*** 0.657*** 0.427*** 0.00453 0.0615*** 0.999*** 0.254*** 1
Crisis −0.181*** −0.0241*** −0.0331*** 0.0363*** −0.00427 −0.0067 −0.0114* −0.00212 −0.0114* 1
ERE 0.0238** 0.578*** 0.654*** 0.351*** 0.00195 0.0802*** 0.627*** 0.248*** 0.627*** −0.0224** 1
GDPgrowth 0.0588*** 0.00757 0.0208*** −0.0048 0.00584 −0.00248 0.0174** 0.000949 0.0173** −0.425*** 0.0243** 1
Panel C: Credit Risk Sensitivity
CREDIT MLIQ FLIQ NPL LCO LLP Size RiskRatio CPTax CDS CDB NetPB CDD Crisis CreditE GDPgrowth
CREDIT 1
MLIQ −0.0503*** 1
FLIQ −0.0385*** −0.0667*** 1
NPL −0.140*** −0.179*** −0.0916*** 1
LCO −0.0231*** −0.130*** −0.0670*** 0.600*** 1
LLP −0.0235*** −0.166*** −0.0664*** 0.621*** 0.909*** 1
Size 0.0858*** −0.0067 0.191*** 0.00259 0.112*** 0.0693*** 1
RiskRatio −0.0488*** 0.115*** 0.0314*** −0.0556*** −0.0382*** −0.0451*** −0.00326 1
CPTax −0.0280*** 0.127*** 0.0414*** −0.0810*** −0.0604*** −0.0684*** 0.0350*** 0.0149* 1
CDS 0.00349 −0.0677*** 0.496*** −0.0235*** 0.00363 0.00185 0.253*** 0.00543 0.00605 1
CDB 0.0198*** −0.0692*** 0.499*** −0.0243*** 0.00349 0.00127 0.260*** 0.00528 0.00735 0.997*** 1
NetPB 0.0856*** −0.0462*** 0.274*** −0.0200** 2.25E−05 −0.00571 0.198*** 0.000779 0.0175** 0.407*** 0.481*** 1
CDD −0.00655 −0.0685*** 0.498*** −0.0239*** 0.00356 0.00155 0.257*** 0.00536 0.00671 0.999*** 0.999*** 0.445*** 1
Crisis −0.0580*** −0.207*** −0.0771*** 0.336*** 0.270*** 0.341*** 0.0363*** −0.00427 −0.0067 0.0519*** 0.0518*** 0.0219*** 0.0519*** 1
CreditE −0.0503*** −0.0443*** 0.372*** −0.0427*** −0.0169* −0.0239*** 0.175*** −0.0197* 0.0321*** 0.393*** 0.398*** 0.231*** 0.396*** −0.0296*** 1
GDPgrowth −0.0385*** 0.122*** 0.0569*** −0.275*** −0.211*** −0.276*** −0.0048 0.00584 −0.00248 −0.0224*** −0.0218*** −0.00431 −0.0221*** −0.425*** 0.0353*** 1
Sources: Financial data are from FR Y-9C. Various risk exposures are computed from the four-factor model using data from the Center for Research in Security Prices (CRSP) database and Federal Reserve monthly Statistical Releases.
*p < 0.10, **p < 0.05, ***p < 0.01.

36
Table 8 Determinants of Interest Rate, Exchange Rate, and Credit Risk Betas
Total BHCs Large BHCs Small BHCs
Panel A: Interest Rate Risk Beta Interest Margin 4.542*** 0.515 −1.511 8.028** 7.069 −18.22 4.193*** −0.0947 13.92***
(6.26) (0.29) (−0.84) (1.99) (1.59) (−0.37) (5.85) (−0.05) (3.67)
C&I Loans −0.385 2.254** 1.266 12.20*** 14.28*** 0.00425 −0.800** 0.692 −2.458
(−0.99) (2.29) (1.17) (4.11) (4.32) (0.00) (−2.09) (0.72) (−1.52)
Mortgage Loans 0.129 0.694 0.289 9.000*** 9.612*** 0.305 0.0504 0.195 −0.447
(0.54) (1.10) (0.46) (3.92) (4.03) (0.47) (0.22) (0.32) (−0.89)
Other Loans −1.552*** −1.234 1.519 5.139** 5.785** 0.820 −1.657*** −3.827*** −0.412
(−3.22) (−0.98) (1.44) (2.05) (2.02) (1.17) (−3.70) (−3.19) (−0.34)
Domestic Deposits −0.861*** 1.696*** −0.0114 1.615 0.609 −0.230 −1.580*** 0.396 −0.470
(−3.34) (2.93) (−0.03) (0.95) (0.34) (−0.48) (−6.41) (0.68) (−0.88)
GAP Ratio −0.00693 −0.00453 −0.0287*** 0.00158 0.00487 −0.00194* −0.0274 −0.106** 0.229
(−1.57) (−0.93) (−4.68) (0.29) (0.83) (−1.74) (−1.16) (−2.13) (0.87)
Size 0.641*** 0.924*** 0.270 1.048** 1.220*** 0.00407 0.474*** 0.429*** 0.585***
(10.41) (5.80) (0.88) (2.58) (2.89) (0.06) (8.65) (3.07) (2.71)
Capital Ratio 0.0952 2.908*** −0.0748 4.496 3.964 −2.877 0.0417 1.220 0.146
(0.86) (3.54) (−0.09) (1.08) (0.77) (−1.41) (0.69) (1.47) (1.08)
GDP Growth −0.00625 −0.000969 0.00522 0.0261 0.0260 0.00478 −0.0117** −0.0397*** −0.00127
(−1.28) (−0.08) (0.48) (1.12) (1.07) (0.51) (−2.36) (−2.95) (−0.11)
Interest Rate Derivatives 0.116*** 0.145*** 0.361* 0.0962*** 0.111*** 0.0116* 0.157*** 0.201*** 0.233**
(4.50) (4.59) (1.75) (3.29) (3.25) (1.97) (2.99) (2.93) (2.22)
L. Interest Rate Risk Beta 0.441* 1.082*** 0.534***
(1.86) (83.44) (2.78)
N 11,795 4,348 3,837 754 706 725 11,041 3,642 3,169 R-Squared 0.199 0.136 0.473 0.471 0.191 0.0666
AR(1) 0.040 0.000 0.000
AR(2) 0.747 0.206 0.103
Hansen J Statistic
(p value)
0.429
(0.807)
5.76
(0.331)
1.59
(0.451)
2.62
(0.270)
3.165
(0.367)
9.44
(0.093)
Number of Instruments 23 26 23 23 23 26
Panel B: Exchange Rate Risk Beta Assets in Foreign Currencies −0.621 −1.794 0.304 −4.416*** −4.009*** 1.382 4.864*** 3.914*** −0.542
(−0.61) (−1.55) (0.61) (−3.74) (−3.08) (1.53) (4.88) (3.16) (−1.05)
Foreign Exchange Deposits 1.089* −0.322 −0.0216 −1.528 −2.443** 0.189 1.450** −1.463 0.393
(1.73) (−0.36) (−0.02) (−1.44) (−2.01) (0.11) (1.98) (−1.18) (0.39)
Size −0.134*** −0.278*** 0.250** 0.164 0.0959 0.129 −0.118** −0.224** 0.272**
(−2.69) (−3.59) (2.06) (1.20) (0.69) (0.31) (−2.23) (−2.45) (2.10)
Capital Ratio −0.0405 −0.359 0.224 −2.406 −2.835 0.650 −0.0499 −0.214 0.249
(−0.78) (−0.87) (0.80) (−1.15) (−1.17) (0.24) (−0.87) (−0.59) (0.87)
GDP Growth 0.0169*** 0.0167** −0.00672 0.0257 0.0188 0.0162 0.0169*** 0.0228*** −0.0124
(3.15) (2.17) (−0.91) (1.41) (0.99) (0.85) (3.04) (2.78) (−1.58)
Exchange Rate Derivatives 0.545*** 0.656*** 0.152*** 0.721*** 0.857*** 0.102* 0.791*** 0.921*** 0.134***
(6.31) (5.69) (4.95) (6.84) (5.95) (1.81) (5.29) (4.15) (4.61)
L. Exchange Rate Risk Beta 0.991*** 1.557*** 0.984***
(10.68) (4.08) (10.42)
N 11,803 4,349 3,835 759 711 682 11,044 3,638 3,153 R-Squared 0.165 0.205 0.404 0.404 0.160 0.193
AR(1) 0.000 0.036 0.000
AR(2) 0.476 0.131 0.541
Hansen J Statistic
(p value)
4.97
(0.147)
1.75
(0.626)
0.120
(0.942)
2.70
(0.746)
4.503
(0.105)
1.99
(0.737)
Number of Instruments 19 20 19 22 19 21
Panel C: Credit Risk Beta Market Liquidity −0.511*** −0.440*** −0.0904 −0.253 −0.438* −0.274 −0.518*** −0.463*** 0.118
(−9.38) (−5.48) (−1.21) (−1.11) (−1.95) (−0.05) (−9.23) (−5.53) (1.11)
Funding Liquidity −0.388*** −0.661*** 0.0333 −1.562*** −1.601*** 13.63** −0.346** −0.545*** −0.0266
(−2.94) (−4.02) (0.32) (−3.59) (−3.76) (2.13) (−2.48) (−3.02) (−0.21)
Non-Performing Loans −4.717*** −3.149*** −0.510 −11.42*** −12.54*** −39.86 −4.269*** −1.574*** 0.231
(−11.39) (−6.25) (−1.56) (−7.45) (−8.51) (−0.07) (−10.17) (−3.23) (0.75)
Loan Charge-Offs −5.922*** −4.519* −0.267 −17.73*** −23.53*** −41.32 −3.878* −0.766 0.148
(−2.68) (−1.94) (−0.26) (−3.13) (−5.16) (−1.22) (−1.65) (−0.33) (0.12)
Loan Loss Provisions 6.488*** 4.983** 0.334 12.56*** 16.66*** 80.43** 5.592*** 2.595 2.839**
(3.19) (2.21) (0.31) (2.70) (3.91) (2.82) (2.60) (1.15) (2.35)
Size 0.0496*** −0.00236 −0.0175 0.207*** 0.277*** −0.388 0.0658*** 0.0267 0.00513
(2.83) (−0.09) (−0.58) (4.14) (5.99) (−0.72) (3.60) (0.93) (0.11)
Capital Ratio −0.00646 −0.0208 0.126** 2.162*** 1.720** −33.13* −0.00130 0.0688 0.0879
(−0.69) (−0.24) (2.05) (3.03) (2.16) (−1.82) (−0.11) (0.78) (1.00)
GDP Growth 0.00617*** 0.00612** 0.00575** 0.0161** 0.0164** −0.0677 0.00520*** 0.00439 0.00694*
(3.40) (2.23) (2.04) (2.41) (2.54) (−1.63) (2.80) (1.52) (1.67)
Credit Derivatives 0.0761*** 0.0738*** 0.0264** 0.103*** 0.0960*** 0.995*** 0.0708* 0.101 0.0466***
(4.73) (4.35) (2.51) (5.88) (5.77) (3.65) (1.76) (1.41) (3.32)
L. Credit Risk Beta −0.683*** 0.0664 0.901***
(−7.34) (0.19) (7.31)
N 10,984 4,114 3,655 697 667 646 10,287 3,447 3,009 R-Squared 0.163 0.218 0.594 0.620 0.149 0.168
AR(1) 0.000 0.002 0.000
AR(2) 0.785 0.480 0.127
Hansen J Statistic
(p value)
1.166
(0.558)
1.94
(0.585)
0.171
(0.679)
6.91
(0.960)
3.365
(0.339)
3.34
(0.342)
Number of Instruments 21 22 21 34 21 22
Estimation Method FE IV GMM FE IV GMM FE IV GMM
Note: The dependent variable in each panel is our estimates of risk beta of each BHC i at start time t of the four-year rolling window regression in the first stage. We weight each
observation by the inverse of the standard error of beta coefficients in the first-stage estimation. The regressions included bank-specific fixed effects and yearly dummy variables.
Heteroskedasticity-consistent standard errors are used and t statistics are reported in parentheses. *p < 0.10, **p < 0.05, ***p < 0.01.
Sources: Financial data are from FR Y-9C. Risk betas are computed from the four-factor model using data from the Center for Research in Security Prices (CRSP) database and
Federal Reserve monthly Statistical Releases.

37

38
Table 9 Determinants of Interest Rate, Exchange Rate and Credit Risk Betas, and Interaction Terms
Panel A: Interest Rate Risk Beta 1 2 3 4 5 6 7 8 9
Interest Margin 4.426**
*
2.876*** 4.546*** 4.529*** 4.433*** 4.313*** 2.876*** 4.378*** 4.409*** (6.10) (4.71) (6.26) (6.24) (6.12) (5.93) (4.73) (6.04) (6.09)
C&I Loans −0.371 0.194 −0.396 −0.365 −0.333 −0.321 0.266 −0.325 −0.361 (−0.95) (0.73) (−1.02) (−0.94) (−0.86) (−0.82) (1.01) (−0.84) (−0.93) Mortgage Loans 0.155 −0.434*** 0.133 0.132 0.162 0.188 −0.444*** 0.208 0.163 (0.66) (−2.66) (0.56) (0.56) (0.69) (0.80) (−2.74) (0.88) (0.70) Other Loans −1.617*
**
−0.651** −1.581**
*
−1.554*** −1.465*** −1.543*** −0.565* −1.494*** −1.349*** (−3.36) (−2.13) (−3.29) (−3.23) (−3.05) (−3.24) (−1.88) (−3.11) (−2.84)
Domestic Deposits −0.860*
**
−0.530*** −0.901*** −0.842*** −0.747*** −0.750*** −0.485*** −0.822*** −0.743***
(−3.34) (−2.84) (−3.49) (−3.28) (−2.92) (−2.91) (−2.63) (−3.21) (−2.91)
GAP Ratio −0.0071
7
−0.00745* −0.00702 −0.00694 −0.00604 −0.00644 −0.00607 −0.00518 −0.00773*
(−1.62) (−1.67) (−1.59) (−1.57) (−1.37) (−1.45) (−1.36) (−1.16) (−1.71)
Size 0.633**
*
0.422*** 0.627*** 0.645*** 0.665*** 0.657*** 0.426*** 0.637*** 0.664***
(10.36) (11.25) (10.24) (10.54) (10.90) (10.68) (11.53) (10.53) (10.89)
Capital Ratio 0.0842 0.0932 0.0958 0.1000 0.0880 0.0966 0.102
(0.83) (0.85) (0.86) (0.86) (0.84) (0.86) (0.86)
Tier1 Ratio 1.466*** 1.835***
(2.62) (3.45)
GDP Growth −0.0055
8
−0.0139**
*
−0.00630 −0.00643 −0.00652 −0.00589 −0.0128**
*
−0.00649 −0.00613
(−1.14) (−3.50) (−1.29) (−1.32) (−1.34) (−1.21) (−3.24) (−1.33) (−1.26)
Interest Rate Derivatives −0.142*
*
−0.0910**
*
−0.162 0.169***
(−2.38) (−2.68) (−0.77) (3.05)
Capital Ratio * Interest Rate Derivatives 2.122**
*
(4.37)
Tier1 Ratio * Interest Rate Derivatives 2.778***
(4.23)
Size * Interest Rate Derivatives 0.0133
(1.32)
SIFI * Interest Rate Derivatives −0.0583
(−0.94)
Interest Rate Derivatives for Trading 0.101*** −0.145** −0.111*** −0.718*** −0.0908**
* (4.15) (−2.41) (−3.23) (−3.80) (−2.70)
Interest Rate Derivatives for Hedging 0.475*** 0.0688 1.123*** −1.609 0.563***
(4.87) (0.13) (3.34) (−1.25) (6.07)
Capital Ratio * Interest Rate Derivatives for Trading 2.029***
(4.09)
Capital Ratio * Interest Rate Derivatives for Hedging 3.009
(0.78)
Tier1 Ratio * Interest Rate Derivatives for Trading 2.861***
(4.15)
Tier1 Ratio * Interest Rate Derivatives for Hedging −7.456*
(−1.92)
Size * Interest Rate Derivatives for Trading 0.0389***
(4.19)
Size * Interest Rate Derivatives for Hedging 0.127
(1.58)
SIFI * Interest Rate Derivatives for Trading 0.203***
(4.66)
SIFI * Interest Rate Derivatives for Hedging −0.843*
(−1.95)
N 11,795 15,042 11,795 11,795 11,799 11,799 15,046 11,799 11,799 R-Squared 0.201 0.191 0.199 0.199 0.200 0.202 0.193 0.201 0.201
Panel B: Exchange Rate Risk Beta Assets in Foreign Currencies −0.658 −0.495 −0.617 −0.747 −0.686 −2.136* −1.622 −0.850 −1.011
(−0.64) (−0.48) (−0.61) (−0.72) (−0.66) (−1.89) (−1.51) (−0.80) (−0.94)
Foreign Exchange Deposits 1.210** 1.083* 1.614*** 1.230* 1.201* 1.473** 1.397** 1.782*** 1.303**
(1.97) (1.73) (2.63) (1.95) (1.92) (2.46) (2.29) (2.91) (2.08)
Size −0.136*
**
−0.143*** −0.150*** −0.132*** −0.140*** −0.143*** −0.157*** −0.159*** −0.141***
(−2.74) (−2.75) (−2.99) (−2.65) (−2.80) (−2.88) (−3.01) (−3.17) (−2.83)
Capital Ratio −0.0438 −0.0458 −0.0406 −0.0416 −0.0440 −0.0477 −0.0421
(−0.81) (−0.83) (−0.78) (−0.79) (−0.82) (−0.84) (−0.79)
Tier1 Ratio −0.420 −0.640
(−0.88) (−1.30)
GDP Growth 0.0168*
**
0.0168*** 0.0167*** 0.0169*** 0.0168*** 0.0165*** 0.0169*** 0.0166*** 0.0168***
(3.13) (3.14) (3.13) (3.17) (3.15) (3.08) (3.14) (3.11) (3.14)
Exchange Rate Derivatives 0.381**
*
0.472*** −1.697** 0.796***
(2.60) (3.33) (−2.36) (5.47)
Capital Ratio * Exchange Rate Derivatives 1.012
(1.35)
Tier1 Ratio * Exchange Rate Derivatives 1.052
(0.64)
Size * Exchange Rate Derivatives 0.115***
(3.15)
SIFI * Exchange Rate Derivatives −0.307*
(−1.79)
Exchange Rate Derivatives for Trading 0.501*** 0.248* 0.328** −1.717** 0.672***
(5.66) (1.75) (2.43) (−2.13) (4.42)
Exchange Rate Derivatives for Hedging 2.316*** 11.41*** 8.873*** −13.31 2.073***
(4.67) (3.78) (5.18) (−0.94) (4.44)
Capital Ratio * ExchangeRate Derivatives for Trading 1.335*
(1.83)
CapitalRatio * Exchange RateDerivatives for Hedging −49.39***
(−3.56)
Tier1 Ratio * Exchange Rate Derivatives for Trading 2.096
(1.32)
Tier1 Ratio * Exchange Rate Derivatives for Hedging −91.64***
(−4.25)
Size * Exchange Rate Derivatives for Trading 0.112***
(2.71)

39
Size * Exchange Rate Derivatives for Hedging 0.929
(1.09)
SIFI * Exchange Rate Derivatives for Trading −0.261
(−1.44)
SIFI * Exchange Rate Derivatives for Hedging 5.902*
(1.79)
N 11,803 11,802 11,803 11,803 11,803 11,803 11,802 11,803 11,803 R-Squared 0.165 0.165 0.165 0.165 0.165 0.167 0.167 0.166 0.166
Panel C: Credit Risk Beta Market Liquidity −0.503*
**
−0.507*** −0.393*** −0.511*** −0.512*** −0.503*** −0.505*** −0.507*** −0.511***
(−9.23) (−9.31) (−6.37) (−9.37) (−9.39) (−9.23) (−9.28) (−9.29) (−9.38)
Funding Liquidity −0.393*
**
−0.397*** −0.139 −0.389*** −0.389*** −0.412*** −0.411*** −0.384*** −0.389***
(−2.98) (−3.01) (−1.01) (−2.94) (−2.94) (−3.13) (−3.11) (−2.90) (−2.94)
Non-Performing Loans −4.694*
**
−4.679*** −4.416*** −4.716*** −4.712*** −4.689*** −4.659*** −4.706*** −4.709***
(−11.35) (−11.26) (−8.03) (−11.39) (−11.38) (−11.33) (−11.22) (−11.38) (−11.37)
Loan Charge-Offs −5.644*
*
−5.713** −3.515 −5.920*** −5.918*** −5.593** −5.475** −5.861*** −5.905***
(−2.56) (−2.56) (−1.32) (−2.68) (−2.68) (−2.54) (−2.46) (−2.65) (−2.68)
Loan Loss Provisions 6.249**
*
6.299*** 4.552* 6.485*** 6.490*** 6.203*** 6.011*** 6.388*** 6.470***
(3.07) (3.07) (1.88) (3.19) (3.19) (3.05) (2.93) (3.13) (3.18)
Size 0.0501*
**
0.0444** 0.103*** 0.0495*** 0.0495*** 0.0476*** 0.0453** 0.0517*** 0.0496***
(2.86) (2.41) (5.38) (2.83) (2.83) (2.71) (2.47) (2.94) (2.83)
Capital Ratio −0.0052
7
−0.0104 −0.00646 −0.00646 −0.00483 −0.00573 −0.00640
(−0.54) (−1.25) (−0.69) (−0.69) (−0.49) (−0.60) (−0.68)
Tier1 Ratio −0.211 −0.196
(−1.36) (−1.28)
GDP Growth 0.00615
***
0.00628*** 0.00453** 0.00617*** 0.00614*** 0.00601*** 0.00617*** 0.00617*** 0.00615***
(3.39) (3.46) (2.36) (3.40) (3.38) (3.32) (3.40) (3.40) (3.39)
Credit Derivatives 0.511**
*
0.371*** 0.0599*** 0.0702*
(6.12) (4.60) (3.83) (1.73)
Capital Ratio * Credit Derivatives −3.116*
**
(−5.01)
Tier1 Ratio * Credit Derivatives −4.753***
(−3.73)
Size * Credit Derivatives 0.0329***
(10.66)
SIFI * Credit Derivatives 0.00645
(0.15)
Gross Credit Protection 0.0704*** 0.333*** 0.168* 1.540* 0.0739
(4.26) (3.72) (1.69) (1.76) (1.42)
Net Credit Protection Bought 0.337** 11.09*** 11.52*** −16.35*** −0.133
(2.12) (4.23) (4.05) (−2.64) (−0.11)
Capital Ratio * Gross Credit Protection −1.655**
(−2.41)
Capital Ratio * Net Credit Protection Bought −89.72***
(−4.12)
Tier1 Ratio * Gross Credit Protection −1.563
(−1.00)
Tier1 Ratio * Net Credit Protection Bought −185.7***
(−3.96)
Size * Gross Credit Protection −0.0693*
(−1.69)
Size * Net Credit Protection Bought 0.791***
(2.71)
SIFI * Gross Credit Protection −0.00292
(−0.05)
SIFI * Net Credit Protection Bought 0.486
(0.40)
N 10,984 10,983 9,720 10,984 10,984 10,984 10,983 10,984 10,984 R-Squared 0.164 0.164 0.185 0.163 0.163 0.165 0.165 0.163 0.163
Estimation Method FE FE FE FE FE FE FE FE FE
Note: The dependent variable in each panel is our estimates of risk beta of each BHC i at start time t of the four-year rolling window regression in the first stage. We weight each observation by the inverse of the
standard error of beta coefficients in the first-stage estimation. The regressions included bank-specific fixed effects and yearly dummy variables. Heteroskedasticity-consistent standard errors are used and t statistics
are reported in parentheses. *p < 0.10,
**p < 0.05,
***p < 0.01.
Sources: Financial data are from FR Y-9C. Risk betas are computed from the four-factor model using data from the Center for Research in Security Prices (CRSP) database and Federal Reserve monthly Statistical
Releases.

40
Table 10 Impact of Finanical Crisis on the Determinants of Interest Rate, Exchange Rate, and Credit Risk Betas
1 2 3 4
Panel A: Interest Rate Risk Beta
Interest Margin 4.660*** 4.658*** 4.526*** 4.449*** (6.04) (6.03) (5.87) (5.81) C&I Loans −0.380 −0.393 −0.329 −0.420 (−0.98) (−1.01) (−0.85) (−1.09) Mortgage Loans 0.130 0.142 0.163 0.334 (0.55) (0.60) (0.69) (1.42) Other Loans −1.546*** −1.543*** −1.461*** −1.319*** (−3.21) (−3.20) (−3.04) (−2.80) Domestic Deposits −0.869*** −0.887*** −0.755*** −0.745*** (−3.36) (−3.43) (−2.93) (−2.90) GAP Ratio −0.00694 −0.00699 −0.00605 −0.00466 (−1.57) (−1.58) (−1.37) (−1.05) Size 0.641*** 0.631*** 0.665*** 0.636*** (10.41) (10.28) (10.90) (10.78) Capital Ratio 0.0954 0.0934 0.100 0.101 (0.86) (0.86) (0.87) (0.94) GDP Growth −0.00624 −0.00599 −0.00651 −0.00510 (−1.28) (−1.23) (−1.34) (−1.05) Interest Rate Derivatives 0.116*** 0.103***
(4.50) (4.00)
Crisis −0.0218 −0.0279 −0.0172 −0.118*** (−0.74) (−0.95) (−0.59) (−3.56) Crisis * Interest Rate Derivatives
0.0191*
(1.65)
Interest Rate Derivatives for Trading
0.101*** 0.0827***
(4.15) (3.48) Interest Rate Derivatives for Hedging
0.474*** 0.463***
(4.87) (4.98) Crisis * Interest Rate Derivatives for Trading
0.0146
(1.50) Crisis * Interest Rate Derivatives for Hedging
3.029***
(5.38) N 11,795 11,795 11,799 11,799 R-Squared 0.199 0.199 0.200 0.209 Panel B: Exchange Rate Risk Beta
Assets in Foreign Currencies −0.616 −0.562 −0.681 −0.546 (−0.61) (−0.54) (−0.66) (−0.52) Foreign Exchange Deposits 1.094* 1.130* 1.206* 1.284** (1.74) (1.80) (1.93) (2.06) Size −0.136*** −0.139*** −0.142*** −0.146*** (−2.73) (−2.79) (−2.84) (−2.92) Capital Ratio −0.0418 −0.0432 −0.0429 −0.0450
(−0.82) (−0.83) (−0.82) (−0.84) GDP Growth 0.0169*** 0.0168*** 0.0168*** 0.0167*** (3.15) (3.14) (3.15) (3.12) Exchange Rate Derivatives 0.545*** 0.516***
(6.30) (5.82)
Crisis 0.0455 0.0434 0.0483 0.0478 (1.18) (1.12) (1.25) (1.23) Crisis * Exchange Rate Derivatives
0.0385
(1.06)
Exchange Rate Derivatives for Trading
0.500*** 0.467***
(5.65) (5.14)
Exchange Rate Derivatives for Hedging 2.330*** 2.374***
(4.72) (4.75)
Crisis * Exchange Rate Derivatives for Trading 0.0581
(1.48)
Crisis * Exchange Rate Derivatives for Hedging
−2.288
(−1.26)
N 11,803 11,803 11,803 11,803 R-Squared 0.165 0.165 0.165 0.165
Panel C: Credit Risk Beta
Market Liquidity −0.506*** −0.506*** −0.507*** −0.507*** (−9.29) (−9.29) (−9.30) (−9.31) Funding Liquidity −0.367*** −0.373*** −0.367*** −0.375*** (−2.77) (−2.82) (−2.77) (−2.83) Non-Performing Loans −4.747*** −4.747*** −4.742*** −4.741*** (−11.45) (−11.45) (−11.44) (−11.43) Loan Charge-Offs −5.977*** −5.999*** −5.972*** −6.003*** (−2.71) (−2.72) (−2.71) (−2.72) Loan Loss Provisions 6.401*** 6.438*** 6.403*** 6.451*** (3.15) (3.16) (3.15) (3.17) Size 0.0482*** 0.0482*** 0.0481*** 0.0481*** (2.75) (2.75) (2.75) (2.75) Capital Ratio −0.00750 −0.00732 −0.00750 −0.00732
(−0.79) (−0.76) (−0.79) (−0.76) GDP Growth 0.00615*** 0.00607*** 0.00612*** 0.00601*** (3.39) (3.35) (3.37) (3.32) Credit Derivatives 0.0756*** 0.121***
(4.70) (6.08)
Crisis 0.0353*** 0.0364*** 0.0353*** 0.0371*** (3.17) (3.27) (3.18) (3.33) Crisis * Credit Derivatives
−0.0499***
(−3.83)
Gross Credit Protection
0.0699*** 0.117***
(4.22) (5.90) Net Credit Protection Bought
0.338** 0.584**
(2.12) (2.37) Crisis * Gross Credit Protection
−0.0482***
(−3.67) Crisis * Net Credit Protection Bought
−0.392
(−1.18) N 10,984 10,984 10,984 10,984 R-Squared 0.163 0.164 0.163 0.164 Estimation Method FE FE FE FE Note: The dependent variable in each panel is our estimates of risk beta of each BHC i at start time t of the four-year rolling window regression in the first stage. We weight each observation by the
inverse of the standard error of beta coefficients in the first-stage estimation. The regressions included bank-specific fixed effects and yearly dummy variables. Heteroskedasticity-consistent
standard errors are used and t statistics are reported in parentheses. *p < 0.10, **p < 0.05, ***p < 0.01.
Sources: Financial data are from FR Y-9C. Risk betas are computed from the four-factor model using data from the Center for Research in Security Prices (CRSP) database and Federal Reserve
monthly Statistical Releases.

41
Table 11 Impact of Financial Derivatives on Scaled Idiosyncratic Risk (1 − R²)
Total BHCs Large BHCs Small BHCs
Variable
Idiosyncratic Risk
Size 0.227*** 0.423*** 0.232*** 0.232*** 0.426*** 0.488*** 0.470*** 0.202*** 0.428*** 0.208***
(6.51) (8.29) (6.63) (6.63) (4.43) (4.91) (5.18) (5.51) (7.29) (5.63)
Capital Ratio −0.0579** 0.518** −0.0576** −0.0575** 2.797** 2.289 4.040*** −0.0678** 0.513** −0.0722**
(−2.44) (2.15) (−2.43) (−2.42) (2.33) (1.62) (3.20) (−2.42) (1.98) (−2.36)
GDP Growth 0.000744 0.0143** 0.000905 0.000911 0.0356** 0.0245* 0.0379*** −0.00337 0.00681 −0.00307
(0.19) (2.55) (0.24) (0.24) (2.45) (1.76) (2.61) (−0.85) (1.14) (−0.77)
Interest Rate Derivatives −0.0363*** −0.0358***
−0.0302*** −0.0317***
0.0483* 0.0659*
(−4.43) (−3.81) (−4.50) (−4.21) (1.94) (1.92)
Exchange Rate Derivatives
−0.368*** −0.441***
−0.316*** −0.375***
−1.027*** −0.975***
(−6.33) (−7.07) (−6.72) (−6.74) (−4.71) (−4.69)
Credit Derivatives
0.0857* 0.0265 −0.00177 0.00331 −0.319** −0.615**
(1.82) (0.52) (−0.04) (0.07) (−2.22) (−2.33)
Total Financial Derivatives −0.0393***
(−5.22)
Financial Derivatives for
Trading
−0.0394***
−0.0367***
−0.0519**
(−5.18) (−5.86) (−2.39)
Financial Derivatives for
Hedging
−0.0312
−0.223***
0.00721
(−0.73) (−2.91) (0.15)
N 11,888 4,374 11,888 11,888 757 709 757 11,131 3,670 11,131
R-Squared 0.281 0.421 0.279 0.279 0.591 0.616 0.577 0.269 0.401 0.266
Hansen J Statistic
(p value)
2.40
(0.301) 4.98 (0.09)
3.83
(0.147)
Number of Instruments 18 18 18
Estimation Method FE IV FE FE FE IV FE FE IV FE
Note: The dependent variable in each panel is the logistic transformation of 1 − R², which is log (1 − R
R ). We weight each observation by the inverse of the standard error of beta coefficients in
the first-stage estimation. The regressions included bank-specific fixed effects and yearly dummy variables. Heteroskedasticity-consistent standard errors are used and t statistics are reported in
parentheses. *p < 0.10, **p < 0.05, ***p < 0.01.
Sources: Financial data are from FR Y-9C. Risk betas are computed based on the four-factor model using data from the Center for Research in Security Prices (CRSP) database and Federal
Reserve monthly Statistical Releases.
Table 12 Impact of Financial Derivatives on Market Risk Beta
Total Sample Large BHCs Small BHCs
Variable
Market Risk Beta
Size
0.308*** 0.350*** 0.345*** 0.384*** 0.288*** 0.303***
(13.83) (10.24) (4.03) (4.03) (12.51) (8.19)
Capital Ratio 0.0594 0.596*** 3.610*** 2.429 0.0418 0.408**
(1.13) (3.41) (2.81) (1.53) (1.15) (2.41)
GDP Growth 0.00554** 0.00246 0.0235* 0.0180 0.00203 −0.00673*
(2.30) (0.61) (1.89) (1.45) (0.85) (−1.75)
Interest Rate Derivatives 0.0415*** 0.0454*** 0.0557*** 0.0607*** 0.00450 −0.0142
(5.02) (5.19) (7.08) (7.06) (0.24) (−0.51)
Exchange Rate Derivatives
−0.452*** −0.523*** −0.596*** −0.683*** −0.513*** −0.434***
(−11.25) (−10.50) (−12.90) (−10.61) (−3.97) (−3.20)
Credit Derivatives
0.0134 −0.0253 −0.149*** −0.151** −0.0776* −0.175
(0.25) (−0.45) (−2.62) (−2.51) (−1.80) (−1.63)
N 11,888 4,379 757 722 11,131 3,670
R-Squared 0.429 0.511 0.655 0.663 0.415 0.481
Hansen J Statistic
(p value)
3.08
(0.215)
2.124
(0.145)
2.323
(0.313)
Number of Instruments 18 18 18
Estimation Method FE IV FE IV FE IV
Note: The dependent variable in each panel is our estimates of risk beta of each BHC i at start time t of the four-year rolling window regression in the first stage. We weight each observation by the
inverse of the standard error of beta coefficients in the first-stage estimation. The regressions included bank-specific fixed effects and yearly dummy variables. Heteroskedasticity-consistent
standard errors are used and t statistics are reported in parentheses. *p < 0.10, **p < 0.05, ***p < 0.01.
Sources: Financial data are from FR Y-9C. Risk betas are computed based on the four-factor model using data from the Center for Research in Security Prices (CRSP) database and Federal Reserve
monthly Statistical Releases.
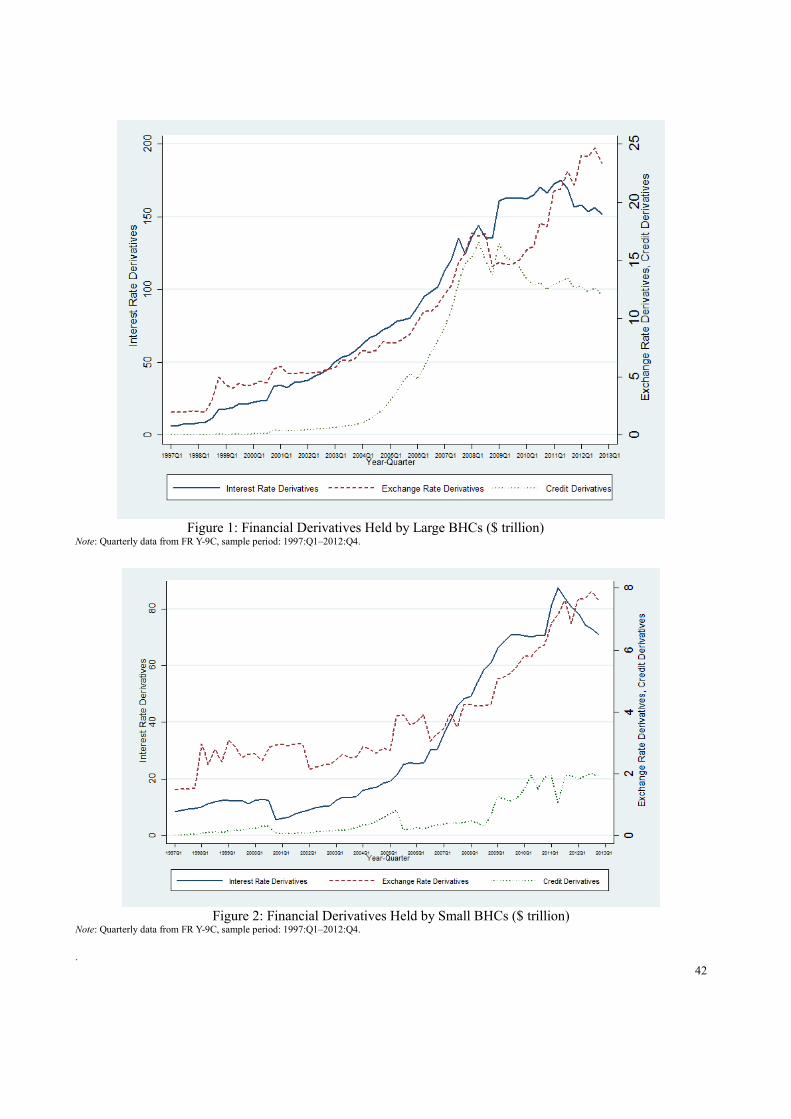
42
Figure 1: Financial Derivatives Held by Large BHCs ($ trillion) Note: Quarterly data from FR Y-9C, sample period: 1997:Q1–2012:Q4.
Figure 2: Financial Derivatives Held by Small BHCs ($ trillion) Note: Quarterly data from FR Y-9C, sample period: 1997:Q1–2012:Q4.
.

43
Figure 3: Financial Derivatives Held for Trading Purposes ($ trillion) Note: Quarterly data from FR Y-9C, sample period: 1997:Q1–2012:Q4.
Figure 4: Financial Derivatives Held for Hedging Purposes ($ trillion) Note: Quarterly data from FR Y-9C, sample period: 1997:Q1–2012:Q4.

44
Figure 5: Interest Rate Risk Sensitivity for Three Separate Sample Groups Note: Quarterly data. Interest rate risk sensitivity is calculated at the midpoint of the four-year rolling window, sample period: 1999:Q1–2012:Q4.
Figure 6: Exchange Rate Risk Sensitivity for Three Separate Sample Groups
Note: Quarterly data. Exchange rate risk sensitivity is calculated at the midpoint of the four-year rolling window, sample period: 1999:Q1–2012:Q4.
-50
51
01
5
1999Q1 2001Q1 2003Q1 2005Q1 2007Q1 2009Q1 2011Q1 1999Q1 2001Q1 2003Q1 2005Q1 2007Q1 2009Q1 2011Q1 1999Q1 2001Q1 2003Q1 2005Q1 2007Q1 2009Q1 2011Q1
Total BHCs Large BHCs Small BHCs
90% Confidence Interval Interest Rate Risk Beta
Year-Quarter
Graphs by group
-4-2
02
4
1999Q1 2001Q1 2003Q1 2005Q1 2007Q1 2009Q1 2011Q1 1999Q1 2001Q1 2003Q1 2005Q1 2007Q1 2009Q1 2011Q1 1999Q1 2001Q1 2003Q1 2005Q1 2007Q1 2009Q1 2011Q1
Total BHCs Large BHCs Small BHCs
90% Confidence Interval Exchange Rate Risk Beta
Year-Quarter
Graphs by group
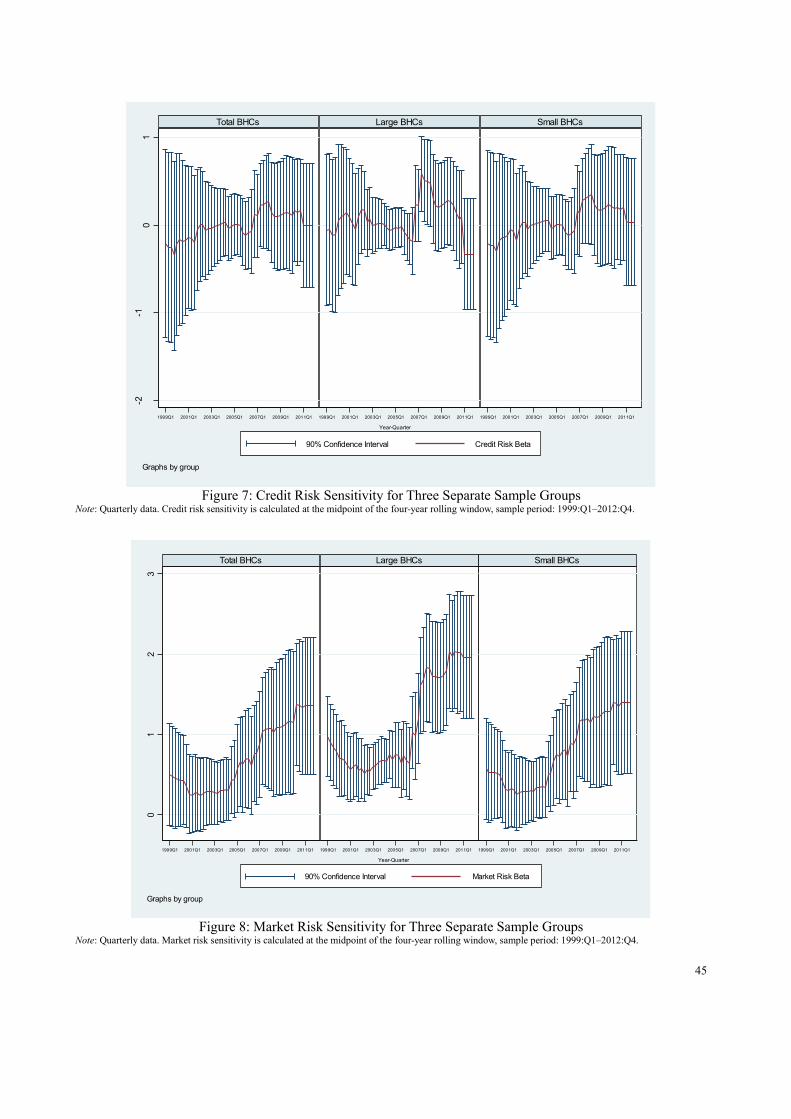
45
Figure 7: Credit Risk Sensitivity for Three Separate Sample Groups Note: Quarterly data. Credit risk sensitivity is calculated at the midpoint of the four-year rolling window, sample period: 1999:Q1–2012:Q4.
Figure 8: Market Risk Sensitivity for Three Separate Sample Groups Note: Quarterly data. Market risk sensitivity is calculated at the midpoint of the four-year rolling window, sample period: 1999:Q1–2012:Q4.
-2-1
01
1999Q1 2001Q1 2003Q1 2005Q1 2007Q1 2009Q1 2011Q1 1999Q1 2001Q1 2003Q1 2005Q1 2007Q1 2009Q1 2011Q1 1999Q1 2001Q1 2003Q1 2005Q1 2007Q1 2009Q1 2011Q1
Total BHCs Large BHCs Small BHCs
90% Confidence Interval Credit Risk Beta
Year-Quarter
Graphs by group
01
23
1999Q1 2001Q1 2003Q1 2005Q1 2007Q1 2009Q1 2011Q1 1999Q1 2001Q1 2003Q1 2005Q1 2007Q1 2009Q1 2011Q1 1999Q1 2001Q1 2003Q1 2005Q1 2007Q1 2009Q1 2011Q1
Total BHCs Large BHCs Small BHCs
90% Confidence Interval Market Risk Beta
Year-Quarter
Graphs by group

46
Figure 9: Idiosyncratic Risk (1 − R²) Sensitivity for Three Separate Sample Groups Note: Quarterly data. Idiosyncratic Risk (1 − R²) sensitivity is calculated at the midpoint of the four-year rolling window, sample period: 1999:Q1–2012:Q4.
Figure 10: Interest Rate Risk Sensitivity by Different Sizes of BHCs (by Interest Rate Derivatives / Total Assets) Note: Quarterly data. Interest rate risk sensitivity is calculated at the midpoint of the four-year rolling window, sample period: 1999:Q1–2012:Q4.
.5.6
.7.8
.9
1999Q1 2000Q1 2001Q1 2002Q1 2003Q1 2004Q1 2005Q1 2006Q1 2007Q1 2008Q1 2009Q1 2010Q1 2011Q1
Year-Quarter
Total BHCs Larger BHCs Small BHCs
-10
12
34
1999Q1 2000Q1 2001Q1 2002Q1 2003Q1 2004Q1 2005Q1 2006Q1 2007Q1 2008Q1 2009Q1 2010Q1 2011Q1Year-Quarter
Bottom Tertile Medium Tertile Top Tertile

47
Figure 11: Exchange Rate Risk Sensitivity by Different Sizes of BHCs (by Exchange Rate Derivatives / Total
Assets) Note: Quarterly data. Exchange rate risk sensitivity is calculated at the midpoint of the four-year rolling window, sample period: 1999:Q1–2012:Q4.
Figure 12: Credit Risk Sensitivity by Different Sizes of BHCs (by Credit Derivatives / Total Assets) Note: Quarterly data. Credit risk sensitivity is calculated at the midpoint of the four-year rolling window, sample period: 1999:Q1–2012:Q4.
-2-1
01
2
1999Q1 2000Q1 2001Q1 2002Q1 2003Q1 2004Q1 2005Q1 2006Q1 2007Q1 2008Q1 2009Q1 2010Q1 2011Q1Year-Quarter
Bottom Tertile Medium Tertile Top Tertile
-.5
0.5
1
1999Q1 2000Q1 2001Q1 2002Q1 2003Q1 2004Q1 2005Q1 2006Q1 2007Q1 2008Q1 2009Q1 2010Q1 2011Q1Year-Quarter
Bottom Tertile Medium Tertile Top Tertile