Simple Fingerprint Door Access - Fingerprint | Card Access ...
NUMBER 174 MARCH 2017
Newsletter for the Association of Applied Geochemists
continued on page 5
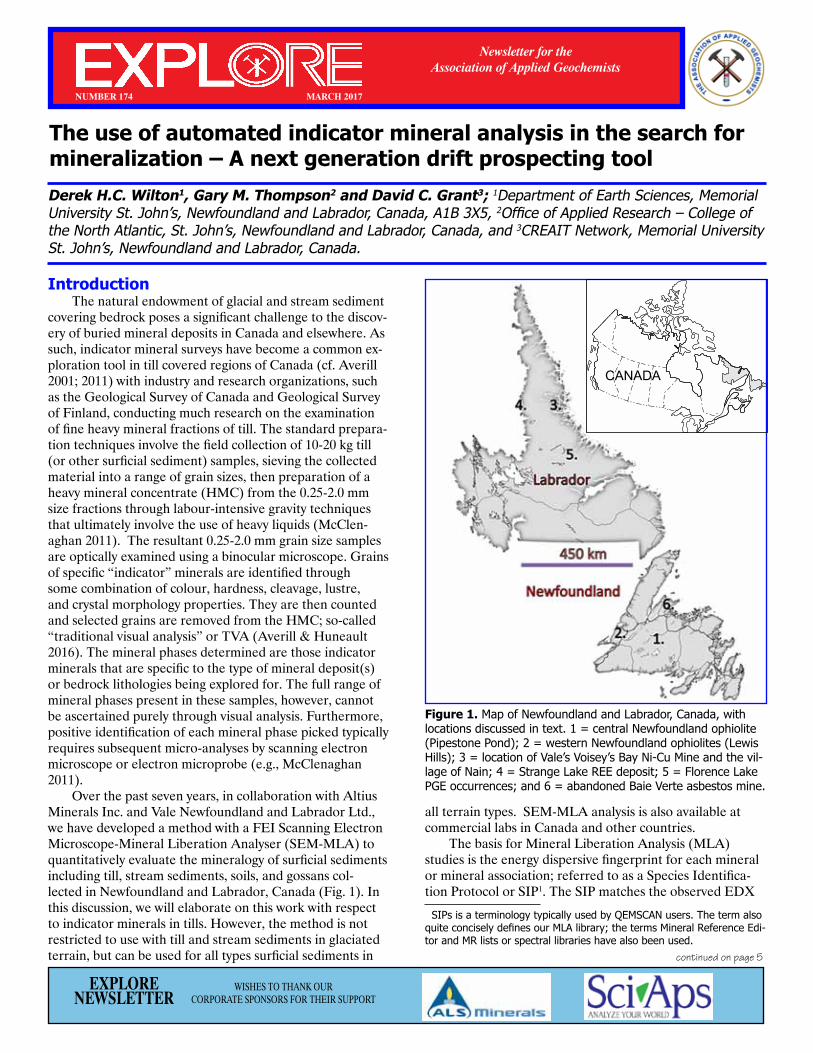
The use of automated indicator mineral analysis in the search for mineralization – A next generation drift prospecting tool
EXPLORE NEWSLETTER
WISHES TO THANK OUR CORPORATE SPONSORS FOR THEIR SUPPORT
Introduction The natural endowment of glacial and stream sediment covering bedrock poses a significant challenge to the discov-ery of buried mineral deposits in Canada and elsewhere. As such, indicator mineral surveys have become a common ex-ploration tool in till covered regions of Canada (cf. Averill 2001; 2011) with industry and research organizations, such as the Geological Survey of Canada and Geological Survey of Finland, conducting much research on the examination of fine heavy mineral fractions of till. The standard prepara-tion techniques involve the field collection of 10-20 kg till (or other surficial sediment) samples, sieving the collected material into a range of grain sizes, then preparation of a heavy mineral concentrate (HMC) from the 0.25-2.0 mm size fractions through labour-intensive gravity techniques that ultimately involve the use of heavy liquids (McClen-aghan 2011). The resultant 0.25-2.0 mm grain size samples are optically examined using a binocular microscope. Grains of specific “indicator” minerals are identified through some combination of colour, hardness, cleavage, lustre, and crystal morphology properties. They are then counted and selected grains are removed from the HMC; so-called “traditional visual analysis” or TVA (Averill & Huneault 2016). The mineral phases determined are those indicator minerals that are specific to the type of mineral deposit(s) or bedrock lithologies being explored for. The full range of mineral phases present in these samples, however, cannot be ascertained purely through visual analysis. Furthermore, positive identification of each mineral phase picked typically requires subsequent micro-analyses by scanning electron microscope or electron microprobe (e.g., McClenaghan 2011). Over the past seven years, in collaboration with Altius Minerals Inc. and Vale Newfoundland and Labrador Ltd., we have developed a method with a FEI Scanning Electron Microscope-Mineral Liberation Analyser (SEM-MLA) to quantitatively evaluate the mineralogy of surficial sediments including till, stream sediments, soils, and gossans col-lected in Newfoundland and Labrador, Canada (Fig. 1). In this discussion, we will elaborate on this work with respect to indicator minerals in tills. However, the method is not restricted to use with till and stream sediments in glaciated terrain, but can be used for all types surficial sediments in
Derek H.C. Wilton1, Gary M. Thompson2 and David C. Grant3; 1Department of Earth Sciences, Memorial University St. John’s, Newfoundland and Labrador, Canada, A1B 3X5, 2Office of Applied Research – College of the North Atlantic, St. John’s, Newfoundland and Labrador, Canada, and 3CREAIT Network, Memorial University St. John’s, Newfoundland and Labrador, Canada.
all terrain types. SEM-MLA analysis is also available at commercial labs in Canada and other countries. The basis for Mineral Liberation Analysis (MLA) studies is the energy dispersive fingerprint for each mineral or mineral association; referred to as a Species Identifica-tion Protocol or SIP1. The SIP matches the observed EDX
SIPs is a terminology typically used by QEMSCAN users. The term also quite concisely defines our MLA library; the terms Mineral Reference Edi-tor and MR lists or spectral libraries have also been used.
Figure 1. Map of Newfoundland and Labrador, Canada, with locations discussed in text. 1 = central Newfoundland ophiolite (Pipestone Pond); 2 = western Newfoundland ophiolites (Lewis Hills); 3 = location of Vale’s Voisey’s Bay Ni-Cu Mine and the vil-lage of Nain; 4 = Strange Lake REE deposit; 5 = Florence Lake PGE occurrences; and 6 = abandoned Baie Verte asbestos mine.
CANADA
PAGE 2 NUMBER 174 EXPLORE
Paid AdvertisementOreas-November-Ad2.indd 1 11/5/15 2:22 PM
EXPLORE NUMBER 174 PAGE 3
Notes from the Editor
TABLE OF CONTENTSThe use of automated indicator mineral analysis in the search for mineralization - A next generation drift prospecting tool ............................................................ 1Notes from the Editor ............................................................... 32017 AAG Dues Reminder ...................................................... 3President’s Message .................................................................. 4Global-Scale Geochemical Baselines Mapping Steps Forward in 2016 ........................................................... 19From the EXPLORE Archives ................................................ 21Technical Note: In situ 3D Modelling of Conodonts using X-ray micro-tomography ............................................ 22AAG 2017-2018 Ordinary Councillors .................................... 22Geochemistry: Exploration, Environment, Analysis.............. 24Exploration ’17 .......................................................................... 25Calendar of Events .................................................................... 27
ADVERTISERSActivation Laboratories Ltd. .................................................... 8ALS Minerals ............................................................................ 6Bruno Lemiere .......................................................................... 4Bureau Veritas Minerals. .......................................................... 4Olympus IMS ............................................................................. 9OREAS Certified Reference Materials .................................. 2RFG 2018 ................................................................................... 26RockLabs ................................................................................... 10SciAps, Inc. ................................................................................ 7
Editor: Beth McClenaghan ([email protected])
Business Manager: Pim van Geffen 1-604-681-6765 ([email protected])
Back Issues contact: Al Arseneault ([email protected])
EXPLORE is published quarterly by the Association of Applied Geochem-ists, P.O. Box 26099, 72 Robertson Road, Ottawa, ON Canada K2H 9RO.EXPLORE is a trademark of the Association of Applied Geochemists.Type and layout of EXPLORE: Vivian Heggie, Heggie Enterprises, Thornton, CO (303) 288-6540; [email protected]
EXPLORE Publication Schedule Quarterly newsletters in March, June, September, December
Deadlines for submission of articles or advertisements: March newsletter: January 15 June newsletter: April 15 September newsletter: July 15 December newsletter: October 15
Information for Contributors Manuscripts should be double-spaced and submitted in digital format using Microsoft® WORD. Do NOT embed figures or tables in the text document. Each photo and/or figure (colour or black and white) should be submitted as separate high resolution tiff, jpeg or PDF (2400 resolution or better) file. Each table should be submitted as separate digital file in Micro-soft® EXCEL format. All scientific/technical articles will be reviewed. All contributions may be edited for clarity or brevity. Formats for headings, abbreviations, scientific notations, references and figures must follow the Guide to Authors for Geochemistry: Exploration, Environment, Analysis (GEEA) that are posted on the GEEA website at: http://www.geolsoc.org.uk/template.cfm?name=geea_instructions_for_au-thors In addition to the technical article, authors are asked to submit a separate 250 word abstract that summarizes the content of their article. This abstract will be published in the journal ELEMENTS on the ‘AAG News’ page.
Submissions should be sent to the Editor of EXPLORE:Beth McClenaghan
Email: [email protected]
EXPLORE Newsletter Advertising Rates (Effective Jan. 2016)
ANNUAL CORPORATE SPONSORSHIP USD CAD Full year $2,500 $3,425
Includes: Access to AAG membership listCompany logo on front cover
Entitled to B&W prices for colour advertisements
ADVERTISING RATES – PER ISSUE (QUARTERLY) USD CAD
Full page (B&W) 241h x 190w mm (9.5h x 7.5w in) $1,050 $1,440Full page (Colour) $1,260 $1,725Half page (B&W) 241h x 89w mm (9.5h x 3.5w in) or 124h x 190w mm (4-7/8h x 7.5w in) $575 $790Half page (Colour) $685 $9401/3 page (B&W) 241h x 51w mm (9.5h x 2w in) or 178h x 89w mm (7h x 3.5w in) $455 $6251/3 page (Colour) $545 $7451/4 page (B&W) 124h x 89w mm (4-7/8h x 3.5w in) or 241h x 41w mm (9.5h x 1-5/8w in) $325 $4451/4 page (Colour) $390 $5351/8 page (B&W) 60h x 89w mm (2-3/8h x 3.5w in) $205 $2801/8 page (Colour) $250 $340Business card (B&W) 51h x 89w mm (2h x 3.5w in) $55 $75Business card (Colour) $65 $9015% discount for full year subscription -15% -15%
Please direct advertising inquiries to:PIM VAN GEFFEN
Newsletter No. 174 March 2017
Welcome to the first issue of 2017. EXPLORE issue 174 includes one technical article that describes the use of auto-mated indicator mineral analysis as an exploration tool and was written by Derek Wilton, Gary Thompson, and David Grant. EXPLORE thanks all those who contributed to the writing and/or editing of this issue: Steve Amor, Patrice de Caritat, Alecos Demetriades, Mike Gadd, Fred Gaidies, Bob Garrett, Sofie Gouwy, David Grant, Dan Layton-Matthews, David Leng, Jan Peter, Ryan Noble, Dave Smith, Gary Thompson, Xueqiu Wang, and Derek Wilton.
Beth McClenaghan, Editor
2017 AAG Dues Reminder
Reminder that AAG membership fees for 2017 are now due.
Membership fees can be paid on AAG’s website
www.appliedgeochemists.org
PAGE 4 NUMBER 174 EXPLORE
Paid Advertisement
President's Message
Paid Advertisement
+1 604 253 3158 | [email protected]/um
Bureau Veritas MineralsIndustry Leading Solutions for the Exploration & Mining Community
■ Geochemical, Metallurgical & Mineralogical Services■ Laser Ablation, Core Logging Services & XRF■ Ore & High Grade Analysis■ Industry Leading Quality Assurance■ On-Site Services
Bruno Lemière, Ph.DGeochemist
Field analysis, metrologyand data consultant
Site instrumentation � Laboratory engineering �Data analysis � Training and know-how transfer
www.monitor-env.com36 venelle des Vaupulents - 45000 ORLEANS - France - +33 6 95902134
Operating also from New York, Montreal, Brussels or London
I hope your 2017 is off to a posi-tive and productive start. In my corner of the globe (Western Australia) there are subtle
indicators that the minerals industry is gradually improving from what has been referred to as an extended downturn. A lot of these activities are cyclical, but perhaps 2017 is trending in a positive direction, fingers crossed. The consul-tancy sector is one that is probably worst affected, and this trickles down (no reference to the U.S. election) from ap-plied exploration geochemistry related consultancy through resource recovery and into remediation and the applied environmental geochemistry realm. I recognise these times are challenging for a number of our AAG members and in particular I’d like to thank you for your loyalty to the AAG. Similar to the slight positive direction of the miner-als industry, I expect positive things for the AAG in 2017. The numbers of members has increased and I think this is something we can build further. We all know at least one person that would benefit from and enjoy being part of the AAG. If we can actively add a few members, the AAG will be in a strong position for the future regardless of industry trends and commodity demand cycles. I implore you to have a conversation with your colleague and encourage them to join or attend our IAGS just to better understand the ap-plied geochemistry landscape.
The continuing success of the AAG relies on the dedi-cated work of many of our members that work behind the scenes. If you would like to be more involved with the AAG, please contact me as we are always looking for new people and ideas to carry us forward. By now, I hope that you have paid your AAG member-ship dues for 2017. You will notice that we are changing to a more consistent digital delivery of our publications, including GEEA and EXPLORE, as well our member notifications. This shift to digital allows more freedom with content volume so I expect we will see more articles and more figures. The electronic only subscription also saves the AAG a significant amount of money in terms of postage and hard copy printing. The money saved will be used to increase support for students (IAGS travel/attendance) as well as a couple of new awards for publications in GEEA. I fully expect the next IAGS in Vancouver in 2018 will be our biggest yet, partly because of the collaboration with the other organizations to host the meeting. I also expect our AAG sessions will be better attended than previous IAGS. So please add this event to your calendars now (June 16-21, 2018) as part of RFG 2018. A large student presence is important, so please encourage students to apply for AAG travel grants. I am looking forward to it. 2017 is also the year that the Geological Survey of Can-ada celebrates in 175th year. The GSC continues to be an important contributor to, and mentor of, students in applied geochemistry and on behalf of the AAG, I congratulate Canada for the continued success of this important scientific institution and wish it well for the next 175 years.
Ryan NobleAAG [email protected]

EXPLORE NUMBER 174 PAGE 5
The use of automated indicator mineral analysis… continued from page 1
continued on page 6
(energy-dispersive X-ray) scanning electron (SEM) spec-tra of each particle against the MLA database of stored spectra (i.e., "fingerprints"). The Memorial University group (MUN) in Newfoundland, Canada, has developed a sophisticated library of SIPs that can identify almost all minerals present within a given sample, down to < 0.3% unknowns (e.g., Wilton & Winter 2012; Wilton et al. 2015), using a matching threshold of 70% in the MLA software. New minerals are added to the library as they are identified. At present we can analyse a till/stream sediment sample and accurately identify up to 99.7% of mineral particles present in the sample; a given individual sample when prepared for analysis can contain up to 20,000 particles. A typical analysis time per sample is 1-2 hours. The SEM-MLA can define what indicator minerals are present in both ore and ore-associated rock, includ-ing alteration haloes. The latter may actually represent a much larger reservoir of indicator minerals than the deposit itself, in that the ore-associated rock and/or alteration halo will contain its own suite(s) of indicator minerals that is larger than the deposit itself. As such, the greater volume of potential indicator minerals may produce a more significant target signal for the mineral deposit system than the deposit alone. Alteration of country rocks by hydrothermal fluids involves the development of new minerals that replace the original mineralogy (i.e., the original minerals were suscep-tible to alteration). Most of the potential indicator minerals of interest will be in a HMC, but lighter density, distinctive alteration minerals, such as micas, can also be present in a till sample. The HMCs produced for SEM-MLA work will typically include some lighter density phases, in particular as intergrowths with denser HMC minerals. In our SEM-MLA techniques, we analyse some of the non-HMC (i.e., light mineral concentrate) mineral separates to make sure that no potential indicator minerals are missed. A further advantage to using MLA is that it collects a spectra of all grains that are distinctive in BSE and these data can be re-visited and queried offline at a later date if a new indicator mineral relevant to mineral exploration is discovered. Traditional visual analysis, or TVA, (cf. Averill & Hu-neault 2016) in which HMC are observed with a binocular microscope, would not allow such querying of a data set. Presumably if an important new indicator mineral has an apparently distinct visual appearance, then the operator can go back through the HMC and pick out the new phase of interest. Otherwise, all phases with similar visual aspects would have to be picked and subsequently analysed by EMP to determine their presence. The SEM-MLA can define a greater range of indica-tor minerals for each deposit variety, along with mineral intergrowth textures, such that a matrix or assemblage of indicator minerals can be defined that might be specific to each deposit type. The ultimate aim would be to use the automated quantitative mineralogy capabilities of the MLA to parse through a surficial sediment sample HMC and define whether, and what, indicator minerals of any mineral deposit type are present.
Sample Preparation The initial till sample as collected in the field consists of about 10 kg of material. The till is air-dried after which we typically sieve into nine size fractions: < 63 µm, 63-125 µm, 125-180 µm, 18-250 µm, 250-500 µm, 500 µm – 1 mm, 1 - 2 mm, 2-4 mm, >4 mm; although only one fraction is actu-ally used for the SEM-MLA analysis, the other fractions are retained in case additional information is required. To determine the optimum grain size of till HMC minerals for SEM-MLA analysis, a series of different size fractions were analyzed and it was found that the 125-180 μm frac-tion provided the optimal results (Wilton & Winter 2012). If the grain size was smaller than 0.125 mm, the analyses took longer (30-50%) and the minerals were more difficult to definitively identify as the X-ray beam is statistically more likely to miss a grain centroid and instead land on a grain boundary or crack/pit producing an unwanted result. If the grain size was larger than 0.180 mm, the number of particles that could be analyzed in a given grain mount decreased by 25 to 75% and the range of observable intergrowth textures decreased. The 0.125-0.180 mm grain size was the easiest to evaluate for contamination, as, in general, any airborne contaminant grains in a processing (sieving) facility, or con-taminant grains introduced to the mount during polishing, would be demonstrably finer grained. The 125-180 µm size fraction is processed using a shak-ing (Wilfley) table to separate lighter from denser miner-als; our specific gravity threshold between heavy and light minerals using the shaking table is about 2.7-2.8. In general, we would only use one pass over the table, as we wished to analyse minerals of intermediate density and/or dense-light intergrowths to fully understand the till material. The table concentrate, of course, can be repeatedly processed over the table using different splitting parameters, tilt, etc. to produce a higher density HMC. We do not use heavy liquid or magnetic separation techniques on the separates. The resultant HMC for each sample is then partitioned using an automated micro-riffler to produce a 0.3 g separate that is poured as a 25 mm in diameter layer within a 30 mm mold in diameter (Fig. 2a). This amount of material settles as a mono-layer such that there is no gravity-induced sepa-ration of denser particles. The mould is filled with epoxy and the hardened puck is polished (Fig. 2b). We use a round
Figure 2. a) Till HMC separate (0.3 g of 125-180 µm fraction) forming monolayer within inner 25 mm diameter plastic ring within 30 mm in diameter puck (blue); b) polished puck con-taining upwards of 20,000 particles.
PAGE 6 NUMBER 174 EXPLORE
continued on page 8
Paid Advertisement
• Rapid, low cost, Pb isotope analysis
• Low detection limits with multi-element ICP-MS
• CoreViewer™ Technology
• Data integration with 3D modeling
• Industry leading hyperspectral technologies
The Global Benchmark
For more information, scan this QR code or visit www.alsglobal.com | Phone: +1 604-984-0221
Breaking Boundaries with Innovative Solutions
The use of automated indicator mineral analysis… continued from page 5
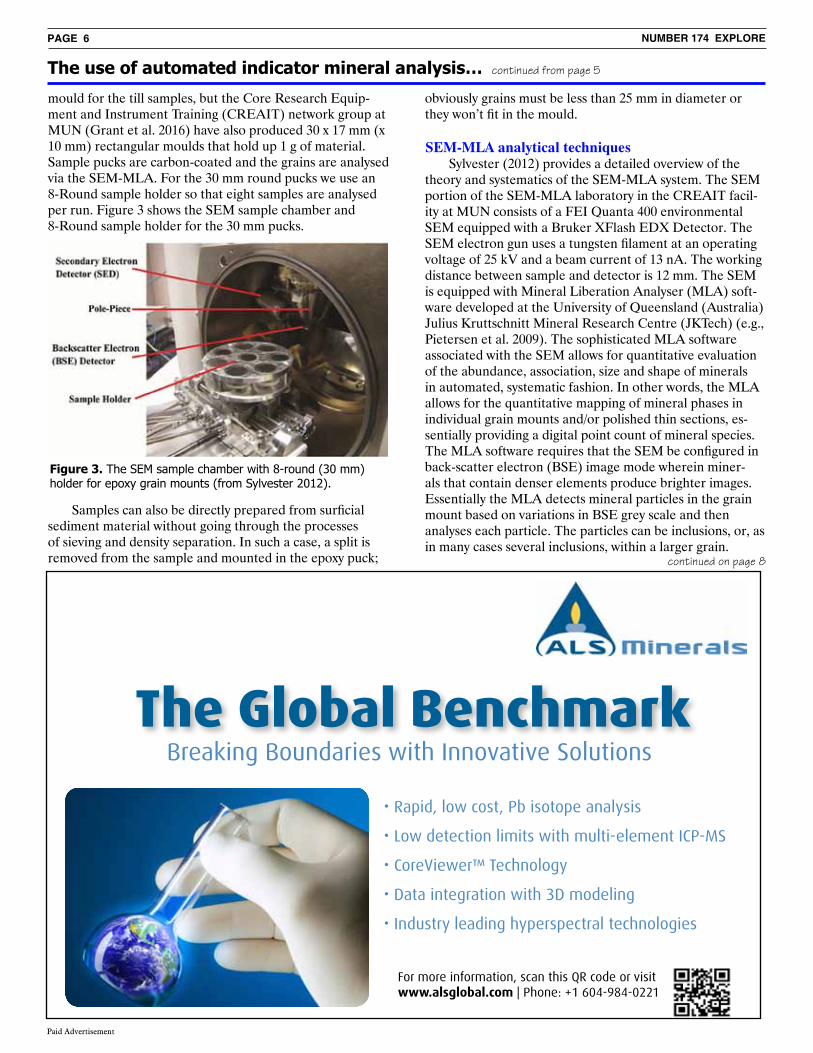
mould for the till samples, but the Core Research Equip-ment and Instrument Training (CREAIT) network group at MUN (Grant et al. 2016) have also produced 30 x 17 mm (x 10 mm) rectangular moulds that hold up 1 g of material. Sample pucks are carbon-coated and the grains are analysed via the SEM-MLA. For the 30 mm round pucks we use an 8-Round sample holder so that eight samples are analysed per run. Figure 3 shows the SEM sample chamber and 8-Round sample holder for the 30 mm pucks.
obviously grains must be less than 25 mm in diameter or they won’t fit in the mould.
SEM-MLA analytical techniques Sylvester (2012) provides a detailed overview of the theory and systematics of the SEM-MLA system. The SEM portion of the SEM-MLA laboratory in the CREAIT facil-ity at MUN consists of a FEI Quanta 400 environmental SEM equipped with a Bruker XFlash EDX Detector. The SEM electron gun uses a tungsten filament at an operating voltage of 25 kV and a beam current of 13 nA. The working distance between sample and detector is 12 mm. The SEM is equipped with Mineral Liberation Analyser (MLA) soft-ware developed at the University of Queensland (Australia) Julius Kruttschnitt Mineral Research Centre (JKTech) (e.g., Pietersen et al. 2009). The sophisticated MLA software associated with the SEM allows for quantitative evaluation of the abundance, association, size and shape of minerals in automated, systematic fashion. In other words, the MLA allows for the quantitative mapping of mineral phases in individual grain mounts and/or polished thin sections, es-sentially providing a digital point count of mineral species.The MLA software requires that the SEM be configured in back-scatter electron (BSE) image mode wherein miner-als that contain denser elements produce brighter images. Essentially the MLA detects mineral particles in the grain mount based on variations in BSE grey scale and then analyses each particle. The particles can be inclusions, or, as in many cases several inclusions, within a larger grain.
Figure 3. The SEM sample chamber with 8-round (30 mm) holder for epoxy grain mounts (from Sylvester 2012).
Samples can also be directly prepared from surficial sediment material without going through the processes of sieving and density separation. In such a case, a split is removed from the sample and mounted in the epoxy puck;
EXPLORE NUMBER 174 PAGE 7
Paid Advertisement
PAGE 8 NUMBER 174 EXPLORE
continued on page 11
Paid Advertisement
The use of automated indicator mineral analysis… continued from page 6
Actlabs adds value to your projects:
· Precise and Accurate Results
· Fast Turnaround
· Responsive and Knowledgeable
Customer Service
A global company with a
local full laboratory presence.
www.actlabs.com
For till HMC samples, the grey-scale “threshold” was set with the epoxy as black and metallic copper as white. The dwell time (i.e., time spent acquiring data) for each X-ray analysis of a particle is 60 microseconds. Image size resolu-tion was set at 800 dpi and minimum particle diameter de-tected was about 5 μm. The MLA compares the elemental spectra for any particle analyzed with a “library” of mineral spectra to identify the particular phase. If the MLA soft-ware cannot identify a mineral during analysis, it is recorded as an “unknown” and the analyst manually re-examines the spot analysed after the automated run to ascertain whether it truly is an unidentified mineral or a defect in the polished surface (i.e., crack, hole, etc.). In rare cases, the analysis is obtained on a boundary between two minerals in a particle containing more than one mineral species and is therefore a mix of two mineral spectra. During the post-processing of the MLA run, the opera-tor can also query the location and/or form of particular particles. The instrument can be engaged to return to specific particles of interest and the operator can examine the particles in detail up to, and including, the conducting of real-time EDX analyses of the mineral and intergrown phases. The operator can also obtain higher resolution BSE images at this stage. During the analytical run, spatial regis-tration points can be taken for the grain mount, such that all particles can be precisely located if future analyses, such as Laser Ablation ICP-MS, or EPMA, are to be performed on the grains of any particular mineral phase.
The MLA maps each grain mount in terms of frames per mount, typically using a horizontal field width (HFW) of 1-2 mm. About 100-120 frames are measured with approxi-mately 100 particles/frame, this is sufficient for a typical MLA analysis as >100 particles will saturate the X-ray detector, thus missing X-rays and leading to inadequate results; each frame represents a portion of the mount. The particles in each frame are analyzed and then their rela-tive and absolute abundances can be calculated. The EDX spectrum collected by the MLA simply indicates what ele-ments are present in the mineral and their relative concen-trations; it does not determine the crystallographic nature of the particle (e.g., gypsum cannot be readily distinguished from anhydrite). Furthermore, as the MLA analyses are spectrum-based, the EDX component cannot identify minor (trace) elements within individual minerals. Thus, any ele-ments identified in a mineral are significant (>1%) compo-nents of the given mineral phase. The confidence level for the spectral match is set during the initial analysis; typically set at about 90% probability. The software scales the probability between 0% and 100%, with 100% as a perfect match (probability of 1) whereas 50% has a probability match of 1.00E-80 which termed an “average match” (Mateo 2010). With post-processing and identification of unknowns, the confidence level can be reset to another level. A higher threshold would require a closer match between observed and stored spectra increas-

EXPLORE NUMBER 174 PAGE 9
Paid Advertisement
Introducing the Handheld XRF Analyzer
Rugged. Revolutionary. Productive.
Contact your local Olympus sales representative or visit: http://www.olympus-ims.com/vanta
Vanta and Axon are trademark of Olympus Corporation.The Bluetooth® word mark and logos are registered trademarks owned by Bluetooth SIG, Inc. and any use of such marks by Olympus Corporation is under license.
*M series analyzers are IP 64 rated
Rugged - Drop tested to military standards for maximum uptime
- IP65 rated* for protection against water and dust
Revolutionary - Accurate, repeatable results in seconds for instant geochemistry and mineralogy
- Axon™ technology for higher count rates per second and excellent limits of detection (LODs)
Productive - Intuitive software features designed to maximize user throughput
- Data are easily exported via Wi-Fi, Bluetooth®, or USB for streamlined data delivery and archiving
ExploreNewsletter_201606.indd 1 7/18/16 9:14 AM
PAGE 10 NUMBER 174 EXPLORE
Standard equipment
Mechanised systems
Combo systems
Reference Materials
Automated Systems
ROCKLABS is a global innovator in sample preparation equipment. Our New Zealand ingenuity combined with technical excellence positions us at the forefront internationally. We design and manufacture systems, equipment and certified reference materials which transform the processes of metals and minerals research, mining and exploration organisations around the world.
• On-site service and assistance along with spare parts and after-market support in most countries.
• Extensive range from bench top ring mills and sample dividers through to large combination crushers, pulverisers and fully automated systems.
• Reference Materials division is the world-leading producer of high-quality, globally certified laboratory standards for the Gold, Silver, Platinum , and Palladium industries, which provides vital quality assurance and quality control management.
• We have a team of chemists and a statistician to advise and assist in the use of reference materials and analysis of results.
LEADING INNOVATION IN SAMPLE PREPARATION EQUIPMENT
www.rocklabs.com
Paid Advertisement
EXPLORE NUMBER 174 PAGE 11
continued on page 12
The use of automated indicator mineral analysis… continued from page 8
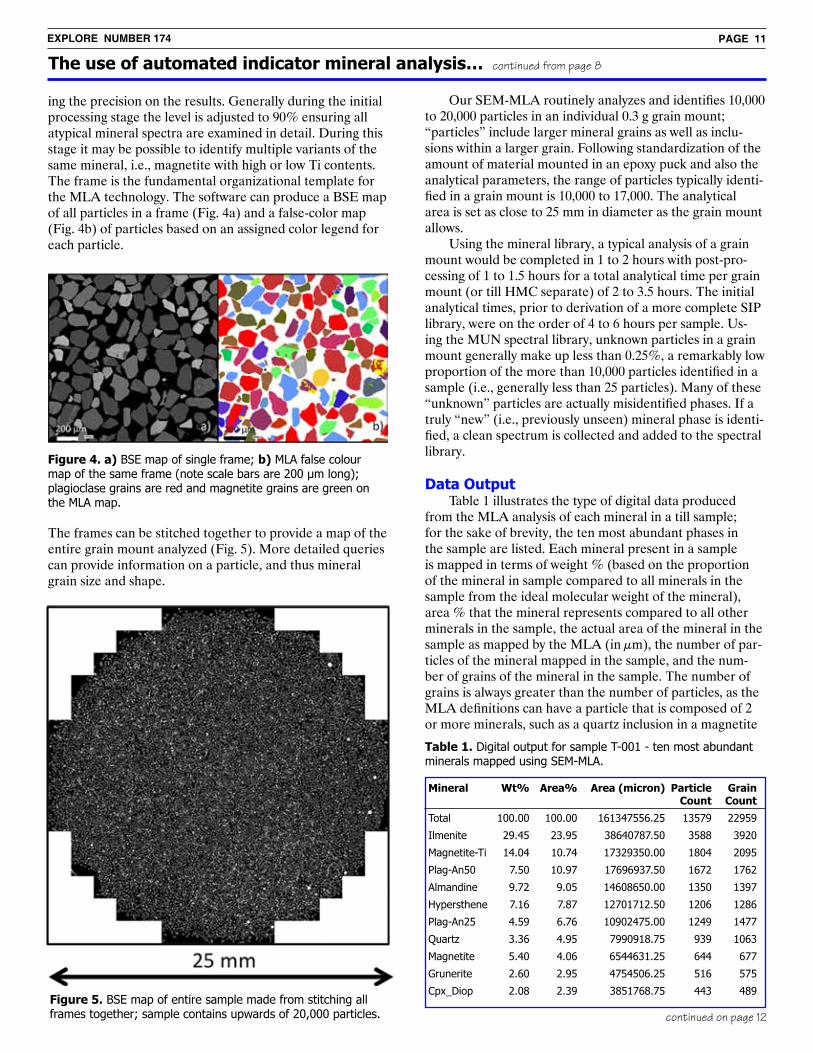
ing the precision on the results. Generally during the initial processing stage the level is adjusted to 90% ensuring all atypical mineral spectra are examined in detail. During this stage it may be possible to identify multiple variants of the same mineral, i.e., magnetite with high or low Ti contents. The frame is the fundamental organizational template for the MLA technology. The software can produce a BSE map of all particles in a frame (Fig. 4a) and a false-color map (Fig. 4b) of particles based on an assigned color legend for each particle.
Our SEM-MLA routinely analyzes and identifies 10,000 to 20,000 particles in an individual 0.3 g grain mount; “particles” include larger mineral grains as well as inclu-sions within a larger grain. Following standardization of the amount of material mounted in an epoxy puck and also the analytical parameters, the range of particles typically identi-fied in a grain mount is 10,000 to 17,000. The analytical area is set as close to 25 mm in diameter as the grain mount allows. Using the mineral library, a typical analysis of a grain mount would be completed in 1 to 2 hours with post-pro-cessing of 1 to 1.5 hours for a total analytical time per grain mount (or till HMC separate) of 2 to 3.5 hours. The initial analytical times, prior to derivation of a more complete SIP library, were on the order of 4 to 6 hours per sample. Us-ing the MUN spectral library, unknown particles in a grain mount generally make up less than 0.25%, a remarkably low proportion of the more than 10,000 particles identified in a sample (i.e., generally less than 25 particles). Many of these “unknown” particles are actually misidentified phases. If a truly “new” (i.e., previously unseen) mineral phase is identi-fied, a clean spectrum is collected and added to the spectral library.
Data Output Table 1 illustrates the type of digital data produced from the MLA analysis of each mineral in a till sample; for the sake of brevity, the ten most abundant phases in the sample are listed. Each mineral present in a sample is mapped in terms of weight % (based on the proportion of the mineral in sample compared to all minerals in the sample from the ideal molecular weight of the mineral), area % that the mineral represents compared to all other minerals in the sample, the actual area of the mineral in the sample as mapped by the MLA (in µm), the number of par-ticles of the mineral mapped in the sample, and the num-ber of grains of the mineral in the sample. The number of grains is always greater than the number of particles, as the MLA definitions can have a particle that is composed of 2 or more minerals, such as a quartz inclusion in a magnetite
Figure 4. a) BSE map of single frame; b) MLA false colour map of the same frame (note scale bars are 200 µm long); plagioclase grains are red and magnetite grains are green on the MLA map.
The frames can be stitched together to provide a map of the entire grain mount analyzed (Fig. 5). More detailed queries can provide information on a particle, and thus mineral grain size and shape.
Figure 5. BSE map of entire sample made from stitching all frames together; sample contains upwards of 20,000 particles.
Table 1. Digital output for sample T-001 - ten most abundant minerals mapped using SEM-MLA.
Mineral Wt% Area% Area (micron) Particle Grain Count CountTotal 100.00 100.00 161347556.25 13579 22959Ilmenite 29.45 23.95 38640787.50 3588 3920Magnetite-Ti 14.04 10.74 17329350.00 1804 2095Plag-An50 7.50 10.97 17696937.50 1672 1762Almandine 9.72 9.05 14608650.00 1350 1397Hypersthene 7.16 7.87 12701712.50 1206 1286Plag-An25 4.59 6.76 10902475.00 1249 1477Quartz 3.36 4.95 7990918.75 939 1063Magnetite 5.40 4.06 6544631.25 644 677Grunerite 2.60 2.95 4754506.25 516 575Cpx_Diop 2.08 2.39 3851768.75 443 489
PAGE 12 NUMBER 174 EXPLORE
continued on page 13
The use of automated indicator mineral analysis… continued from page 11
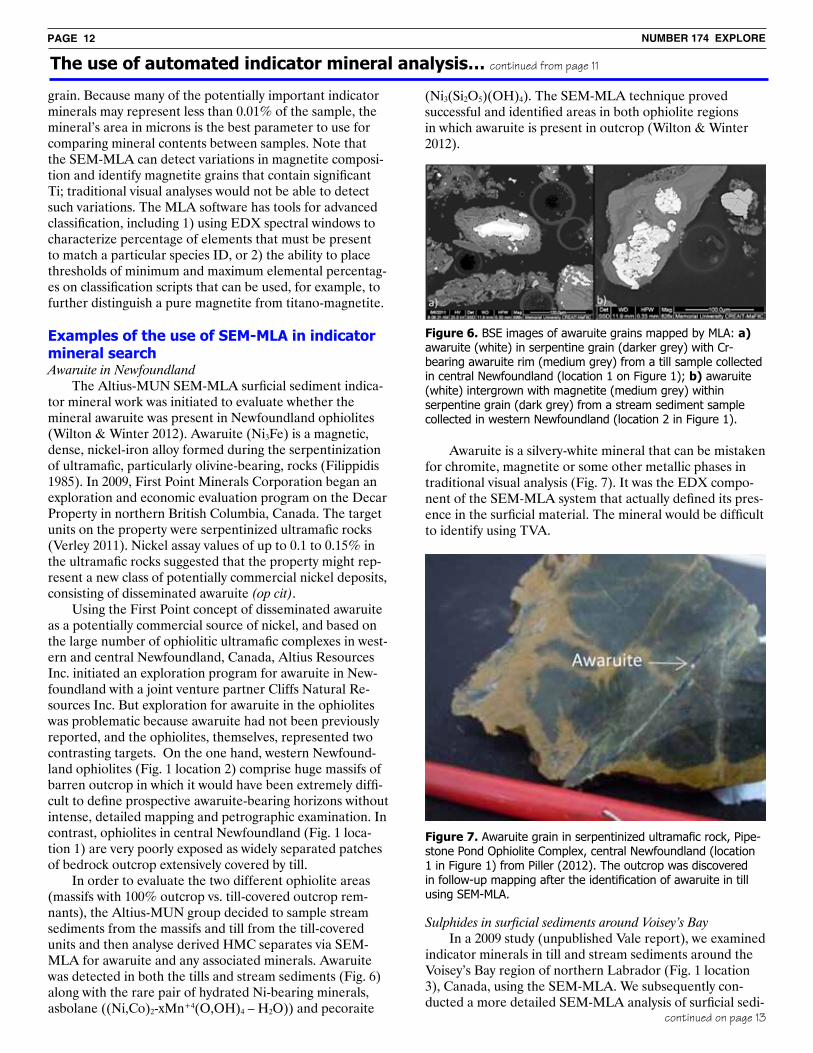
grain. Because many of the potentially important indicator minerals may represent less than 0.01% of the sample, the mineral’s area in microns is the best parameter to use for comparing mineral contents between samples. Note that the SEM-MLA can detect variations in magnetite composi-tion and identify magnetite grains that contain significant Ti; traditional visual analyses would not be able to detect such variations. The MLA software has tools for advanced classification, including 1) using EDX spectral windows to characterize percentage of elements that must be present to match a particular species ID, or 2) the ability to place thresholds of minimum and maximum elemental percentag-es on classification scripts that can be used, for example, to further distinguish a pure magnetite from titano-magnetite. Examples of the use of SEM-MLA in indicator mineral search Awaruite in Newfoundland The Altius-MUN SEM-MLA surficial sediment indica-tor mineral work was initiated to evaluate whether the mineral awaruite was present in Newfoundland ophiolites (Wilton & Winter 2012). Awaruite (Ni3Fe) is a magnetic, dense, nickel-iron alloy formed during the serpentinization of ultramafic, particularly olivine-bearing, rocks (Filippidis 1985). In 2009, First Point Minerals Corporation began an exploration and economic evaluation program on the Decar Property in northern British Columbia, Canada. The target units on the property were serpentinized ultramafic rocks (Verley 2011). Nickel assay values of up to 0.1 to 0.15% in the ultramafic rocks suggested that the property might rep-resent a new class of potentially commercial nickel deposits, consisting of disseminated awaruite (op cit). Using the First Point concept of disseminated awaruite as a potentially commercial source of nickel, and based on the large number of ophiolitic ultramafic complexes in west-ern and central Newfoundland, Canada, Altius Resources Inc. initiated an exploration program for awaruite in New-foundland with a joint venture partner Cliffs Natural Re-sources Inc. But exploration for awaruite in the ophiolites was problematic because awaruite had not been previously reported, and the ophiolites, themselves, represented two contrasting targets. On the one hand, western Newfound-land ophiolites (Fig. 1 location 2) comprise huge massifs of barren outcrop in which it would have been extremely diffi-cult to define prospective awaruite-bearing horizons without intense, detailed mapping and petrographic examination. In contrast, ophiolites in central Newfoundland (Fig. 1 loca-tion 1) are very poorly exposed as widely separated patches of bedrock outcrop extensively covered by till. In order to evaluate the two different ophiolite areas (massifs with 100% outcrop vs. till-covered outcrop rem-nants), the Altius-MUN group decided to sample stream sediments from the massifs and till from the till-covered units and then analyse derived HMC separates via SEM-MLA for awaruite and any associated minerals. Awaruite was detected in both the tills and stream sediments (Fig. 6) along with the rare pair of hydrated Ni-bearing minerals, asbolane ((Ni,Co)2-xMn+4(O,OH)4 – H2O)) and pecoraite
(Ni3(Si2O5)(OH)4). The SEM-MLA technique proved successful and identified areas in both ophiolite regions in which awaruite is present in outcrop (Wilton & Winter 2012).
Awaruite is a silvery-white mineral that can be mistaken for chromite, magnetite or some other metallic phases in traditional visual analysis (Fig. 7). It was the EDX compo-nent of the SEM-MLA system that actually defined its pres-ence in the surficial material. The mineral would be difficult to identify using TVA.
Figure 6. BSE images of awaruite grains mapped by MLA: a) awaruite (white) in serpentine grain (darker grey) with Cr-bearing awaruite rim (medium grey) from a till sample collected in central Newfoundland (location 1 on Figure 1); b) awaruite (white) intergrown with magnetite (medium grey) within serpentine grain (dark grey) from a stream sediment sample collected in western Newfoundland (location 2 in Figure 1).
Figure 7. Awaruite grain in serpentinized ultramafic rock, Pipe-stone Pond Ophiolite Complex, central Newfoundland (location 1 in Figure 1) from Piller (2012). The outcrop was discovered in follow-up mapping after the identification of awaruite in till using SEM-MLA.
Sulphides in surficial sediments around Voisey’s Bay In a 2009 study (unpublished Vale report), we examined indicator minerals in till and stream sediments around the Voisey’s Bay region of northern Labrador (Fig. 1 location 3), Canada, using the SEM-MLA. We subsequently con-ducted a more detailed SEM-MLA analysis of surficial sedi-
EXPLORE NUMBER 174 PAGE 13
continued on page 14
The use of automated indicator mineral analysis… continued from page 12
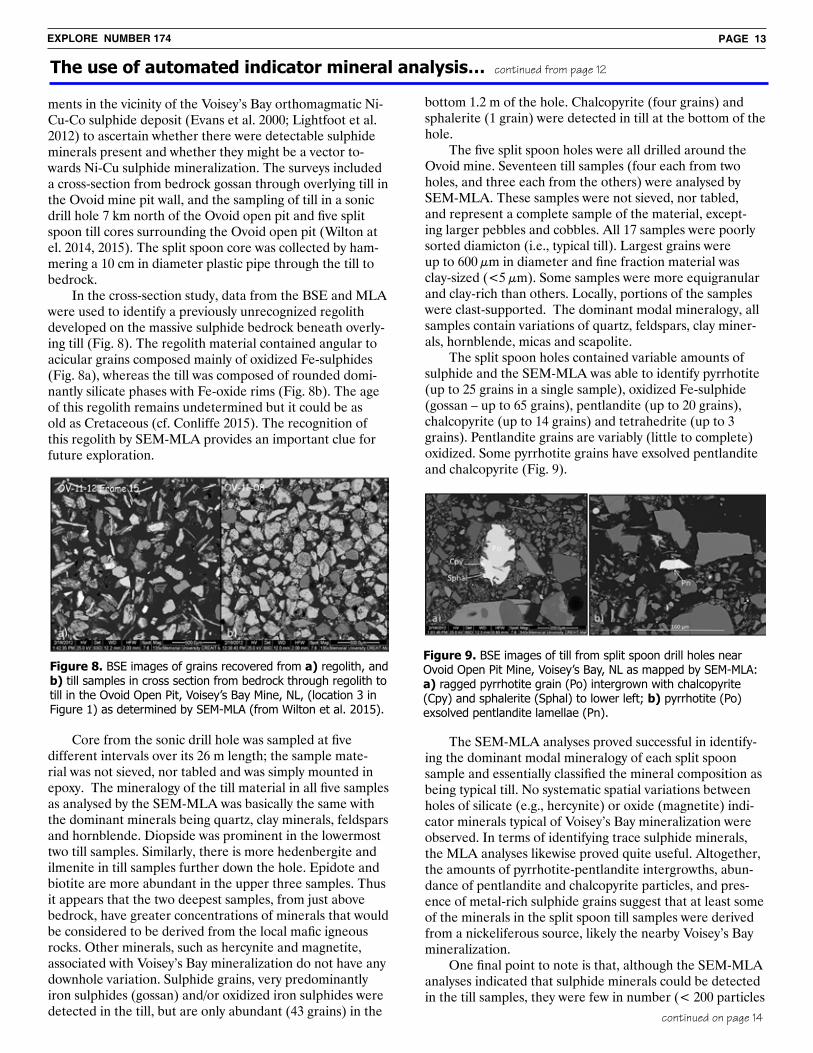
ments in the vicinity of the Voisey’s Bay orthomagmatic Ni-Cu-Co sulphide deposit (Evans et al. 2000; Lightfoot et al. 2012) to ascertain whether there were detectable sulphide minerals present and whether they might be a vector to-wards Ni-Cu sulphide mineralization. The surveys included a cross-section from bedrock gossan through overlying till in the Ovoid mine pit wall, and the sampling of till in a sonic drill hole 7 km north of the Ovoid open pit and five split spoon till cores surrounding the Ovoid open pit (Wilton at el. 2014, 2015). The split spoon core was collected by ham-mering a 10 cm in diameter plastic pipe through the till to bedrock. In the cross-section study, data from the BSE and MLA were used to identify a previously unrecognized regolith developed on the massive sulphide bedrock beneath overly-ing till (Fig. 8). The regolith material contained angular to acicular grains composed mainly of oxidized Fe-sulphides (Fig. 8a), whereas the till was composed of rounded domi-nantly silicate phases with Fe-oxide rims (Fig. 8b). The age of this regolith remains undetermined but it could be as old as Cretaceous (cf. Conliffe 2015). The recognition of this regolith by SEM-MLA provides an important clue for future exploration.
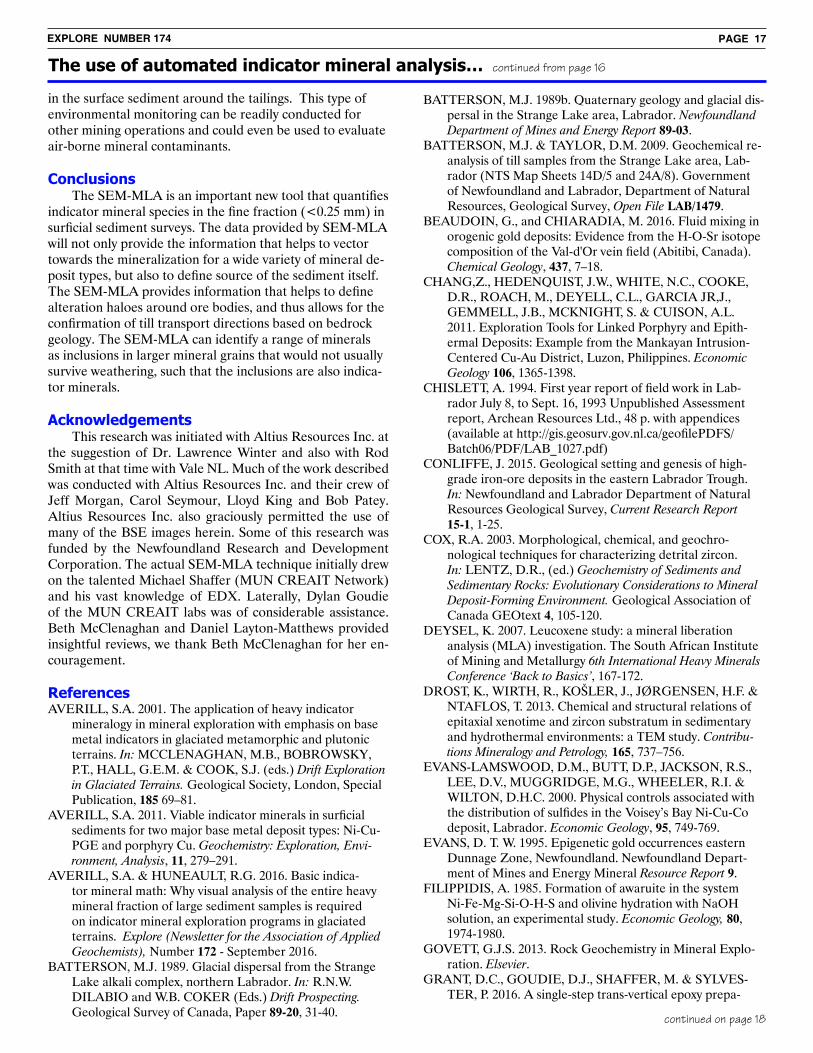
bottom 1.2 m of the hole. Chalcopyrite (four grains) and sphalerite (1 grain) were detected in till at the bottom of the hole. The five split spoon holes were all drilled around the Ovoid mine. Seventeen till samples (four each from two holes, and three each from the others) were analysed by SEM-MLA. These samples were not sieved, nor tabled, and represent a complete sample of the material, except-ing larger pebbles and cobbles. All 17 samples were poorly sorted diamicton (i.e., typical till). Largest grains were up to 600 µm in diameter and fine fraction material was clay-sized (<5 µm). Some samples were more equigranular and clay-rich than others. Locally, portions of the samples were clast-supported. The dominant modal mineralogy, all samples contain variations of quartz, feldspars, clay miner-als, hornblende, micas and scapolite. The split spoon holes contained variable amounts of sulphide and the SEM-MLA was able to identify pyrrhotite (up to 25 grains in a single sample), oxidized Fe-sulphide (gossan – up to 65 grains), pentlandite (up to 20 grains), chalcopyrite (up to 14 grains) and tetrahedrite (up to 3 grains). Pentlandite grains are variably (little to complete) oxidized. Some pyrrhotite grains have exsolved pentlandite and chalcopyrite (Fig. 9).
Figure 8. BSE images of grains recovered from a) regolith, and b) till samples in cross section from bedrock through regolith to till in the Ovoid Open Pit, Voisey’s Bay Mine, NL, (location 3 in Figure 1) as determined by SEM-MLA (from Wilton et al. 2015).
Core from the sonic drill hole was sampled at five different intervals over its 26 m length; the sample mate-rial was not sieved, nor tabled and was simply mounted in epoxy. The mineralogy of the till material in all five samples as analysed by the SEM-MLA was basically the same with the dominant minerals being quartz, clay minerals, feldspars and hornblende. Diopside was prominent in the lowermost two till samples. Similarly, there is more hedenbergite and ilmenite in till samples further down the hole. Epidote and biotite are more abundant in the upper three samples. Thus it appears that the two deepest samples, from just above bedrock, have greater concentrations of minerals that would be considered to be derived from the local mafic igneous rocks. Other minerals, such as hercynite and magnetite, associated with Voisey’s Bay mineralization do not have any downhole variation. Sulphide grains, very predominantly iron sulphides (gossan) and/or oxidized iron sulphides were detected in the till, but are only abundant (43 grains) in the
Figure 9. BSE images of till from split spoon drill holes near Ovoid Open Pit Mine, Voisey’s Bay, NL as mapped by SEM-MLA: a) ragged pyrrhotite grain (Po) intergrown with chalcopyrite (Cpy) and sphalerite (Sphal) to lower left; b) pyrrhotite (Po) exsolved pentlandite lamellae (Pn).
The SEM-MLA analyses proved successful in identify-ing the dominant modal mineralogy of each split spoon sample and essentially classified the mineral composition as being typical till. No systematic spatial variations between holes of silicate (e.g., hercynite) or oxide (magnetite) indi-cator minerals typical of Voisey’s Bay mineralization were observed. In terms of identifying trace sulphide minerals, the MLA analyses likewise proved quite useful. Altogether, the amounts of pyrrhotite-pentlandite intergrowths, abun-dance of pentlandite and chalcopyrite particles, and pres-ence of metal-rich sulphide grains suggest that at least some of the minerals in the split spoon till samples were derived from a nickeliferous source, likely the nearby Voisey’s Bay mineralization. One final point to note is that, although the SEM-MLA analyses indicated that sulphide minerals could be detected in the till samples, they were few in number (< 200 particles

PAGE 14 NUMBER 174 EXPLORE
The use of automated indicator mineral analysis… continued from page 13
continued on page 15
in a sample with >10,000 particles). Also, the particles/grains were minute, rarely > 100 µm (i.e., 0.1 mm) in diameter; the largest sulphide grain detected was only 1.25 mm long. These observations from the SEM-MLA work are at odds with those of Averill (2001) who stated that heavy mineral concentrates derived from 10 kg surficial sediment samples from the Voisey’s Bay area contained chalcopy-rite and an “overabundance of garnet” (p.74). The survey referred to by Averill (op cit.) was of bulk river sediment samples (Chislett 1994) from a ca. 7-km grid spacing. SEM-MLA analysis of till around the mine site did not indicate the presence of appreciable garnet. The split spoon and sonic samples contained < 0.65% (mainly <0.40%) and 0.41%, respectively, garnet. Chislett (op cit.), in fact, did not actually report the presence of any chalcopyrite in the river sediment samples.
Sourcing till origins One of the most significant observations from our work on tills with the SEM-MLA is its ability to define source regions for till. In one spectacular case, the SEM-MLA was able to identify gittinsite (CaZrSi2O7) grains (Fig. 10) in till samples collected across a very limited region near Nain (Fig. 1 location 3), which is within the glacial ice stream extending from the Strange Lake REE deposit over 100 km to the east.
considerable transport distances. Within the study area, maximum transport is at least 40 km, with expectation that a clearly defined dispersal train extends for at least 55 km and probably farther". The SEM-MLA study of mineral grains in till samples proved Batterson’s (1989) supposition that the Strange Lake dispersal train extended much further to the north-east. The SEM-MLA data allows for the rapid and precise identification of unique minerals that can define the source, or at least a portion, of the till material at distances (i.e., >100 km), well past the decay rate (rate of elemental con-centration decrease with distance down ice) for till geo-chemistry. Zircon is a common component in any surficial sedi-ment HMC and we use the abundance, size and shape of zircons in each sample as monitors of a variety of param-eters in our surveys, including bedrock types, sample qual-ity, etc. The ability to of the SEM-MLA to examine zircon interiors, allows for the derivation of fundamental informa-tion on probable sources of the till material. For instance, internal zoning within a zircon grain with a very well-developed core overgrown by an equally well-defined rim (Fig. 11a) suggests origin from a high-temperature granitic source (Cox 2003). In other examples, altered zircon grains are observed to contain uraninite-galena or thorite-hutton-ite inclusions (Figs 11b and c). Such zircons were derived from a U or Th rich source, but because of their metamict nature and inherent fragility, these zircons could not have been transported any significant distance (Cox 2003). Fi-nally in some other zircon grains that we have mapped in till samples, the MLA analysis revealed xenotime overgrowths on zircon (Fig. 11d). These types of overgrowths occur dur-ing diagenetic reactions in sediment (e.g., Prost et al. 2013)
Figure 10. BSE images of till from near Nain NL, as mapped by SEM-MLA: a) gittinsite intergrown with zircon and quartz; b) feathery-shaped gittinsite intergrown with quartz (dark grey).
The Strange Lake deposit (Miller 1990; Gysi et al. 2016) is a 6 km wide peralkaline granite complex (Fig. 1 location 4), that hosts REE, Zr, Y, and Nb mineralization in granite, aplite, and pegmatite phases along with as-sociated quartz veins. Zirconium is dominantly contained within gittinsite, a common phase in the complex (Kerr 2013). Due to the point-source nature of the granite and associated REE mineralization and well-developed surficial geochemical signatures, the deposit has become a classic example of a glacial dispersal train (e.g., Batterson 1989a; Batterson & Taylor 2009; McClenaghan 2007). McConnell and Batterson (1987) determined that the Strange Lake REE mineralization signal could be detected in till, stream sediment, stream waters, lake sediment and lake waters along a northeastern trend from the deposit. Batterson (1989b) reported that a ribbon-shaped, northeast-trending, geochemical dispersal train extended for up to 40 km from the deposit, and he concluded (p. 27) "there is evidence of
Figure 11. BSE images of zircon grains in till from northern Labrador, as mapped by SEM-MLA: a) zircon with well-defined core and rim; b) altered zircon with uraninite inclusions inclu-sions; c) altered zircon with thorite and huttonite inclusions inclusions; d) altered zircon overgrown by xenotime.

EXPLORE NUMBER 174 PAGE 15
The use of automated indicator mineral analysis… continued from page 14
continued on page 16
indicating that the till was derived in part from a potentially low-grade sedimentary bedrock unit.
Inclusions and minerals that should not exist in tills Traditional visual analysis (TVA) cannot see inside min-eral grains unless they are removed from the concentrate, mounted and subsequently polished. Furthermore TVA is predicated on the fact that all representative minerals will be of a common size and generally monomineralic. This is not the case in nature, minerals are intimately mixed with each other from full-fledged intergrowths to inclusions of one mineral within another. Aside from the ability to quantify and identify all miner-al phases in samples, the most significant aspect of the SEM-MLA till analysis is the ability to define inclusions within other mineral grains and the ability to see through altera-tion rims to detect the true nature of a grain. In many cases resistant minerals mantling less resistant minerals allows for the detection of minerals in a till that should not be there because of their inability to withstand physical or chemical weathering. Figure 12 contains images of sulphide minerals that can be mapped as inclusions by the SEM-MLA, includ-ing galena, stibnite, sphalerite and arsenopyrite. Without the capabilities of the SEM-MLA, these inclusions would not have been detected by TVA.The detail provided by the SEM-MLA can also include the identification and quantification of exsolution textures (Fig.
produce “anthropogenic” till (Wilton et al. 2016). As unmix-ing (exsolution) of sulphide phases is such a common and intrinsic feature of orthomagmatic sulphide deposits (e.g., Naldrett 2013), the observation of these types of textures in mineral grains from a till would strongly suggest the pres-ence of such mineralization in the source area of the till. Such fine and delicate features would not be observable via TVA.
Precious metals and proxies Because of inherent densities, and hence extreme brightness in BSE image mode, gold and silver are read-ily identified by the SEM-MLA (Fig. 14). Not only can the SEM-MLA locate and define these minerals, the innate capability to identify precious metal inclusions means that the mineralogical context or association of precious metals can be defined. The EDX component of the SEM-MLA can also distinguish different Au-Ag contents in electrum grains (Fig. 14b – upper right), aiding in definition of source and mineralization type (e.g., Chang et al. 2011). The SEM-MLA examination of mineral grains in till (and other surficial sediments) can determine the presence of robust proxy minerals for gold that would have greater abundances that gold itself (Fig. 15). For instance, tourma-line can be a common accessory in orogenic gold deposits (e.g., Beaudoin & Chiaradia 2016). Cinnabar is likewise associated with many epithermal-type auriferous deposits (e.g., Sillitoe 1994). Evans (1995) reported that leucoxene is a common
Figure 12. BSE images of mineral inclusions in other minerals from tills in NL, as mapped by SEM-MLA. a) galena in quartz; b) stibnite in pyrite cube; c) arsenopyrite surrounded by Fe-oxide alteration rim; d) sphalerite in magnetite.
13) such as pentlandite or troilite from pyrrhotite, bornite from chalcopyrite and Ir-Rh alloys from cobaltite miner-als. The grains in Figure 13d were actually derived from crushed host rock to the Florence Lake PGE occurrence in northern Labrador (Fig. 1 location 5), Canada, in a study to
Figure 13. BSE images of sulphide mineral exsolution in inclu-sions from tills in NL, as mapped by SEM-MLA. a) pentland-ite exsolved from pyrrhotite in pyroxene; b) troilite exsolved from pyrrhotite in pyroxene; c) -bornite (white) exsolved from chalcopyrite in magnetite; d) Ir-Rh alloy exsolved from cobaltite (cube) intergrown with pyrrhotite (note this is from a broken rock sample not till).

PAGE 16 NUMBER 174 EXPLORE
The use of automated indicator mineral analysis… continued from page 15
alteration mineral surrounding gabbro-hosted gold deposits in Newfoundland. Leucoxene forms as fine-grained altera-tion of primary titanium minerals, primarily ilmenite and/or Ti-rich magnetite, and as Ti and its constituent minerals
are widely viewed (eg., Govett 2013) as being immobile to chemical transport, the presence of leucoxene in a surficial sediment would suggest that the sediment has sampled a region of hydrothermal alteration that might be associated with an auriferous system. Deysel (2007) demonstrated that the SEM-MLA can reliably distinguish between leucoxene and ilmenite, something that would be difficult by TVA. Kelley et al. (2011) reported on a detailed examination of indicator minerals in till down ice of the Pebble porphyry Cu-Au-Mo deposit of Alaska, USA. Minerals of particular interest include gold, jarosite, cinnabar, Mn-epidote, andra-dite, apatite and pyrite. The study indicated that the differ-ent mineral phases were each important, though they may have reflected a different component of the ore-forming system. Indicator mineral identification in the study (op cit.) was based on TVA techniques, but selected grains had to be analysed by electron microprobe to confirm their identity. In contrast, the SEM-MLA can readily identify and quantify these same minerals immediately, including mineral phases such as jarosite (Fig. 15b) which can easily be mistaken for limonite in simple visual observation.
Mine remediation A project with the Centre for Applied Health Research, Memorial University, involved examining surface sediment samples around the tailings piles at the Baie Verte Asbestos Mine (Fig. 1 location 6) in Baie Verte NL by SEM-MLA (Wilton 2013). The aim of the study was to evaluate the possible presence of asbestos minerals and, if present, the extent of their distribution. A secondary aim was to deter-mine whether any asbestos present was solely chrysotile, or was the more toxic grunerite variety present as well. The SEM-MLA mapping identified and quantitatively defined chrysotile contents (Fig. 16) and no grunerite was detected
continued on page 17
Figure 14. BSE images of precious metals in grains from tills in NL, as mapped by SEM-MLA. a) silver intergrown with chalco-pyrite in magnetite; b) low-silver electrum; c) gold in pyrite; d) inute gold grains intergrown with selenian covellite in hyper-sthene.
Figure 15. BSE images of proxy minerals for auriferous min-eralization from tills in NL, as mapped by SEM-MLA: a) cin-nabar in albite; b) jarosite grains with muscovite, fuchsite and quartz, note this is a regolith developed on the Klondyke Schist; c) a grain of leucoxene (altered rutile) with rutile lamellae (white); d) tourmaline (spongey gray).
Figure 16. BSE image of serpentine (S) terminating into chrysotile (C) asbestos along the bottom; from surface sample at the abandoned Baie Verte asbestos mine tailings dump, NL (location 6 in Figure1).
EXPLORE NUMBER 174 PAGE 17
The use of automated indicator mineral analysis… continued from page 16
in the surface sediment around the tailings. This type of environmental monitoring can be readily conducted for other mining operations and could even be used to evaluate air-borne mineral contaminants.
Conclusions The SEM-MLA is an important new tool that quantifies indicator mineral species in the fine fraction (<0.25 mm) in surficial sediment surveys. The data provided by SEM-MLA will not only provide the information that helps to vector towards the mineralization for a wide variety of mineral de-posit types, but also to define source of the sediment itself. The SEM-MLA provides information that helps to define alteration haloes around ore bodies, and thus allows for the confirmation of till transport directions based on bedrock geology. The SEM-MLA can identify a range of minerals as inclusions in larger mineral grains that would not usually survive weathering, such that the inclusions are also indica-tor minerals.
Acknowledgements This research was initiated with Altius Resources Inc. at the suggestion of Dr. Lawrence Winter and also with Rod Smith at that time with Vale NL. Much of the work described was conducted with Altius Resources Inc. and their crew of Jeff Morgan, Carol Seymour, Lloyd King and Bob Patey. Altius Resources Inc. also graciously permitted the use of many of the BSE images herein. Some of this research was funded by the Newfoundland Research and Development Corporation. The actual SEM-MLA technique initially drew on the talented Michael Shaffer (MUN CREAIT Network) and his vast knowledge of EDX. Laterally, Dylan Goudie of the MUN CREAIT labs was of considerable assistance. Beth McClenaghan and Daniel Layton-Matthews provided insightful reviews, we thank Beth McClenaghan for her en-couragement.
ReferencesAVERILL, S.A. 2001. The application of heavy indicator
mineralogy in mineral exploration with emphasis on base metal indicators in glaciated metamorphic and plutonic terrains. In: MCCLENAGHAN, M.B., BOBROWSKY, P.T., HALL, G.E.M. & COOK, S.J. (eds.) Drift Exploration in Glaciated Terrains. Geological Society, London, Special Publication, 185 69–81.
AVERILL, S.A. 2011. Viable indicator minerals in surficial sediments for two major base metal deposit types: Ni-Cu-PGE and porphyry Cu. Geochemistry: Exploration, Envi-ronment, Analysis, 11, 279–291.
AVERILL, S.A. & HUNEAULT, R.G. 2016. Basic indica-tor mineral math: Why visual analysis of the entire heavy mineral fraction of large sediment samples is required on indicator mineral exploration programs in glaciated terrains. Explore (Newsletter for the Association of Applied Geochemists), Number 172 - September 2016.
BATTERSON, M.J. 1989. Glacial dispersal from the Strange Lake alkali complex, northern Labrador. In: R.N.W. DILABIO and W.B. COKER (Eds.) Drift Prospecting. Geological Survey of Canada, Paper 89-20, 31-40.
BATTERSON, M.J. 1989b. Quaternary geology and glacial dis-persal in the Strange Lake area, Labrador. Newfoundland Department of Mines and Energy Report 89-03.
BATTERSON, M.J. & TAYLOR, D.M. 2009. Geochemical re-analysis of till samples from the Strange Lake area, Lab-rador (NTS Map Sheets 14D/5 and 24A/8). Government of Newfoundland and Labrador, Department of Natural Resources, Geological Survey, Open File LAB/1479.
BEAUDOIN, G., and CHIARADIA, M. 2016. Fluid mixing in orogenic gold deposits: Evidence from the H-O-Sr isotope composition of the Val-d'Or vein field (Abitibi, Canada). Chemical Geology, 437, 7–18.
CHANG,Z., HEDENQUIST, J.W., WHITE, N.C., COOKE, D.R., ROACH, M., DEYELL, C.L., GARCIA JR,J., GEMMELL, J.B., MCKNIGHT, S. & CUISON, A.L. 2011. Exploration Tools for Linked Porphyry and Epith-ermal Deposits: Example from the Mankayan Intrusion-Centered Cu-Au District, Luzon, Philippines. Economic Geology 106, 1365-1398.
CHISLETT, A. 1994. First year report of field work in Lab-rador July 8, to Sept. 16, 1993 Unpublished Assessment report, Archean Resources Ltd., 48 p. with appendices (available at http://gis.geosurv.gov.nl.ca/geofilePDFS/Batch06/PDF/LAB_1027.pdf)
CONLIFFE, J. 2015. Geological setting and genesis of high-grade iron-ore deposits in the eastern Labrador Trough. In: Newfoundland and Labrador Department of Natural Resources Geological Survey, Current Research Report 15-1, 1-25.
COX, R.A. 2003. Morphological, chemical, and geochro-nological techniques for characterizing detrital zircon. In: LENTZ, D.R., (ed.) Geochemistry of Sediments and Sedimentary Rocks: Evolutionary Considerations to Mineral Deposit-Forming Environment. Geological Association of Canada GEOtext 4, 105-120.
DEYSEL, K. 2007. Leucoxene study: a mineral liberation analysis (MLA) investigation. The South African Institute of Mining and Metallurgy 6th International Heavy Minerals Conference ‘Back to Basics’, 167-172.
DROST, K., WIRTH, R., KOŠLER, J., JØRGENSEN, H.F. & NTAFLOS, T. 2013. Chemical and structural relations of epitaxial xenotime and zircon substratum in sedimentary and hydrothermal environments: a TEM study. Contribu-tions Mineralogy and Petrology, 165, 737–756.
EVANS-LAMSWOOD, D.M., BUTT, D.P., JACKSON, R.S., LEE, D.V., MUGGRIDGE, M.G., WHEELER, R.I. & WILTON, D.H.C. 2000. Physical controls associated with the distribution of sulfides in the Voisey’s Bay Ni-Cu-Co deposit, Labrador. Economic Geology, 95, 749-769.
EVANS, D. T. W. 1995. Epigenetic gold occurrences eastern Dunnage Zone, Newfoundland. Newfoundland Depart-ment of Mines and Energy Mineral Resource Report 9.
FILIPPIDIS, A. 1985. Formation of awaruite in the system Ni-Fe-Mg-Si-O-H-S and olivine hydration with NaOH solution, an experimental study. Economic Geology, 80, 1974-1980.
GOVETT, G.J.S. 2013. Rock Geochemistry in Mineral Explo-ration. Elsevier.
GRANT, D.C., GOUDIE, D.J., SHAFFER, M. & SYLVES-TER, P. 2016. A single-step trans-vertical epoxy prepa-
continued on page 18

PAGE 18 NUMBER 174 EXPLORE
ration method for maximising throughput of iron-ore samples via SEM-MLA analysis. Applied Earth Science: Transactions of the Institutions of Mining and Metallurgy, Section B: Applied Earth Science 125, 57-62.
GYSI, A.P., WILLIAMS-JONES, A.E. & COLLINS, P. 2016. Lithogeochemical Vectors for Hydrothermal Processes in the Strange Lake Peralkaline Granitic REE-Zr-Nb De-posit. Economic Geology, 111, 1241–1276.
KELLEY, K.D., EPPINGER, R.G., LANG, J, SMITH, S.M. & FEY, D.L. 2011. Porphyry Cu indicator minerals in till as an exploration tool: example from the giant Pebble porphyry Cu-Au-Mo deposit, Alaska, USA. Geochemistry: Exploration, Environment, Analysis, 11, 321–334.
KERR, A. 2013. Rare-Earth-Element (REE) behaviour in the Strange Lake Intrusion, Labrador: Resource estimation using predictive methods. In: Newfoundland and Labrador Department of Natural Resources Geological Survey, Cur-rent Research Report 13-1, 117-136.
LIGHTFOOT, P.C., KEAYS, R.R., EVANS-LAMSWOOD, D. & WHEELER, R. 2012. S saturation history of Nain Plutonic Suite mafic intrusions: origin of the Voisey’s Bay Ni–Cu–Co sulfide deposit, Labrador, Canada. Mineralium Deposita, 47, 23–50.
MATEO, S. 2010. MLA v 3.0 Regional Training Manual 2010. Unpublished Report FEI Ltd.
McCLENAGHAN, M.B. 2007. Till Geochemistry and Indica-tor Mineral Methods for Exploration in Glaciated Terrain. Exploration 07 Workshop 2 Exploration Geochemistry: Basic Principles and Concepts (available at https://www.appliedgeochemists.org/images/stories/Exploration_07/B_McClenaghantill.pdf)
McCLENAGHAN, M.B, 2011. Overview of common process-ing methods for recovery of indicator minerals from sedi-ment and bedrock in mineral exploration. Geochemistry: Exploration, Environment, Analysis, 11, 265–278.
McCONNELL, J.W. & BATTERSON, M.J. 1987. The Strange Lake Zr-Y-Nb-Be-REE deposit Labrador; A geochemical profile in till, lake and stream sediment and water. Journal of Geochemical Exploration, 29, 105-127.
MILLER, R. 1990, The Strange Lake pegmatite-aplite–hosted rare-metal deposit, Labrador: In: Newfoundland Depart-ment of Mines and Energy, Current Research, Report 90-1, 171–182.
NALDRETT, A.J. 2013. Magmatic Sulfide Deposits: Geology, Geochemistry and Exploration. Springer.
PIETERSEN, K. PHAN, V.H., CHEN, W., LAM, A., DON-ALDSON A. & LASKER, R. 2009. Dataview 2009 Beta 2": Release notes for Build 2. Unpublished report JKTech Ltd.
PILLER, M.P. 2012. An examination of awaruite (Ni3Fe) formation during serpentinization of the Pipestone Pond ophiolitic complex in the Atlantic Lake area, central New-foundland. Unpublished BSc. (Hons.) dissertation, Memo-rial University of Newfoundland.
SILLITOE, R.H. 1994. Epithermal gold-silver-mercury depos-its at Paradise Peak, Nevada; ore controls, porphyry gold association, detachment faulting, and supergene oxidation. Economic Geology, 89, 1128-1248.
SYLVESTER, P.J. 2012. Use of the mineral liberation analyzer (MLA) for mineralogical studies of sediments and sedi-mentary rocks. In: SYLVESTER, P.J. (ed.) Quantitative Mineralogy and Microanalysis of Sediments and Sedimentary Rocks. Mineralogical Association of Canada Short Course 42, St. John’s, 1-16.
VERLEY, C.G. 2011. Report on the Decar Nickel Property Trembleur Lake Area (NTS 93K/13, 14), Omineca Mining Division, British Columbia, Canada. Unpublished Report for First PointMinerals Corporation (available on SEDAR http://www.sedar.com/).
WILTON, D. H.C., 2013. Report on MLA-SEM analyses of surface soil samples from the former Baie Verte Asbestos Mine, Baie Verte, NL. Unpublished Report for Centre for Applied Health Research, Memorial University of Newfound-land.
WILTON, D.H.C., THOMPSON, G.M. & EVANS-LAMS-WOOD, D. 2014. MLA-SEM examination of sulphide mineral breakdown (and preservation) in till, Voisey's Bay Ni-Cu-Co deposit, Labrador – The distribution and quan-titative mineralogy of weathered sulphide phases. Frederic-ton 2014 GAC/MAC program with abstracts, 290-291.
WILTON, D.H.C., THOMPSON, G.M. & EVANS-LAMS-WOOD, D. 2015. MLA-SEM examination of sulphide mineral breakdown and preservation in till, Voisey's Bay Ni-Cu-Co deposit, Labrador - The distribution and quantitative mineralogy of weathered sulphide phases in a transect from massive sulphide through gossanous regolith to till cover. In: Environmental and Economic Significance of Gossans, (ed.) M.-C. Williamson; Geological Survey of Canada, Open File 7718, 31-41.
WILTON, D.H.C. & WINTER, L.S.,2012. SEM-MLA (Scanning Electron Microprobe – Mineral Liberation Analyser) research on indicator minerals in glacial till and stream sediments – An example from the exploration for awarauite in Newfoundland and Labrador. In: SYLVES-TER, P.J. (ed.) Quantitative Mineralogy and Microanalysis of Sediments and Sedimentary Rocks. Mineralogical Asso-ciation of Canada Short Course 42, St. John’s, 265-283.
WILTON, D., WINTER, L., PATEY, B., MORGAN, J. & SEYMOUR, C. 2016. Indicator mineral fingerprints for base metals and gold: Developing a next generation drift prospecting tool. Prospectors and Developers Association of Canada. Exploration Insights 2016.
The use of automated indicator mineral analysis… continued from page 17
Association of Applied GeochemistsStudent Membership
$10 US
Encourage a student to join!

EXPLORE NUMBER 174 PAGE 19
Global-scale Geochemical Baselines Mapping: Steps forward in 2016David B. Smith ([email protected]); Xueqiu Wang ([email protected]); Alecos Demetriades ([email protected]); Patrice de Caritat ([email protected])
Left to right: Zhang Qin (Chief of Laboratory, IGGE), Patrice de Caritat, Shi Changyi (Deputy Director, IGGE), David Smith, Peng Xuanming (Director of IGGE and the Centre), Xueqiu Wang (Executive Director of the Centre), and Alecos Demetriades stand in front of the Centre’s new facility in Langfang, May 2016.
Global-scale geochemical mapping refers to conducting geochemical surveys of very large areas (millions of km2) of the Earth’s continents using very low sampling densities (1 site per a few thousand km2). This has been a subject of formal discussion and consideration in the geoscience com-munity since at least 1988 (see below). In 2016, two events occurred that have the potential to greatly further the cause of global-scale geochemical mapping. In May 2016, the United Nations Educational, Scientific, and Cultural Organization (UNESCO) International Centre for Global-Scale Geochemistry (hereafter referred to as ‘the Centre’) opened in Langfang, People’s Republic of China. This opening was followed in August by the International Union
of Geological Sciences (IUGS) establishing the Commission on Global Geochemical Baselines (hereafter referred to as ‘the Commission’). The purpose of this article is to describe each of these new organizations and to summarize the mis-sion of each. As will be seen, each organization has strong ties to the Association of Applied Geochemists (AAG).
IUGS Commission on Global Geochemical Baselines According to IUGS Bylaws, one of the primary objec-tives of IUGS Commissions is to “coordinate long-term in-ternational cooperative investigations to establish standards in appropriate fields.” The long-term mission of this Com-mission is to work with applied geoscientists throughout the
continued on page 20
PAGE 20 NUMBER 174 EXPLORE
world to standardize methods for conducting global-scale geochemical baseline studies. The new IUGS Commission is led by a four-person steering committee: David Smith (U.S. Geological Sur-vey, retired, and long-time AAG Secretary), Xueqiu Wang (Institute of Geophysical and Geochemical Exploration and UNESCO International Centre on Global-scale Geochem-istry, China, and current AAG Regional Councillor for Chi-na), Alecos Demetriades (Institute of Geology and Mineral Exploration, Greece, retired, and current AAG Fellow), and Patrice de Caritat (Geoscience Australia, former AAG Councillor and Society News editor for ELEMENTS). The Commission is essentially a continuation of the Task Group on Global Geochemical Baselines, which operated from 1997 to 2016 under the auspices of both IUGS and the International Association of GeoChemistry (IAGC). The Task Group, in turn, was a follow-on of Proj-ects 259 (International Geochemical Mapping, 1988–1992) and 360 (Global Geochemical Baselines, 1993–1997) of the International Geological Correlation Program (IGCP), now known as the International Geoscience Program. Both these projects were initiated under the leadership of Arthur G. Darnley (Geological Survey of Canada). The final report of IGCP 259, A global geochemical database for environ-mental and resource management (Darnley et al., 1995), was published by the Earth Sciences Division of UNESCO with financial support from IUGS, IAGC, Association of Exploration Geochemists (now the AAG), International Atomic Energy Agency, and the Royal Society. This report, fondly known in the geochemical mapping community as the Blue Book, is still the fundamental reference on global geochemical mapping and provides very useful information for geochemical mapping at any scale. Soon after publication of the Blue Book in 1995, the Directors of the Forum of European Geological Surveys (FOREGS) approved the first multi-national, continental-scale, multi-media geochemical mapping of Europe accord-ing to Blue Book specifications. The culmination of this project was the publication of the two-volume Geochemical Atlas of Europe (Salminen et al. 2005; De Vos et al. 2006). Other global-scale geochemical mapping projects have since been completed in Australia (Caritat and Cooper 2011), China (Wang et al. 2015), India, Mexico, and the United States (Smith et al. 2013, 2014). In 2008, the Task Group organized the First Arthur Darnley Symposium on Geochemical Mapping in conjunc-tion with the International Geological Congress (IGC) in Oslo. Organizing a symposium has continued every four years at the IGC in Brisbane (2012) and Cape Town (2016). The new Commission plans to convene the fourth Darnley symposium at the IGC in Delhi in 2020. More information about the activities of the Task Group can be found on its website at http://www.globalgeo-chemicalbaselines.eu/. Please note that this same URL will be used for the Commission in early 2017.
Global-scale Geochemical Baselines Mapping:… continued from page 19
UNESCO International Centre on Global-scale Geo-chemistry Although much progress was made during the tenure of the IUGS Task Group on Global Geochemical Baselines, the authors of the Blue Book recognized that it would be virtually impossible for such an ad hoc group of scientists, working under a non-government organization, to sustain and manage an international sampling effort to establish a global geochemical database. This was the impetus for the establishment of the new Centre. The Centre is a “Category 2” research centre operating under the auspices of UNESCO. Though not legally part of UNESCO, the Centre is associated with UNESCO through formal arrangements between UNESCO and the People’s Republic of China. The long-term mission of the Centre includes: (1) fostering knowledge and technology of global-scale geochemistry, (2) documenting the global concentra-tion and distribution of chemical elements in the Earth’s surface, (3) training scientists in global-scale geochemical mapping methods and providing technical assistance to de-veloping countries, and (4) developing a bridge from the sci-entific community to both decision makers and the general public in the field of global-scale geochemistry. The establishment of the Centre was spearheaded by Xie Xuejing (AAG Gold Medal recipient). In 2009, he presented a draft proposal to the attendees at the Global-scale Geochemical Mapping Symposium in Langfang. The revised proposal was signed by Xie Xuejing, David B. Smith, and Wang Xueqiu (co-leaders for the IUGS/IAGC Task Group on Global Geochemical Baselines). In 2010, the proposal was formally submitted to UNESCO and included a letter of support from AAG signed by AAG President Paul Morris. It took another six years for the proposal to gain official approval by UNESCO and the Chinese gov-ernment. In May, 2016, the festive opening ceremonies of the new Centre took place in Langfang in the Centre’s new seven-story building located on the premises of the Institute of Geophysical and Geochemical Exploration (IGGE). The new facility includes offices, chemical laboratories, sample storage space, a data centre and five apartments for visiting scientists. The Centre is led by a Director (Peng Xuanming, who is also the Director of IGGE) and an Executive Director (Xueqiu Wang). The functioning of the Centre is overseen by an international Governing Board and technical guid-ance is provided by a Scientific Committee composed of geoscientists from all over the world. The Centre has established a global cooperation net-work with 80 countries participating in the Global Geo-chemical Baselines Project and International Project on Mapping the Chemical Earth. In 2016, the Centre finan-cially and technically supported 12 countries (Mongolia, Russia, Laos, Cambodia, Indonesia, Papua New Guinea, Iran, Turkey, Mexico, Peru, Madagascar and Pakistan) to carry out global geochemical baselines mapping.
continued on page 21
EXPLORE NUMBER 174 PAGE 21
Although the missions of the Centre and Commis-sion overlap considerably, there is a notable difference. The Commission is tasked with establishing standards for global-scale geochemical baselines mapping, whereas the Centre is tasked with implementing these standards through international collaborative agreements with par-ticipating countries. Both the Centre and the Commission will work together to provide training in geochemical map-ping techniques, particularly for the developing countries. More information about the Centre can be found on its website (www.globalgeochemistry.com). Questions about either the Centre or the Commis-sion can be addressed to the corresponding authors of this article.
References
CARITAT, P. DE & COOPER, M. 2011. National Geochemical Survey of Australia: The Geochemical Atlas of Australia. Geoscience Australia Record 2011/20, 557 p (2 Volumes). Available at: http://www.ga.gov.au/metadata-gateway/meta-data/record/gcat_71973
DARNLEY, A.G., BJÖRKLUND, A., BØLVIKEN, B., GUS-TAVSSON, N., KOVAL, P.V., PLANT, J.A., STEENFELT, A., TAUCHID, M., XUEJING, X., GARRETT, R.G. & HALL, G.E.M. 1995. A global geochemical database for environmental and resource management. Final report of IGCP Project 259. Earth Sciences, 19, UNESCO Publish-ing, Paris. Available at: http://www.globalgeochemicalbase-lines.eu/wp-content/uploads/2012/07/Blue_Book_GGD_IGCP259.pdf
DE VOS, W., TARVAINEN, T., SALMINEN, R., REEDER, S., DE VIVO, B., DEMETRIADES, A., PIRC, S., BATISTA, M.J., MARSINA, K., OTTESEN, R.T., O’CONNOR, P.J., BIDOVEC, M., LIMA, A., SIEWERS, U., SMITH, B., TAYLOR, H., SHAW, R., SALPETEUR, I., GREGO-RAUSKIENE, V., HALAMIC, J., SLANINKA, I., LAX, K., GRAVESEN, P., BIRKE, M., BREWARD, N., ANDER, E.L., JORDAN, G., DURIS, M., KLEIN, P., LOCUTURA, J., BEL-LAN, A., PASIECZNA, A., LIS, J., MAZREKU, A., GILUCIS, A., HEITZMANN, P., KLAVER, G. & PETERSELL, V. 2006. Geochemical Atlas of Europe. Part 2 - Interpretation of Geochemical Maps, Additional Tables, Figures, Maps, and Related Publications. Geological Survey of Finland, Espoo, 692 p. Available at: http://weppi.gtk.fi/publ/foregsatlas/
SALMINEN, R., BATISTA, M.J., BIDOVEC, M., DEME-TRIADES, A., DE VIVO, B., DE VOS, W., DURIS, M., GILUCIS, A., GREGORAUSKIENE, V., HALAMIC, J., HEITZMANN, P., LIMA, A., JORDAN, G., KLAVER, G., KLEIN, P., LIS, J., LOCUTURA, J., MARSINA, K., MAZ-REKU, A., O’CONNOR, P.J., OLSSON, S.Å., OTTESEN, R.T., PETERSELL, V., PLANT, J.A., REEDER, S., SAL-PETEUR, I., SANDSTRÖM, H., SIEWERS, U., STEEN-FELT, A. & TARVAINEN, T., 2005. FOREGS Geochemical Atlas of Europe, Part 1:Background Information, Methodol-ogy and Maps. Geological Survey of Finland, Espoo, 526 p. Available at: http://weppi.gtk.fi/publ/foregsatlas/
SMITH, D.B., CANNON, W.F., WOODRUFF, L.G., SOLANO, F., KILBURN, J.E. & FEY, D.L. 2013. Geochemical and mineralogical data for soils of the conterminous United
States. U.S. Geological Survey Data Series 801. Available at: http://pubs.usgs.gov/ds/801/
SMITH, D.B., CANNON W.F., WOODRUFF, L.G., SOLANO, F. & ELLEFSEN, K.J. 2014. Geochemical and mineralogi-cal maps for soils of the conterminous United States. U.S. Geological Survey Open-File Report 2014-1082. Available at: http://pubs.usgs.gov/of/2014/1082/
WANG, X. & THE CGB PROJECT TEAM 2015. China Geo-chemical Baselines: Sampling Methodology. In: A. DEME-TRIADES, M. BIRKE, S. ALBANESE, I. SCHOETERS & B. DE VIVO (Guest Editors), Special Issue: Continental, re-gional and local scale geochemical mapping. Journal of Geo-chemical Exploration, 154, 17-31. Available at: http://www.sciencedirect.com/science/article/pii/S0375674214001848
Global-scale Geochemical Baselines Mapping:… continued from page 20
From the EXPLORE Archives… The EXPLORE archives on the AAG website are an invaluable reference tool and provides a record of how our industry is constantly changing. In this edition of EXPLORE, we are highlighting an article that was pub-lished in April 1997, (EXPLORE issue 95). The “Technical Note: SEARCHMAP – Interactive Map Interpretation System for Mineral Exploration” de-scribes how software can be used for data presentation and interpretation purposes. To read the article, please click on: https://www.appliedgeochemists.org/images/Explore/Explore,%20Number%2095%20April%201997.PDF. Software continues to play an increasingly important role in our industry. Continued improvements in instru-mentation provides lower detection limits and a wider array of elements than could ever have been dreamt of 20 years ago. It is interesting to consider how software has evolved in order to keep up with datasets that become progressively larger and more complex with time. It also brings up questions of how software is being used in risk reduction or the decision making process. What sort of limitations are imposed by software? Human thought vs. software predictions? The questions posed are virtually endless – but consider the role that software currently has in your career versus 20 years ago. We expect it would be a rather lively debate. By highlighting an article from the EXPLORE ar-chives, we hope to promote discussion and encourage you to revisit a publication or perhaps reconnect with an author. Old ideas that may have been overlooked could provide solutions for current problems. Please visit the EXPLORE archives by clicking https://www.appliedgeo-chemists.org/index.php/publications/explore-newsletter/2-uncategorised/93-explore-issues.
David Leng, RGCI

PAGE 22 NUMBER 174 EXPLORE
The understanding of whether or not the multiple Ni-Mo-Zn-PGE mineralized showings and prospects that are exposed over several hundred kilometers in the Yu-kon, Canada are part of a single time-stratigraphic layer would have major exploration implications for this style of mineralization. A new method for imaging conodont elements reported here may provide age constraints for these mineralized shales. Conodont elements are feeding apparatuses of eel-like marine chordates comprising the mineral hydroxylapatite (but commonly altered to fluorapa-tite during diagenesis). They are widespread throughout Paleozoic strata and are commonly used as index fossils for Paleozoic epochs. We have identified, during optical microscopic examination of polished thin sections, the pres-ence of abundant conodont elements within Devonian-aged hyper-enriched black shale (HEBS) Ni-Mo-Zn-PGE de-posits in the Yukon Territory, Canada, that were previously overlooked. These conodont elements may provide key information on regional biostratigraphic correlation of the geographically widespread mineralized layer. Correct iden-tification of conodont subspecies requires documentation of 3D morphology, but extraction of conodont elements from indurated shales is typically problematic and requires the use of harmful, environmentally deleterious reagents (e.g., hydrofluoric acid). The conodont elements are very delicate and physical and chemical extraction methods may frac-ture or destroy ornamentation. Our previous attempts at extraction using electric pulse disaggregation resulted in the destruction of these microfossils. However, recent advances in high-energy x-ray micro-computed tomography allow detailed, ultra-high-resolution (5 micron), 3D models of the
Technical Note: In situ 3D modelling of conodonts using x-ray micro-tomographyMichael Gadd1, Jan Peter1, Fred Gaidies2, and Sofie Gouwy3
1Geological Survey of Canada, 601 Booth Street Ottawa, ON, CANADA K1A 0E8; 2Department of Earth Scienc-es, Carleton University, 1125 Colonel By Drive, Ottawa, ON, CANADA K1S 5B6; 3Geological Survey of Canada, 3303 33rd Street NW Calgary, AB, CANADA T2L 2A7
conodont elements inside intact rock samples (Fig. 1) to be constructed. Such models could potentially be used to iden-tify key conodont subspecies, which are typically confined to narrow zones within Paleozoic epochs and thus provide age constraints for the HEBS layer that are currently lacking. High-energy x-ray micro-computed tomography has other important applications to support mineral exploration. For example, these methods can be used to image indicator minerals to characterize surface textures and determine distance of transport from source.
Figure 1: X-ray microtomography-generated 3D models of con-odont elements within semi-massive sulfides of the HEBS layer at Peel River.
David Cohen David has been a Fellow of AAG since 1997. He obtained a BSc (hons) in 1983 from Sydney, an MSc in 1986 from Queen’s University, and a PhD in 1990 from UNSW. David has been at the University of New South Wales from 1991 to present where he is a Lecturer and researcher. Currently, he is head of the School of Biologi-cal, Earth and Environmental Sciences. David is a former Vice President and Presi-dent of the AAG and is currently the AAG’s Symposia Coordinator, Chair of the AAG-SGS Student Paper Prize Committee, AAG’s representative on the Australian Geoscience Council, and chair of the Education Committee. He has undertaken re-search and taught geochemistry for over 30 years, including work on biogeochemistry, selective extractions and regional mapping at the University of New South Wales. He was the 2013 AusIMM visiting lecturer to New Zealand. He has supervised a sub-stantial number of honours and postgraduate students and attended 12 IAGS. He is committed to helping develop and implement the new strategic plan for the AAG.
AAG 2017-2018 Ordinary Councillors
continued on page 23

EXPLORE NUMBER 174 PAGE 23
continued on page 24
Juan Carlos Ordóñez Calderón Juan Carlos has been a Fellow of AAG since 2014. In 2001, he obtained his B.Sc. in ge-ology at the Universidad Industrial de Santander in Colombia, and gradu-ated with the Summa Cum Laude distinction. He holds a M.Sc. and a Ph.D. in geochemistry and petrology, respec-tively, from Shimane University (2003) in Ja-pan and the University of Windsor (2008), Canada. Follow-ing his Ph.D., he started an industry-oriented postdoctoral fellowship funded by NSERC, MERC-Laurentian Univer-sity, the Geological Survey of Canada-TGI3 Initiative, and Hudbay. In 2010, he worked for the Ontario Geological Survey as a Precambrian Geoscientist. Later he opted for a career as a corporate geoscientist and since 2011 he has worked as an applied geochemist for Hudbay in Toronto. Juan Carlos unique expertise resides in the integration of geochemistry and field methods of physical volcanology and structural geology to evaluate projects at mine to regional scale. Motivated by the large volume of geoscience data typically generated in the mining industry, over the past 6 years he has applied compositional data analysis and advanced data analytics techniques for exploration and min-ing projects. His geochemical work along the Americas has covered diverse mineral systems including porphyry, skarn, VMS, IOCG, sediment hosted, and epithermal deposits. Juan Carlos advocates collaborative work between industry, government, and academia in order to solve the most im-mediate needs of society without leaving future generations lacking of the necessary foundations for future applications.
Ray Lett Ray obtained a B.Sc. at the University of London, UK, in 1968, a M.Sc. University of Leicester, UK in 1970, and a Ph.D. from the University of British Co-lumbia in 1979. He is a geochemical consultant and university sessional lecturer in geochemistry and economic geol-ogy at the University of Victoria, Canada. He was a laboratory supervisor and senior geochemist for the British Columbia Geological Survey between 1990-2010. Prior to that he was a geochemist for Barringer Research/Magenta from 1980 to 1990 and an exploration geochemist/
geologist for Amax Exploration/Fox Geological/BP Miner-als in Vancouver, BC between 1970 and 1979. Ray served as AAG Secretary 1980 to 1985; as a Councillor: 1990 - 1992, 1999-2000, 2006-2009; member of the AAG Education Committee 2010-2014 and the Strategy Committee 2016-2017. Ray retired from the BC Geological Survey after 20 years with government as a geochemist and now spends his time consulting, teaching (part time) undergraduate uni-versity courses in geochemistry and economic geology and serving on various geoscience committees. Since joining the Association in 1972, he has seen it evolve from an organiza-tion primarily aimed at encouraging the use of geochemistry for mineral exploration to one that is now a leading advo-cate for applying the science to a wider range of applica-tions including environmental and urban geochemistry and geoanalysis..
Renguang Zuo Dr. Renguang Zuo became a Fellow of AAG in 2016. He received his Ph.D. degree from the China University of Geosciences (CUG) in 2009. As a jointly super-vised PhD candidate by CUG and York Univer-sity (Toronto, Canada), Renguang studied for one year at the York University (supervisors: Prof. Qiuming Cheng and Prof. Frits Agterberg) during 2007-2008. He has been working at the state key laboratory of geological processes and mineral resources (GPMR) at CUG since he obtained Ph.D. in 2009. In the end of 2012, he was promoted as a full profes-sor. In 2014, as a senior visiting scholar, he worked together with John Carranza for four months at the James Cook University (Townsville, Australia). He is currently serving as an associate editor for Journal of Geochemical Exploration (JGE) and Nature Resources Research. As a guest editor, he organized two special issues (JGE, 2012, v.122, and 2016, v.164) related to geochemical mineral exploration. He and John Carranza are currently organizing another special issue of current methods of data analysis for geochemical mineral exploration in GEEA. He also acted as a conve-ner of GIS-based geochemical mineral exploration both in Goldschmidt (2016, Japan) and in 35th International Geological Congress (IGC, 2016, South Africa). Renguang has published more than 60 peer-reviewed papers. He was awarded the Kaharaka Award by the International Associa-tion of GeoChemistry in 2015 due to his contributions to applied geochemistry. Renguang’s work documented the advance of GIS-based geochemical mineral exploration, and build a wide range of international cooperation.
AAG 2017-2018 Ordinary Councillors… continued from page 23
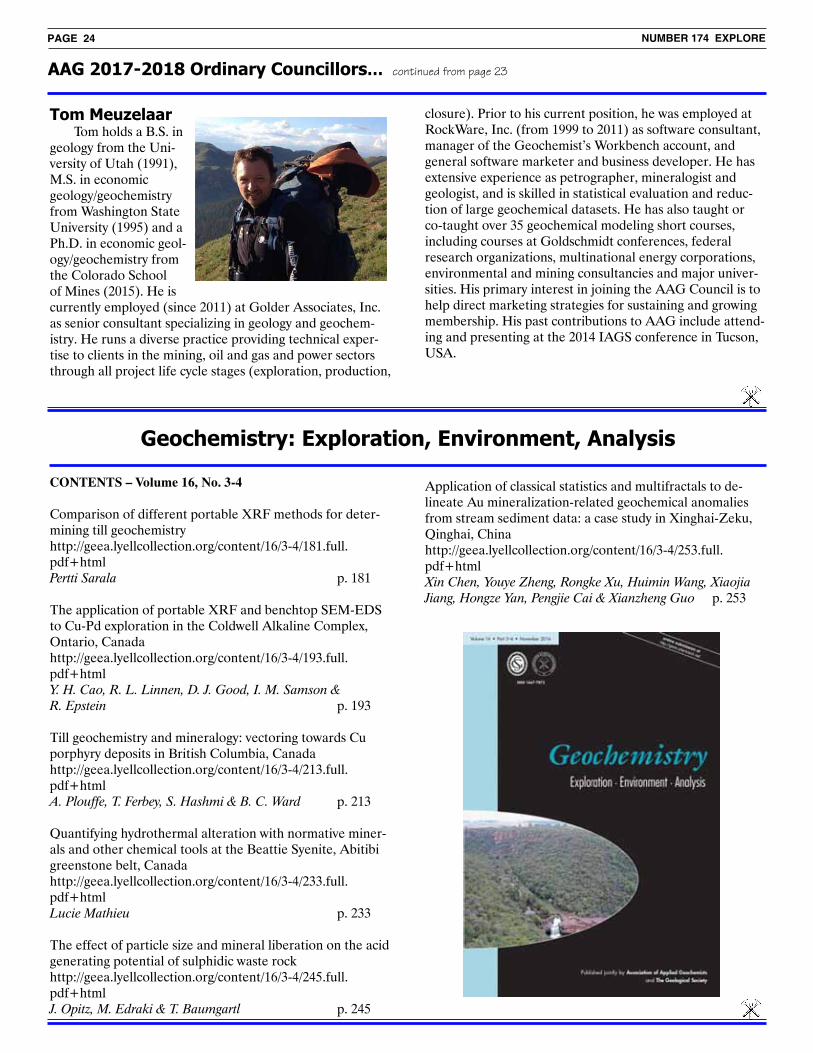
PAGE 24 NUMBER 174 EXPLORE
AAG 2017-2018 Ordinary Councillors… continued from page 23
Tom Meuzelaar Tom holds a B.S. in geology from the Uni-versity of Utah (1991), M.S. in economic geology/geochemistry from Washington State University (1995) and a Ph.D. in economic geol-ogy/geochemistry from the Colorado School of Mines (2015). He is currently employed (since 2011) at Golder Associates, Inc. as senior consultant specializing in geology and geochem-istry. He runs a diverse practice providing technical exper-tise to clients in the mining, oil and gas and power sectors through all project life cycle stages (exploration, production,
CONTENTS – Volume 16, No. 3-4
Comparison of different portable XRF methods for deter-mining till geochemistryhttp://geea.lyellcollection.org/content/16/3-4/181.full.pdf+html Pertti Sarala p. 181
The application of portable XRF and benchtop SEM-EDS to Cu-Pd exploration in the Coldwell Alkaline Complex, Ontario, Canadahttp://geea.lyellcollection.org/content/16/3-4/193.full.pdf+html Y. H. Cao, R. L. Linnen, D. J. Good, I. M. Samson & R. Epstein p. 193
Till geochemistry and mineralogy: vectoring towards Cu porphyry deposits in British Columbia, Canadahttp://geea.lyellcollection.org/content/16/3-4/213.full.pdf+html A. Plouffe, T. Ferbey, S. Hashmi & B. C. Ward p. 213
Quantifying hydrothermal alteration with normative miner-als and other chemical tools at the Beattie Syenite, Abitibi greenstone belt, Canadahttp://geea.lyellcollection.org/content/16/3-4/233.full.pdf+html Lucie Mathieu p. 233
The effect of particle size and mineral liberation on the acid generating potential of sulphidic waste rockhttp://geea.lyellcollection.org/content/16/3-4/245.full.pdf+html J. Opitz, M. Edraki & T. Baumgartl p. 245
Geochemistry: Exploration, Environment, Analysis
closure). Prior to his current position, he was employed at RockWare, Inc. (from 1999 to 2011) as software consultant, manager of the Geochemist’s Workbench account, and general software marketer and business developer. He has extensive experience as petrographer, mineralogist and geologist, and is skilled in statistical evaluation and reduc-tion of large geochemical datasets. He has also taught or co-taught over 35 geochemical modeling short courses, including courses at Goldschmidt conferences, federal research organizations, multinational energy corporations, environmental and mining consultancies and major univer-sities. His primary interest in joining the AAG Council is to help direct marketing strategies for sustaining and growing membership. His past contributions to AAG include attend-ing and presenting at the 2014 IAGS conference in Tucson, USA.
Application of classical statistics and multifractals to de-lineate Au mineralization-related geochemical anomalies from stream sediment data: a case study in Xinghai-Zeku, Qinghai, Chinahttp://geea.lyellcollection.org/content/16/3-4/253.full.pdf+html Xin Chen, Youye Zheng, Rongke Xu, Huimin Wang, Xiaojia Jiang, Hongze Yan, Pengjie Cai & Xianzheng Guo p. 253
EXPLORE NUMBER 174 PAGE 25
Exploration ‘17 October 21 to 25, 2017, Toronto, Canada
Exploration ‘17 is the sixth of the very successful series of DMEC decennial mining exploration conferences, which have been held in the seventh year of every decade
starting in 1967. The theme of the Exploration ’17 conference is “Integrating the Geosciences: The Challenge of Discovery”, featuring a multi-national, multi- disciplinary technical programme, exhibition, workshops and field schools.
www.exploration17.com/About.aspx
PostersDeadline for Poster Abstracts: January 31st, 2017. A style guide and template is available from www.exploration17.com
Program Schedule Oral presentations are by invitation only
http://www.exploration17.com/Program-Schedule.aspx
WorkshopsWorkshop 1 - Uncertainty in 3D modelling and Inversion
Workshop 2 - Integrated Spectral Geology
Workshop 3 - Advanced Concepts in Evaluating & Interpreting Geochemical Data
Workshop 4 - Integrated Interpretation - Modelling of Geological & Geophysical Data for Mineral Exploration
Workshop 5 - Application of Indicator Mineral Methods to Bedrock & Sediments
Workshop 6 - Advances in Geophysical Technology
Workshop 7 - Seismic Methods & Exploration
Workshop 8 - Improving Exploration with Petrophysics: The Application of Magnetic Re-manence & Other Rock Physical Properties to Geophysical Targeting
Workshop 9 - Status & New Developments in Field Portable Geochemical Techniques and Site Technologies for Mineral Exploration
Workshop 10 - Future of Mineral Exploration Drilling & Sampling
Workshop 11 - Assay Quality Control: The Master Class
Workshop 12 - SEG DISC 2017, EM Fundamentals and Applications
Workshop 13: Data Integration for the Next Generation of Mineral Exploration Models
Workshop 14 - Making Your Case: Clear, Memorable & Compelling
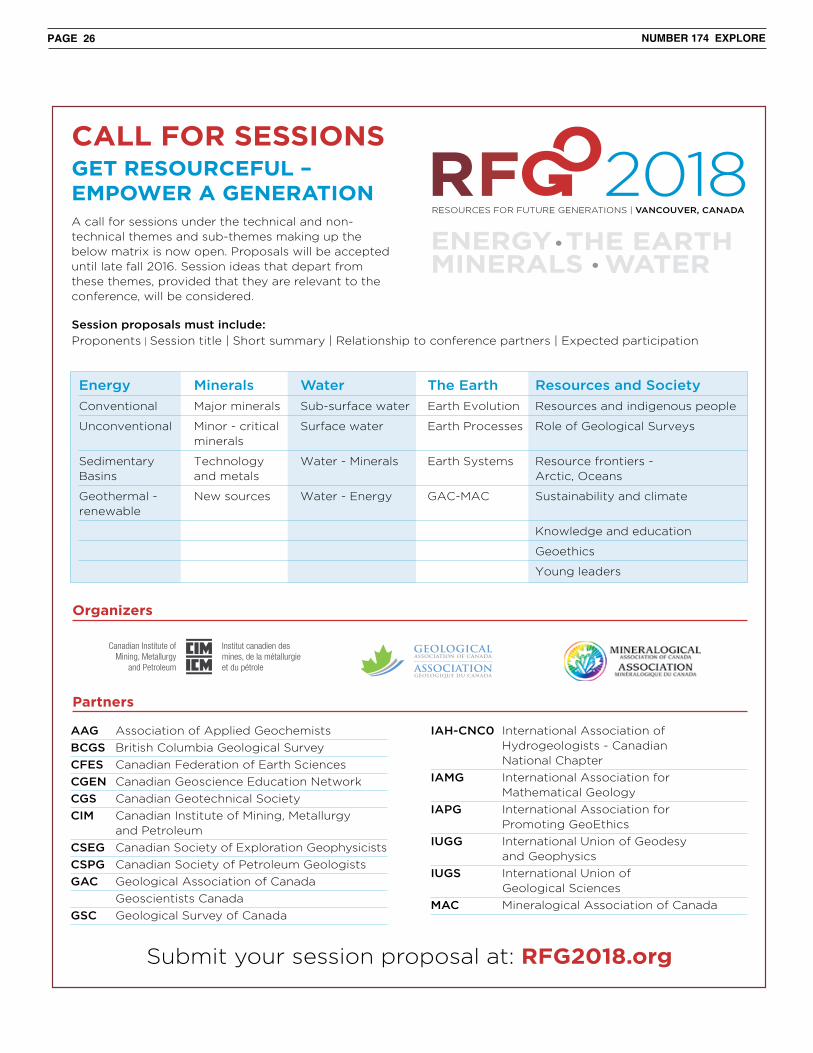
PAGE 26 NUMBER 174 EXPLORE
Our host city: VancouverEnjoy the spectacular recreational and cultural activities that this affordable, green, accessible and multi-cultural city has to offer.
The Vancouver Convention Centre is the world’s first LEED® Platinum-certified convention centre with excellent facilities and a stunning view.
What can you expect from RFG 2018?This conference aims to provide participants with a program that will explore four vital themes: energy, minerals, water and the earth.
Grounded in geoscience, the conference will serve as a forum for industry stakeholders to discuss their research initiatives and activities as well as the key issues and trends shaping the future of energy, minerals and water resources including the science of the earth that underpins their sustainable discovery and extraction.
Who will attend?This joint venture is estimated to attract 4,000 to 5,000 scientists, policy-makers, industry representatives and members of civil society.
CALL FOR SESSIONSGET RESOURCEFUL – EMPOWER A GENERATIONA call for sessions under the technical and non-technical themes and sub-themes making up the below matrix is now open. Proposals will be accepted until late fall 2016. Session ideas that depart from these themes, provided that they are relevant to the conference, will be considered.
Session proposals must include:
Proponents | Session title | Short summary | Relationship to conference partners | Expected participation
Education4-day technical program2,500+ oral presentations and poster sessionsDaily plenary followed by themed keynotes
DiscoveryShort courses and field trips
Community4,000 to 5,000 Canadian and international participants
Exhibition3-day trade show
Students & Emerging LeadersSpecial events and sessions dedicated to students and emerging leaders
NetworkingKnowledge exchange and business opportunities Partners
Organizers
AAG Association of Applied Geochemists
BCGS British Columbia Geological Survey
CFES Canadian Federation of Earth Sciences
CGEN Canadian Geoscience Education Network
CGS Canadian Geotechnical Society
CIM Canadian Institute of Mining, Metallurgy and Petroleum
CSEG Canadian Society of Exploration Geophysicists
CSPG Canadian Society of Petroleum Geologists
GAC Geological Association of Canada
Geoscientists Canada
GSC Geological Survey of Canada
IAH-CNC0 International Association of Hydrogeologists - Canadian National Chapter
IAMG International Association for Mathematical Geology
IAPG International Association for Promoting GeoEthics
IUGG International Union of Geodesy and Geophysics
IUGS International Union of Geological Sciences
MAC Mineralogical Association of Canada
Submit your session proposal at: RFG2018.org
Energy Minerals Water The Earth Resources and Society
Conventional Major minerals Sub-surface water Earth Evolution Resources and indigenous people
Unconventional Minor - critical Surface water Earth Processes Role of Geological Surveys minerals
Sedimentary Technology Water - Minerals Earth Systems Resource frontiers - Basins and metals Arctic, Oceans
Geothermal - New sources Water - Energy GAC-MAC Sustainability and climate renewable
Knowledge and education
Geoethics
Young leaders

EXPLORE NUMBER 174 PAGE 27
CALENDAR OF EVENTSInternational, national, and regional meetings of interest to colleagues working in exploration, environmental and other areas of applied geochemistry. These events also appear on
the AAG web page at: www.appliedgeochemists.org.
Please let us know of your events by sending details to:Steve Amor
Geological Survey of Newfoundland and LabradorP.O. Box 8700, St. John’s, NL, Canada, A1B 4J6
Email: [email protected] Tel: +1-709-729-1161
201720-26 MARCH 48th Lunar and Planetary Science Confe- ence. Woodlands TX USA. Website: www. hou.usra.edu/meetings/lpsc201711-14 APRIL 25th International Mining Congress and Exhibition of Turkey. Antalya Turkey. Website: imcet.org.tr/defaulten.asp22-23 APRIL Petrochronology: Methods and Applica- tions. Vienna Austria. Website: vienna2017. petrochronology.org23-28 APRIL European Geosciences Union General Assembly 2017. Vienna Austria. Website: tinyurl.com/j3ff8wn27-28 APRIL 3rd International Conference on Geographical Information Systems: Theory, Applications and Management. Porto Portugal. Website: www.gistam.org30 APRIL-3 MAY Canadian Institute of Mining, Metallurgy, and Petroleum 2017 Conference & Exhib- tion. Montreal QC Canada. Website: conven- tion.cim.org/en/Montreal/2017/Home.aspx6-11 MAY European Workshop on Modern Develop- ments and Applications in Microbeam Analysis. Konstanz Germany. Website: www.microbeamanalysis.eu/9-11 MAY 8th World Conference on Sampling and Blending (WCSB8). Perth WA Australia. Website: www.wcsb8.com/11-12 MAY 19th International Conference on Earth Science and Climate Change. Montreal QC Canada. Website: waset.org/conference/ 2017/05/montreal/ICESCC14-18 MAY Geological Association of Canada/Miner- alogical Association of Canada Annual Meeting. Kingston ON Canada. Website: www.kingstongacmac.ca/15-17 MAY XVIth International Conference: Geoinfor- matics, Theoretical and Applied Aspects. Kyiv Ukraine. Website: tinyurl.com/j54kayw4-7 JUNE 14th International Estuarine Biogeochem- istry Symposium. Rimouski QC Canada. Website: www.iebs2017.com/4-7 JUNE FUTORES II — Future understanding of tectonics, ores, resources, environment and sustainability. Townsville Qld Australia. Website: www.jcu.edu.au/futores4-9 JUNE Interior of the Earth (Gordon Research Conference). South Hadley MA USA. Website: www.grc.org/programs. aspx?id=147625-9 JUNE 13th International Congress of Applied Mineralogy Taranto Italy. Website: www.scientevents.com/amam-icam2017
5-9 JUNE 7th International Workshop on Composi- tional Data Analysis. Siena Italy. Website: www.compositionaldata.com/codawork20176-8 JUNE 7th International Conference on Environ- mental Pollution and Remediation. Rome Italy. Website: icepr.org11-14 JUNE 1st Geobiology Society Conference. Banff AB Canada. Website: cms.eas.ualberta.ca/ Geobiology201711-16 JUNE 11th International Symposium on Geochem- istry of the Earth’s Surface. Guiyang China. Website: www.datas-online.net/ges2017/12-14 JUNE 14th Australasian Environmental Isotope Conference. Wellington New Zealand. Website: tinyurl.com/juoqtqy13-15 JUNE PEG2017 – 8th International Symposium on Granitic Pegmatites. Kristiansand Norway. Website: tinyurl.com/h8hwo9g23-28 JUNE Tourmaline 2017. Nové Město na Moravě Czech Republic. Website: tourmaline2017.cz25-30 JUNE Catchment Science: Interactions of Hydrol- ogy, Biology & Geochemistry. Lewiston ME USA. Website: tinyurl.com/zst629v26–30 JUNE 14th International Conference on Sustain- able Use and Management of Soil, Sediment and Water Resources – AquaConSoil 2017. Lyon France. Website: www.aquaconsoil.org30 JUNE-4 JULY 33rd International conference of the Society for Environmental Geochemistry and Health. Guangzhou China. Website: segh2017.csp.escience.cn4-8 JULY 32nd International conference of Society for Environmental Geochemistry and Health. Brussels Belgium. Website: segh-brussels.sciencesconf.org/16-20 JULY International Conference on the Biogeo- chemistry of Trace Elements. Zurich Switzerland. Website: icobte2017.ch/16-21 JULY 13th International Conference on Mercury as a Global Pollutant Providence RI USA. Website: mercury2017.org/initial/index.php23-28 JULY 80th Annual Meeting of the Meteoritical Society. Santa Fe NM USA. Website: metsoc2017-santafe.com23-28 JULY Chemical Oceanography (Gordon Research Conference). New London NH USA. Website: www.grc.org/programs.aspx?id=1109630 JULY-4 AUG Atmospheric Chemistry (Gordon Research Conference). Newry, ME USA. Website: www.grc.org/programs.aspx?id=109164-9 AUGUST Magmatism of the Earth and related strategic metal deposits. Miass Russia. Website: magmas-and-metals.ru
continued on page 28
PAGE 28 NUMBER 174 EXPLORE
CALENDAR OFEVENTScontinued from page 27
Gwendy E.M. Hall, Treasurer 110 Aaron Merrick Drive Merrickville, ON K0G 1N0 Canada TEL: +1-613-269-7980 email: [email protected]
David B. Smith, Secretary U.S. Geological Survey Box 25046, MS 973 Denver, CO 80225, USA TEL: (303) 236-1849 email: [email protected]
Al ArseneaultP.O. Box 26099, 72 Robertson Road, Ottawa, ON K2H 9R0 CANADA,
TEL: (613) 828-0199 FAX: (613) 828-9288, e-mail: [email protected]
THE ASSOCIATION OF APPLIED GEOCHEMISTSP.O. Box 26099, 72 Robertson Road, Ottawa, Ontario K2H 9R0 CANADA • Telephone (613) 828-0199
www.appliedgeochemists.org
AAG COMMITTEES
COUNCILLORS
Brazil João Larizzatti [email protected] Brian Townley [email protected] Xueqiu Wang [email protected]
Northern Europe Pertti Sarala [email protected] Europe Benedetto De Vivo [email protected] Asia Iftikar Malik [email protected]
Southern Africa Theo Davies [email protected] and Republic of Ireland Kate Knights [email protected]
Ryan Noble, President CSIRO P.O. Box 1130 Bentley, Australia 6102 TEL: +61 8 6436 8684 email: [email protected]
Steve Cook, Vice-President Teck Resources Limited Suite 3300, 550 Burrard Street Vancouver, BC Canada V6C 0B3 TEL: +1 604 699 4329 email: [email protected]
New MembershipNigel Radford, [email protected] Awards and MedalsMatt Leybourne [email protected] BennPertti Sarala Romy Matthies
AdmissionsNigel Radford, [email protected] EducationPaul Morris, [email protected]
SymposiaDavid Cohen, [email protected]
2016-2017 Dennis Arne Mel Lintern Romy Matthies Paul Morris Erick Weiland Matthew Leybourne (exofficio)
AAG COORDINATORS
AAG Student Paper PrizeDavid Cohen, [email protected]
AAG WebsiteGemma Bonham-Carter, [email protected] Coordinator: Bruno Lemiere, [email protected]
Geoscience CouncilsDavid Cohen, [email protected]
GEEAKurt Kyser, [email protected]
EXPLOREBeth McClenaghan, [email protected]
ELEMENTSDennis Arne, [email protected]
AAG Regional CouncillorsStephenCook,[email protected]
2017-2018 Dave Cohen Ray Lett Tom Meuzelaar Juan Carlos Ordóñez Calderón Renguang Zuo
OFFICERSJanuary - December 2017
6-10 AUGUST Microscopy & Microanalysis 2017. St Louis MO USA. Website: microscopy.org/MandM/201712-17 AUGUST 21st World Congress of Soil Science. Rio de Janeiro Brazil. Website: 21wcss.org/13-17 AUGUST 5th International Conference on Selenium in the Environment and Human Health. Stockholm Sweden. Website: se2017.se13-18 AUGUST Goldschmidt 2017. Paris France. Website: goldschmidt.info/201720-23 AUGUST 14th Biennial SGA Meeting. Quebec City QC Canada. Website: sga2017.ca/20-29 AUGUST 12th International Eclogite Conference. Åre Sweden. Website: www.geology.lu.se/IEC1228 AUGUST- 7th International Conference on Medical1 SEPTEMBER Geology. Moscow Russia. Website: www.medgeo2017.org2-9 SEPTEMBER 18th Annual Conference of International Association for Mathematical Geosciences. Fremantle WA Australia. Website: iamg2017.com11-14 SEPTEMBER SIAM Conference Mathematical and Computational Issues in the Geosciences. Erlangen Germany. Website: www.siam.org/meetings/gs17
17-20 SEPTEMBER SEG 2017. Beijing China. Website: www.seg2017.org/17-22 SEPTEMBER 28th International Meeting on Organic Geochemistry. Florence Italy. Website: www.houseofgeoscience.org/imog/18-19 SEPTEMBER 19th International Conference on Gas Geochemistry. Rome Italy. Website: www. waset.org/conference/2017/09/rome/ICGG18-22 SEPTEMBER 11th International Kimberlite Conference. Gaborone Botswana. Website: www.11ikc.com25-29 SEPTEMBER 23rd International Symposium on Envi- ronmental Biogeochemistry. Palm Cove QLD Australia. Website: www.iseb23.info21-25 OCTOBER Exploration ‘17. Toronto ON Canada. Website: www.exploration17.com22-25 OCTOBER GSA Annual Meeting. Seattle WA USA. Website: www.geosociety.org/meetings/2017/31 OCTOBER- 10th Fennoscandian Exploration and 2 NOVEMBER Mining. Levi Finland. Website: fem.lappi.fi/en7-8 DECEMBER 19th International Conference on Nuclear and Environmental Radiochemical Analysis. Sydney NSW Australia. Website: tinyurl.com/jsh9gsu201816-21 JUNE 28th International Applied Geochemistry Symposium. Vancouver BC Canada. Website: rfg2018.org8-13 JULY Geoanalysis 2018. Sydney NSW Australia. Website: 2018.geoanalysis.info
AAG BUSINESS MANAGER