The U.S. Petroleum Crisis of 1979 - Brookings Institution€¦ · PHILIP K. VERLEGER, JR. Yale...
14
PHILIP K. VERLEGER, JR. Yale University TheU.S. Petroleum Crisis of 1979 THE UNITED STATES experienced the second petroleum crisisof the de- cade in 1979. American consumers were told that the cause of the crisis was a decline in Iranian oil production from 5.8 million barrels a day (mmbd) in July 1978 to 445,000 barrels a day (mbd) in January 1979. The short-run consequences of the crisis wereshortages of dieselfuel and gasoline during the monthsof May, June, and July. At the peak of the crisisthe gasoline lineswereas long as or longer thanthosein 1974. There were also suggestions that heating oil would be in short supply in the 1979-80 winter.The long-run consequences are higherprices of gaso- line, heating oil, residualfuel oil and, eventually,higher prices of all productsderived frompetroleum. Many have asked whetherthe higherprices and the shortages were necessary, especially since the United Statesseemedto have experienced greater shortages and price increases than any of its European allies. By piecing together the preliminary information on supplyand demand, this paperattempts to answer suchquestions. The analysis focuseson acquisi- tion by refineries of crude oil, refinery production, adjustments of product inventories, and finalsales to consumers in the firsthalf of 1979. It indi- cates that "normal" levels of refinery input and petroleumproduction and modest price increases occurred during the first quarter. In the second quarter, however,the output of refinedproducts fell short of projected sales. In addition, the distribution of refined products was substantially curtailed. The resultwas a rapidbuildupof inventories, shortages, and Note: I thank Paul W. MacAvoy, David C. Munro, Emil M. Sunley, and mem- bers of the Brookingspanel for their helpful comments that led to improvementsin this paper. The research for this paper was supported by a grant to the Research Program in Government and Business at the School of Organizationand Manage- ment, Yale University;that support is gratefully acknowledged. 0007-2303179/0002-0463$00.25/O ? Brookings Institution
Transcript of The U.S. Petroleum Crisis of 1979 - Brookings Institution€¦ · PHILIP K. VERLEGER, JR. Yale...

PHILIP K. VERLEGER, JR.
Yale University
The U.S. Petroleum Crisis of 1979
THE UNITED STATES experienced the second petroleum crisis of the de- cade in 1979. American consumers were told that the cause of the crisis was a decline in Iranian oil production from 5.8 million barrels a day (mmbd) in July 1978 to 445,000 barrels a day (mbd) in January 1979. The short-run consequences of the crisis were shortages of diesel fuel and gasoline during the months of May, June, and July. At the peak of the crisis the gasoline lines were as long as or longer than those in 1974. There were also suggestions that heating oil would be in short supply in the 1979-80 winter. The long-run consequences are higher prices of gaso- line, heating oil, residual fuel oil and, eventually, higher prices of all products derived from petroleum.
Many have asked whether the higher prices and the shortages were necessary, especially since the United States seemed to have experienced greater shortages and price increases than any of its European allies. By piecing together the preliminary information on supply and demand, this paper attempts to answer such questions. The analysis focuses on acquisi- tion by refineries of crude oil, refinery production, adjustments of product inventories, and final sales to consumers in the first half of 1979. It indi- cates that "normal" levels of refinery input and petroleum production and modest price increases occurred during the first quarter. In the second quarter, however, the output of refined products fell short of projected sales. In addition, the distribution of refined products was substantially curtailed. The result was a rapid buildup of inventories, shortages, and
Note: I thank Paul W. MacAvoy, David C. Munro, Emil M. Sunley, and mem- bers of the Brookings panel for their helpful comments that led to improvements in this paper. The research for this paper was supported by a grant to the Research Program in Government and Business at the School of Organization and Manage- ment, Yale University; that support is gratefully acknowledged.
0007-2303179/0002-0463$00.25/O ? Brookings Institution

464 Brookings Papers on Economic Activity, 2:1979
increases in gasoline prices that far exceeded the rise in the cost of crude oil.
The price increases are understandable in view of the reduced avail- ability of refined products. But the extent of the inventory buildup, which reduced the supply of those products to the market, raises questions about the role of the U.S. Department of Energy (DOE) in those shortages. DOE requested the inventory buildup and ordered crude oil to be redis- tributed in a way that reduced the supply of gasoline and altered regional distribution. Further, DOE's gasoline price and allocation regulations made it profitable to withhold supplies from the market. A different DOE management strategy that discouraged stock building might have partially overcome the effects of the regulations and reduced the shortage.
Petroleum Supply and Demand during the First Quarter of 1979
Although the year began with inventories 7 percent below levels of a year earlier, there was no unusual buildup of inventories of crude oil or products in the refinery sector during the first quarter of 1979. The avail- able data summarized in table 1 suggest that petroleum flows in 1979: 1 closely paralleled flows in 1978: 1.1 Compared with 1978:1, refinery out- put in 1979 :1 increased by 390 mbd or 2.4 percent, while distribution of products to the market increased by 260 mbd or 1.3 percent. Inventory changes and levels of product imports and exports were also almost iden- tical in the two quarters. Although production of crude oil in the conti- nental United States declined in 1979 :1, total domestic crude oil produc- tion matched the 1978 :1 level as Alaskan production increased from 993
1. To develop estimates of the sources of supply, I added domestic crude oil pro- duction, imports of crude oil, production and imports of natural gas liquids and con- densate, and the change in inventories of crude oil and intermediate products (un- finished oils and natural gasoline). Exports of crude oil were then subtracted to obtain an estimate of total inputs. The estimate of refinery output is mine. Neither the U.S. Department of Energy (DOE) nor the U.S. Bureau of Mines publishes an aggregate statistic on the output of refineries. They do, however, publish data on total deliveries, changes in product inventories, and imports and exports of products. By adding these I was able to derive my estimate of refinery output. Because data on refinery output and inputs do not balance, I included a term "refinery gains and dis- crepancy." This item takes into account the volumetric expansion caused by refining.

Philip K. Verleger, Jr. 465
Table 1. Sources of Refined Products Supplied to the U.S. Market and Stocks of Crude Oil and Products, 1978:1 and 1979:1
Item 1978:1 1979:1
Input anid output of refineries (thousands of barrels a day)
Domestic crude oil production 8,151 8,151 Plus: Imported crude oila 5,845 6,333
Withdrawal from (addition to) refineries' inventories of crude oilb (61) (84)
Withdrawal from (addition to) refineries' inventories of intermediate productsb (19) 14
Natural gas liquids and condensate 1,983 2,139 Minus: Exports of crude oil 57 278
Equals: Refinery input 15,841 16,276
Plus: Refinery gains and discrepancy' 397 352
Equals: Refinery output 16,238 16,628
Sources of petroleuim produicts supplied to the market (thousands of barrels a day)
Refinery output 16,238 16,628 Plus: Imports of refined products 2,188 2,175
Minus: Exports of refined prodtucts 189 216
Equals: Products available to the market 18,238 18,587
Plus: Withdrawal from refineries' inventories of refined productsb 1,799 1,709
Equals: Products supplied to the market 20,037 20,297
Stocks of cruide oil and produtcts (thousands of barrels) End-of-quarter stocks (March)
Crude oila 345,333 317,432 Refined products 680,578 630,609 Intermediate products 123,392 115,454
Change in stocks during quarter Crude oila 5,476 7,517 Refined products -161,942 -153,845 Intermediate products 1,695 -1,257
Sources: U.S. Department of Energy, Energy Information Administration, Energy Data Reports, "Crude Petroleum, Petroleumn Products, and Natural Gas Liquids," various issues, table 1; and Monthly Energy Review (October 1979), p. 30. Figures are rounded.
a. Data on stocks and imports are adjusted to exclude Strategic Petroleum Reserve imports and stocks. b. Daily average during the quarter. c. Calculated to balance inputs into refineries with ultimate sales.

466 Brookings Papers on Economic Activity, 2:1979
mbd to 1,326 mbd. Exports of crude oil also increased in 1979:1 by 221 mbd, continuing a trend that began in 1978.2
The supply of products during the first quarter of 1979 was apparently adequate to satisfy consumer needs. There were no reports of shortages in either the petroleum or financial press. And the supply of 20,297 mbd matched almost exactly the projections of required supply made by the Oil and Gas Journal in January 1979 and by the Independent Petroleum Association of America (IPAA) in October 1978. The IPAA projected domestic requirements during 1979:1 of 20,313 mbd, while the Oil and Gas Journal projected 20,220 mbd.3 The movement of gasoline prices during the first three months of 1979 also does not indicate shortages. Gasoline prices at retail increased by 5.0 cents a gallon from December through March, but only 1.1 cents can be accounted for by increases in dealer margins (see table 2). The remainder is explained by an increase of 1.8 cents per gallon in the cost of crude oil and a widening of refinery margins by 2.1 cents.
Petroleum Supply and Demand during the Second Quarter of 1979
The similarity between the patterns of distribution in 1978 and 1979 ended during the second quarter of 1979 when the industry embarked upon a strategy of inventory rebuilding. Indeed, the amount of inventory building was astonishing, if the preliminary data are to be believed. During the second quarter, deliveries to the market were cut 486 mbd below the levels of 1978:2, despite an increase in the amount of crude oil received by refineries (see table 3).
Imports of crude oil actually increased by 561 mbd (9.9 percent) from levels a year earlier. This increase offset a decline in domestic production
2. The increase in exports resulted from the movement of Alaskan crude oil to the U.S. Virgin Islands for refining. Sales to a refiner in the Virgin Islands are (by convention) counted as exports, and receipts from the islands as imports. The export of Alaskan oil was therefore offset by increased imports of refined products from the Virgin Islands and implies a corresponding decline in imports from other sources.
3. See "Report of the Supply and Demand Committee, Independent Petroleum Association of America," prepared for the 1978 annual meeting of the Independent Petroleum Association of America; and David Lange, "U.S. Industry Facing Still Larger Numbers in 1979," Oil and Gas Journal, vol. 77 (January 29, 1979), p. 111.

Philip K. Verleger, Jr. 467
Table 2. Refiners' Acquisition Cost of Crude Oil, Retail Gasoline Prices, and Dealer Margins, 1973-79
Cents per gallon
Refiners' acquisition Retail price Year or month cost of crude oil of gasoliniea Dealer margins
1973 n.a. 39.0 7.4 1974 21.6 52.8 9.7 1975 24.7 56.2 8.4 1976 25.9 58.7 7.8 1977 28.5 62.6 8.3 1978 29.7 64.2 8.1
1978 July 29.6 64.5 7.8 August 29.7 65.4 7.9 September 29.9 65.9 7.9 October 30.0 66.0 8.0 November 30.4 66.3 7.9 December 30.8 67.2 8.1
1979 January 31.2 68.2 8.2 February 32.0 69.6 8.4 March 32.6 72.2 9.2 April 34.6 76.3 10.4 May 36.7 80.3 11.5 June 40.5 86.5 13.6 July 44.2 91.8 15.0 August 47.0 96.3 14.8
Sources: The refiners' acquisition cost of crude oil is from Monthly Energy Review, various issues. Gas- oline prices and dealer margins are from Lundberg Letter (North Hollywood: Tele-Drop), various issues, and Monthly Energy Review (July 1976 and June 1978), p. 54 and p. 63, respectively.
a. The data are for leaded regular gasoline at full service stations. Gasoline prices include tax. n.a. Not available.
of 266 mbd. The total potential supply of refinery input rose by 321 mbd (2.0 percent), although actual inputs rose by less than half a percent be- cause inventories of crude oil and intermediate products were increased.
Management of product inventories was also conservative. During the second quarter of 1978, refiners increased stocks of refined products at a rate of 223 mbd. During 1979, the data show that stocks were in- creased at a rate of 502 mbd. This difference alone reduced the supply of products available to the market by 279 mbd, or by 1.5 percent of the 1978:2 supply.

468 Brookings Papers on Economic Activity, 2:1979
Table 3. Sources of Reflned Products Supplied to the U.S. Market and Stocks of Crude Oil and Products, 1978:2 and 1979:2
Item 1978:2 1979:2
Input and output of refineries (thousands of barrels a day)
Domestic crude oil production 8,421 8,155
Plus: Imported crude oila 5,668 6,229 Withdrawal from (addition to) refineries'
inventories of crude oilb 133 (93) Withdrawal from (addition to) refineries'
inventories of intermediate productsb 26 (46) Natural gas liquids and condensate 1,972 2,082
Minus: Exports of crude oil 137 221
Equals: Refinery input 16,083 16,106
Plus: Refinery gains and discrepancyo 603 550
Equals: Refinery output 16,686 16,656
Sources of petroleum products supplied to the market (thousands of barrels a day)
Refinery output 16,686 16,656
Plus: Imports of refined products 1,800 1,655
Minus: Exports of refined products 212 245
Equals: Products available to the market 18,273 18,066
Minus: Addition to refineries' inventories of refined productsb 223 502
Equals: Products supplied to the market 18,050 17,564
Stocks of crude oil and products (thousands of barrels)
End-of-quarter stocks (June) Crude oils 333,247 325,893 Refined products 700,829 676,277 Intermediate products 121,012 119,616
Change in stocks during quarter Crude oila -12,086 8,461 Refined products 20,251 45,668 Intermediate products -2,380 4,162
Sources: Same as table 1. Figures are rounded. a. Data on stocks and imports are adjusted to exclude imports and stocks in the Strategic Petroleum
Reserve. b. Daily average during the quarter. c. Calculated to balance inputs to refineries\Withfinal sales.

Philip K. Verleger, Jr. 469
The difference in stock management between 1978:2 and 1979:2 can be summarized as follows:
Thousands of barrels a day
Slower withdrawals from gasoline inventories 337 Faster inventory buildup of heating oil 99 Faster drawdown of other product inventories -157
Sum: Additional product inventories 279
Faster buildup of inventories of crude and intermediate oils 298
Total 577
Thus the differences in inventory management more than account for the reduction of 486 mbd from the 1978:2 level of supply.
Allowing for economic growth, the shortage during the second quarter was about 1.0 mmbd, according to projections by IPAA and the Oil and Gas Journal.4 But neither projection took account of the price increases experienced during the first and second quarters. In the case of gasoline, I estimate that the higher prices during the second quarter of 1979 would have cut consumption by 43 mbd in the absence of a shortage.5 Extrap- olating this price-induced effect to all refined products, I estimate that higher prices would have reduced consumption by 100 mbd in the second quarter, leaving a gap of 900 mbd.
That the gap could have been partially closed is evident from the dis- cussion above. If inventory changes during the second quarter had mir- rored those of 1978:2, the gap would have been 323 mbd. The con- sequence of such a strategy would have been to begin the third quarter with total stocks of only 1,069 million barrels of crude oil and products, 86 million below the level at the same point in 1978 and 126 million be- low mid-1977 levels. Whether this lower level of stocks would have
4. The Oil and Gas Journal projected domestic deliveries of 18,577 mbd during the second quarter; IPAA estimated 18,500 mbd. See Lange, "Industry Facing Still Larger Numbers," p. 111, and "Report of the Supply and Demand Committee."
5. The estimate is based on the parameters of a model of gasoline demand devel- oped by Houthakker, Sheehan, and me. The price elasticity in the model is -0.07 for one quarter and -0.2 in the long run. See H. S. Houthakker, Philip K. Verleger, Jr., and Dennis P. Sheehan, "Dynamic Demand Analyses for Gasoline and Resi- dential Electricity," American Journal of Agricultural Economics, vol. 56 (May 1974), p. 415.

470 Brookings Papers on Economic Activity, 2:1979
created an unacceptable risk of shortages later in 1979 is debatable, al- though DOE was worried that it would.6 Part of their concern may have been the uncertainty about world supplies of crude oil for the second half of the year.
As a consequence of the change in inventory management in the second quarter, the volume of motor gasoline supplied to the U.S. market in the second quarter was 7,153 mbd, or 6 percent below the level supplied a year earlier. The reduction in supply brought large price increases that, for the most part, were apparently permitted by DOE regulations, al- though they greatly exceeded the rise in the refiners' acquisition cost of crude oil (see table 2). Prices rose from an average of 70 cents per gal- lon in the first quarter to 81 cents per gallon in the second quarter and to approximately 96 cents per gallon in August. Despite these price in- creases, shortages occurred in many areas during May, June, and July.
The DOE's Reactions to the Shortage
The behavior of DOE in the 1979 crisis has been reviewed in many forums, often quite critically. However, most of these reviews have focused on public statements by officials of DOE and not on its programs. Here I examine five DOE programs that affected the supply of products available to the market: instructions to refiners to restrict the supply of gasoline sold to the market; development of the "buy/sell" program, which forced large refiners to sell crude oil to small refiners; instructions to the industry to build inventories, especially of heating oil; gasoline price-control regulations; and notice of intent to review pricing regula- tions governing crude oil during the peak of the crisis. Each of these pro- grams is examined briefly below.
6. In April, DOE proposed to implement programs that would have reduced U.S. consumption in the second half of 1979 below levels of a year earlier. Even without such programs, higher prices would have had an increasingly negative impact on consumption. Thus it can be argued that a lower level of stocks would have provided the necessary buffer to support projected consumption in the third and fourth quar- ters, except in the event of another Iranian cutback. Further, if such an interruption occurred, the Strategic Petroleum Reserve of 90 million barrels could have been drawn down. By September 1979, DOE was able to recover oil from the strategic reserve at a rate of 1 million barrels a day.
Philip K. Verleger, Jr. 471
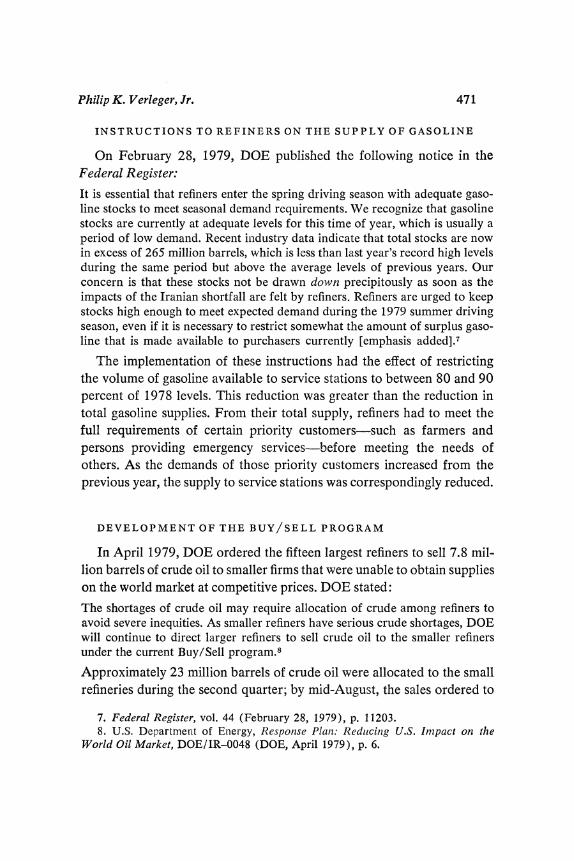
INSTRUCTIONS TO REFINERS ON THE SUPPLY OF GASOLINE
On February 28, 1979, DOE published the following notice in the Federal Register:
It is essential that refiners enter the spring driving season with adequate gaso- line stocks to meet seasonal demand requirements. We recognize that gasoline stocks are currently at adequate levels for this time of year, which is usually a period of low demand. Recent industry data indicate that total stocks are now in excess of 265 million barrels, which is less than last year's record high levels during the same period but above the average levels of previous years. Our concern is that these stocks not be drawn down precipitously as soon as the impacts of the Iranian shortfall are felt by refiners. Refiners are urged to keep stocks high enough to meet expected demand during the 1979 summer driving season, even if it is necessary to restrict somewhat the amount of surplus gaso- line that is made available to purchasers currently [emphasis added].7
The implementation of these instructions had the effect of restricting the volume of gasoline available to service stations to between 80 and 90 percent of 1978 levels. This reduction was greater than the reduction in total gasoline supplies. From their total supply, refiners had to meet the full requirements of certain priority customers-such as farmers and persons providing emergency services-before meeting the needs of others. As the demands of those priority customers increased from the previous year, the supply to service stations was correspondingly reduced.
DEVELOPMENT OF THE BUY/SELL PROGRAM
In April 1979, DOE ordered the fifteen largest refiners to sell 7.8 mil- lion barrels of crude oil to smaller firms that were unable to obtain supplies on the world market at competitive prices. DOE stated:
The shortages of crude oil may require allocation of crude among refiners to avoid severe inequities. As smaller refiners have serious crude shortages, DOE will continue to direct larger refiners to sell crude oil to the smaller refiners under the current Buy/Sell program.8
Approximately 23 million barrels of crude oil were allocated to the small refineries during the second quarter; by mid-August, the sales ordered to
7. Federal Register, vol. 44 (February 28, 1979), p. 11203. 8. U.S. Department of Energy, Response Plan: Reduicinlg U.S. Impact on the
World Oil Market, DOE/IR-0048 (DOE, April 1979), p. 6.

472 Brookings Papers on Economic Activity, 2:1979
small refineries through the third quarter totaled 41 million barrels.9 These transfers probably reduced the volume of gasoline produced in the second quarter because the refineries that purchased the crude oil had only a limited capacity to produce gasoline, while the refineries that sold it could have produced more. Based on a review of the gasoline produc- tion capacity of the recipients of the allocated crude oil, I estimate that between 5 million and 9 million barrels of potential gasoline production were lost in the second quarter, or 50 to 100 mbd.10
In addition to reducing the supply of gasoline, the buy/sell program appears to have affected the geographic distribution of crude oil and gasoline. This is because the primary recipients of the crude oil were re- fineries in the Midwest and the gulf coast areas, while the sellers were companies that were marketing throughout the nation.
INSTRUCTIONS TO BUILD HEATING INVENTORIES
In April, DOE turned its attention to the low stock of distillate fuel oil:
Distillate fuel oil stocks are at an unacceptably low level, and it is critical that these stocks be rebuilt to safe levels before the next heating season.... Unless petroleum demand is restrained, heating oil stocks would not be built to safe levels by next fall.1"
To remedy this problem, DOE stated:
The Department will work with refiners to establish individual distillate stock level targets for October 1, 1979 to reach a total distillate primary stock level of 240 MMB by October 1. Intermediate monthly targets also may be estab- lished. DOE will take steps to be prepared to require refinery yield shifts if this becomes necessary to build distillate stocks to safe levels.12
This action was reinforced by presidential statements and by official
9. The buy/sell notices are published in the Federal Register, but can be found more easily in Federal Energy Gutidelinies, the publication of DOE regulations main- tained by the Committee Clearing House, beginning at paragraph 17401. The first notice can be found in Federal Register, vol. 44 (April 9, 1979), pp. 21062-64.
10. My estimate of the loss in production is based on the capacity of the recipients to produce gasoline as shown in Department of Energy, Energy Information Admin- istration, Petroleum Refineries, in thze United States and U.S. Territories, January 1, 1979, DOE/EIA-0111/79 (DOE, June 1979). Of the 23 million barrels sold in the second quarter, 4.5 million barrels were purchased by refiners with no gasoline pro- duction facilities, and 5.1 million barrels were sold to refiners with limited facilities.
11. Department of Energy, Response Plan, p. 2. 12. Ibid.,pp. 18-19.

Philip K. Verleger, Jr. 473
pronouncements. Two impacts were observed on domestic markets. First, excessive stocks of heating oil were accumulated.13 Second, companies may have been influenced to increase gasoline stocks in anticipation of the mandatory yield controls that DOE threatened to impose. These con- trols specified the percent of refiner output that had to be heating oil. Such controls were designed to curtail the output of gasoline. By building higher gasoline inventories, refiners could smooth out the month-to- month distribution of gasoline despite the controls.
GASOLINE PRICE-CONTROL REGULATIONS
Price controls on gasoline may have also created an incentive to withhold gasoline from the market when the prices of crude oil were rising rapidly. The regulations allowed refiners to raise prices on gasoline sales each month to reflect increases in costs of crude oil incurred in the previous month. Thus, if a refiner's costs of crude oil increased by 2 cents per gallon in April, that refiner could raise the price of gasoline by 2 cents per gallon on May 1. Under this method of accounting (last in, first out) the price of any product produced before April but still in inventory on May 1 could also be increased. Whether such a strategy was profitable would depend on the cost of gasoline, on short-term carrying costs, and on the expected rate of increase in the average cost of crude oil. Assum- ing 45 cents per gallon as the total cost of production to the refiner (the approximate average cost in February) and an interest rate of 12 percent, this strategy would have been profitable only if a refiner expected the cost of crude oil to increase at a monthly rate of more than 0.5 cent to 0.7 cent per gallon.14 As table 2 shows, the monthly increase in the acquisi-
13. An inventory of 240 million barrels of heating oil as of October 1 has been achieved only once since 1974 (in 1977). On October 1, 1978, stocks were 220 mil- lion barrels. A stock level of 240 million barrels could be justified only if demand in 1979:4 and 1980:1 were expected to exceed demand in 1978:4 and 1979:1. In fact, DOE did project such an increase in Department of Energy, Response Plan. However, the projection was based on a 3.1 percent increase in real GNP for 1979:4 relative to 1978:4. Under assumptions of lower growth of real GNP (such as those used by the Office of Management and Budget in preparing the 1980 budget) and taking account of reductions in the demand for heating oil that would result from actions DOE proposed as part of the Response Plan, a decline in demand would have been projected.
14. The range depends on the number of days that inventories are held. If they were held thirty days, the increase would be 0.5 cent per gallon. If they were held forty-five days, the required cost increase would be 0.7 cent per gallon.

474 Brookings Papers on Economic Activity, 2:1979
tion cost of crude oil to the refiner did not exceed 0.4 cent per gallon until February 1979, when it jumped to 0.8 cent per gallon. Then, after increasing 0.6 cent in March, gasoline rose 2.0 cents per gallon in April, 2.1 cents per gallon in May, and 3.8 cents per gallon in June.15
In spring 1979, most refiners knew with relative certainty that their costs of crude oil were going to rise rapidly because the time lag between purchase and receipt of imports was, in most cases, more than six weeks. Refiners also had the capacity to store the added inventories because inventory levels of crude oil and product were low. Moreover, most large refiners needed the flexibility provided by the last in-first out pricing pro- vision; they otherwise were constrained by price controls-either because they had depleted their banked costs,'6 or because they were complying with the price restraint program of the Council on Wage and Price Sta- bility.17 In summary, the refiners had the capacity and the knowledge to take advantage of this opportunity. Ironically, the instructions from DOE to the companies were to do precisely what was most profitable.
REVIEW OF PRICING REGULATIONS FOR
CRUDE OIL PRODUCTION
In addition to encouraging the buildup of stocks, DOE may have added to the shortages by creating an incentive to reduce the output of crude oil. Although it is difficult to estimate what domestic supplies of crude oil might have been in the absence of any restriction, a DOE announcement in November that control levels of the base period were to be reviewed may have constrained production in the first half of 1979.18 From past
15. In the absence of controls, product prices would have risen immediately by a greater amount. This would have provided even greater profits, but would have eliminated the special incentive to stock building.
16. Banked costs provide a mechanism whereby DOE allows a producer to raise the price of a controlled product in some future month to recover costs he was unable to pass through in some previous month.
17. By late 1978, many refiners had exhausted their banked costs. Some refiners who had not exhausted their banked costs were constrained by the profit margin test under President Carter's voluntary anti-inflation program. If they complied with this restraint, refiners would have had the same incentive to withhold product as de- scribed above, because the profit margin test permitted price increases to recover costs of raw materials.
18. Under the price controls for crude oil, the base period control level is the volume of daily oil output from a well that must be sold as "old" oil at a price of $6.00 a barrel. Production above this level is sold as "new" oil at a higher price.

Philip K. Verleger, Jr. 475
experience, producers could have inferred from the November announce- ment that future base-period control levels would probably be determined by the volume of old oil produced during the period of review by DOE. A producer could expect that every additional barrel of old oil produced daily during the review period would correspondingly increase the future number of barrels that would be classified as old oil. Thus increased pro- duction of old oil could have been expected to reduce present and future incomes."9
Conclusion
I began by reviewing the pattern of supply of refined products in the United States during the first and second quarters of 1979. The pattern in the first quarter was similar to that of the same quarter in the previous year. In the second quarter of 1979, however, when the distribution of refined products to the market was curtailed so that inventories could be rebuilt, a shortfall arose between projected demand and actual supply. Although gasoline prices rose by almost 20 cents per gallon-much more than the 10 cents per gallon increase in the cost of crude oil-gasoline shortages occurred during the spring in many parts of the country.
It is clear that there were private incentives to build unusually large inventories in the spring. DOE chose not to override these incentives and, in fact, promoted a large increase in stocks. If DOE had correctly antici- pated the availability of crude oil for the remainder of 1979, it would not have been necessary to encourage inventory accumulation in the second quarter. And it could have moderated the price increases at the consumer level by not permitting exceptional increases in the profit margins of re- finers and dealers.
19. DOE's allocation regulations may have provided an additional motive to restrict gasoline supplies. The regulations require refiners to report as "surplus" the volume of production that exceeds the level of supply during the same period in the previous year. DOE then has ten days in which it may require the refiner to sell the product to a competitor's service station. Thus, when exercised, this regulation effec- tively prevents a refiner from increasing the supply of gasoline sold to its regular customers or service stations. During periods of plenty, such as 1976 and 1977, this rule was seldom used. However, as more refiners began to reduce the volume of gasoline allocated to the market in 1979, the chances increased that the rule would be imposed.

476 Brookings Papers on Economic Activity, 2:1979
Discussion
SEVERAL PARTICIPANTS questioned the extent to which DOE ought to be blamed for the inventory buildup, gasoline shortages, and higher product prices during the second quarter of 1979. Most agreed that DOE's allo- cation system worsened the gasoline shortage. But they distinguished two issues regarding the inventory buildup: whether the DOE targets were appropriate and whether its actions changed private behavior. Arthur Okun pointed out that, in view of the uncertainty of supplies later in the year, a plan to build stocks in the spring was prudent. Robert Lawrence added that Philip Verleger offered no convincing model explaining de- sired inventories. Actual inventories were low by the end of March and a substantial buildup of stocks would have been expected even under normal circumstances. Given the abnormal circumstances of uncertain supplies and widespread expectations of higher prices, the buildup would almost certainly have been exceptionally large without encouragement by DOE. Christopher Sims reasoned that the release of price controls had created an incentive for private hoarding. Because the release of controls on crude oil prices was announced as a phased program, to be completed over many months, it created incentives for short-run supply restriction greater than that which existed when controls were in full force.
Robert Hall argued that DOE's policies had not altered longer run prices. Although he believed that regulations had unwisely held back price increases in the spring, prices were currently at market-clearing levels. He maintained that gasoline price regulations are ineffective and that gasoline prices soon reflect the marginal cost of crude oil. William Nord- haus pointed out that regulatory mistakes that increased demand in world spot markets, even temporarily, could permanently raise crude oil prices. High prices in spot markets appeared to encourage OPEC to raise prices, but subsequent easing of spot prices led them to constrain supplies.


![IS 1448-91 (1979): Methods of test for petroleum and its … · 2018-11-15 · IS : 1448 [ P : 91 ]- 1979 tap water. Immerse the cylinder in a cleaning solution of hot chromic acid.](https://static.fdocuments.in/doc/165x107/5e73381c89f98e3a51146555/is-1448-91-1979-methods-of-test-for-petroleum-and-its-2018-11-15-is-1448.jpg)