The US Mutual Fund Landscape - Pathway Planning · 2016-08-18 · THE US MUTUAL FUND LANDSCAE...
16
The US Mutual Fund Landscape 2016
Transcript of The US Mutual Fund Landscape - Pathway Planning · 2016-08-18 · THE US MUTUAL FUND LANDSCAE...

The US Mutual Fund Landscape 2016

THE US MUTUAL FUND INDUSTRY
COMPRISES A LARGE UNIVERSE OF
FUNDS COVERING SECURITIES MARKETS
AROUND THE WORLD. THESE FUNDS
REFLECT DIVERSE PHILOSOPHIES
AND APPROACHES.
HOW HAS THE INDUSTRY PERFORMED
AS A WHOLE? WHAT SHOULD INVESTORS
THINK ABOUT WHEN SELECTING FUNDS?
RESEARCH PROVIDES INSIGHT.

THE US MUTUAL FUND LANDSCAPE
DIMENSIONALFUND ADVISORS
Mutual funds are a popular way to invest, offering shareholders professional management and the convenience of daily pricing, market liquidity, periodic reporting, and access to many investment styles and strategies.
Exhibit 1.1 offers a representative sample of the US mutual fund industry at the end of 2015, showing a category breakdown of US-domiciled equity and fixed income funds in operation. Exhibit 1.2 (next page) graphs the total value of assets under management by category for this sample over the past 15 years. Combined, the figures describe a large and growing industry. By the end of 2015, the sample contained more than 4,500 US-based funds
collectively managing about $6.6 trillion in shareholder wealth. Since 2001, assets under management grew more than 150%, and the number of funds increased by 28%.
The sheer size of the mutual fund landscape highlights its importance as a primary vehicle to connect investors with the global financial markets, but also illustrates the challenge of fund evaluation and selection. Investors must choose among thousands of funds representing a broad range of manager philosophies, objectives, and styles—all of which contribute to fund performance and, ultimately, to the investor’s experience.
Surveying the landscape
This study evaluates a
sample of more than
4,500 US mutual funds
that represent about
$6.6 trillion in wealth
at the end of 2015.
Exhibit 1.1 Representative Sample of US Mutual Funds Number of equity and fixed income funds, 2015
Number of US-domiciled funds in the sample as of December 31, 2015. International equities include non-US developed and emerging markets funds.
See Data appendix for more information.
2
US Equities International Equities US Fixed Income
2,525
1,234
780

Despite a myriad of choices, selecting a successful fund manager can be harder than it appears. This study shows that a relatively small percentage of mutual funds have delivered benchmark-beating returns over time. Although it is easy to find managers with impressive track records, data from this analysis suggests that past outperformance is not a reliable indicator of future performance.
Market competition may be one reason. Each day, the global financial markets process millions of trades worth hundreds of billions of dollars. The buying and selling aggregates vast amounts of dispersed information into prices, driving them toward fair value.
This is good news for investors. Though the price of a stock or bond may not always be perfect, Dimensional believes that investors can regard that price as the best estimate of actual value. Accordingly, fair pricing may work against fund managers and other market participants who believe they can identify “mispriced” securities and convert their knowledge into higher returns.
A powerful market pricing mechanism implies there may be few opportunities to gain an informational advantage, meaning funds that search for mispriced securities may face an uphill climb.
Let’s consider some of these challenges in more detail.
Exhibit 1.2 Assets under Management In USD (billions), 2001–2015
3
$3,819 US Equities
$1,700 International Equities
$1,100 US Fixed Income
2001 2002 2003 2004 2005 2006 2007 2008 2009 2010 2011 2012 2013 2014 2015
$6,619 Total

THE US MUTUAL FUND LANDSCAPE
DIMENSIONALFUND ADVISORS
A case of disappearing funds
Exhibit 2.1 Survivorship and Outperformance—Equity FundsPerformance periods ending December 31, 2015
The size and complexity of the mutual fund landscape masks the fact that many funds disappear each year, often as a result of poor investment performance.
The gray boxes in Exhibits 2.1 and 2.2 (next page) represent the number of US-domiciled equity and fixed income funds in the sample at the start of the three-, five-, 10-, and 15-year periods through 2015. These funds compose the beginning universe of each period. For example, an investor trying to select a mutual fund at the start of the three-year period (2013) could have chosen from 3,550 equity funds and 811 bond funds.
How many of the funds that began each period still existed at the end of 2015? The striped areas show the proportions that survived. During the three-year period,
87% of equity funds and 88% of fixed income funds survived. Over time, fund survival rates dropped. In equities, the five-, 10-, and 15-year survival rates were 76%, 59%, and 43%, respectively. The numbers were slightly better in fixed income, with 80% of funds making it five years, 60% surviving 10 years, and 43% surviving 15 years.
Investors may be surprised by how many mutual funds become obsolete over time. Funds tend to disappear quietly, and underperforming funds—especially those that do not survive and are no longer available for investment—receive little attention.
Non-surviving funds tend to be poor performers. Certainly, investors would like to identify obsolete funds in advance and avoid them. But the reality is that
Beginning sample includes funds as of the beginning of the three-, five-, 10-, and 15-year periods ending December 31, 2015. The number of beginners is indicated below the period label.
Survivors are funds that were still in existence as of December 31, 2015. Non-survivors include funds that were either liquidated or merged.
Outperformers (winners) are funds that survived and beat their respective benchmarks over the period.
Past performance is no guarantee of future results.
See Data appendix for more information.
4
Beginners Survivors
3 YEARS3,550 funds at beginning
5 YEARS3,711 funds at beginning
10 YEARS2,730 funds at beginning
15 YEARS2,758 funds at beginning
87%Survive
36%Outperform
76%Survive
29%Outperform
59%Survive
21%Outperform
43%Survive
17%Outperform
Outperformers

Exhibit 2.2 Survivorship and Outperformance—Fixed Income FundsPerformance periods ending December 31, 2015
everyone must choose from a universe that includes funds that will not survive the period, and an accurate depiction of the fund selection challenge requires performance data from both surviving and non-surviving funds.
Investors likely have a more ambitious goal than to just pick a fund that survives. Most people are on a hunt for funds that will outperform a benchmark. What were their chances of picking an outperforming, or “winning,” fund?
The blue and yellow areas show the proportion of equity and fixed income funds that outperformed their respective benchmarks. These funds are certainly in the minority. Over both short and longer time horizons—and for both equities and bonds—the deck is stacked against the investor seeking outperformance.
For example, 36% of equity and 26% of fixed income funds survived and outperformed their benchmarks for the three-year period ending December 31, 2015. Fund performance results are worse over longer horizons: 29% of equity and 18% of fixed income funds survived to provide benchmark-beating performance over the five years through 2015. Over 15 years, outperformance dropped to 17% for equity funds and 7% for fixed income funds.
In the fiercely competitive mutual fund industry, many funds do not survive, but many more crop up to take their place. The free exit and entry supports a vast price discovery effort among managers, with the research data suggesting reasonably fair market prices.
Outperformance can
be hard to come by.
Seventeen percent
of equity funds and
7% of fixed income
funds survived and
outperformed over
the 15-year period
through 2015.
5
Beginners Survivors Outperformers
3 YEARS811 funds at beginning
5 YEARS833 funds at beginning
10 YEARS642 funds at beginning
15 YEARS709 funds at beginning
88%Survive
26%Outperform
80%Survive
18%Outperform
60%Survive
12%Outperform
43%Survive
7%Outperform
THE US MUTUAL FUND LANDSCAPE
DIMENSIONALFUND ADVISORS
Winners Losers
2008–2010
2006–2010
2001–2010
2011–2015
2011–2015
2011–2015
INITIAL PERIOD
SUBSEQUENTPERIODBeginning Funds
Winning Funds
36%
39%
52%
The search for winners
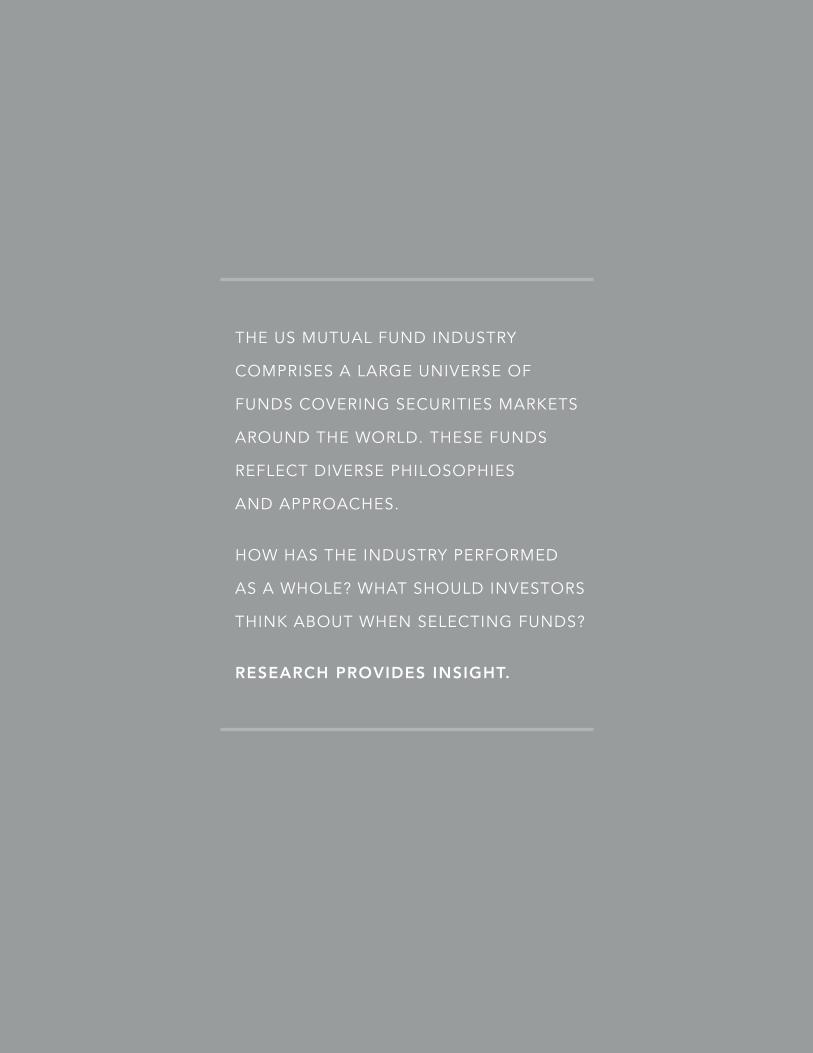
Exhibit 3.1 Most Past Winners Do Not Keep Winning—Equity FundsPast performance vs. subsequent performance
This study suggests that the competitive landscape can make the search for future winners a formidable challenge. Confronted with so many fund choices—and lacking an investment philosophy to inform their search—some investors may resort to using track records as a guide to selecting funds, reasoning that a manager’s past outperformance is likely to continue in the future.
Does this assumption pay off? The research offers evidence to the contrary.
Exhibits 3.1 and 3.2 (next page) illustrate the lack of persistence in outperformance. Three-, five-, and 10-year mutual fund track records are evaluated through the end of 2010, and funds that beat their respective benchmarks are re-evaluated in the subsequent five-year period ending December 31, 2015.
A minority percentage of the beginning equity funds outperformed in the initial periods—and subsequent performance was not much better. For example, 35% of the equity funds with past outperformance during the initial three-year period (2008–2010) continued to beat their benchmarks in the subsequent five-year period (2011–2015).
Based on this analysis, finding past winners may not help investors identify future outperforming funds. The results for equity funds with good five- and 10-year track records were similar—about a third beat their benchmarks in the subsequent period.
The past returns of fixed income funds do not necessarily provide insight into future outperformance, either. No more than
The sample includes funds at the beginning of the three-, five-, and 10-year periods, ending in December 2010.
The graph shows the proportion of funds that outperformed and underperformed their respective benchmarks (i.e., winners and losers) during the initial periods.
Winning funds were re-evaluated in the subsequent period from 2011 through 2015, with the graph showing the proportion of outperformance and underperformance among past winners. (Fund counts and percentages may not correspond due to rounding.)
Past performance is no guarantee of future results.
See Data appendix for more information.
6
3,016 931
541
31%
2,730
20% 37% 2,758
73827% 33%
Beginning Funds
33% of the 738 winning funds continued to win
37% of the 541 winning funds continued to win
35% of the 931 winning funds continued to win
35%

Exhibit 3.2 Most Past Winners Do Not Keep Winning—Fixed Income FundsPast performance vs. subsequent performance
Based on this study,
equity and fixed
income funds, even
past winners, were
likely to underperform
in the future.
7
23% of the beginning bond funds showed benchmark-beating returns during the initial three-, five-, and 10-year performance periods. About a third of the three- and five-year past winners continued to outperform in the subsequent five years, and about half of the 10-year winners outperformed.
The results for both winning equity and fixed income funds show that past outperformance was not a reliable indicator of future outperformance, as even past winners were likely to underperform in the subsequent five-year period through 2015.
This lack of persistence among winners suggests that gaining a consistent informational advantage is very difficult. Many smart professionals are striving to gather morsels
of information to help them identify pricing mistakes. But this competition means that public information is quickly reflected in market prices, leaving few opportunities to exploit the knowledge for profit.
Some fund managers might be better than others, but they can be hard to identify in advance using track records alone. Stock and bond returns contain a lot of noise, and impressive track records may result from good luck. The assumption that past outperformance will continue often proves faulty, leaving many investors disappointed.
Winners Losers
2008–2010
657 154
102
53
23%
16% 642 34% of the 102 winning funds continued to win
51% of the 53 winning funds continued to win
36% of the 154 winning funds continued to win
7% 709
2006–2010
2001–2010
2011–2015
2011–2015
2011–2015
INITIAL PERIOD
SUBSEQUENTPERIODBeginning Funds
Winning Funds
36%
34%
51%
THE US MUTUAL FUND LANDSCAPE
DIMENSIONALFUND ADVISORS
The impact of costs
If competition drives prices to fair value, one might wonder why underperformance is so common. A major factor is mutual fund costs. Costs reduce an investor’s net return and represent a hurdle for a fund. To outperform, a fund must add enough value to exceed its costs.
All mutual funds incur costs. Some costs, such as expense ratios, are easily observed, while others, including trading costs, are more difficult to measure. The question is not whether investors must bear some costs, but whether the costs are reasonable and indicative of the value added by a fund manager’s decisions.
The research shows that many mutual funds are expensive to own and do not offer higher value for the higher costs incurred. Let’s consider how one type of explicit cost—expense ratios—can impact fund performance.
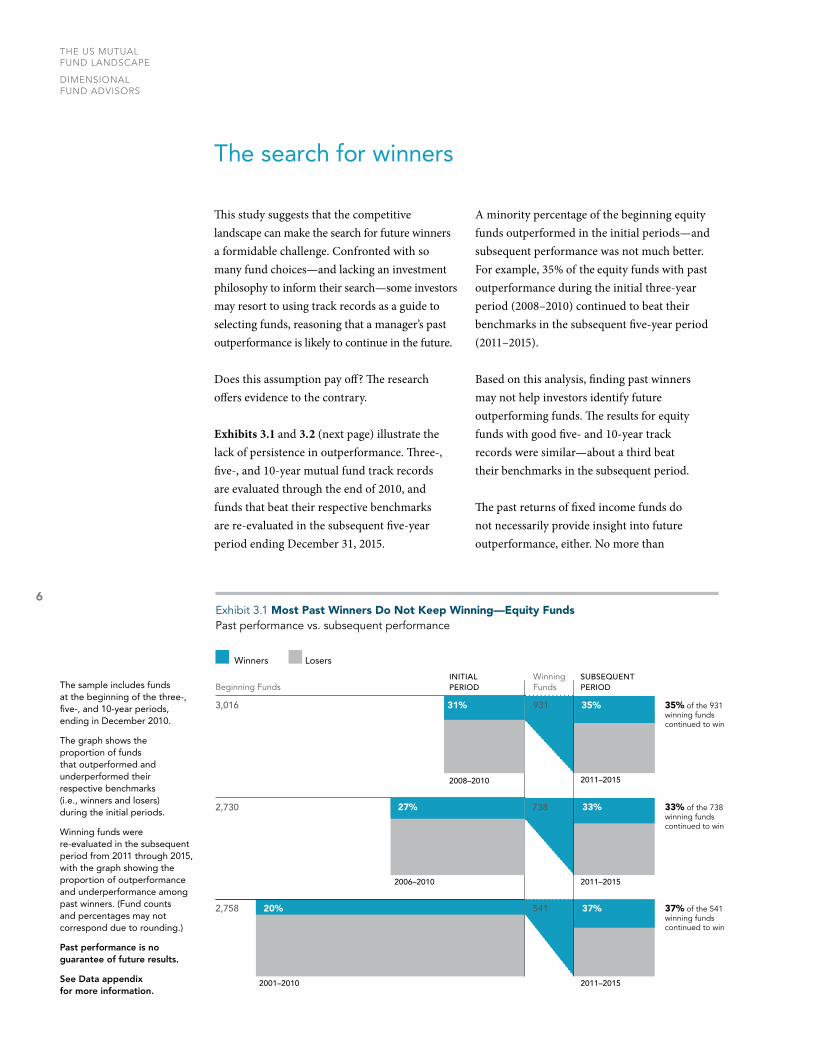
In Exhibits 4.1 and 4.2 (next page), equity and fixed income funds in existence at the beginning of the five-, 10-, and 15-year periods are ranked by quartiles based on their average expense ratio. The graph shows the percentage of winners (outperformers) and losers (underperformers) for each quartile across periods.
Exhibit 4.1 High Costs Make Outperformance Difficult—Equity FundsWinners and losers based on expense ratios (%)
The sample includes funds at the beginning of the five-, 10-, and 15-year periods ending December 31, 2015.
Funds are ranked by quartiles based on average expense ratio over the sample period, and performance is compared to their respective benchmarks.
The chart shows the percentage of winner and loser funds within each expense ratio quartile.
Past performance is no guarantee of future results.
See Data appendix for more information.
Average Expense Ratio (%)
5 Years
4033 30
21
6067 70
79
0.71 1.06 1.27 1.67
Low High Med.Low
Med.High
70
24
76
18
30
82
11
89
10 Years
0.75 1.12 1.36 1.83
Low High Med.Low
Med.High
26
74
20
80
15
85
7
93
15 Years
Low High Med.Low
Med.High
0.83 1.21 1.49 2.05
Winners Losers
8
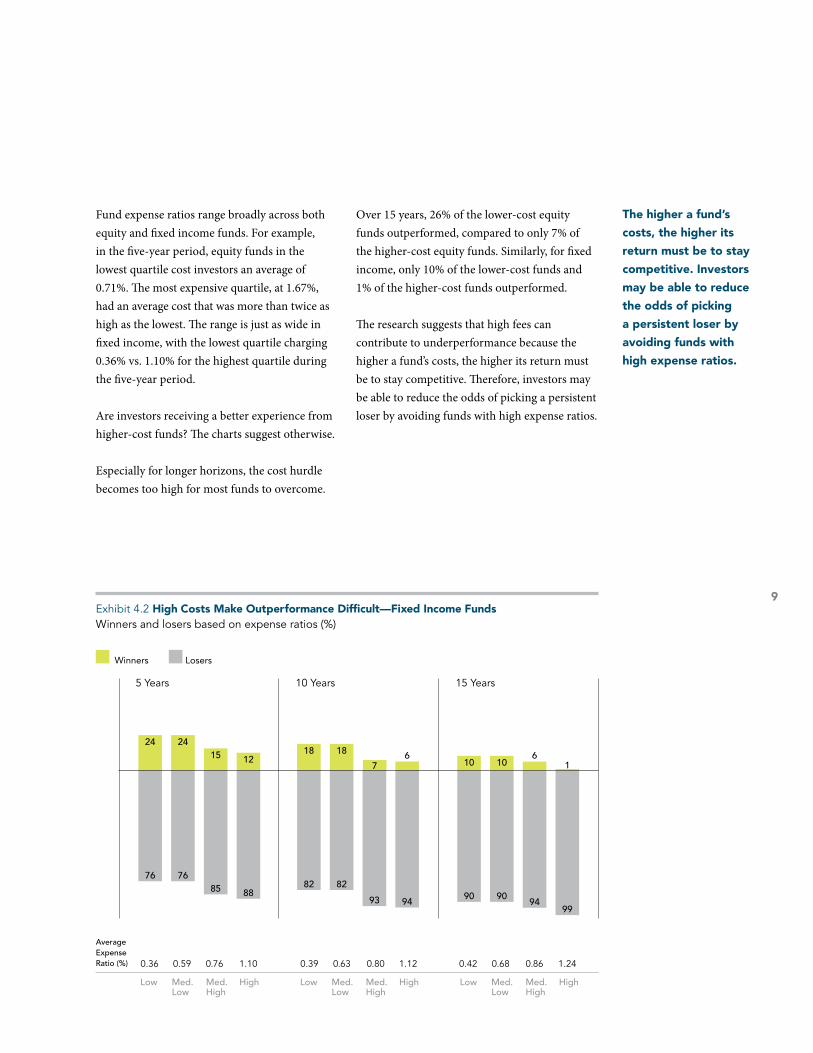
Exhibit 4.2 High Costs Make Outperformance Difficult—Fixed Income FundsWinners and losers based on expense ratios (%)
Fund expense ratios range broadly across both equity and fixed income funds. For example, in the five-year period, equity funds in the lowest quartile cost investors an average of 0.71%. The most expensive quartile, at 1.67%, had an average cost that was more than twice as high as the lowest. The range is just as wide in fixed income, with the lowest quartile charging 0.36% vs. 1.10% for the highest quartile during the five-year period.
Are investors receiving a better experience from higher-cost funds? The charts suggest otherwise.
Especially for longer horizons, the cost hurdle becomes too high for most funds to overcome.
Over 15 years, 26% of the lower-cost equity funds outperformed, compared to only 7% of the higher-cost equity funds. Similarly, for fixed income, only 10% of the lower-cost funds and 1% of the higher-cost funds outperformed.
The research suggests that high fees can contribute to underperformance because the higher a fund’s costs, the higher its return must be to stay competitive. Therefore, investors may be able to reduce the odds of picking a persistent loser by avoiding funds with high expense ratios.
Winners Losers
The higher a fund’s
costs, the higher its
return must be to stay
competitive. Investors
may be able to reduce
the odds of picking
a persistent loser by
avoiding funds with
high expense ratios.
Average Expense Ratio (%)
5 Years
0.36 0.59 0.76 1.10
Low High Med.Low
Med.High
10 Years
0.39 0.63 0.80 1.12
Low High Med.Low
Med.High
24
76
24
76
15
85
12
88
18
82
93 94
18
82
76
10
90
10
90
6
94
1
99
15 Years
Low High Med.Low
Med.High
0.42 0.68 0.86
9
1.24

THE US MUTUAL FUND LANDSCAPE
DIMENSIONALFUND ADVISORS
The impact of costly turnover
Other activities can add substantially to a mutual fund’s overall cost burden. Equity trading costs, such as brokerage fees, bid-ask spreads,1 and price impact, can be just as large as a fund’s expense ratio. Trading costs are difficult to observe and measure, but they impact a fund’s return nonetheless—and the higher these costs, the higher the outperformance hurdle.
Among equity funds, portfolio turnover can offer a rough proxy for trading costs.2 Managers who trade frequently in their attempts to add value typically incur greater turnover and higher trading costs. Although turnover is just one way to approximate trading costs, the study indicates that funds with higher turnover are more likely to underperform their benchmarks.
In Exhibit 5, equity funds existing at the beginning of the five-, 10-, and 15-year periods are placed in quartiles based on their average turnover. Turnover varies dramatically across equity funds, reflecting many different management styles. For the most recent five-year period, funds in the low-turnover quartile averaged 20% turnover. The average turnover for the highest quartile was 169%, more than eight times higher.
Funds with high turnover have lower rates of outperformance. For the five-year period, 36% of funds in the lowest quartile beat their benchmarks, while only 26% in the high-turnover quartile had winning performance. The principle also applies to 10- and 15-year periods, with fewer winners among the high-turnover quartiles.
Exhibit 5 High Trading Costs Make Outperformance Difficult—Equity FundsWinners and losers based on turnover (%)
Winners Losers
The sample includes equity funds at the beginning of the five-, 10-, and 15-year periods ending December 31, 2015.
Funds are ranked by quartiles based on average turnover during the sample period, and performance is compared to their respective benchmarks.
The chart shows the percentage of winner and loser funds within each turnover quartile.
Past performance is no guarantee of future results.
See Data appendix for more information.
Excessive turnover
creates high trading
costs that can detract
from returns.
5 Years
64
36 33
67
29
71
26
74
10 Years
3123
6977
15
85
14
86
20 46 75 169
Low High Med.Low
Med.High
24 53 84 180
Low High Med.Low
Med.High
Low High Med.Low
Med.High
28 61 94 215
15 Years
29
71
19
81
12
88
8
92
Average Turnover (%)
10

This analysis of a representative sample of US mutual funds illustrates the potential obstacles confronting investors who seek outperforming funds. For the periods examined, the research shows that:
Outperforming funds were in the minority.
Strong track records failed to persist.
High costs and excessive turnover may have contributed to underperformance.
These results are consistent with a market equilibrium view of investing, in which intense market competition drives securities prices to fair value, potentially making it difficult to persistently add value by identifying mispriced securities. Despite the efforts of many professionals working in the industry, a majority of funds in this study failed to outperform their benchmarks.
Although the analysis suggests low odds of success, many investors continue searching for winning mutual funds and look to past performance as the main criterion for evaluating a manager’s future potential. In their pursuit of returns, many investors surrender performance to high fees, high turnover, and other costs of owning the mutual funds.
In Dimensional’s view, the underperformance of most US mutual funds highlights an important investment principle: The capital markets do a good job of pricing securities, which makes beating benchmarks (and other investors) quite difficult. When fund managers charge high fees and trade frequently, they must overcome high cost barriers as they try to outperform the market.
Choosing a long-term winner involves more than seeking out funds with a successful track record, as past performance offers no guarantee of a successful investment outcome in the future. Moreover, finding past performance is only one way to evaluate a manager.
Investors should consider other variables, including a mutual fund’s underlying market philosophy, investment objectives, and strategy. They should also consider a mutual fund’s total costs, including trading costs, which may be affected by the manager’s approach.
SUMMARY
11
US-domiciled mutual fund data is from the CRSP Survivor-Bias-Free US Mutual Fund Database, provided by the Center for Research in Security Prices, University of Chicago.
Certain types of equity and fixed income funds were excluded from the performance study. For equities, index funds, sector funds, and funds with a narrow investment focus, such as real estate and gold, were excluded. Index funds, money market funds, municipal bond funds, and asset-backed security funds were excluded from fixed income.
Funds are identified using Lipper fund classification codes. Correlation coefficients are computed for each fund with respect to diversified benchmark indices using all return data available between January 1, 2001, and December 31, 2015. The index most highly correlated with a fund is assigned as its benchmark. Winner funds are those whose cumulative return over the period exceeded that of their respective benchmark. Loser funds are funds that did not survive the period or whose cumulative return did not exceed their respective benchmark.
Expense ratio ranges: The ranges of expense ratios for equity funds over the five-, 10-, and 15-year periods are 0.01% to 4.90%, 0.01% to 4.72%, and 0.07% to 4.44%, respectively. For fixed income funds, ranges over the same periods are 0.02% to 3.09%, 0.06% to 2.67%, and 0.03% to 3.66%, respectively.
Portfolio turnover ranges: Ranges for equity fund turnover over the five-, 10-, and 15-year periods are 1% to 1,535%, 1% to 1,388%, and 2% to 2,318%, respectively.
Benchmark data provided by Barclays, MSCI, Russell, Citigroup, BofA Merrill Lynch, and S&P. Barclays data provided by Barclays Bank PLC. MSCI data © MSCI 2016, all rights reserved. Russell data © Russell Investment Group 1995–2016, all rights reserved. Citigroup bond indices © 2016 by Citigroup. The BofA Merrill Lynch index is used with permission; © 2016 Merrill Lynch, Pierce, Fenner & Smith Incorporated; all rights reserved. Merrill Lynch, Pierce, Fenner & Smith Incorporated is a wholly owned subsidiary of Bank of America Corporation. The S&P data is provided by Standard & Poor’s Index Services Group.
Benchmark indices are not available for direct investment. Their performance does not reflect the expenses associated with the management of an actual portfolio.
Data appendix
THE US MUTUAL FUND LANDSCAPE
DIMENSIONALFUND ADVISORS
12
Consider the investment objectives, risks, and charges and expenses of the Dimensional
funds carefully before investing. For this and other information about the Dimensional
funds, please read the prospectus carefully before investing. Prospectuses are available
by calling Dimensional Fund Advisors collect at (512) 306-7400 or at us.dimensional.com.
Dimensional funds are distributed by DFA Securities LLC.
Dimensional Fund Advisors LP is an investment advisor registered with the Securities and Exchange Commission. Mutual fund investment values will fluctuate, and shares, when redeemed, may be worth more or less than original cost. Diversification neither assures a profit nor guarantees against a loss in a declining market. There is no guarantee investment strategies will be successful. Past performance is no guarantee of future results.
ENDNOTES1. Bid-ask spread is the difference between the highest price a buyer is willing to pay for an asset
and the lowest price for which a seller is willing to sell it.
2. Fixed income funds are excluded from the analysis because turnover is not a good proxy for fixed income trading costs.


AMERICAS
Austin, Charlotte, Santa Monica, Toronto, VancouverEUROPE
London, Amsterdam, BerlinASIA PACIFIC
Sydney, Melbourne, Singapore, Tokyo
RM51660 04/16 1017959