The US Military on the Front Lines of Rising Seas: Joint ... · Front Lines of Rising Seas ... US...
8
FACT SHEET Exposure to Coastal Flooding at Joint Base Langley-Eustis, Virginia HIGHLIGHTS With seas rising at an accelerating rate, coastal military installations are increasingly exposed to storm surge and tidal flooding. The Union of Concerned Scientists (UCS) conducted analyses of this changing exposure for 18 military installations along the East and Gulf coasts. Analysis for Joint Base (JB) Langley-Eustis found that in the second half of this century, in the absence of preventive measures, this installation can expect more frequent and extensive tidal flooding, loss of currently utilized land, and substantial increases in the extent and severity of storm-driven flooding to which it is exposed. The US Armed Forces depend on safe and functional bases, such as JB Langley- Eustis, Virginia, to carry out their stated mission: to provide the military forces needed to deter war and to protect the security of the country. A roughly three- foot increase in sea level would threaten 128 coastal Department of Defense (DOD) installations in the United States and the livelihoods of the people—both military personnel and civilians—who depend on them (NAS 2011). In the area around JB Langley-Eustis, seas are expected to rise between 4.5 and 6.9 feet by the end of this century. To enable decision makers to better understand the sea level rise threat, and where and when it could become acute, UCS has performed a new analysis of 18 East and Gulf coast military installations, including JB Langley-Eustis. These sites were selected for their strategic importance to the Armed Forces, for their potential exposure to the effects of sea level rise, and because they represent coastal installations nationwide in terms of size, geographic distribution, and service branch. The US Military on the Front Lines of Rising Seas THE INLAND MARCH OF HIGH TIDE JB Langley-Eustis is located in the Hampton Roads area of Virginia, an area where natural subsidence, low-lying topography, and changing ocean circulation patterns contribute to above-average rates of sea level rise. Much of the joint base itself is less than 10 feet above sea level. As a result, in the highest scenario, as much as 60 percent of Fort Eustis and nearly 90 percent of Langley AFB could be inundated by daily high tides by 2100. US Air Force
Transcript of The US Military on the Front Lines of Rising Seas: Joint ... · Front Lines of Rising Seas ... US...

FACT SHEET
Exposure to Coastal Flooding at Joint Base Langley-Eustis, Virginia
HIGHLIGHTS
With seas rising at an accelerating
rate, coastal military installations are
increasingly exposed to storm surge and
tidal flooding. The Union of Concerned
Scientists (UCS) conducted analyses of
this changing exposure for 18 military
installations along the East and Gulf coasts.
Analysis for Joint Base (JB) Langley-Eustis
found that in the second half of this century,
in the absence of preventive measures, this
installation can expect more frequent and
extensive tidal flooding, loss of currently
utilized land, and substantial increases in
the extent and severity of storm-driven
flooding to which it is exposed.
The US Armed Forces depend on safe and functional bases, such as JB Langley- Eustis, Virginia, to carry out their stated mission: to provide the military forces needed to deter war and to protect the security of the country. A roughly three-foot increase in sea level would threaten 128 coastal Department of Defense (DOD) installations in the United States and the livelihoods of the people—both military personnel and civilians—who depend on them (NAS 2011). In the area around JB Langley-Eustis, seas are expected to rise between 4.5 and 6.9 feet by the end of this century.
To enable decision makers to better understand the sea level rise threat, and where and when it could become acute, UCS has performed a new analysis of 18 East and Gulf coast military installations, including JB Langley-Eustis. These sites were selected for their strategic importance to the Armed Forces, for their potential exposure to the effects of sea level rise, and because they represent coastal installations nationwide in terms of size, geographic distribution, and service branch.
The US Military on the Front Lines of Rising Seas
THE INLAND MARCH OF HIGH TIDEJB Langley-Eustis is located in the Hampton Roads area of Virginia, an area where natural subsidence, low-lying topography, and changing ocean circulation patterns contribute to above-average rates of sea level rise. Much of the joint base itself is less than 10 feet above sea level. As a result, in the highest scenario, as much as 60 percent of Fort Eustis and nearly 90 percent of Langley AFB could be inundated by daily high tides by 2100.
US A
ir Force
2 union of concerned scientists
UCS projected exposure to coastal flooding in the years 2050, 2070, and 2100 using the National Climate Assess-ment’s mid-range, or “intermediate-high,” scenario (referred to here as “intermediate”) and, in light of the low tolerance for risk in some of the military’s decisions, a “highest” scenar-io based on a more rapid rate of increase (Parris et al. 2012).1 We modeled tidal flooding, permanent inundation, and storm surge from hurricanes.2 The results below outline potential future flooding to which JB Langley-Eustis could be exposed, assuming no new measures are taken to prevent or reduce flooding.3 This analysis finds the following key results:
TIDAL FLOODING, PERMANENT INUNDATION, AND LAND LOSS
• Flooding during extreme high tides will become more extensive, affecting new areas. Today, routine tidal flooding affects mainly wetland portions of JB Langley- Eustis, roughly nine times per year. But in the intermedi-ate scenario, such flooding could expand to affect roadways and other areas within the installation by 2050.
• Flood-prone locations could flood with each high tide. By 2050 in the highest scenario, tidal flooding oc-curs roughly 540 times per year—on average, more than once per day—in currently flood-prone places. Barring any natural adaptation of the wetlands, these and other low-lying areas could be inundated for more than 75 per-cent of the year by 2070.
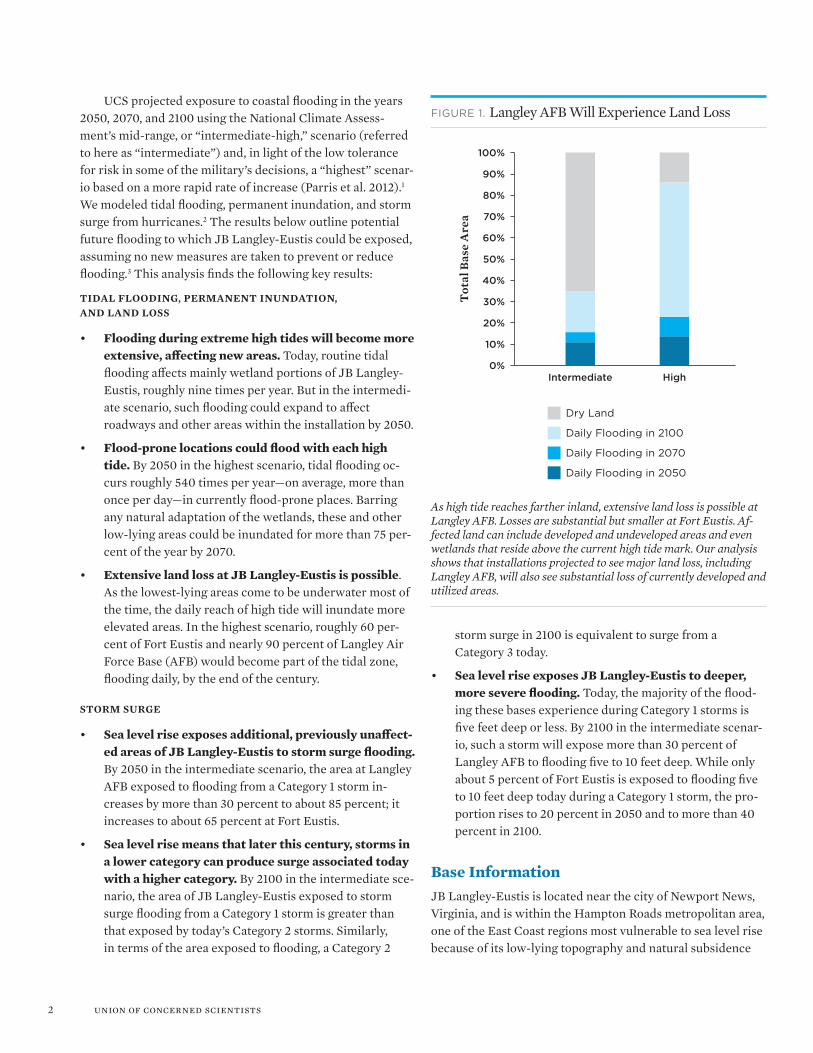
• Extensive land loss at JB Langley-Eustis is possible. As the lowest-lying areas come to be underwater most of the time, the daily reach of high tide will inundate more elevated areas. In the highest scenario, roughly 60 per-cent of Fort Eustis and nearly 90 percent of Langley Air Force Base (AFB) would become part of the tidal zone, flooding daily, by the end of the century.
STORM SURGE
• Sea level rise exposes additional, previously unaffect-ed areas of JB Langley-Eustis to storm surge flooding. By 2050 in the intermediate scenario, the area at Langley AFB exposed to flooding from a Category 1 storm in-creases by more than 30 percent to about 85 percent; it increases to about 65 percent at Fort Eustis.
• Sea level rise means that later this century, storms in a lower category can produce surge associated today with a higher category. By 2100 in the intermediate sce-nario, the area of JB Langley-Eustis exposed to storm surge flooding from a Category 1 storm is greater than that exposed by today’s Category 2 storms. Similarly, in terms of the area exposed to flooding, a Category 2
storm surge in 2100 is equivalent to surge from a Category 3 today.
• Sea level rise exposes JB Langley-Eustis to deeper, more severe flooding. Today, the majority of the flood-ing these bases experience during Category 1 storms is five feet deep or less. By 2100 in the intermediate scenar-io, such a storm will expose more than 30 percent of Langley AFB to flooding five to 10 feet deep. While only about 5 percent of Fort Eustis is exposed to flooding five to 10 feet deep today during a Category 1 storm, the pro-portion rises to 20 percent in 2050 and to more than 40 percent in 2100.
Base Information JB Langley-Eustis is located near the city of Newport News, Virginia, and is within the Hampton Roads metropolitan area, one of the East Coast regions most vulnerable to sea level rise because of its low-lying topography and natural subsidence
As high tide reaches farther inland, extensive land loss is possible at Langley AFB. Losses are substantial but smaller at Fort Eustis. Af-fected land can include developed and undeveloped areas and even wetlands that reside above the current high tide mark. Our analysis shows that installations projected to see major land loss, including Langley AFB, will also see substantial loss of currently developed and utilized areas.
FIGURE 1. Langley AFB Will Experience Land Loss
100%
90%
80%
70%
60%
50%
40%
30%
20%
10%
0%Intermediate High
Dry Land
Daily Flooding in 2100
Daily Flooding in 2070
Daily Flooding in 2050T
otal
Bas
e A
rea

3The US Military on the Front Lines of Rising Seas
(VIMS 2013). Much of the region, including JB Langley-Eus-tis, lies below 10 feet in elevation (Connolly 2015). It is also situated within an East Coast sea level rise hot spot, where these local factors combine with changing ocean circulation patterns to create above-average sea level rise.
JB Langley-Eustis is made up of Langley AFB and Fort Eustis. The two installations, which were joined in 2010, are separated by nearly 20 miles. Langley AFB provides combat airpower to the nation and borders Langley Research Center, a historically pivotal aviation facility. Fort Eustis has, since World War II, provided Army transportation training and lo-gistics. It is also the headquarters for the US Army Training and Doctrine Command, which oversees the training and leadership development of Army forces (DOD 2016).
With a population including active duty military, con-tractors, civilians, and their families, JB Langley-Eustis is an integral part of the local community (DOD 2016). The instal-lation is a critical component of the local economy as well, contributing an estimated $2.4 billion annually (JB Langley- Eustis 2013).
Historic Exposure to Storm Surge and Flood HazardsOwing to its mid-Atlantic location, the Hampton Roads re-gion has long endured flooding from hurricanes and lesser storms (HPRDC 2011). Because the topography and geology of the region make it naturally vulnerable to sea level rise, coastal flooding problems are on the rise (HPRDC 2012). Ris-ing seas over the past few decades have meant that the region increasingly experiences problematic tidal flooding as well (Spanger-Siegfried, Fitzpatrick, Dahl 2014).
Since 1857, there have been 65 hurricanes that have come within 150 nautical miles of the Hampton Roads area (NOAA n.d.). Langley AFB maintains both a seawall, which helps to protect housing along the easternmost shore, and a robust, riprap-reinforced shoreline with plantings on the remaining eastern and north/northeastern coast. Both help control ero-sion (Figiera 2016)
While these measures provide protection during normal storms, they do not prevent flooding during severe nor’easters or hurricanes. In 2003, when Hurricane Isabel (Category 1) caused a storm surge of five to eight feet in the region, Lang-ley AFB was largely underwater (Connolly 2015). The damage to Langley AFB from Isabel was estimated at more than $160 million, and about 200 facilities at the base were affected (Connolly 2015). A recent assessment showed that a 4.5-foot rise in water levels would close or block an estimated 62 roadways and 14 installation gates that serve the military in the Hampton Roads region (Belfield 2013).
Future (Projected) Exposure to Storm Surge and Flood Hazards
SEA LEVEL RISE
The intermediate scenario projects that the Hampton Roads area, including JB Langley-Eustis, will experience 4.5 feet of
JB Langley-Eustis Established: 2010 Active Duty: 8,000Guard/Reservists: 400Family Members: 10,000Students: 12,000
Langley AFB Branch: Air Force Established: 1916 Size (Acres): 463,360Units 50 Annual Budget: $18.8BJobs: 192,000Replacement Value: $4.7B
Fort Eustis Branch: ArmyEstablished: 1918Size (Acres): 7,940
SOURCE: DOD 2016.
With a population including active duty military, contractors, civilians, and their families, JB Langley-Eustis is an integral part of the local community.

4 union of concerned scientists
sea level rise, and the highest scenario projects nearly seven feet of rise by 2100. This rise will lead to increased exposure to different types of coastal flooding.
TIDAL FLOODING AND LAND LOSS:
Routine flooding during high tides, which currently occurs an average of nine times per year, is a persistent issue in the Hampton Roads area, regularly disrupting transportation and business. As sea level rises, this flooding is expected to be-come both more extensive and more frequent at both bases. In the intermediate scenario, such flooding could close road-ways within Fort Eustis by 2050.
Areas currently affected by occasional tidal flooding could flood daily. The intermediate scenario projects that tid-al flooding could occur an average of nearly 280 times per year by 2050. Without substantial adaptive measures, affect-ed areas such as roadways and low-lying neighborhoods could become unusable land within the next 35 years. In 2050, the affected areas at the installations would still largely be wetlands, but the consequences of frequent flooding in the surrounding region—for example, damage to housing and
TABLE 1. Hampton Roads Area Bases Could See More than Six of Sea Level Rise by 2100
Year Intermediate Highest
2050 1.4 2.0
2070 2.5 3.6
2100 4.5 6.9
In the intermediate scenario, ice sheet loss increases gradually in the coming decades; in the highest scenario, more rapid loss of ice sheets occurs. The latter scenario is included in this analysis to help inform decisions involving an especially low tolerance for risk. Moreover, recent studies suggest that ice sheet loss is accelerating and that fu-ture dynamics and instability could contribute significantly to sea level rise this century (DeConto and Pollard 2016; Trusel et al. 2015; Chen et al. 2013; Rignot et al. 2011). Values shown are local projec-tions that include unique regional dynamics such as land subsidence (see www.ucsusa.org/MilitarySeasRising).
FIGURE 2. How Sea Level Rise Causes Tidal Flooding and Land Loss
As sea level rises, extreme tides cause local flood conditions to occur more often, to a greater extent, and for longer time periods. And the daily high tide line can eventually begin to encompass new areas, shifting the tidal zone onto presently utilized land. In this analysis, land inundated by at least one high tide each day is considered a loss. This is a highly conservative metric: far less frequent flooding would likely lead to land being considered unusable.
Today
High Tide LevelToday’s High Tide Level Extreme Tide Level Land Area
2050 2100

5The US Military on the Front Lines of Rising Seas
Langley AFB jumps to roughly 85 percent in 2050. By 2100, Langley AFB will be nearly 100 percent exposed to flooding from a Category 1 hurricane. The exposure of Fort Eustis will rise as well, from roughly 60 percent today to close to 80 per-cent in 2100 in the intermediate scenario.
Sea level rise also changes the depth of flooding Langley AFB and Fort Eustis can expect with major storms. Today, more than 90 percent of the inundation resulting from a Cate-gory 1 storm at Langley AFB is five feet deep or less. As this relatively shallow flooding becomes more extensive over time, so does the proportion of the base exposed to five to 10-foot flood depths. While less than 5 percent of Langley AFB is exposed to flooding five to 10 feet deep resulting from a Category 1 storm today, the intermediate scenario shows that more than 30 percent of the base will be exposed to such flooding in 2100. Similarly, at Fort Eustis, only about 6 per-cent of the base is exposed to flooding five to 10 feet deep today during a Category 1 storm. That exposure will rise to 20 percent in 2050 and to more than 40 percent in 2100.
For the mid-Atlantic region, a Category 4 storm rep-resents a worst-case scenario. Both sections of JB Lang-ley-Eustis are highly exposed to storm surge from a Category 4 storm today, with 80 percent of Fort Eustis and 100 percent of Langley AFB at risk of flood. Because flood exposure is al-ready so high at each base, the percentage of flood exposure does not increase substantially for a Category 4 storm as sea level rises, but the depth of inundation does. At Langley AFB, 75 percent of the base is exposed to flooding 10 to 15 feet deep today. In the highest scenario, almost 100 percent of the base will be exposed to flooding 15 feet deep or more by 2100.
travel delays affecting the joint base community of workers and personnel housed off base—could affect JB Langley-Eus-tis nonetheless.
The intermediate scenario shows flood-prone areas in the region flooding roughly 640 times per year—or with each of the two daily high tides, on average—and being underwater more than 75 percent of the time by 2070. More than a quar-ter of Langley AFB’s land area would be exposed roughly nine times per year to flooding during extreme tides.
In this analysis, land that is inundated by at least one high tide each day is considered a loss and part of the tidal zone. According to this metric, 60 percent of Fort Eustis’s land area would be lost by 2100 in the highest scenario, as would nearly 90 percent of Langley AFB’s land area (see Figure 3, p. 6).
Around JB Langley-Eustis, the difference between high and low tide is small enough that, eventually, land will be per-manently inundated—that is, flooded even at low tide. During the last quarter of this century, flood events in this area will begin to span many tide cycles. As a result, the number of in-dividual flood events will decrease, but the duration of flood conditions will increase until flooding is essentially constant and the land that was once above the high tide mark is per-manently inundated. In either scenario, flood-prone areas at these installations and in the surrounding region are con-stantly or near-constantly underwater by 2100 (see Table 2).
THE CHANGING THREAT OF HURRICANES
Category 1 storms are the most likely type of hurricane to af-fect this area.4 Today, a Category 1 hurricane exposes about 50 percent of Langley AFB to flooding from storm surge. In the intermediate scenario, the area exposed to flooding at
TABLE 2. Areas Prone to Flooding Could Be Permanently Inundated by 2100
Intermediate Highest
Year Events per Year % of Year Events per Year % of Year
2012 9 ± 4 0 9 ± 4 0
2050 276 ± 16 10 538 ± 26 26
2070 641 ±17 40 525 ± 26 77
2100 124 ± 27 96 1 ± 0 100
Sea level rise will lead to constant or near-constant flooding in the Hampton Roads area. Shown here are flood events in low-lying, flood-prone areas projected by the intermediate and highest scenarios. Events per year are reported as the average over a five-year period with one standard deviation. Percent of year is reported simply as the average over a five-year period. As flood conditions span multiple high tide cy-cles, the number of distinct flood events drops, but the duration of flooding increases until it is constant. Installations will be affected by this flooding depending on the presence of low-lying land on site.

6 union of concerned scientists
FIGURE 3. The Reach of Future Daily High Tides at JB Langley-Eustis
The reach of future daily high tides, shown in the top panel, encompasses currently utilized land at JBLE. Langley AFB’s developed area is shown in the bottom panel. The highest scenario is mapped here. SOURCE: GOOGLE EARTH.

7The US Military on the Front Lines of Rising Seas
Similarly, a Category 4 storm today exposes 70 percent of Fort Eustis to flooding 10 or more feet deep. By 2100, 70 per-cent of the base will be exposed to flooding of 15 or more feet deep. As early as 2070, close to 10 percent of Fort Eustis will be exposed to flooding more than 20 feet deep—a level of flooding not projected for any portion of the base for a Cate-gory 4 storm today.
Mobilizing on the Front Lines of Sea Level RiseA vital trait of our nation’s military is its ability to adapt in response to external threats. Climate change and sea level rise have emerged as key threats of the 21st century, and our mili-tary is beginning to respond (Hall et al. 2016; USACE 2015; DOD 2014).
Recognizing its vulnerability to sea level rise and coastal flooding, JB Langley-Eustis has been working closely with regional stakeholders on preparedness and resilience efforts (Steinhilber, Whitelaw, and Considine 2015). Low-lying Lang-ley AFB has already taken numerous steps to alleviate the ef-fects of tidal flooding on base facilities. After Hurricane Isabel in 2003, Langley AFB raised electrical transformers and HVAC units and removed mechanical rooms from basements in most of its facilities (Figiera 2016). It installed integrated flood barriers at entrances to numerous flood-susceptible fa-cilities and has a powerful pump system to remove water from the installation grounds and reduce infiltration and oth-er damage to facilities (Figiera 2016). Langley AFB also part-nered with NASA’s Langley Research Center to develop a flood tool to accurately predict (at individual building level) inundation based on storm surge data collected by a nearby buoy (Figiera 2016). It uses these data to focus flood preven-tion efforts on at-risk facilities, thereby maximizing the use of labor and other resources during storm preparations.
But here and across US coastal installations there is still far to go: the gap between the military’s current sea level rise preparedness and the threats outlined by this analysis is large
and growing. Low-lying federal land inundated by rising seas, daily high-tide flooding of more elevated land and infrastruc-ture, and destructive storm surges—most of the installations analyzed, including JB Langley-Eustis, face all of these risks.
This analysis provides snapshots of potential future ex-posure to flooding at JB Langley-Eustis. For the joint base to take action on the front line of sea level rise, however, it will need more detailed analysis and resources to implement solu-tions. Congress and the DOD should, for example, support the development and distribution of high-resolution hurricane and coastal flooding models; adequately fund data monitoring systems such as our nation’s tide gauge network; allocate hu-man, financial, and data resources to planning efforts and to detailed mapping that includes future conditions; support planning partnerships with surrounding communities; and allocate resources for preparedness projects, on- and off-site, many of which will stretch over decades.
Military bases and personnel protect the country from external threats. With rising seas, they find themselves on an unanticipated front line. Our defense leadership has a special responsibility to protect the sites that hundreds of thousands of Americans depend on for their livelihoods and millions depend on for national security.
ENDNOTES1 The intermediate sea level rise scenario assumes ice sheet loss that increases
over time, while the highest scenario assumes rapid loss of ice sheets. The latter scenario is particularly useful for decisions involving an especially low tolerance for risk. These results are a small subset of the full analysis. For more information, the technical appendix, and downloadable maps, see www.ucsusa.org/MilitarySeasRising.
2 UCS analyzed storm surge depth and exposure extent for each base using the Sea, Lake, and Overland Surges from Hurricanes (SLOSH) model, developed by the National Oceanic and Atmospheric Administration (NOAA), for storm events ranging in severity from Category 1 to Category 4, in addition to tidal floods. Both storm surge and flooding during extra-high tides can be significantly exacerbated by rainfall and wave action, neither of which was included in this study.
3 This analysis involved consultation with JB Langley-Eustis. However, in some instances, preventive measures may be planned or in place that are not reflected in the analysis; these could affect the degree of current and future flooding.
4 Nor’easters are more common in the region and known to generate damaging storm surge. As SLOSH models only hurricanes, we did not include lesser storms, such as nor’easters, in this analysis. Increases in surge extent and depth should be expected with these storms as well.
REFERENCESBelfield, S. 2013. Hampton Roads military transportation needs
study: Roadways serving the military and sea level rise/storm surge. Presented at the Hampton Roads Transportation Planning Organization Board Meeting, Chesapeake, VA, July 18. Online at http://hrtpo.org/uploads/docs/071813TPO-Presentation%2011-Hampton%20Roads%20Military%20Transportation%20Needs%20Study-Sea%20Level%20Rise-Storm%20Surge.pdf, accessed March 28, 2016.
Chen, J.L., C.R. Wilson, and B.D. Tapley. 2013. Contribution of ice sheet and mountain glacier melt to recent sea level rise. Nature Geoscience 6(7):549-552.
The gap between the military’s current sea level rise preparedness and the threats outlined by this analysis is large and growing.

find the full analysis and methodology online: www.ucsusa.org/MilitarySeasRising
web: www.ucsusa.org printed on recycled paper using vegetable-based inks © JULY 2016 union of concerned scientists
NATIONAL HEADQUARTERS Two Brattle SquareCambridge, MA 02138-3780Phone: (617) 547-5552Fax: (617) 864-9405
WASHINGTON, DC, OFFICE1825 K St. NW, Suite 800Washington, DC 20006-1232Phone: (202) 223-6133Fax: (202) 223-6162
WEST COAST OFFICE500 12th St., Suite 340Oakland, CA 94607-4087Phone: (510) 843-1872Fax: (510) 843-3785
MIDWEST OFFICEOne N. LaSalle St., Suite 1904Chicago, IL 60602-4064Phone: (312) 578-1750Fax: (312) 578-1751
The Union of Concerned Scientists puts rigorous, independent science to work to solve our planet’s most pressing problems. Joining with citizens across the country, we combine technical analysis and effective advocacy to create innovative, practical solutions for a healthy, safe, and sustainable future.
National Oceanic and Atmospheric Administration (NOAA). No date. Historical hurricane tracks. Washington, DC. Online at https://coast.noaa.gov/hurricanes/, accessed March 14, 2016.
Parris, A., P. Bromirski, V. Burkett, D. Cayan, M. Culver, J. Hall, R. Horton, K. Knuuti, R. Moss, J. Obeysekera, A. Sallenger, and J. Weiss. 2012. Global sea level rise scenarios for the National Climate Assessment. NOAA tech memo OAR CPO-1. Washington, DC: National Oceanic and Atmospheric Administration. Online at http://scenarios.globalchange.gov/sites/default/files/NOAA_SLR_r3_0.pdf, accessed April 25, 2016.
Rignot. E., I. Velicongna, M.R. van den Broeke, A. Monaghan, and J.T.M. Lenaerts. 2011. Acceleration of the contribution of the Greenland and Antarctic ice sheets to sea level rise. Geophysical Research Letters, doi: 10.1029/2011GL046583.
Sallenger, A.H., K.S. Doran, and P.A. Howd. 2012. Hotspot of accelerated sea-level rise on the Atlantic coast of North America. Nature Climate Change 2:884–888. doi:10.1038/nclimate1537.
Spanger-Siegfried, E., M. Fitzpatrick, and K. Dahl. 2014. Encroaching tides: How sea level rise and tidal flooding threaten US East and Gulf Coast communities over the next 30 years. Cambridge, MA: Union of Concerned Scientists. Online at www.ucsusa.org/sites/default/files/attach/2014/10/encroaching-tides-full-report.pdf, accessed May 12, 2016.
Steinhilber, E., J. Whitelaw, and C. Considine. 2015. Hampton Roads sea level rise preparedness and resilience intergovernmental pilot project. Norfolk, VA: The Center for Sea Level Rise, Old Dominion University. Online at www.centerforsealevelrise.org/wp-content/uploads/2015/11/IPP-Phase-1-Report-Revised-with-Appendices_V2.pdf, accessed June 2, 2016.
Trusel, L.D., K.E. Frey, S.B. Dias, K.B. Karnauskas, P. Kuipers Munneke, E. van Meijgaard, and M.R. van den Broeke. 2015. Divergent trajecto-ries of Antarctic surface melt under two twenty-first-century climate scenarios. Nature Geoscience 8:927–932. doi:10.1038/NGEO2563.
US Army Corps of Engineers (USACE). 2015. North Atlantic Coast comprehensive study: Resilient adaptation to increasing risk: North Atlantic Coast comprehensive study. Brooklyn, NY. Online at www.nad.usace.army.mil/Portals/40/docs/NACCS/NACCS_main_report.pdf, accessed May 25, 2016.
Virginia Institute of Marine Science (VIMS). 2013. Recurrent flooding study for Tidewater Virginia. Gloucester Point, VA. Online at http://ccrm.vims.edu/recurrent_flooding/Recurrent_Flooding_Study_web.pdf, accessed May 27, 2016.
Connolly, M. 2015. Hampton Roads, Virginia, and the military’s battle against sea level rise. Washington, DC: The Center for Climate and Security. Online at https://climateandsecurity.files.wordpress.com/2015/10/hampton-roads-virginia-and-military-battle-against-sea-level-rise.pdf, accessed March 10, 2016.
DeConto, R.M., and D. Pollard. 2016. Contribution of Antarctica to past and future sea-level rise. Nature 531:591-597.
Department of Defense (DOD). 2016. Military installations. Joint Base Langley-Eustis, Virginia. Washington, DC. Online at www.militaryin-stallations.dod.mil/MOS/f ?p=MI:CONTENT:0::::P4_INST_ID,P4_CONTENT_TITLE,P4_CONTENT_EKMT_ID,P4_CONTENT_DIRECTORY,P4_TAB:4915,Installation%20Overview,30.90.30.30.30.0.0.0.0,1,IO, accessed March 9, 2016.
Department of Defense (DOD). 2014. Climate change adaptation roadmap. Washington, DC. Online at http://ppec.asme.org/wp- content/uploads/2014/10/CCARprint.pdf, accessed May 31, 2016.
Figiera, A.S. 2016. Personal communication with the author, May 19. Lt. Col. Anthony S. Figiera is Commander, 633d Civil Engineer Squardron, at Langley Air Force base.
Hall, J.A., S. Gill, J. Obeysekera, W. Sweet, K. Knuuti, and J. Marburger. 2016. Regional sea level scenarios for coastal risk management: Managing the uncertainty of future sea level change and extreme water levels for Department of Defense coastal sites worldwide. Washington, DC: U.S. Department of Defense, Strategic Environmental Research and Development Program. Online at www.serdp-estcp.org/News-and-Events/News-Announcements/Program-News/DoD-Report-on-Regional-Sea-Level-Scenarios, accessed May 25, 2016.
Hampton Roads Planning District Commission (HRPDC). 2012. Climate change in Hampton Roads phase III: Sea level rise in Hampton Roads, Chesapeake, VA. Online at http://wetlandswatch.org/Portals/3/WW%20documents/sea-level-rise/report%20without%20appendices.pdf, accessed June 8, 2016.
Hampton Roads Planning District Commission (HRPDC). 2011. Climate change in Hampton Roads phase II: Storm surge vulnerability and public outreach, Chesapeake, VA. Online at www.deq.virginia.gov/portals/0/deq/coastalzonemanagement/task12-04-09.pdf, accessed June 8, 2016.
Joint Base Langley-Eustis (JB Langley-Eustis). 2013. 2013 economic impact analysis. Langley AFB, VA. Online at www.JBLangley-Eustis.af.mil/shared/media/document/AFD-140827-071.pdf, accessed May 12, 2016.
National Academy of Sciences (NAS). 2011. National security implica-tions of climate change for U.S. naval forces: A report by the Committee on National Security Implications of Climate Change for U.S. Naval Forces. Washington, DC. Online at www.nap.edu/download.php?re-cord_id=12914, accessed May 24, 2016.