The US Auto Industry innovation in 2013: Five Forces to...
2
14 to read full version of AI stories go to www.ai-online.com innovation Future Outlook In a 2012 US Automotive survey, “A Return to Optimism” manage- ment consultants Booz & Company point out that the future outlook for the US auto industry is good. The International Organization of Motor Vehicle Manufacturers 2011 auto sales figures show an 11.5% increase over 2010 figures. Whether this trend continues remains to be seen. Since the 2009 financial crisis, major automotive manufac- turers and suppliers have cleaned their balance sheets, removed ex- cess capacity and restructured costs (Booz). Of the big three, most analysts are more bullish on Ford’s future with categories of hybrid, gas alternative and fuel efficient models leading the pack. The big three also agree that that they need to grow “intelligently” to avoid future financial calamities with a sense of “black swan” preparedness and caution. Robust possibilities of wireless networks and “digitiza- tion” present opportunities for further technologies to be embedded within vehicle systems, including safety, navigational connectivity and entertainment in order to meet consumer needs. Porter’s Five Forces and the Auto Industry Porter’s five major forces shaping all industries and structures are: the bargaining power of buyers, the bargaining power of suppliers, competitive rivalry in the industry, threats of new entrants and threats of substitutes (Porter, 1979). Bargaining Power of Automotive Buyers In recent years, this seems to have weighed heavily towards buyers - with industry players needing to be more vigilant regarding consumer preferences. Because of the current global economic conditions, there is a smaller number of buyers at both US and global levels. This is most evident in Europe currently with Ford having to close plants, cutting 6,200 employees, or 13% of the European workforce to stem losses exceeding US$1.5 billion (Barr, October 25, 2012). Consumers are also keeping their automobiles for longer, and being more prudent and judicious when buying new. Strategically, the opportunity is for the industry to focus on fuel efficiency and price sensitive strategies more fully to shift from profit and production models previously centered on trucks and SUV’s. Bargaining Power of Automotive Suppliers The Industry Analysis Handbook 2012 describes the automobile supply business as fragmented. Many suppliers rely on one or two automakers for the purchase of the majority of their products. Because of this, suppliers hold little power and are susceptible to demand and requirement of automobile manufacturers. The exception within this is the world price of steel. Industry Profile The “big three” US Domestic market leaders remain General Motors, Ford and Chrysler. Foreign competitors include Toyota, Honda, Hyundai and Nissan. As of October 2012, US market share is divided into 15.6% Toyota, 15.3% General Motors, 12.0% Ford, 11.4% Hyundai-Kia, 8.5% Honda. In total, this makes up, 62.8% of the market with a classification of a medium concentration level, and very high revenue volatility (IBIS World, October 2012). Comparing a previous quarter’s market share (January-May, 2012), GM led with 17.8% followed by Ford 15.6%, Toyota 14.5%, Chrysler-Fiat, 11.5, Honda, 9.6% and Nissan 8.1% (Zacks, June 2012). The variance shows the degree of competition in the marketplace. Because of the current state in the global economy, higher oil prices and movement towards green technologies, the automotive industry is in a state of transition. Hybrid vehicles, fuel efficiency and technologi- cal innovation are paramount. Larger trends include moves to smaller, more fuel efficient vehicles and moves towards more robust techno- logical frameworks on production and product levels. The global in- dustry is highly capital and labor intensive with the US domestic indus- try comparatively hampered by significant historical legacy costs (i.e. UAW). Labor, materials and advertising are all significant costs (Indus- try Handbook, 2012). Sales occur through individual and high-volume fleet sales, with the seasonal highs in April-June, and lows November- January (Industry Handbook, 2012). Revenue comes from sales, as well as financing, leases and extended warranties. Industry Market Structure The oligopolistic market is dominated by a small number of manu- facturers (10 or less) whose actions directly influence one another’s profits. The U.S. Bureau of Census of 2007 reports that four firms dom- inate 68% of the motor vehicle market and eight firms dominate 86% of the market (Samuelson). The fates of oligopoly automotive industry firms are mutually interdependent (Samuelson), and this may be best retrospectively witnessed in the recent financial crisis of 2009 where all of the big three US automotive manufacturers went into dire economic straits, and faced similar challenges. While there is class uniformity in that all of the major auto manufacturers produce vehicles for transport; there is also wide variation in product features, prices and range of op- tions. Because of this, advertising and marketing to various market segments also becomes extremely important. The industry is partially protected by the high barriers of entry in in- troducing new products, which include production facilities, vehicle de- velopment costs, advertising and marketing infrastructure (Samuelson). The US Auto Industry in 2013: Five Forces to Consider By: Ray Uzwyshyn. The US auto industry is one of the most important industries and economic sectors in the United States. It contributes 3-3.5% to the overall US GDP (CAR, April 2010), and is also one of America’s largest exporter’s (Blunt, 2012). Production numbers for 2011 of 8.5 million vehicles are only outweighed by China, and are currently roughly in line with Japan (OICA, 2011). The industry employs over 1.7 million people directly, and 4.5% of the population indirectly (CAR, April 2010). China overtook the US as the world’s top auto producer in 2010, and this status is expected to continue.
Transcript of The US Auto Industry innovation in 2013: Five Forces to...
14 to read full version of AI stories go to www.ai-online.com
innovation
Future OutlookIn a 2012 US Automotive survey, “A Return to Optimism” manage-
ment consultants Booz & Company point out that the future outlook for the US auto industry is good. The International Organization of Motor Vehicle Manufacturers 2011 auto sales figures show an 11.5% increase over 2010 figures. Whether this trend continues remains to be seen. Since the 2009 financial crisis, major automotive manufac-turers and suppliers have cleaned their balance sheets, removed ex-cess capacity and restructured costs (Booz). Of the big three, most analysts are more bullish on Ford’s future with categories of hybrid, gas alternative and fuel efficient models leading the pack. The big three also agree that that they need to grow “intelligently” to avoid future financial calamities with a sense of “black swan” preparedness and caution. Robust possibilities of wireless networks and “digitiza-tion” present opportunities for further technologies to be embedded within vehicle systems, including safety, navigational connectivity and entertainment in order to meet consumer needs. Porter’s Five Forces and the Auto Industry
Porter’s five major forces shaping all industries and structures are: the bargaining power of buyers, the bargaining power of suppliers, competitive rivalry in the industry, threats of new entrants and threats of substitutes (Porter, 1979). Bargaining Power of Automotive Buyers
In recent years, this seems to have weighed heavily towards buyers - with industry players needing to be more vigilant regarding consumer preferences. Because of the current global economic conditions, there is a smaller number of buyers at both US and global levels. This is most evident in Europe currently with Ford having to close plants, cutting 6,200 employees, or 13% of the European workforce to stem losses exceeding US$1.5 billion (Barr, October 25, 2012). Consumers are also keeping their automobiles for longer, and being more prudent and judicious when buying new. Strategically, the opportunity is for the industry to focus on fuel efficiency and price sensitive strategies more fully to shift from profit and production models previously centered on trucks and SUV’s. Bargaining Power of Automotive Suppliers
The Industry Analysis Handbook 2012 describes the automobile supply business as fragmented. Many suppliers rely on one or two automakers for the purchase of the majority of their products. Because of this, suppliers hold little power and are susceptible to demand and requirement of automobile manufacturers. The exception within this is the world price of steel.
Industry ProfileThe “big three” US Domestic market leaders remain General
Motors, Ford and Chrysler. Foreign competitors include Toyota, Honda, Hyundai and Nissan. As of October 2012, US market share is divided into 15.6% Toyota, 15.3% General Motors, 12.0% Ford, 11.4% Hyundai-Kia, 8.5% Honda. In total, this makes up, 62.8% of the market with a classification of a medium concentration level, and very high revenue volatility (IBIS World, October 2012). Comparing a previous quarter’s market share (January-May, 2012), GM led with 17.8% followed by Ford 15.6%, Toyota 14.5%, Chrysler-Fiat, 11.5, Honda, 9.6% and Nissan 8.1% (Zacks, June 2012). The variance shows the degree of competition in the marketplace.
Because of the current state in the global economy, higher oil prices and movement towards green technologies, the automotive industry is in a state of transition. Hybrid vehicles, fuel efficiency and technologi-cal innovation are paramount. Larger trends include moves to smaller, more fuel efficient vehicles and moves towards more robust techno-logical frameworks on production and product levels. The global in-dustry is highly capital and labor intensive with the US domestic indus-try comparatively hampered by significant historical legacy costs (i.e. UAW). Labor, materials and advertising are all significant costs (Indus-try Handbook, 2012). Sales occur through individual and high-volume fleet sales, with the seasonal highs in April-June, and lows November-January (Industry Handbook, 2012). Revenue comes from sales, as well as financing, leases and extended warranties. Industry Market Structure
The oligopolistic market is dominated by a small number of manu-facturers (10 or less) whose actions directly influence one another’s profits. The U.S. Bureau of Census of 2007 reports that four firms dom-inate 68% of the motor vehicle market and eight firms dominate 86% of the market (Samuelson). The fates of oligopoly automotive industry firms are mutually interdependent (Samuelson), and this may be best retrospectively witnessed in the recent financial crisis of 2009 where all of the big three US automotive manufacturers went into dire economic straits, and faced similar challenges. While there is class uniformity in that all of the major auto manufacturers produce vehicles for transport; there is also wide variation in product features, prices and range of op-tions. Because of this, advertising and marketing to various market segments also becomes extremely important.
The industry is partially protected by the high barriers of entry in in-troducing new products, which include production facilities, vehicle de-velopment costs, advertising and marketing infrastructure (Samuelson).
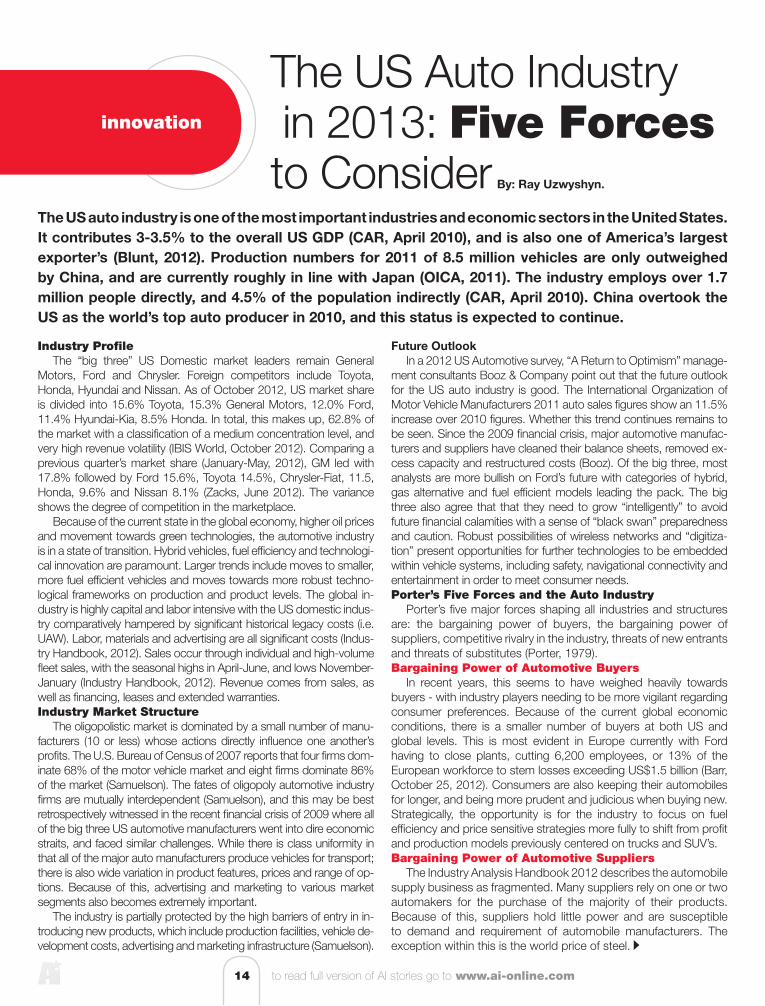
The US Auto Industry in 2013: Five Forces to Consider By: Ray Uzwyshyn.
The US auto industry is one of the most important industries and economic sectors in the United States. It contributes 3-3.5% to the overall US GDP (CAR, April 2010), and is also one of America’s largest exporter’s (Blunt, 2012). Production numbers for 2011 of 8.5 million vehicles are only outweighed by China, and are currently roughly in line with Japan (OICA, 2011). The industry employs over 1.7 million people directly, and 4.5% of the population indirectly (CAR, April 2010). China overtook the US as the world’s top auto producer in 2010, and this status is expected to continue.
16 to read full version of AI stories go to www.ai-online.com
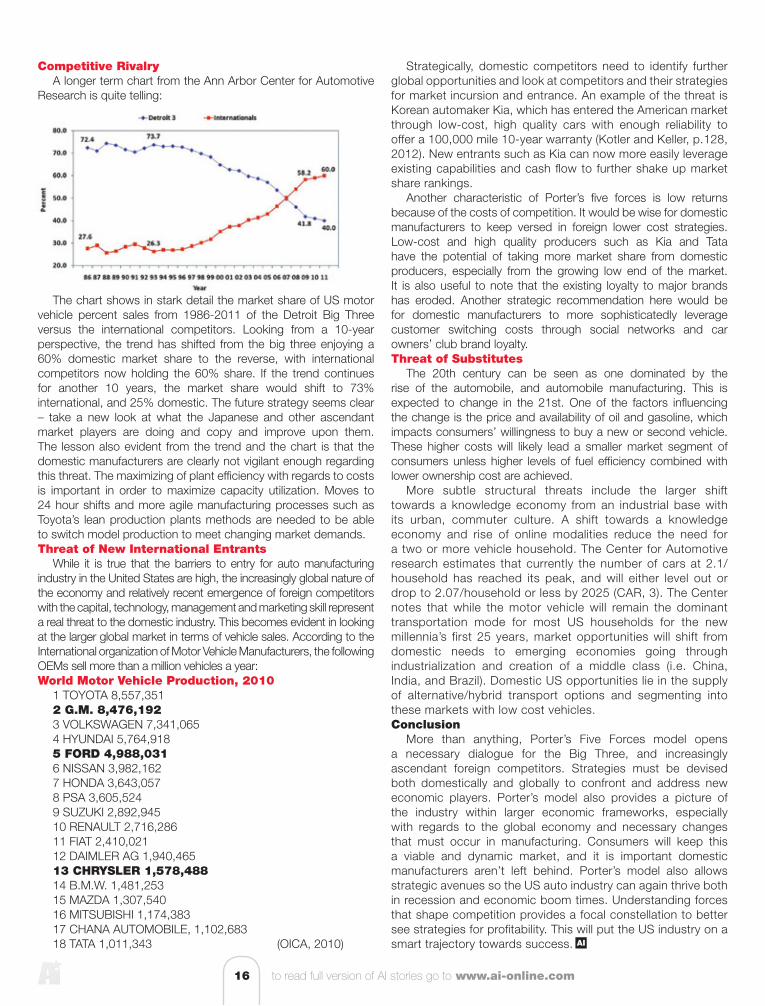
Competitive RivalryA longer term chart from the Ann Arbor Center for Automotive
Research is quite telling:
The chart shows in stark detail the market share of US motor vehicle percent sales from 1986-2011 of the Detroit Big Three versus the international competitors. Looking from a 10-year perspective, the trend has shifted from the big three enjoying a 60% domestic market share to the reverse, with international competitors now holding the 60% share. If the trend continues for another 10 years, the market share would shift to 73% international, and 25% domestic. The future strategy seems clear – take a new look at what the Japanese and other ascendant market players are doing and copy and improve upon them. The lesson also evident from the trend and the chart is that the domestic manufacturers are clearly not vigilant enough regarding this threat. The maximizing of plant efficiency with regards to costs is important in order to maximize capacity utilization. Moves to 24 hour shifts and more agile manufacturing processes such as Toyota’s lean production plants methods are needed to be able to switch model production to meet changing market demands. Threat of New International Entrants
While it is true that the barriers to entry for auto manufacturing industry in the United States are high, the increasingly global nature of the economy and relatively recent emergence of foreign competitors with the capital, technology, management and marketing skill represent a real threat to the domestic industry. This becomes evident in looking at the larger global market in terms of vehicle sales. According to the International organization of Motor Vehicle Manufacturers, the following OEMs sell more than a million vehicles a year:World Motor Vehicle Production, 2010
1 TOYOTA 8,557,351 2 G.M. 8,476,192 3 VOLKSWAGEN 7,341,0654 HYUNDAI 5,764,9185 FORD 4,988,0316 NISSAN 3,982,162 7 HONDA 3,643,0578 PSA 3,605,5249 SUZUKI 2,892,94510 RENAULT 2,716,28611 FIAT 2,410,02112 DAIMLER AG 1,940,465 13 CHRYSLER 1,578,48814 B.M.W. 1,481,25315 MAZDA 1,307,54016 MITSUBISHI 1,174,38317 CHANA AUTOMOBILE, 1,102,68318 TATA 1,011,343 (OICA, 2010)
Strategically, domestic competitors need to identify further global opportunities and look at competitors and their strategies for market incursion and entrance. An example of the threat is Korean automaker Kia, which has entered the American market through low-cost, high quality cars with enough reliability to offer a 100,000 mile 10-year warranty (Kotler and Keller, p.128, 2012). New entrants such as Kia can now more easily leverage existing capabilities and cash flow to further shake up market share rankings.
Another characteristic of Porter’s five forces is low returns because of the costs of competition. It would be wise for domestic manufacturers to keep versed in foreign lower cost strategies. Low-cost and high quality producers such as Kia and Tata have the potential of taking more market share from domestic producers, especially from the growing low end of the market. It is also useful to note that the existing loyalty to major brands has eroded. Another strategic recommendation here would be for domestic manufacturers to more sophisticatedly leverage customer switching costs through social networks and car owners’ club brand loyalty. Threat of Substitutes
The 20th century can be seen as one dominated by the rise of the automobile, and automobile manufacturing. This is expected to change in the 21st. One of the factors influencing the change is the price and availability of oil and gasoline, which impacts consumers’ willingness to buy a new or second vehicle. These higher costs will likely lead a smaller market segment of consumers unless higher levels of fuel efficiency combined with lower ownership cost are achieved.
More subtle structural threats include the larger shift towards a knowledge economy from an industrial base with its urban, commuter culture. A shift towards a knowledge economy and rise of online modalities reduce the need for a two or more vehicle household. The Center for Automotive research estimates that currently the number of cars at 2.1/household has reached its peak, and will either level out or drop to 2.07/household or less by 2025 (CAR, 3). The Center notes that while the motor vehicle will remain the dominant transportation mode for most US households for the new millennia’s first 25 years, market opportunities will shift from domestic needs to emerging economies going through industrialization and creation of a middle class (i.e. China, India, and Brazil). Domestic US opportunities lie in the supply of alternative/hybrid transport options and segmenting into these markets with low cost vehicles. Conclusion
More than anything, Porter’s Five Forces model opens a necessary dialogue for the Big Three, and increasingly ascendant foreign competitors. Strategies must be devised both domestically and globally to confront and address new economic players. Porter’s model also provides a picture of the industry within larger economic frameworks, especially with regards to the global economy and necessary changes that must occur in manufacturing. Consumers will keep this a viable and dynamic market, and it is important domestic manufacturers aren’t left behind. Porter’s model also allows strategic avenues so the US auto industry can again thrive both in recession and economic boom times. Understanding forces that shape competition provides a focal constellation to better see strategies for profitability. This will put the US industry on a smart trajectory towards success. AI