The Urban Travel Behavior Behavior and … Urban Travel Behavior Behavior and Constraintsand...
34
The Urban Travel The Urban Travel Behavior Behavior and Constraints and Constraints of Low Income of Low Income Households and Females Households and Females in in Pune, India Pune, India Angela Astrop Crowthorne University, United Kingdom 12
Transcript of The Urban Travel Behavior Behavior and … Urban Travel Behavior Behavior and Constraintsand...
The Urban TravelThe Urban TravelBehavior Behavior and Constraintsand Constraints
of Low Incomeof Low IncomeHouseholds and FemalesHouseholds and Females
in in Pune, IndiaPune, India
Angela Astrop
Crowthorne University, United Kingdom
12


215
The Urban Travel Behavior
A. Astrop
THE URBAN TRTHE URBAN TRAAVEL BEHAVEL BEHAVIOR AND CONSTRVIOR AND CONSTRAINTSAINTSOF LOW INCOME HOUSEHOLDS AND FEMALES INOF LOW INCOME HOUSEHOLDS AND FEMALES IN
PUNE, INDIAPUNE, INDIA
INTRODUCTION
In many cities in developing countries rapid population growth has meant that housing has developed inareas inadequately served by public transport services. This can have an effect on the quality of life ofresidents of these areas in terms of access to employment, shopping and medical facilities.
Before resources are allocated to increasing public transport provision in areas inhabited by the urbanpoor, it is necessary to discover what improvements need to be made to the network. This can beachieved by undertaking surveys of residents on travel demand using a questionnaire to obtain data onfrequency and mode of travel, problems incurred when making journeys etc. In addition, it is alsonecessary to obtain background information on the area studied and the culture of the society beingexamined as these factors can have a major influence on travel behavior.
As part of an Overseas Development Administration funded Technology Development and Research(TDR) program, the Transport Research Laboratory is undertaking studies of urban travel behavior inthree developing country cities: Accra in Ghana, Medellín in Columbia and Pune in India. Pune wasselected as a case study for this project as a large number of residents presently use motorized twowheelers, e.g. motorcycles and motorscooters and historically used cycles. In addition, as public trans-port services comprise suburban rail, stage bus, taxi and auto rickshaws it was thought that the residentswould have a wide choice of travel mode from journeying on foot to train services. During the 1980s aswell, a cycle network was established to encourage the use of cycles within the urban agglomeration.The network was planned to consist of lanes where cycles would be segregated from motor vehicles.Therefore the low income groups of Pune have access to a wide range of public transport services aswell as traffic lanes dedicated to cycles should they own and operate one.
The aim of the research is to discover which factors influence travel demand in low income households.In addition, particular emphasis has been placed on understanding the travel behavior of women, aswomen are often more disadvantaged than men in terms of access to transport services and infrastruc-ture. The results of the research will provide policy makers with an improved understanding of travelconstraints, and will therefore enable them to formulate better transport developmental projects whichwill in turn, provide improved accessibility to the transport network for low income households (andparticularly women) in developing countries.
RESEARCH METHODOLOGY
In order to obtain a complete picture of the travel demand and behavior of household members in Pune,six questionnaire surveys were carried out during May 1996. Firstly a household travel survey wasundertaken in nine neighborhoods. All household members aged sixteen years and over were inter-viewed in respect of their travel behavior; the head of the household also answered a series of questionsrelating to the travel behavior of any persons under sixteen years of age.

Women�s Travel Issues
Proceedings from the Second National Conference
216
Market trading is a major source of employment for women in India and therefore female market traderswere interviewed to ascertain whether their ability to travel to markets with goods was affected by thetype of transport available. In addition to these two surveys, interviews of female users of motorized twowheelers (mopeds, motor scooters and motorcycles), female cyclists and women using public transportwere also conducted. A number of interviews of male public transport users were undertaken to enablea comparison of public transport usage between men and women.
Both motorcyclists and cyclists were stopped during their journey and interviewed at the roadside. Thepublic transport users (both bus and rail users) were interviewed either on-board the vehicle while trav-elling, or while waiting at the bus stop or station.
In summary, the six surveys comprised:
Sample Size Household survey [number of households] 328 (comprising 1005 residents) Female Traders 199 Female Cyclists 204 Female motorized 2 wheelers users 587 Female public transport users 788 Male public transport users 227
PUNE METROPOLITAN REGION
Pune is an important regional centre of the State of Maharashtra and is situated 177 km south east ofBombay and covers around 810 square km. The population is now around 2.5 million, compared to800,000 in 1971, representing an increase of over 200 percent over the twenty-five year period.
The importance of Pune as an industrial centre has grown rapidly since the 1960s when industrial expan-sion in Bombay was banned. Consequently Pune has become a major centre in the state, having at-tracted heavy engineering industry such as motor vehicle manufacturing plants (buses, cars and motor-cycles). In addition to this, a number of multinational companies such as Phillips have manufacturingbases within the city. The industrial expansion of Pune was further aided by the Maharashtra IndustrialDevelopment Corporation who offered incentives to encourage industrial growth. Much of the localindustry is concentrated along the main Pune-Bombay highway, enabling manufactured goods to be dis-patched and supplies given to the factories without having to access the more congested centre of Pune.
Rural to urban drift and the immigration of people from other regions of India has occurred because ofthe employment opportunities created by rapid industrialization; this has also led to an acute housingshortage and an increase in slum settlements which are poorly served by transport infrastructure andservices. There has been a dramatic increase in the number of educational establishments in Pune overthe last 25 years. The corresponding rise in the number of students has placed additional demand onpublic transport services and the transport system.

217
The Urban Travel Behavior
A. Astrop
TRANSPORT PROVISION
PUBLIC TRANSPORT
Rapid population growth and industrial expansion have placed heavy demands both on the transportinfrastructure and public transport services, so that the present transport infrastructure in the city isstruggles to keep pace with the increasing population and their travel demands.
Bus services are supplied by Pune Municipal Transport (PMT) and Pimpri-Chinchwad Municipal Trans-port (PCMT). PMT currently operates 818 buses operating 63,400,000 km of route and transportsapproximately 227,500,000 passengers per annum; the corresponding figures for PCMT are 248 busesoperating 15,500,000 km, and carrying 48,000,000 passengers. Bus fares are charged on the basis of kmtravelled, and range from the minimum fare of 140 paise for 2 km to 1485 paise for a journey of 60 km.
In more developed countries, bus travel is increasingly viewed as a way of easing congestion in town andcity centres, and therefore there has been an increase in the number and variety of bus priority measuresin use. However, in Pune, little thought has been given to bus priority measures, and due to the presentroad layout and driving behavior, implementation of such measures would be problematic. Financialconstraints have made it difficult for the bus companies to expand their fleets, to replace ageing vehiclesand to generally provide an efficient service. Bus operations are further hindered by congestion, short-age of road space and a lack of road discipline.
In response to a lack of public transport provision, a number of major manufacturing companies havebegun providing commuter bus services for the sole use of their employees thereby guaranteeing thattheir work force arrive on time for their shifts. There are around 4000 company buses in Pune, which isover four times the number of public buses, and therefore suggests that there is considerable under-provision in the public sector service at the present time.
In addition to local bus services, there are also a number of intercity bus routes which offer servicesbetween Pune and other major cities such as Bombay, Bangalore and Hyderabad. A number of differentstandards of service are on offer, ranging from express air conditioned buses to stopping services; theprice of the journey is reflected in the quality of the service.
Since 1977 there has been an airport at Pune. As well as daily flights to Bombay (where connections canbe made to both domestic and international flights) there are less frequent flights to other destinations inIndia. The local airport has recently been refurbished to offer a higher quality to aid passenger comfort.
Pune is connected by rail to Bombay, Hyderabad, Madras and Miraj-Kolhapur. Many people use theseservices to commute daily either to or from Pune. There are currently 2515 taxis in Pune (of which 1900are tourist cars); these taxis tend not to provide services within Pune; rather they serve intercity routesfrom Pune to Bombay, Thane, Nasik, Ahmednagar, Kolhapur and Aurangabad.
Auto rickshaws have replaced horse drawn tongas as the major form of intermediate public transport inPune. They operate anywhere within Pune and are the major operator of taxi services within the city.Auto rickshaws tend to serve areas with poor bus service provision and offer a relatively cheap sourceof transport; for example, they are used to transport groups of children to school. The growth in thenumber of auto rickshaws along with other vehicles is shown in Table 1. The data illustrates the dramaticincrease in the number of auto rickshaws which has occurred over the last 25 years.

Women�s Travel Issues
Proceedings from the Second National Conference
218
Table 1
Growth in the Number of Registered Mechanized Vehicles
1960 1970 1980 1994Public Bus 434 994Truck 1590 3628 8302 21008L.C.V. 18 333 2506 5432Car, jeep, taxi 2658 7565 13962 37208Autorickshaw 207 2560 11038 22093Two-wheeler 1315 15048 72040 295008Other 185 844 1753 2341
PRIVATE TRANSPORT
Historically, Pune was known as the “cycle city of India”, however cycling has decreased in popularityas the ownership and use of motorized two-wheelers has increased. There has been rapid growth in thenumber of motorized two wheeled vehicles so that there are currently around 118 motorized two wheel-ers per 1000 population compared to 5.0 in 1965. The growth in motorized two wheelers is shown inTable 1. As a result of this growth, lanes dedicated for cycle users are now mainly used by motorized twowheeler users.
The growth in private car ownership has been slow due to the high purchasing and operating costs. In1975 there were 7.2 cars per 1,000 population, by 1994 this had approximately doubled to 14. Thiscontrasts with 337 cars per 1000 population in Great Britain in 1995 (Dept. of Transport StatisticalServices). Clearly, the motorized two-wheeler is the ‘motor car’ of the middle income of India.
HOUSEHOLD SURVEY
INTRODUCTION
The aim of the household survey was to obtain information about individuals’ travel patterns and attitudesand relate them to various household variables such as income, structure and location with respect to thecentral business district (CBD). Two research tools were developed specifically for this task, both takingthe form of an interviewer-administered questionnaire. The first questionnaire (general travel survey)concentrated on information about individuals, the second (head of household survey) sought informationabout the household.
For the purposes of the study a team of interviewers were employed who were able to speak English, Hindi(the language of Northern India) and Maharati (the local language). This ensured ease of communicationbetween survey supervisors and the survey team, and between the survey team and interviewee.
The survey teams visited households in pairs; one would ask the questions while the other recorded theresponses. Such a design allowed the interview to flow without the need for pauses, and gave the processa more ‘natural’ feel. The team were instructed to administer the first questionnaire individually to allmembers of the household who were present, over the age of 16 years. When this had been completed theteam were then required to administer the second questionnaire to the head of the household, or where thisperson was unavailable, to the most senior member present.

219
The Urban Travel Behavior
A. Astrop
Design and Subjects
Household income and distance from the home to the CBD are two variables of particular importance tothe study. The 328 households (taken from over 100 housing areas) approached were therefore classi-fied in terms of a measure of per capita income and distance from the CBD. The criteria used forclassification are as follows:
Per capita income Distance from CBD
Low/near Rs 0 - 1250 0 - 3 KmMid Rs 1251-2500 3 - 9 KmHigh/far Rs 2501 or more more than 9 Km
The number of households and individuals interviewed in each segment of the matrix are given in Table 2.
Table 2
Number of Households and Individuals Interviewed
HOUSEHOLDS INDIVIDUALSIncome Income
DISTANCE Low Mid High Total Low Mid High TotalNear 46 23 15 84 174 73 68 315Mid 55 62 29 146 179 174 76 429Far 25 52 21 98 73 142 46 261TOTAL 126 137 65 328 426 389 190 1005
RESULTS
Introduction
While in effect there are eighteen experimental groups (three by three matrix by sex), it was decided thatfor the purposes of analysis, comparisons between all possible group pairs would be too complicated aswell as unnecessary (because the emphasis of the study is on the behavior of the urban poor andfemales). Accordingly the analysis has been completed on two levels. In Section 5.2.2 the distancegrouping have been collapsed, allowing income groups to be compared while section 5.2.3 looks at thelow income group, but compares male and female respondents.

Women�s Travel Issues
Proceedings from the Second National Conference
220
Differences Between Income Groups
Demographic differences
Table 3 shows the means for a number of demographic and household variables. It should be remem-bered that households were assigned to groups on the basis of measured per capita income, defined asincome per person over the age of 16 years (not income divided by household size).
Table 3
Demographic and Household Variables
Income Group
Low Mid High
Percentage of male respondents 58% 60% 58% Mean age of respondent 35.8 36.0 36.9 Percentage of male household heads 95% 90% 81% Age of head of household 45 43 43 Household size ** 6.3 4.7 4.3 Household income (Rs) ** 3211 5956 18389 Per capita income (Rs)** 742 1755 5801 Transport expense (Rs)** 446 815 2031 Transport expense as % of household income 15.5% 14.0% 13.5%
** indicates significance better than 0.1%
Household size decreases from low through mid to high income households. This is as one would expectin the developing world. It is interesting that there is a higher percentage of female household heads in thehigh income group than in the low income group. This could be related to either household size orhousehold income. Large households are perhaps more likely to be able to provide a suitable malereplacement in the event of death or other absence. In relation to the latter, having significant wealth islikely to allow a female rather more independence or respect, and thus the ability to run the householdwithout the need to find a male replacement.
While it is not statistically significant, the final statistic—percentage of household income spent on trans-port—is interesting and is consistent with the findings of a number of other studies of households in India(e.g. Maunder, 1984). It should be noted that these figures have been calculated using data pairs (incomeand expenditure) for individual households, rather than using group means. Figure 1 further illuminatesthe expenditure data, and shows frequency values for the three income groups for grouped percentageexpenditure. The line corresponds to cumulative frequency. The graph demonstrates the reason for thenon-significance of the result, namely the large spread of figures with respect to the magnitude of themean.
Vehicle ownership varies greatly between groups. This can be seen in Figure 2 which shows the meanownership rates for cars, motorcycles and bicycles for households in the three income bands.

221
The Urban Travel Behavior
A. Astrop
Figure 1
Relationship Between Income Group and Transport Expenditure
All three groups have a level of bicycle ownership at around one per household. Ownership of both carsand motorized two-wheelers follows the predicted relationship with rising household income; these areexpensive item to own and operate.
Figure 2
Vehicle Ownership Levels
General trip characteristics
Respondents were asked a number of questions about the journeys that they make. These questionswere posed in two different ways: First respondents were asked about the journeys that they makeregularly; secondly they were asked about journeys for specific purposes.
cars motorcycles bicycles
Low Mid High
1.6
1.4
1.2
0.8
0.6
0.4
0.2

Women�s Travel Issues
Proceedings from the Second National Conference
222
Before commencing detailed analysis of the data it is worth discussing general differences between theincome groups. Table 4 shows the mean number of (return) trips made each day by individuals from thethree income bands. It can be seen that the three groups are remarkably similar. To find differences intrip rates one must investigate trips for specific purposes (see Sections 5.2.2.3 to 5.2.2.5).
Table 4
Daily Per Capita Trip Rates
Income Group
Low Mid HighNumber of return trips per day 1.03 1.04 1.02
Modal choice is a variable of considerable interest, since it is likely to be highly affected by income levels.Figure 3 shows the proportion of trips made by the income groups using different modes. There areobvious differences between the groups in modal choice. For instance, the use of motor cars increaseswith income. The same is true of motorized two-wheelers, although in all three groups a significantnumber of trips are made by this mode.
The modes incurring little or no cost are favored by the low-income group which is predictable. Interest-ingly, a higher proportion of trips are made by auto rickshaw by the lower income group than by thehigher income group, despite being expensive (compared to the bus). It could be that the higher incomegroups simply do not like to travel by auto rickshaw, and the decision is not financial. An alternativeexplanation—supported by the finding that the high income group also make less journeys by bus—is thathigh income individuals do not need to use these modes because of their high levels of motorized vehicleownership.
Figure 3
Modal Choice by Income Group; All Trips
Table 5 shows the mean journey distance by mode for the income groups. As one might expect, the lowincome group travel further using cheaper, more effortless modes (walk and bicycle) than the higherincome groups, although for cycling the difference is only marginal. The high income group travel furtherby car, motorcycle and bus than the low income group. This difference is reflected in differences inmean journey distance for all modes.

223
The Urban Travel Behavior
A. Astrop
Table 5
Mean Journey Distance, by Mode (km)
Income Group
Low Mid High Private car 3.5 8.0 11.2 M’cycle/scooter 6.9 8.0 8.1 Bicycle 4.3 3.9 4.2 Public Bus 7.9 9.5 10.5 Auto rickshaw 4.0 5.1 3.3 Walk 2.0 1.3 0.9 All modes 5.4 7.2 7.1
Work trips
The frequency of work trips was more or less uniform across the whole population, with most peopleworking five days per week or more. Table 6 gives details about work trip frequency. It should be notedthat this Table, and all similar Tables for specific journeys in this report, only includes those respondentswho responded that they do make trips for this purpose, and excludes all ‘negative’ responses. For worktrips 48 percent of the low, 53 percent of the mid and 47 percent of the high income groups reportedmaking at least some trips for work purposes.
Table 6
Frequency of Work Trips
Income Group
Low Mid High 5 times per week or more 92% 96% 90% 2-4 times per week 2% 2% 6% Once a week or less 6% 2% 4%
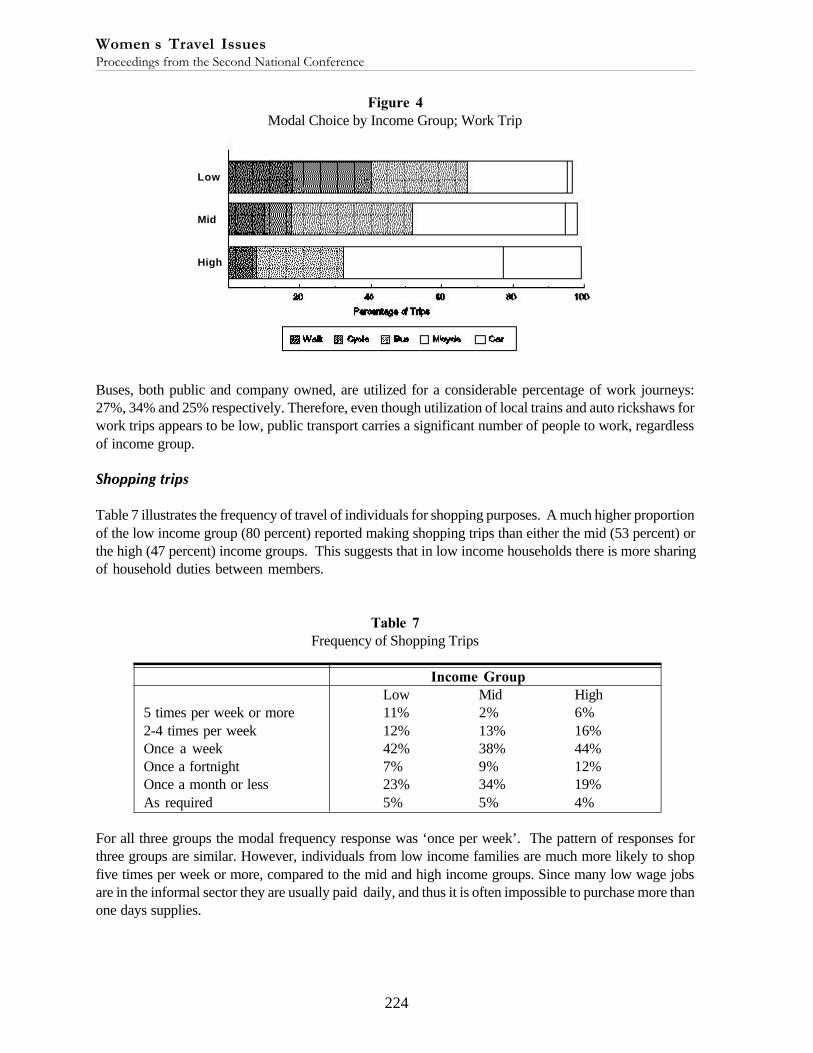
Figure 4 shows intergroup differences in modal choice for work trips. It can be seen that walking as amode of transport is more highly favored by individuals from low income households. Cycling alsofollows a similar pattern. The opposite trend clearly occurs in relation to travel by car, and to a lesserextent to travel by motorcycle/scooter. It is interesting to note that the most common mode of transport(the modal mode) for all three groups is the motorized two-wheeler (motorcycle), reflecting the rise inownership of these vehicles.
The percentage of trips made by personal motorized vehicles equates to 30 percent, 47 percent and 67percent for low, mid and high income individuals respectively. For personal non-motorized travel (walkand cycle) the figures are 40 percent, 18 percent and 8 percent respectively. This relationship is probablyrelated not only to income but also to the distance that the three groups tend to travel for work journeys(6.2 km, 9.7 km and 11.0 km respectively)
Women�s Travel Issues
Proceedings from the Second National Conference
224
Figure 4
Modal Choice by Income Group; Work Trip
Buses, both public and company owned, are utilized for a considerable percentage of work journeys:27%, 34% and 25% respectively. Therefore, even though utilization of local trains and auto rickshaws forwork trips appears to be low, public transport carries a significant number of people to work, regardlessof income group.
Shopping trips
Table 7 illustrates the frequency of travel of individuals for shopping purposes. A much higher proportionof the low income group (80 percent) reported making shopping trips than either the mid (53 percent) orthe high (47 percent) income groups. This suggests that in low income households there is more sharingof household duties between members.
Table 7
Frequency of Shopping Trips
Income Group
Low Mid High5 times per week or more 11% 2% 6%2-4 times per week 12% 13% 16%Once a week 42% 38% 44%Once a fortnight 7% 9% 12%Once a month or less 23% 34% 19%As required 5% 5% 4%
For all three groups the modal frequency response was ‘once per week’. The pattern of responses forthree groups are similar. However, individuals from low income families are much more likely to shopfive times per week or more, compared to the mid and high income groups. Since many low wage jobsare in the informal sector they are usually paid daily, and thus it is often impossible to purchase more thanone days supplies.
Low
Mid
High

225
The Urban Travel Behavior
A. Astrop
The pattern of modal choice for shopping trips differs from that for employment purposes, and is shownin Figure 5.
Figure 5
Modal Choice by Income Group; Shopping TripsThe relationship between modal choice and income is not so distinct, especially for less costly modes.
For example, both low and high income groups make a higher percentage of walk trips than the mid-income group. This is likely to be a result of differences in mean journey length, which is 4.5 km, 6.0 kmand 3.8 km for low, mid and high income groups respectively.
For high-cost modes—cars and motorcycles—the expected pattern is found; usage increases with in-come. The percentage of trips made by personal motorized vehicles is 18%, 39%, and 52% respectivelyfor the three groups. The percentage of trips made by personal non-motorized modes are 36 percent, 13percent and 22 percent respectively. Public transport, in the form of buses and auto rickshaws, is used bymany individuals from all three groups, being utilized for 46 percent, 47 percent and 25 percent of jour-neys respectively.
For shopping trips the three groups differ in terms of the modal mode. For the low income group it is thebus which is most frequently used (32% of journeys); for mid and high income groups it is the motor-cycle/scooter (35% and 33% respectively).
Education trips
Many of the people interviewed were students (23 percent, 20 percent and 17 percent of the groupsrespectively reported making trips for education purposes) and therefore information about journeys toeducation establishments was obtained. Table 8 shows the trip frequency for the three groups. As wouldbe expected a vast majority individuals travel at least five times per week. Only the high income grouphas a notable number of individuals who travel less frequently for education purposes. The mean age ofthe high income group is slightly higher than that for the other groups. This fact, combined with thelikelihood of this group having more disposable income, could suggest that a higher number of the highincome group attend night school, which involves expense, and is unlikely to involve travel more thantwice per week.
Low
Mid
High

Women�s Travel Issues
Proceedings from the Second National Conference
226
Table 8
Frequency of Education Trips
Income Group
Low Mid High 5 times per week or more 80% 81% 69% 2-4 times per week 3% 3% 10% Once a week 5% 4% 10% Less than once a week 12% 12% 11%
Modal choice for education trips is shown in Figure 6. The distribution of modes is similar to that foundfor work trips.
Figure 6
Modal Choice by Income Group; Education Trips
A considerable number (59 percent) of trips are undertaken by personal motor vehicle by the highincome group, presumably a result of parents giving a lift to other young adults. The bus is a popularmode with all three groups, but especially the low and mid income groups. The bicycle is predomi-nantly used by the low income group. Mean journey distances are 6.7 km, 7.3 km and 10.5 km respectively.
Low Income Households: Gender Differences
The results from the household survey suggest that females are not often in a strong bargaining positionwhen it comes to the utilization of vehicles owned by the household. In addition, public opinion, tends to beagainst women using two-wheelers—the fastest growing transport mode (although these opinions arechanging). Therefore one would expect the travel behavior of men and women to differ.
Low
Mid
High
227
The Urban Travel Behavior
A. Astrop
Demographic differences
Table 9 shows the sex split of the low income group and shows mean age. It can be seen that moremales than females were interviewed, but enough females responded to have confidence in the data. Themen were, on average, slightly younger than the women, but this difference is not significant.
Table 9
Number and Mean Age of Respondents
Male Female
Number of respondents 103 74Mean age 34.6 37.8
General trip characteristics
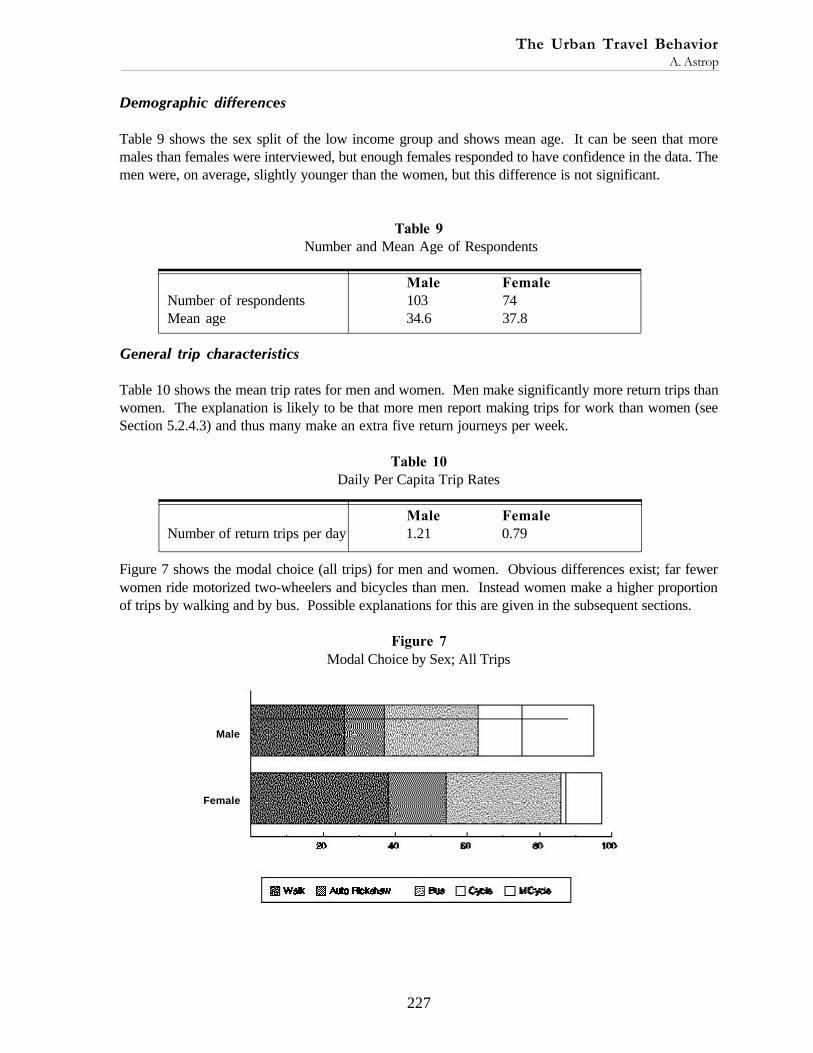
Table 10 shows the mean trip rates for men and women. Men make significantly more return trips thanwomen. The explanation is likely to be that more men report making trips for work than women (seeSection 5.2.4.3) and thus many make an extra five return journeys per week.
Table 10
Daily Per Capita Trip Rates
Male Female
Number of return trips per day 1.21 0.79
Figure 7 shows the modal choice (all trips) for men and women. Obvious differences exist; far fewerwomen ride motorized two-wheelers and bicycles than men. Instead women make a higher proportionof trips by walking and by bus. Possible explanations for this are given in the subsequent sections.
Figure 7
Modal Choice by Sex; All Trips
Male
Female

Women�s Travel Issues
Proceedings from the Second National Conference
228
Table 11 gives the mean journey length by mode for the sexes. Men on average have marginally longerjourneys than women by 0.5 km. This is mainly due to larger distances travelled by bus. For the othermodes the two groups are fairly comparable.
Table 11
Mean journey length by mode
Male Female
Motorcycle/scooter 4.2 4.7Bicycle 2.1 1.0Public bus 8.4 7.2Auto rickshaw 3.0 3.3Walk 2.4 2.4All modes 4.2 3.7
Work trips
Frequency of making work trips is shown in Table 12. As one would expect the modal response for bothmales and females is working ‘at least five times per week’. It is interesting to note that it is morecommon for women to work less than five times per week than men, which implies that more women areemployed on a part-time basis. A much higher proportion of men than women make work trips: 68percent compared to 19 percent. Thus from the sample it is evident that far fewer women than men areemployed and so need to travel for such a purpose.
Table 12
Frequency of Making Work Trips
Male Female
Five times or more 93% 83%2-4 times per week 2% 3%Once a week or less 5% 14%
Figure 8 illustrates considerable differences between the sexes in terms of modal choice.
Figure 8
Modal Choice by Sex; Work Trips
Male
Female

229
The Urban Travel Behavior
A. Astrop
The modal mode for women is walking, whereas for men it is the motorcycle or scooter. This differencemay be explained in part by the fact that the mean home to work journey is shorter for women than men(4.6 km compared to 6.5 km). However, there are obviously many women who travel considerabledistances to work (the mean is 4.6km). It would appear that these women take the bus rather than usea bicycle or motorized two-wheeler.
The difference is likely to be for two reasons. Firstly, women tend not to have the same degree of accessto family-owned vehicles as men. Secondly, women’s perceptions of the safety of bicycles and two-wheelers tend to be lower than those of men (see Section 5.2.3.6). Therefore, even when a woman hasaccess to such modes she may prefer to walk or catch a bus (although this may not be the case foraffluent females).
Shopping trips
Frequency of making shopping trips is shown in Table 13. As for work trips, the two sexes demonstratesimilar frequency patterns, although women do tend to shop slightly more frequently. Similar proportionsof the two groups reported ever making shopping trips: 76 percent for males and 79 percent for females.
Table 13
Frequency of Making Shopping Trips
Male Female
Five times or more 9% 11%2-4 times per week 11% 14%Once a week 41% 43%Once a fortnight or less 39% 32%
Figure 9 shows modal choice for the two sexes. As with work trips, there are differences in modal choice.
Figure 9
Modal Choice by Sex; Shopping Trips
Male
Female

Women�s Travel Issues
Proceedings from the Second National Conference
230
Unlike work trips, males and females have the same modal mode for shopping trips, namely the bus.Other than this, however, the patterns are largely the same as for work trips; more women than mentravel by foot whereas men more frequently use a motorcycle/scooter.
Both sexes make more use of the auto rickshaw for shopping than they do for either work or educationtrips. This is likely to be due to a trade off between cost and frequency, and the convenience offered bythe mode needing to carry a heavy load. Males and females travel approximately the same distance forshopping trips, i.e. males 5.0 km and females 4.3 km.
Education trips
The frequency of making education trips is shown in Table 14. For males 21 percent reported makingeducation trips; for females 23 percent.
Table 14
Frequency of Making Education Trips
Male Female
Five times or more 82% 76%2-4 times per week 4% 2%Once a week or less 14% 12%
The pattern for the two sexes is similar. As with work and shopping trips, however, the pattern of modalchoice differs. See Figure 10.
Figure 10
Modal Choice by Sex; Education Trips
The modal mode for females is the bus, whereas for men it is the bicycle. Few women (19 percent) useeither a bicycle or a motorized two-wheeler, whereas 63 percent of men use one of these two modes.This reflects the pattern previously found, i.e. two-wheelers being less frequently used by women andmore frequently used by men. For education trips, males tend to travel slightly further than women (7.4km compared to 6.0 km).
Male
Female

231
The Urban Travel Behavior
A. Astrop
Attitudes towards private vehicles
Figure 11 shows the affirmative responses of males and females in relation to bicycles. Considerablymore men than women ever make a journey by bicycle. In addition, men rate bicycles as being signifi-cantly safer and more comfortable than women. Quite which of these factors causes the other isimpossible to discern.
Figure 11
Attitudes Towards Bicycles
Figure 12 shows the responses for motorcycles/scooters. Fewer men ride a motorized two-wheeler thanride a bicycle, whereas the opposite is true for women. Nevertheless, significantly more men ride amotorized two-wheeler than women. As previously mentioned, public opinion has been against womenriding two-wheelers, which may in part explain the finding. However, public opinion has been changingover time, and so in future one would expect an increase in the number of female two-wheeler users.Section 6 deals exclusively with women and two-wheeled transport.
Figure 12
Attitudes Towards Motorcycles/Scooters
Similar patterns exist for the other questions. While women rate motorcycles/scooters more highly thanthey rate bicycles, men remain significantly more positive.
Per
cent
age
of R
espo
nse
Per
cent
age
of R
espo
nse
100
80
60
40
20
0
100
80
60
40
20
0
Ever Use** Safe** Acceptable* Comfortable**
Ever Use** Safe** Acceptable* Comfortable**
Male Female*indicates p<0.05,; **indicates p<0.01
*indicates p<0.05,; **indicates p<0.01 Male Female

Women�s Travel Issues
Proceedings from the Second National Conference
232
Attitudes towards public transport
Table 15 shows the complaints that males and females have about the use of public transport. The mostinteresting finding is that a higher proportion of women rate overcrowding as a problem. This is under-standable since sexual harassment (known as ‘Eve-teasing’) is common on public transport vehicles.
Table 15
Problems of Using Public Transport
Male Female
Overcrowding 28% 41% Rude/cheating staff 5% 6% Too expensive 1% 3% Not enough buses/routes 14% 8% Have to wait too long 25% 18% Irregular 15% 19% Other 12% 5%
As previously found, suggested improvements (see Table 16) are linked to perceived problems. It is ofinterest to note however that very few women want to see the introduction of female-only buses (asopposed to the very popular women-only carriages on trains). Instead of single-sex buses, women wouldlike to simply see more buses operating, and thereby reducing the overcrowding which is so evident attimes.
Table 16
Suggested Improvements to Public Transport
Male Female
Improve regularity 45% 39% Better staff behavior 3% 5% More buses 21% 32% Improve punctuality 13% 11% Make cheaper 3% 5% Introduce female-only buses - 2% Other 15% 6%
Improve regularityBetter staff behaviorMore busesImprove punctualityMake cheaperIntroduce female-only busesOther
233
The Urban Travel Behavior
A. Astrop
FEMALES AND TWO WHEELED VEHICLES
INTRODUCTION
In many developing countries, bicycles have grown in popularity as a means of personal transport as theyoffer a relatively cheap form of travel once they have been purchased. As income levels rise however,cycles tend to be replaced by motorized two wheelers such as motorscooters, mopeds and motorcycles,particularly among middle income groups.
In Pune, females are increasingly using these forms of personal transport to travel; and it does not appearunusual for households in middle and higher income groups to have access to both a motorcycle (pre-dominantly used by males) and a moped/motorscooter (for use by females). Thus, females are nowhaving a greater degree of personal freedom regarding travel. As they become less reliant on publictransport, they should theoretically have increased accessibility and mobility to better employment oppor-tunities as well as social, leisure and shopping facilities. In order to ascertain whether this hypothesis iscorrect, questionnaire surveys were carried out for a sample of female cyclists and moped/motorscooterusers. Two hundred and four female cyclists and 587 moped/motorscooter users were interviewed. Thedifferences in sample sizes occurred because there were fewer female cyclists observed than moped/scooter users; however the sample sizes are large enough to be representative of the users and to allowstatistical analysis.
Cundill (1986) in his research in Kenya noted that the equi-probability income (i.e the income level atwhich the car ownership level is 50 percent) seems to be falling. This would suggest that car ownershipwould increase regardless of whether household income increases. This is likely to hold true for motor-ized two wheelers in India. As the vehicles are manufactured in India and are not subject to high importcosts, the ‘real’ price of manufacturing should decrease and they will be cheaper to purchase. Conse-quently, it is likely that there will be continued growth in the number of motorised two wheelers in use in India.
PROFILES OF THE RESPONDENTS
Age
Table 17 shows the age-groups of both groups of respondents. As the Table shows, the mean age ofmotorscooter users is older than that for sample of cyclists. The age distribution is also different for thetwo samples; a much larger proportion of cyclists are under 20 compared to the motorscooter users.This difference maybe partially attributable to the fact that persons have to be over 18 years of age inorder to be eligible for a motorscooter licence, but may also reflect a higher proportion of students amongcyclists than the motorscooter sample.

Women�s Travel Issues
Proceedings from the Second National Conference
234
Table 17
Age of respondents
Age Cyclists Moped/Motorscooter users
20 and under 56.5% 23.4% 21-30 36.3% 47.4% 31-40 5.7% 21.2% 41-50 1.0% 6.1% 51+ 0.5% 1.9% Mean age 21.5 27.7
Marital Status
In both surveys, a large proportion of the respondents were single, though a higher proportion ofmotorscooter users were married (see Table 18) probably due to the fact that a larger percentage of thecyclists were below the current marriageable age of 18 years for females, though in practice this legalrestriction is not always conformed to.
Table 18
Marital Status
Cyclists Moped/Motorscooter users
Single 63.6% 46.8% Married 36.4% 52.7% Widowed - 0.5% Divorced/separated - -
Income, Employment and Education
The respondents were asked their occupation and salary. The results are shown in Table 19. Only 20percent of the sample of cyclists were in paid employment compared to 60 percent of the motorscooterusers (as stated previously, a large proportion of the cyclists were students). The income levels for thecyclists are relatively low suggesting that maybe a large number are in some form of part-time employ-ment, possibly fitting in with their educational commitments. The mean monthly income of the cyclistswas one third of that of the motorscooter users.
Table 19
Occupation and monthly income
Cyclists Moped/Motorscooter users
Student 68.9% 35.3% Housewife 9.8% 4.4% Clerical/admin. 2.9% 9.1% Tertiary 17.8 43.9% Professional - 6.4% Other 0.6% 0.9% Mean monthly income Rs 1505 Rs 4540

235
The Urban Travel Behavior
A. Astrop
The mean cost of purchasing a vehicle was Rs 1275 for a bicycle and Rs 20115 for a Moped/motorscooter.In general, female motorscooter users are more highly qualified than female cyclists and mean monthlyincome tends to reflect this.
Access to Vehicles and Vehicle Ownership
Vehicle ownership is shown in Table 20. A larger proportion of the moped/motorscooters users thancyclists personally owned their vehicle. Also a much higher percentage of motorscooters than cycleswere owned by the respondents’ husbands (although, as stated previously, more motorscooter userswere married than cyclists).
Table 20
Vehicle Ownership
Cyclists Moped/Motorscooter users
Respondent 32.1% 38.8% Husband 5.7% 21.1% Family 62.2% 39.1% Other - 1.0%
Despite the fact that around two thirds of both samples replied that their vehicle was owned by husbandsand other family members, over 90 percent of cyclists and 80 percent of the motorscooter users statedthat they had access to the vehicle whenever they wanted it (see Table 21). Thus, the vehicles were onlyused by other family members when they were not required by the respondent. This appears to contra-dict the findings of section 5.2.3, which suggests that women take the bus or walk because the men usethe motorcycle/scooter. It is important to remember, however, that the two populations are different;Section 5.2.3 looked at all low-income household members, whereas the present section concentrates onwomen who actually ride two-wheelers and thus are not subject to the same constraints. Other keyusers of the household owned vehicles include husbands, parents and brothers/sisters.
Table 21
Access to Vehicle
Cyclists Motorscooter/Moped users
Whenever want it 28.2% 31.2% Most of the time 63.0% 49.0% Sometimes 6.6% 18.0% Rarely 2.2% 1.8%
Table 22 shows that around 60 percent of respondents in both samples had purchased the vehicle them-selves. A greater proportion of cyclists than motorscooter users purchased their vehicle using their ownfunds, but around four times as many motorscooter users as cyclists obtained loans to purchase theirvehicle—presumably due to the relatively high purchase cost of the vehicle.

Women�s Travel Issues
Proceedings from the Second National Conference
236
Table 22
How the Vehicle was Purchased
Cyclists Moped/Motorscooter users
Own funds 40.2% 34.6% Loan/ Hire Purchase 5.9% 21.0% Gifts 13.2% 3.6% Other 0.5% 1.2% Vehicle not purchased by respondent 40.2% 39.7%
Table 23 shows other personal vehicles available to the household. The motorscooter users generallyhave more vehicles available within the household than the cyclists interviewed. They also have arounddouble the number of motorised two wheelers and four times as many cars. This obviously reflects agreater degree of affluence among motorscooter users as illustrated in Table 19.
Table 23
Additional Vehicles Available to the Household
Vehicle Cyclists Moped/Motorscooter users
Car 4.9% 21.5% Other bicycle 46.6% 42.1% Other motorised two wheeler 38.7% 63.5%
Note: Percentages add up to more than one hundred percent in the motorcycle users column becausesome households have access to more than one additional vehicle.
PUBLIC TRANSPORT USAGE
Around 75 percent of the female cyclists interviewed and 98 percent of motorscooter users also usepublic transport services to make journeys. The frequency with which these respondents use publictransport is illustrated in Table 24. The motorscooter users tend to use public transport services “asrequired”. This can cover a number of responses ranging from using public transport daily to once ayear, but does suggest usage on a non-regular basis. This also suggests a greater degree of affluenceamong the motorscooter users as they can make use of public transport when they choose to do so. It isalso possible that the respondents live in areas better served by public transport.
Table 24
Frequency of Use of Public Transport
Cyclists Moped/Motorscooter users
Five times a week or more - 2.8% Two - four times a week 24.1% 7.1% Once per week 22.7% 10.8% Once per fortnight 12.1% 5.9% Once per month 7.1% 8.0% Less than once a month/ occasionally 11.3% 5.9% As required 22.7% 59.5%

237
The Urban Travel Behavior
A. Astrop
Note: These are responses given by the cyclists and motorscooter users who stated that they used publictransport to make journeys, and it includes trips by bus, train and auto rickshaw.
JOURNEY PURPOSE
When interviewed the main journey purpose for female motorscooter users was ‘travelling to or fromwork’, and for the cyclists it was for ‘educational purposes’. A relatively small proportion of journeysbeing made at the time of interview for both samples was for ‘shopping purposes’, but Table 25 showsthat for both sets of respondents, shopping trips account for a large proportion of ‘other’ journey pur-poses (25 and 60 percent for cyclists and motorscooter users respectively). The higher percentage ofshopping trips undertaken by the motorscooter users may be accounted for by the fact that a largerproportion of these respondents are married and therefore the responsibility for buying food for thehousehold is more likely to lie with them than in cases where the respondents are unmarried. In addition,the higher income of the motorscooter users may mean that they are more likely to undertake shoppingas a leisure activity. Other activities using the two wheelers include social, medical and educationalactivities, the latter mainly by cyclists (see Table 26).
Table 25
Purpose of the Trip Being Made
Cyclists Moped/Motorscooter users
Travelling to/from work 30.8% 46.5% Shopping 8.7% 14.7% Social 3.1% 2.6% Medical 1.5% 3.9% Education 48.2% 29.6% Other 7.7% 2.7%
Table 26
Additional Journeys Made Using the Vehicle
Cyclists Moped/Motorscooter users
Travelling to/from work 14.2% 6.8% Shopping 25.0% 60.0% Social 25.5% 10.7% Medical 10.8% 4.3% Education 33.8% 5.8% Other 7.8% 4.9%
Note: the columns add up to more than 100 percent because some respondents made additional journeysfor more than one purpose.
The benefits that the respondents perceive from using their vehicle rather than public transport areshown in Table 27. For female cyclists, the modal response was that it was cheaper. However, for thefemale motorscooter users the modal response was that “by using their vehicle they would save time”, or“arrive at their destination on time.” As stated previously, a large proportion of motorscooter users were

Women�s Travel Issues
Proceedings from the Second National Conference
238
making work journeys and therefore ensuring that they arrive on time is obviously important. Cost isclearly of marginal importance to motorcycle owners as opposed to comfort and convenience which arefar more important.
Table 27
Benefits of using the vehicle (percent)
Cyclists Moped/Motorscooter
users
Time saving/arrive on time 9.8 51.4Cost saving 51.6 6.5Comfortable/easy to ride 17.4 24.0Exercise 12.1 -
Convenient 9.1 18.1TOTAL PERCENT 100 100TOTAL RESPONSES 132 691*
*Some respondents gave more than one answer to this question.
Although there are a number of benefits to using cycles and motorscooters, the respondents also re-ported a number of disadvantages. These are shown in Table 28.
Table 28
Lack of benefits of using the vehicle (percent)
Cyclists Moped/Motorscooter
users
Unsafe 23.9 15.1Not useful for long journeys 18.3 2.9Tiring 18.3 -
Time consuming 7.0 0.3Uncomfortable 28.3Expensive to buy/Operate and Maintain 61.9 -
Traffic/parking problems 12.5 -
Other 4.2 7.3Total percent 100 100Total responses 142 344
Both sets of respondents thought that their own safety when using the vehicle was a major problem, butother than this cyclists and motorscooter users have very different concerns. For the motorscooter users,the costs of buying, operating and maintaining the vehicle is a major issue, however, for the cyclists, thisis not a reason for concern. Parking motorcycles is a major problem in central area of Pune. The majorconcern of cyclists was that cycles are uncomfortable, tiring to operate and not particularly suitable forlong journeys.

239
The Urban Travel Behavior
A. Astrop
Although there is a lack of benefits to using both cycles and motorscooters, the benefits must outweighthe disadvantages of making the journey by another mode of transport. Table 29 shows why the respon-dents chose to use their vehicle rather than public transport for the particular journey they were makingwhen interviewed.
As Table 29 shows convenience is a major factor influencing the respondents decision to use their ownvehicle. Comfort and savings in time are also key reasons for motorcycle owners.
Table 29
Reasons for Not Using Public Transport for This Journey (percent)
Cyclists Moped/Motorscooter
users
Own vehicle is convenient 30.5 29.1 PT expensive/cheaper to use own vehicle 22.4 4.3 PT offers irregular services/inconvenient 17.2 5.0 Own transport readily available 4.6 0.9 No waiting with own vehicle/
saves time/ lengthy wait for PT 20.1 23.8 Easy to drive own vehicle 4.0 8.3 Comfortable 0.6 24.3 Safe 0.6 4.3 Total percentage 100 100 Total responses 174 703*
*Some respondents gave more than one answer to this question.
SURVEY OF FEMALE TRADERS
INTRODUCTION
Within many developing countries there are a growing number of female traders, particularly in theinformal trading sector such as at urban markets and roadside locations. The revenue generated bythese female traders can play a valuable contribution to the family income.
A one day survey of female traders was carried out as part of the field surveys. In total, 199 werequestioned on a number of issues regarding their travel and purchasing arrangements. This section of thereport analyses the results of the questionnaire.
TRADING
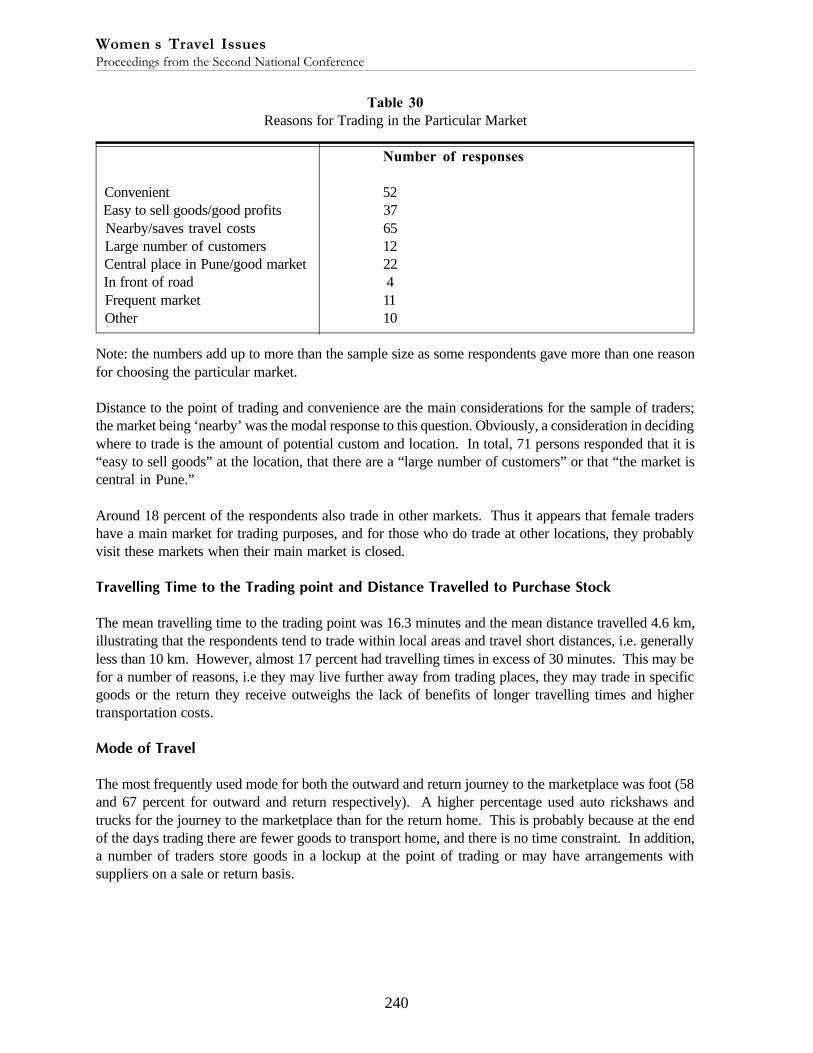
The respondents were asked about their trading arrangements. In response to the question “how oftendo you trade here”, 93 percent of the respondents stated that they traded on five or more days a week.In order to determine why the particular markets were attractive to the respondents, they were ques-tioned as to why they chose the particular market location. The results of this are shown in Table 30.
Women�s Travel Issues
Proceedings from the Second National Conference
240
Table 30
Reasons for Trading in the Particular Market
Number of responses
Convenient 52 Easy to sell goods/good profits 37 Nearby/saves travel costs 65 Large number of customers 12 Central place in Pune/good market 22 In front of road 4 Frequent market 11 Other 10
Note: the numbers add up to more than the sample size as some respondents gave more than one reasonfor choosing the particular market.
Distance to the point of trading and convenience are the main considerations for the sample of traders;the market being ‘nearby’ was the modal response to this question. Obviously, a consideration in decidingwhere to trade is the amount of potential custom and location. In total, 71 persons responded that it is“easy to sell goods” at the location, that there are a “large number of customers” or that “the market iscentral in Pune.”
Around 18 percent of the respondents also trade in other markets. Thus it appears that female tradershave a main market for trading purposes, and for those who do trade at other locations, they probablyvisit these markets when their main market is closed.
Travelling Time to the Trading point and Distance Travelled to Purchase Stock
The mean travelling time to the trading point was 16.3 minutes and the mean distance travelled 4.6 km,illustrating that the respondents tend to trade within local areas and travel short distances, i.e. generallyless than 10 km. However, almost 17 percent had travelling times in excess of 30 minutes. This may befor a number of reasons, i.e they may live further away from trading places, they may trade in specificgoods or the return they receive outweighs the lack of benefits of longer travelling times and highertransportation costs.
Mode of Travel
The most frequently used mode for both the outward and return journey to the marketplace was foot (58and 67 percent for outward and return respectively). A higher percentage used auto rickshaws andtrucks for the journey to the marketplace than for the return home. This is probably because at the endof the days trading there are fewer goods to transport home, and there is no time constraint. In addition,a number of traders store goods in a lockup at the point of trading or may have arrangements withsuppliers on a sale or return basis.
241
The Urban Travel Behavior
A. Astrop
Eighty-four percent of the sample carried their goods to the marketplace, this is possibly because of theshort distances travelled.
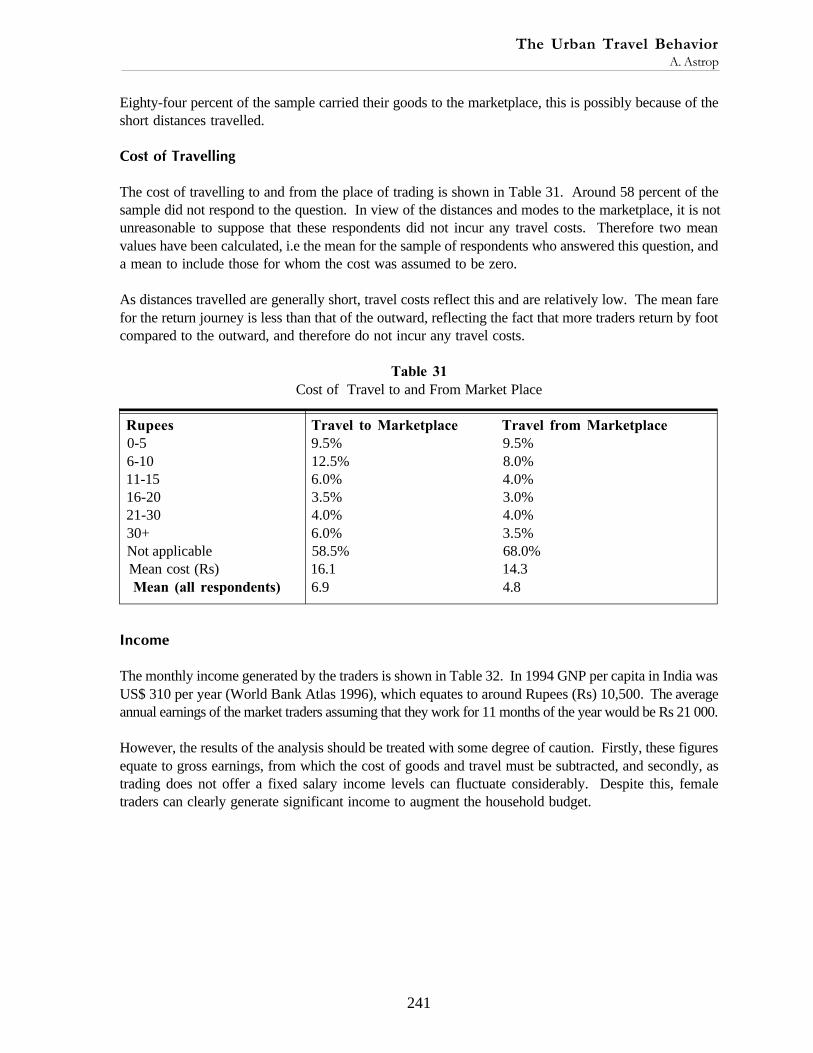
Cost of Travelling
The cost of travelling to and from the place of trading is shown in Table 31. Around 58 percent of thesample did not respond to the question. In view of the distances and modes to the marketplace, it is notunreasonable to suppose that these respondents did not incur any travel costs. Therefore two meanvalues have been calculated, i.e the mean for the sample of respondents who answered this question, anda mean to include those for whom the cost was assumed to be zero.
As distances travelled are generally short, travel costs reflect this and are relatively low. The mean farefor the return journey is less than that of the outward, reflecting the fact that more traders return by footcompared to the outward, and therefore do not incur any travel costs.
Table 31
Cost of Travel to and From Market Place
Rupees Travel to Marketplace Travel from Marketplace
0-5 9.5% 9.5% 6-10 12.5% 8.0% 11-15 6.0% 4.0% 16-20 3.5% 3.0% 21-30 4.0% 4.0% 30+ 6.0% 3.5% Not applicable 58.5% 68.0% Mean cost (Rs) 16.1 14.3 Mean (all respondents) 6.9 4.8
Income
The monthly income generated by the traders is shown in Table 32. In 1994 GNP per capita in India wasUS$ 310 per year (World Bank Atlas 1996), which equates to around Rupees (Rs) 10,500. The averageannual earnings of the market traders assuming that they work for 11 months of the year would be Rs 21 000.
However, the results of the analysis should be treated with some degree of caution. Firstly, these figuresequate to gross earnings, from which the cost of goods and travel must be subtracted, and secondly, astrading does not offer a fixed salary income levels can fluctuate considerably. Despite this, femaletraders can clearly generate significant income to augment the household budget.

Women�s Travel Issues
Proceedings from the Second National Conference
242
Table 32
Monthly Income
Rupees Percent
Less than 1000 13.7%1001-1500 42.6%1501-2000 19.8%2001-3000 10.6%3001+ 13.3%Mean income 1914 Rupees
PUBLIC TRANSPORT PASSENGER SURVEY
INTRODUCTION
Due to the relatively low levels of personal transport ownership in developing countries, public transportis a major mode of travel for urban residents, but especially for the urban poor and females. In order toassess how effective public transport is in terms of meeting users’ travel needs, questionnaire surveyswere conducted of users of local stage bus and train services. These interviews were conducted eitheron board the bus/train or at bus stops/train stations. To ascertain whether males and females havedifferent attitudes, needs and problems regarding public transport use, a sample of male and femalepassengers were interviewed and their responses are compared in this Section.
USER PROFILES
Age
On average, the bus passengers were older than train passengers; the mean age for the male and femalesample of bus users being 30.7 and 31.5 respectively, compared to 28.1 and 26.2 for the train users.There were a much higher proportion of train users in the 21-30 age group compared to the bus users,and a much higher percentage of bus users in the 40 plus category.
EMPLOYMENT AND INCOME
A much higher proportion of train users are in paid employment (see Table 33) compared to the bususers; around 64 percent of female bus users are either students or housewives/housepersons comparedto around 44 percent of train users. Thirty-one percent of male bus passengers and 15 percent of trainpassengers were either housepersons or students.

243
The Urban Travel Behavior
A. Astrop
Table 33
Occupation
Bus Passengers Train Passengers
Male Female Male Female Student 26.4% 18.6% 14.9% 33.2% Housewife/houseperson 4.2% 45.7% - 12.4% Clerical/admin. 2.1% 0.3% - - Tertiary 56.8% 29.5% 85.1% 44.9% Professional 2.8% 2.9% - 1.1% Secondary 2.8% - - 8.4% Retired 4.9% 0.2% - - Other - 2.8% - - Mean monthly income Rs3109 Rs3384 Rs2569 Rs2293
Bus passengers have a higher mean income than train passengers. Trains are often used to makelonger journeys, and in developing countries the urban poor tend to live a considerable distance fromthe city centre and therefore have to travel long distances into the centre. This may account for thelower mean income of train passengers compared to bus passengers.
Female bus users have a higher mean income than males. This may be because males with higherincome levels are able to afford some form of motorised personal transport and therefore travel usingtheir own vehicle. For females, issues such as safety are a consideration, and there maybe someconstraint due to public opinion (though the strength of this seems to be decreasing). Conversely, themean income of the male train users is higher than that of the females. This is presumably because amuch higher proportion of male than female train users were in paid employment.
Table 34 shows the purpose of the journey being made when the respondent was interviewed. Themain journey purpose for all users was for employment. However, a higher proportion of males weremaking work journeys compared to females; around a third more male train passengers were makingwork journeys than females, and almost twice as many male bus passengers compared to females.
A large proportion of female bus passengers were housewives/housepersons. This probably accountsfor the high percentage of female bus users making shopping trips.
Table 34
Journey Purpose
Bus Passengers Train Passengers
Male Female Male Female Work 52.0% 28.1% 64.5% 46.9% Shopping 7.3% 17.6% 0.0 8.9% School 20.7% 13.6% 18.4% 29.6% Social 4.0% 9.6% - 1.6% Recreation 3.3% 4.2% - 0.5% Hospital 4.7% 4.0% - 1.6% Religious 3.3% 7.6% 17.1% 3.6% Other 4.7% 15.3% - 7.3%
Women�s Travel Issues
Proceedings from the Second National Conference
244
USER ATTITUDES TO BUS AND TRAIN SERVICES
The respondents were asked questions regarding their attitudes to a number of different features of publictransport. They were asked to rate their responses on a 5 point scale ranging from “very good” to “very poor”.
Male bus users were more inclined to give bus services a higher rating than females. For example, 32 percentof male respondents stated that reliability was very good compared to 10 percent of the female sample. Lessthan one percent of females stated that overall the bus services were ‘very good’ compared to 9 percent of males.
These ratings highlight the fact that the female respondents perceive or experience more problems using busservices than the male respondents. The females were particularly concerned by the behavior of drivers/conductors and other passengers.
The attitudes of the female train passengers were similar to those of their bus counterparts in that they wereconcerned about the behavior of drivers and other passengers. However, in contrast to female bus passen-gers, 40 percent of the train users interviewed rated the behavior of other passengers as ‘very good’ or ‘good’(the corresponding figure for the bus users was around 31 percent). This may be because on certain local trainservices females have access to female-only carriages, and are therefore segregated from males.
Female train users also rated the ‘comfort’ and ‘convenience’ of train services and the ‘availability of connect-ing services’ more highly than male respondents.
Overall, the female train users rated the service more highly than males. For example 55 percent of femalesstated that overall, the train service was either ‘very good’ or ‘good’ compared to 1 percent of male respon-dents. In contrast 97 percent of males classified the service as being ‘average’ or ‘poor’ compared with 44percent of females.
SUMMARY AND CONCLUSIONS
The rapid development of Pune has led to substantial demand for travel both within the CBD and betweenresidential areas and manufacturing centres. Despite a considerable expansion of public transport services,the fleet has not kept abreast of demand. In response to this many of the leading manufacturers in Pune nowoperate large fleets of buses (both chartered and privately owned) to ensure their work force arrive on timeand thus production is not interrupted.
With rising affluence, ownership of motorised two-wheelers has quadrupled in the last 15 years and as aconsequence cycle usage has declined. The cycle network established during the 1980’s is therefore sharedby cyclists and riders of motorised two-wheelers. The bicycle however continues to be an important mode forstudents from the low- and mid-income households.
The survey findings illustrate that considerable differences exist between males and females in terms ofaccess to and the use of the various travel modes on offer. Females are much more likely to walk or take thebus, and this may be linked to the types of journeys they make, e.g. local shopping trips and escorting childrento school. Although such trips are essential for the ‘survival’ of the household, they are not wage earning, andthus are afforded less priority in terms of access to private vehicles.
245
The Urban Travel Behavior
A. Astrop
In higher income households which own a number of vehicles, such constraints do not appear to exist.There has been a growth in the number of women riding two wheeled vehicles, usually motorscootersand mopeds. This suggests that attitudes and traditions are beginning to change. Social and economicchanges are therefore making it both increasingly acceptable and increasingly affordable for females tohave a greater degree of personal mobility and independence.
Women perceive the bus service in Pune to be inferior to the local train service in terms of convenience,comfort and safety. This is largely due to the existence of female-only carriages on the trains. Interest-ingly, however, women appear disinterested in the idea of female-only buses (perhaps due to earlierunhappy experiences when sections of buses were caged for female security) and would prefer to seethe provision of more buses. A higher service frequency would as a consequence create a less crowdedand safer environment in which all, but especially females can travel in comfort.
Distances travelled throughout Pune are comparatively short, hence the high percentage of trips under-taken on foot. Even a large percentage of female market traders walk to the market despite having tocarry their goods. Although for most this journey is short, around 15 percent of the respondents whowalked to their trading point walked in excess of 30 minutes. This may be a result of inadequate publictransport facilities, or may be a financial constraint. However, some of the more successful markettraders are able to afford to travel by auto rickshaw.
Clearly, looking to the future, the public transport system needs to be developed and the fleet increased tokeep pace with the ever-growing size and travel needs of the population. Women appear to favor thetrain over the bus. Restrictions in rail-route planning make it unlikely that the rail network will expand,and thus it is the bus fleet and route network which needs to be expanded.
As incomes rise and attitudes change females are increasingly able to travel by moped or motorscooter.Thus the motorised two wheeler fleet in Pune is likely to grow substantially in the coming years. The roadnetwork needs to be planned accordingly.
The low income communities will continue to rely on inexpensive public transport services and travel onfoot to meet their mobility requirements. The bicycle will continue be an important means of personaltransport for low income households for a number of years to come, though in low income households,females do not generally have access to the household bicycle.
ACKNOWLEDGMENTS
The work presented in this Report forms part of a research program undertaken on behalf of the Over-seas Development Administration by the Overseas Resource Centre (Program Director Dr. J. Rolt) ofthe Transport Research Laboratory. The authors gratefully acknowledge the invaluable assistance pro-vided by the Director (Dr. S. Padam) and other Faculty members of the Central Institute of RoadTransport during field surveys in Pune in May 1996.
Women�s Travel Issues
Proceedings from the Second National Conference
246
REFERENCES
Department of Transport. (1996). “Transport statistics Great Britain, 1995.” London: HMSO.
Maunder, D. A . C. (1984). “Trip rates and travel patterns in Delhi, India.” TRRL Research Report
RR 1. Crowthorne: Transport Research Laboratory.
Cundill, M. A. (1986). “Car Ownership and use in Kenya.” Research Report RR 48. Crowthorne:Transport Research Laboratory.
World Bank (1996). “The World Bank Atlas, 1996.” Washington, D.C.: The World Bank.