The upper inflection point of the pressure-volume curve
8
Received: 26 June 2001 Accepted: 12 March 2002 Published online: 31 May 2002 © Springer-Verlag 2002 Abstract Objective: The pressure- volume (P/V) curve has been pro- posed as a tool to adjust the ventila- tory settings in cases of acute respi- ratory distress syndrome (ARDS). The aim of this study was to test the influence of P/V tracing metho- dology on the presence and value of the upper inflection point (UIP). Methods: In 13 medical ARDS pa- tients, the interruption and the auto- mated low flow inflation methods were compared while the patients were ventilated at conventional (10–12 ml/kg) and at low (5–6 ml/kg) tidal volume (Vt). Two levels of in- spiratory flow and insufflation time were used (3 and 6 s). Results: No significant difference in UIP was found between the static and the dy- namic methods, whatever the flow used. At Vt 10–12 ml/kg, the static and dynamic UIPs were 22.4± 4.4 cmH 2 O and 22.1±4.5 cmH 2 O (p=0.86), respectively; at Vt of 5–6 ml/kg, the static and dynamic UIPs were 26.6±4.1 cmH 2 O and 25.5±5 cmH 2 O (p=0.34), respective- ly. Significant differences in UIP were found, in the static and dynam- ic conditions, between the two levels of Vt (p<0.005): it was lower with the higher Vt, suggesting that UIP is dependent on previous tidal alveolar recruitment. Conclusion: Interrup- tion and continuous flow techniques gave similar results, but the previous Vt influences the pressure value of the UIP. Keywords Acute respiratory distress syndrome (ARDS) · Mechanical ventilation · Recruitment Intensive Care Med (2002) 28:842–849 DOI 10.1007/s00134-002-1293-7 ORIGINAL Giuseppe Servillo Edoardo De Robertis Salvatore Maggiore François Lemaire Laurent Brochard Rosalba Tufano The upper inflection point of the pressure-volume curve Influence of methodology and of different modes of ventilation Introduction The pressure-volume (P/V) curve of the respiratory system is used to describe the mechanical characteristics of the lungs in acute respiratory distress syndrome (ARDS) [1, 2, 3, 4] and it has been proposed as a guide with which to modify the ventilatory settings at bedside, with the goal of limiting lung damage related to mechan- ical ventilation [5, 6, 7, 8, 9, 10, 11]. Several parameters can be identified to adjust ventila- tory settings. The shape of the P/V curve is described, in ARDS, as having three main segments. A non-linear lower segment characterized by a low compliance is sep- arated by a lower inflection point (LIP) from a linear in- termediate segment with a higher compliance and termi- nated by an upper non-linear segment over which com- pliance tends to fall with increasing volume [1, 3, 4, 12] These latter two segments are separated by an upper in- flection point (UIP). In classic respiratory physiology, the upper segment reaches total lung capacity and alveo- lar over-distension probably takes place since a slight in- crement in volume is accompanied by a major increase in airway pressure. Few studies have investigated the UIP and a full under- standing of the nature, the significance and the validity of the UIP is still lacking. In patients with ARDS, Roupie et al. [6] showed that, by using “conventional” tidal volume (Vt) around 10 ml/kg of body weight, end-inspiratory pla- teau pressure surpassed the UIP in 85% of patients, sug- gesting that they were at risk of over-distension and baro- G. Servillo ( ✉ ) · E. De Robertis · R. Tufano Dipartimento Universitario di Scienze Chirurgiche, Anestesiologiche, Rianimatorie e dell’Emergenza, Università degli Studi di Napoli “Federico II”, Via Pansini n.5, 80131 Napoli, Italy e-mail: [email protected] Tel.: +39-081-7463542 Fax: +39-081-5456338 S. Maggiore · F. Lemaire · L. Brochard Medical Intensive Care Unit, INSERM U492, Hôpital Henri Mondor, AP-HP Paris XII University, Créteil, France
Transcript of The upper inflection point of the pressure-volume curve

Received: 26 June 2001Accepted: 12 March 2002Published online: 31 May 2002© Springer-Verlag 2002
Abstract Objective: The pressure-volume (P/V) curve has been pro-posed as a tool to adjust the ventila-tory settings in cases of acute respi-ratory distress syndrome (ARDS).The aim of this study was to test the influence of P/V tracing metho-dology on the presence and value ofthe upper inflection point (UIP).Methods: In 13 medical ARDS pa-tients, the interruption and the auto-mated low flow inflation methodswere compared while the patientswere ventilated at conventional(10–12 ml/kg) and at low (5–6 ml/kg)tidal volume (Vt). Two levels of in-spiratory flow and insufflation timewere used (3 and 6 s). Results: Nosignificant difference in UIP wasfound between the static and the dy-namic methods, whatever the flowused. At Vt 10–12 ml/kg, the static
and dynamic UIPs were 22.4±4.4 cmH2O and 22.1±4.5 cmH2O(p=0.86), respectively; at Vt of5–6 ml/kg, the static and dynamicUIPs were 26.6±4.1 cmH2O and25.5±5 cmH2O (p=0.34), respective-ly. Significant differences in UIPwere found, in the static and dynam-ic conditions, between the two levelsof Vt (p<0.005): it was lower withthe higher Vt, suggesting that UIP isdependent on previous tidal alveolarrecruitment. Conclusion: Interrup-tion and continuous flow techniquesgave similar results, but the previousVt influences the pressure value ofthe UIP.
Keywords Acute respiratory distress syndrome (ARDS) · Mechanical ventilation · Recruitment
Intensive Care Med (2002) 28:842–849DOI 10.1007/s00134-002-1293-7 O R I G I N A L
Giuseppe ServilloEdoardo De RobertisSalvatore MaggioreFrançois LemaireLaurent BrochardRosalba Tufano
The upper inflection point of the pressure-volume curveInfluence of methodology and of different modes of ventilation
Introduction
The pressure-volume (P/V) curve of the respiratorysystem is used to describe the mechanical characteristicsof the lungs in acute respiratory distress syndrome(ARDS) [1, 2, 3, 4] and it has been proposed as a guidewith which to modify the ventilatory settings at bedside,with the goal of limiting lung damage related to mechan-ical ventilation [5, 6, 7, 8, 9, 10, 11].
Several parameters can be identified to adjust ventila-tory settings. The shape of the P/V curve is described, inARDS, as having three main segments. A non-linearlower segment characterized by a low compliance is sep-arated by a lower inflection point (LIP) from a linear in-termediate segment with a higher compliance and termi-
nated by an upper non-linear segment over which com-pliance tends to fall with increasing volume [1, 3, 4, 12]These latter two segments are separated by an upper in-flection point (UIP). In classic respiratory physiology,the upper segment reaches total lung capacity and alveo-lar over-distension probably takes place since a slight in-crement in volume is accompanied by a major increasein airway pressure.
Few studies have investigated the UIP and a full under-standing of the nature, the significance and the validity ofthe UIP is still lacking. In patients with ARDS, Roupie etal. [6] showed that, by using “conventional” tidal volume(Vt) around 10 ml/kg of body weight, end-inspiratory pla-teau pressure surpassed the UIP in 85% of patients, sug-gesting that they were at risk of over-distension and baro-
G. Servillo (✉ ) · E. De Robertis · R. TufanoDipartimento Universitario di Scienze Chirurgiche, Anestesiologiche,Rianimatorie e dell’Emergenza, Università degli Studi di Napoli “Federico II”, Via Pansini n.5, 80131 Napoli, Italye-mail: [email protected].: +39-081-7463542Fax: +39-081-5456338
S. Maggiore · F. Lemaire · L. BrochardMedical Intensive Care Unit, INSERM U492, Hôpital Henri Mondor,AP-HP Paris XII University, Créteil, France
843
trauma. Based on these mechanical properties of diseasedlungs, a concept of “protective lung strategy” using theP/V curve to adjust positive end-expiratory pressure(PEEP) has been successfully implemented by Amato etal. [8, 10]. More recently, Ranieri, using a similar ap-proach to adjust both PEEP and Vt, showed that the pro-tective approach produced less inflammatory mediatorsthan a more aggressive ventilator mode [13].
Ranieri et al, in a series of ARDS cases using differ-ent methodology, failed to document UIP in five amongeight patients [14]. He showed later that the presence ofUIP was evidenced only when patients were ventilatedwith low Vt (5–6 ml/kg) and/or with no PEEP. Mergoniet al. [15] reported very low levels of UIP in a series of13 cases of ARDS. Servillo et al. [9] had earlier demon-strated the influence of the methodology used for tracingP/V curves on the compliance of the upper segmentabove UIP. Finally, Hickling [16] and Jonson [17] ques-tioned the significance of the UIP, from the analysis ofmathematical models of P/V curves, and suggested thatUIP corresponded to the end of alveolar recruitment in-stead of over-distension.
The purpose of the present study was to assess the influ-ence of methodology and the previous mode of mechanicalventilation (tidal volume) on the presence and on the levelof the UIP in patients with ARDS. The interruption and aslow continuous inflation technique were compared andthe role of different modes of ventilation was assessed byusing two different Vts to ventilate the patients.
Materials and methods
Patients
The study was performed in the intensive care unit of the Univer-sity of Naples “Federico II” after local ethics committee approval.Informed consent was obtained from patients’ next of kin.
During a 8month period, all medical patients requiring me-chanical ventilation for more than 24 h with an inspiratory fractionof oxygen (FIO2) equal to or greater than 0.5 were considered aspotential candidates. Exclusion criteria were a documented historyof COPD, the presence of a chest tube with persistent leak or con-traindication for sedation and paralysis and any cause of chestwall abnormalities (recent abdominal surgery, ascites, pleural effu-sion, edema of the thorax). Adult medical patients suffering fromARDS (LIS >2.5) were considered eligible [18, 19]. Patients wereintubated with a cuffed endotracheal tube (7.5–8.5 mm inner di-ameter) and ventilated in volume-controlled mode at constant in-spiratory flow with a Servo 900 C Ventilator (Siemens-Elema,Sweden). The basal ventilation was chosen by the attending physi-cians. Tidal volume was 8–10 ml/kg of actual body weight (BW),respiratory rate (RR) 14–18 breaths/min and inspiratory and post-inspiratory pause time 33 and 5% of the respiratory cycle, respec-tively. The PEEP level was chosen to maintain adequate oxygen-ation. Except for changes in Vt, the ventilatory settings were keptconstant throughout the experiment. Patients had been mechani-cally ventilated for a period of 1–3 days prior to the present inves-tigation and had been clinically stable during the preceding 6–8 h.Patients were monitored as clinically required. All patients weresedated and paralyzed by a continuous infusion of propofol(6–10 mg/kg per h) and pancuronium bromide (0.1–0.2 mg/kg)and studied in the supine position. A physician not involved in theexperimental procedure was always present to provide patientcare. The general characteristics of the ARDS patients are report-ed in Table 1.
Equipment
The Servo Ventilator was connected to an IBM-compatible per-sonal computer through a ventilator/computer interface, as previ-ously described [9] (Fig. 1). The computer emitted analog signalswhich, transmitted via the external control socket of the ventilator,allowed the computer to take over control of RR, PEEP andminute ventilation. P/V curves were recorded using the flow andexpiratory pressure transducers of the ventilator. These were dailycalibrated against a water manometer and a 1l syringe. Flow andvolume were calibrated to yield data at body temperature andpressure, saturated with water vapor, i.e. BTPS. The signals ofpressure and flow were fed to the computer and analog-to-digital(A/D) converted at 50 Hz. Flow rate was corrected for gas com-pression in the tubing. Volume was then calculated by integration
Table 1 General characteristics of the patients (SAPS simplified acute physiology score [20], LIS lung injury score [19], PEEP positiveend-expiratory pressure, PaO2/FIO2 ratio between arterial oxygen tension and inspired oxygen tension)
Patients Age Sex Weight LIS SAPS PEEP PaO2/FIO2 Diagnosis OutcomeNo. (year) (kg) (cmH2O) (PEEP)
1 63 F 80 2.75 14 10 164 Pneumonia Alive2 70 M 50 3.25 17 12 130 Lymphoma Dead3 71 F 60 3 11 12 143 Sepsis syndrome Dead4 73 F 85 3 17 10 116 Pneumonia Dead5 45 F 90 2.75 12 10 164 Pneumonia Alive6 73 F 95 3.25 14 10 96 Lymphoma Dead7 25 M 70 2.75 16 14 200 Sepsis syndrome Dead8 38 M 80 3 14 10 146 Pneumonia Alive9 57 M 90 3.25 20 8 180 Myocardial infarction Dead
10 60 F 85 2.75 17 10 175 Sepsis syndrome Dead11 58 M 50 3 20 12 140 Pneumonia Dead12 61 M 80 2.75 14 8 180 Lymphoma Alive13 28 F 65 3 17 10 160 Pneumonia DeadMean 55.5 75 3 15.6 10.4 153.3± SD 16.5 14 0.2 2.7 1.6 28.7

844
of flow. During the procedure the computer continuously recordedpressure and flow and these data were automatically transferred toa spreadsheet (EXCEL 5.0, Microsoft) prepared for automaticanalysis.
Dynamic pressure-volume curves
Dynamic P/V curves (Pdyn/V) were recorded during one single in-sufflation at constant flow. After a normal complete inspiration,the following expiration was prolonged to 6 s to allow for com-plete flow cessation. When patients had previously been ventilatedwith PEEP, the computer forced the ventilator to ZEEP during aprolonged expiration and the study breath inspiration started fromZEEP. The duration of the following inspiratory phase (insuffla-tion) was 6 s or 3 s. The computer controlled the flow rate duringthe insufflation so that the volume reached 25 ml/kg body weightduring these 3 or 6 s. This insufflated volume was chosen to resultin a peak pressure of about 45 cmH2O. The insufflation was auto-matically interrupted at a pressure of 50 cmH2O. During a pro-longed expiration following the insufflation, lung volume was al-lowed to return to the previous level of the end-expiratory pres-sure.
In order to obtain the dynamic elastic recoil pressure in the dis-tal airways and the alveoli, the resistive pressure drop in the tub-ing and the large airways during the insufflation was subtractedfrom the pressure measured. This resistive pressure drop was cal-culated from the tube resistance measured in vitro and the resis-tance of the airways measured from a preceding, unperturbedbreath, according to Varène and Jacquemin [20], as previously de-scribed [9].
In order to make unbiased statistical comparisons betweenconditions and patients, the main part of the Pdyn/V curve was de-fined mathematically. Each curve was analyzed as comprisingthree segments, separated by a lower and an upper inflection point(LIP and UIP, respectively), and the segment between these twopoints was considered as linear and the upper segment as curvi-linear. No mathematical description of the lowest segment wasused and, therefore, the model only described the Pdyn/V curveabove the LIP. The mathematical model is described in the Appen-dix.
Static pressure-volume curves
The static curves (Pst/V) were recorded according to the flow in-terruption principle, which is based on interruption of the inspira-
tory flow at increasingly larger breaths, as described in detailselsewhere [21].The insufflated Vt was automatically increasedstepwise to cover volumes from zero to about 25 ml/kg of bodyweight. The computer forced the ventilator to ZEEP during themeasurement of the “study breaths”. The static pressure was read3 s into a post-inspiratory pause following the insufflation. Thislatency is long enough to allow visco-elastic pressure to decay toan insignificant value, but not so long that continuing absorptionof oxygen leads to a volume change [22]. Pst/V curves were thenconstructed by plotting the volume versus the elastic recoil pres-sure of the respiratory system for each interrupted breath. A singlePst/V curve was obtained from, on average, 20–25 “study breaths”.The mathematical analysis of the Pst/V curve was made using theequation previously described.
Protocol
Routine care, such as suctioning, was performed immediately be-fore the study. The absence of leaks in the circuit was ensured bythe establishment of an airway pressure drop of less than0.1 cmH2O/s towards the end of a 10 s post-inspiratory pause.
Patients were studied after 30 min of mechanical ventilation attwo levels of Vt: with a tidal ventilation of 10–12 ml/kg and thenwith a low Vt of 5–6 ml/kg of actual BW; the low Vt was accom-panied by a reduction in minute ventilation. In these two Vt condi-tions, P/V curves were recorded successively with the static anddynamic methods. For the latter, two flows were used: the firstPdyn/V curve was traced with an insufflation of 6 s and was fol-lowed, in the first seven patients, by a second Pdyn/V curve record-ed with an insufflation of 3 s. The static P/V curve was then re-corded. Thirty minutes elapsed between the reduction of the Vtand the new set of measurements.
Statistical analysis
The results are expressed as means ± SD. The values of Cst/Cdyn,LIPst/LIPdyn, UIPst/UIPdyn determined at Vt 10–12 ml/kg and5–6 ml/kg were compared by a Wilcoxon paired test. A p less than0.05 was considered significant. The relationship between compli-ance, LIP and UIP obtained with static and dynamic methods wasassessed by linear regression analysis. The distribution of errorwas assessed according to the method proposed by Bland and Alt-man [23].
Results
No significant difference in UIP was found between thestatic and the dynamic methods. At Vt 10–12 ml/kg, thestatic and dynamic UIPs were 22.4±4.4 cmH2O and22.1±4.5 cmH2O (p=0.86), respectively; at Vt of 5–6 ml/kgthe static and dynamic UIPs were 26.6±4.1 cmH2O and 25.5±5 cmH2O (p=0.34), respectively. A linear
Fig. 1 The ventilator was computer controlled via an interface toyield appropriate breathing patterns for automated determinationof static and elastic pressure-volume curves. The Servo Ventilator900C is equipped with a socket for electronic signals allowing ex-ternal control of ventilator function. The personal computer wasprovided with analog-to-digital (A/D) and digital-to-analog (D/A)converters and a digital interface to allow control of the ventilatorand recording of airway pressure and airway flow
845
regression of value of UIP at Vt 10–12 ml/kg and at Vt 5–6 ml/kg offered the following relationship:UIPst/UIPdyn : R =0.934.
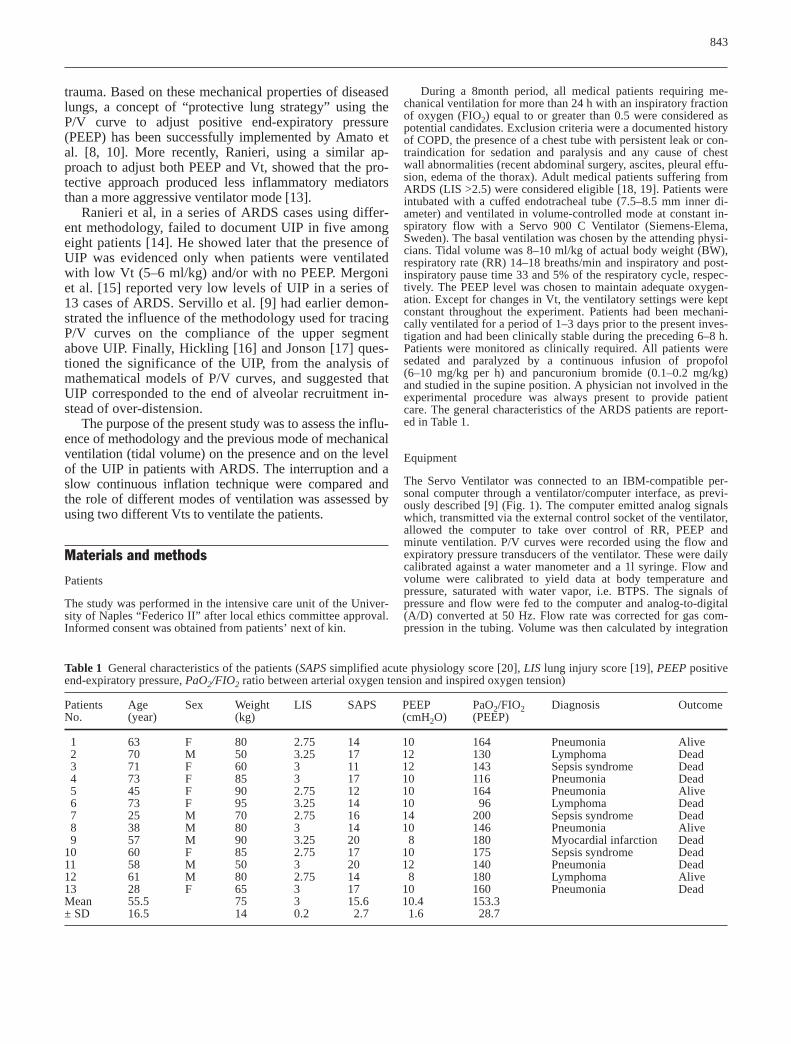
A significant difference in UIP was found, dependingon the Vt. In the static condition, UIP at Vt 10–12 ml/kgand at Vt 5–6 ml/kg were 22.2±4.4 cmH2O and26.6±4.1 cmH2O (p<0.005), respectively. In dynamic re-cordings, UIP at 10–12 ml/kg and at Vt 5–6 ml/kg were22.1±4.5 cmH2O and 25.5±5 cmH2O (p<0.005), respec-tively (Fig. 2).
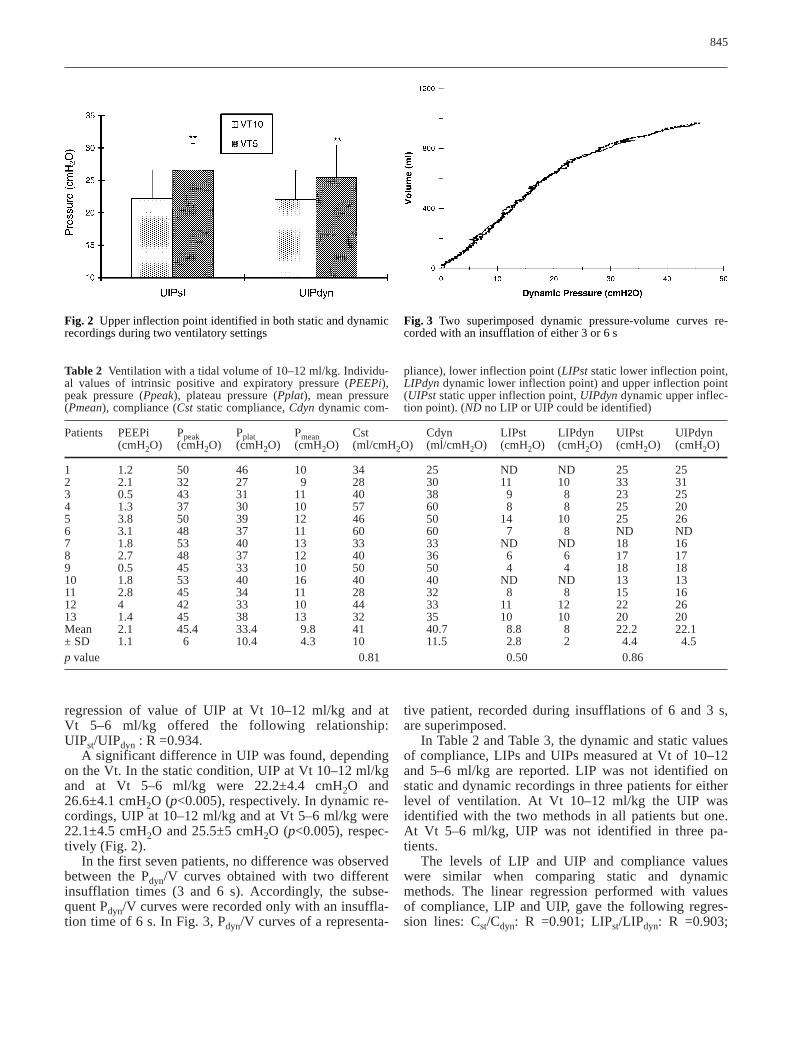
In the first seven patients, no difference was observedbetween the Pdyn/V curves obtained with two differentinsufflation times (3 and 6 s). Accordingly, the subse-quent Pdyn/V curves were recorded only with an insuffla-tion time of 6 s. In Fig. 3, Pdyn/V curves of a representa-
tive patient, recorded during insufflations of 6 and 3 s,are superimposed.
In Table 2 and Table 3, the dynamic and static valuesof compliance, LIPs and UIPs measured at Vt of 10–12and 5–6 ml/kg are reported. LIP was not identified onstatic and dynamic recordings in three patients for eitherlevel of ventilation. At Vt 10–12 ml/kg the UIP wasidentified with the two methods in all patients but one.At Vt 5–6 ml/kg, UIP was not identified in three pa-tients.
The levels of LIP and UIP and compliance valueswere similar when comparing static and dynamic methods. The linear regression performed with values of compliance, LIP and UIP, gave the following regres-sion lines: Cst/Cdyn: R =0.901; LIPst/LIPdyn: R =0.903;
Table 2 Ventilation with a tidal volume of 10–12 ml/kg. Individu-al values of intrinsic positive and expiratory pressure (PEEPi),peak pressure (Ppeak), plateau pressure (Pplat), mean pressure(Pmean), compliance (Cst static compliance, Cdyn dynamic com-
pliance), lower inflection point (LIPst static lower inflection point,LIPdyn dynamic lower inflection point) and upper inflection point(UIPst static upper inflection point, UIPdyn dynamic upper inflec-tion point). (ND no LIP or UIP could be identified)
Patients PEEPi Ppeak Pplat Pmean Cst Cdyn LIPst LIPdyn UIPst UIPdyn(cmH2O) (cmH2O) (cmH2O) (cmH2O) (ml/cmH2O) (ml/cmH2O) (cmH2O) (cmH2O) (cmH2O) (cmH2O)
1 1.2 50 46 10 34 25 ND ND 25 252 2.1 32 27 9 28 30 11 10 33 313 0.5 43 31 11 40 38 9 8 23 254 1.3 37 30 10 57 60 8 8 25 205 3.8 50 39 12 46 50 14 10 25 266 3.1 48 37 11 60 60 7 8 ND ND7 1.8 53 40 13 33 33 ND ND 18 168 2.7 48 37 12 40 36 6 6 17 179 0.5 45 33 10 50 50 4 4 18 1810 1.8 53 40 16 40 40 ND ND 13 1311 2.8 45 34 11 28 32 8 8 15 1612 4 42 33 10 44 33 11 12 22 2613 1.4 45 38 13 32 35 10 10 20 20Mean 2.1 45.4 33.4 9.8 41 40.7 8.8 8 22.2 22.1± SD 1.1 6 10.4 4.3 10 11.5 2.8 2 4.4 4.5p value 0.81 0.50 0.86
Fig. 2 Upper inflection point identified in both static and dynamicrecordings during two ventilatory settings
Fig. 3 Two superimposed dynamic pressure-volume curves re-corded with an insufflation of either 3 or 6 s

846
UIPst/UIPdyn: R =0.934. The bias for compliance(Cst/Cdyn) was 1.23 ml/cmH2O with limits of agreementof ±4.92 ml/cmH2O (+6.14 and –3.69); the bias for LIP(LIPst/LIPdyn) was 0.04 cmH2O with limits of agreementof ±1.78 cmH2O (+1.81 and –1.73). The bias for UIP(UIPst/UIPdyn) was –0.23 cmH2O with limits of agree-ment of ±3.54 cmH2O (+3.32 and –3.78).
Discussion
The main results of this study are as follows. In ARDSpatients, the existence and the level of UIP were inde-pendent of the technique used since interruption and con-tinuous flow techniques with different insufflation timesgave similar results. The pressure level of the UIP, how-ever, was modified by previous different modes of venti-lation: this pressure level was lower when the previousVt was high, and higher with a small Vt.
The dynamic inflation technique is an attractive alter-native to the time-consuming recording and analysis pro-cedure of the multiple occlusions technique. The dynam-ic method, being fast and easy to use and requiring noextra equipment for tracing the curve, is particularly suit-able for intensive care settings. One recording takesabout 30 s and can be fully automated. Subsequent anal-ysis takes only 2 min with the procedure used in thisstudy. Its feasibility and accuracy have already beenstudied [9, 24].
The respiratory system P/V curve assesses mechani-cal characteristics of lungs and chest wall together. Roupie et al. [6] partitioned the chest wall and the lungcomponents by measuring esophageal pressure in sevenARDS patients. In all of them, UIP was found to depend
solely on lung characteristics, with no involvement ofthe chest wall. As shown by recent studies [15, 25, 26],the influence of the chest wall seems minimal in medicalARDS patients in whom the abdominal pressure is notincreased, while it has a great potential influence in sur-gical ARDS patients, especially after trauma or abdomi-nal surgery. Since we have used the P/V curve record-ings as a bedside tool to estimate mechanics and adjustmechanical ventilation, we did not measure esophagealpressure, which is difficult to perform in daily clinicalmonitoring. However, to minimize any possible role ofthe chest wall in this study, we included only medical pa-tients, who were continuously paralyzed. Patients withknown or suspected chest wall abnormalities were ex-cluded from our analysis. However, since our patientswere medical ARDS, our results have to be extrapolatedwith caution to other populations.
By and large, the way the UIP was determined in thisstudy did not influence its value. A good agreement be-tween UIP values obtained with the interruption and thecontinuous flow techniques with a 5–6 ml/kg Vt was ob-served. UIP was not evidenced on P/V curves yielded byboth methods in patients 2, 4, 6 (Table 3). Patient 2 wasthe only one that did not show an UIP with a10–12 ml/kg Vt (Table 2). Increasing the speed of insuf-flation during the continuous flow method (by reducingthe insufflation time from 6 to 3 s) did not modify thelevel of UIP. Indeed, P/V curves were so similar (Fig. 3)that we stopped recording the 3s insufflations after the7th patient.
The only difference we noticed between the interrup-tion and the continuous flow methods was that the P/Vcurve above the UIP was more flat or horizontal, sug-gesting the role of visco-elastic pressure in dynamic con-
Table 3 Ventilation with a tidal volume of 5–6 ml/kg. Individualvalues of intrinsic positive end-expiratory pressure (PEEPi), peakpressure (Ppeak), plateau pressure (Pplat), mean pressure(Pmean), compliance (Cst static compliance, Cdyn dynamic com-
pliance), lower inflection point (LIPst static lower inflection point,LIPdyn dynamic lower inflection point) and upper inflection point(UIPst static upper inflection point, UIPdyn dynamic upper inflec-tion point) (ND no LIP or UIP could be identified)
Patients PEEPi Ppeak Pplat Pmean Cst Cdyn LIPst LIPdyn UIPst UIPdyn (cmH2O) (cmH2O) (cmH2O) (cmH2O) (ml/cmH2O) (ml/cmH2O) (cmH2O) (cmH2O) (cmH2O) (cmH2O)
1 1.2 23 22 6 25 28 ND ND 30 302 1.8 19 17 5 28 25 11 10 ND ND3 0.5 25 19 6 40 30 8 8 31 254 1.1 20 16 5 60 50 8 8 ND ND5 3 30 20 7 47 50 11 10 30 326 3.1 20 19 5 66 60 7 8 ND ND7 1.6 28 25 7 33 33 ND ND 20 208 2.7 30 20 8 36 40 6 6 26 209 0.5 25 20 5 50 50 6 6 21 1910 1.1 33 22 8 40 40 ND ND 15 1511 2.1 33 20 6 30 30 7 9 18 2012 3.5 20 18 5 38 30 8 12 32 3213 1.1 25 20 8 30 35 6 10 25 25Mean 1.8 25.4 19.8 6.2 40.2 39.2 7.8 8.3 26.6 25.5± SD 1 5 2.3 1.2 12.4 11 1.4 1.5 4.1 5p value 0.26 0.17 0.34

847
ditions at high volume [9, 24]. Such data confirm ourprevious comparison of the two methods [9], but empha-size that the UIP is independent of the method used. In aprevious study [9], UIP was more often present with thedynamic method in non-ARDS patients. Recently Jonsonet al. [24] reported a lower value of compliance and LIPmeasured at ZEEP with the dynamic method comparedto the static method. In both studies these differencesfound between the static and dynamic methods had littleclinical significance, however.
The levels of UIPs obtained in this study – 27 cmH2Owith 5–6 ml/kg and 22 with 10–12 ml/kg, using the staticmethod – are in accordance with earlier publications. Ina previous study [10], UIP was identified in nine out often ARDS patients, at a mean value of about 25 cmH2Ounder static and dynamic conditions. Roupie et al. [6]have documented UIP in a group of ARDS patients at amean value of about 26 cmH2O (range 18–40 cmH2O)and Brunet et al. [27] found UIP in a narrower range ofvalues, between 28 and 32 cmH2O.
As shown in Fig. 2, the mean value of UIP was sig-nificantly lower with 10–12 ml Vt than with 6 ml Vt using both methods. An initial hypothesis may be thatmechanical ventilation with higher Vt recruits more ofthe lung predisposed to end-expiratory collapse, displac-ing upwards the total P/V curve, which starts from ahigher elastic recoil position (Fig. 4). This is in accor-dance with several recent reports [7, 24, 28, 29, 30].Moreover, several authors [31, 32] have shown that ven-tilatory setting and, in particular, recruitment maneuvercan markedly influence the end-expiratory volume. Thisis one of the reasons why we do not perform a recruit-ment maneuver before our recordings.
The influence of Vt has already been described byCheney [33]; he measured an augmented FRC while in-creasing Vt in dogs injected with oleic acid. PEEP plays thesame role, by increasing end-expiratory lung volume anddisplacing the P/V curve upwards. It may be the reasonwhy Mergoni et al. [15] reported such low values of UIP,since their P/V curves were traced starting from a PEEP of
15 cmH2O. This would explain a change in the volume ofthe UIP, however, but may not explain a decrease in pres-sure with high Vt. Our hypothesis is supported by Richardet al. [34] who recently observed, in 15 ARDS patients, thata small Vt of 6 ml/kg, compared to a Vt of 10 ml/kg, in-duced a de-recruitment that was reversed by increasingPEEP. The other explanation may be that with more lungbeing recruited, the end of recruitment may be reachedsooner. This hypothesis would fit better with the notion thatUIP is essentially a marker of the end of recruitment. More-over, the size of the Vt may impact on surfactant functionand may play a role in these findings. Lastly, it has to bementioned that UIP can be affected by thoracic blood vol-ume and fluid status due to the higher pressure reached.This is a possibility that needs further study.
This study also confirms the results of Roupie [6]about the relationship between end-inspiratory plateaupressure and UIP in ARDS, since with a 10–12 ml/kg Vtthe end-inspiratory plateau pressure was above the UIPin all patients but two while the end-inspiratory plateaupressure was below UIP in all patients but one with a5–6 ml/kg Vt.
It was beyond the scope of this study to assess theclinical relevance of determining UIP, since we com-pared several ways of tracing P/V curves without collect-ing data on oxygenation or outcome. Such studies wouldnecessitate prolonged periods of observation and the in-clusion of many more patients. However, it is worth try-ing to put UIP determination in the perspective of me-chanical ventilation for ARDS. On the one hand, recentstudies have reported successful utilization of Vt limita-tion using an upper limit identified by UIP [8]. On theother, convincing models [16, 17] seem to indicate thatUIP corresponds to the end of recruitment and not neces-sarily to over-distension. However, these two conceptsmay not be as opposed as they seem to be. Recruitmentis certainly not an all or nothing phenomenon, as oncebelieved, since many recent studies have reported thatrecruitment goes on continuously during tidal excursion[24, 35]. The same applies to over-distension, whichstarts relatively low in the vital capacity and increaseswhen airway pressure is augmented, either by PEEP ortidal excursion. In 25 ARDS patients, Dambrosio et al.[36] showed that, when Vt was increased from 6 to 10,end-expiratory pressure surpassed UIP, which corre-sponded to obvious over-distension on CT scanning,while recruitment did not continue to progress. Accord-ingly, determination of UIP could indicate the upper lim-it for end-inspiratory plateau pressure, and help to adjustPEEP and Vt in severe ARDS. This needs to be furtherconfirmed in appropriately designed clinical trials.
Acknowledgements The authors wish to thank SalvatoreBoccieri (Dipartimento Universitario di Scienze Chirurgiche Ane-stesiologiche-Rianimatorie e dell’Emergenza, Università degliStudi di Napoli “Federico II”, Napoli, Italia) for the generous andhelpful technical assistance.
Fig. 4 Differences in upper inflection point in curves at the twodifferent tidal volumes

848
Appendix compliance over the linear segment. Accordingly, the UIP was de-fined as the point where the statistical analysis indicated the startof the deviation of the Pdyn/V curve from a straight line. Addition-al volume increments lead to pressure increments from Pdyn UIP,according to the second term in the lower part of the equation.This implies that compliance falls linearly with additional volumefrom its value of linear compliance (Clin) until it reaches zero atmaximum distension of the lungs at maximum volume (Vmax). Theequation for the segment above UIP satisfies the equation ofSalazar and Knowles [37] and has been applied in recent studies[24, 38, 39]. The pressure at the lower inflection point (PLIP), wasdefined from the point of the Pdyn/V curve at which the measuredpressure deviated from the mathematical model by more than0.5 cmH2O.
The relationship of the linear segment between LIP and UIP is de-scribed by the coefficients Pdyn 0 and Clin. Pdyn 0 is the intercept ofthe extrapolated linear segment with the pressure axis and Clin is
References
1. Falke KJ, Pontoppidan H, Kumar A,Leith DE, Geffin B, Laver HB (1972)Ventilation with positive end-expirato-ry pressure in acute lung disease. J Clin Invest 51:2315–2323
2. Jonson B, Nordström L, Olsson SG,Akerback D (1975) Monitoring of ventilation and lung mechanics duringautomatic ventilation. A new device.Bull Physiopath Respir 11:729–743
3. Suter PM, Fairley HB, Isenberg MD(1975) Optimum end-expiratory airwaypressure in patients with acute pulmo-nary failure. N Engl J Med 292:284–289
4. Matamis D, Lemaire F, Harf A, Brun-Buisson C, Ansquer JC, Atlan G(1984) Total respiratory pressure-volume curves in the adult respiratorydistress syndrome. Chest 86:58–66
5. Ranieri MV, Giuliani R, Fiore T, Dambrosio M, Milic-Emili J (1994)Volume-pressure curve of the respirato-ry system predicts effects of PEEP inARDS: “occlusion” versus “constantflow” technique. Am J Respir Crit CareMed 149:19–27
6. Roupie E, Dambrosio M, Servillo G,Mentec H, El Atrous S, Beydon L,Brun-Buisson C, Lemaire F, Brochard L(1995) Titration of tidal volume and in-duced hypercapnia in acute respiratorydistress syndrome. Am J Respir CritCare Med 152:121–128
7. Ranieri VM, Mascia L, Fiore T, BrunoF, Brienza A, Giuliani R (1995) Car-diorespiratory effects of positive end-expiratory pressure during progressivetidal volume reduction (permissive hy-percapnia) in patients with acute respi-ratory distress syndrome. Anesthesiol-ogy 83:710–720
8. Amato MBP, Barbas CSV, MedeirosDM, Schettino GdPP, Filho GL, Kairalla RA, Deheinzelin D, Morais C,Fernands EdO, Takagaki T, De Carvalho CRR (1995) Beneficial effects of the“open lung approach” with low dis-tending pressures in acute respiratorydistress syndrome: a prospective ran-domized study on mechanical ventila-tion. Am J Respir Crit Care Med152:1835–1846
9. Servillo G, Svantesson C, Beydon L,Roupie E, Brochard L, Lemaire F, Jonson B (1997) Pressure-volumecurves in acute respiratory failure. AmJ Respir Crit Care Med 155:1629–1636
10. Amato MBP, Barbas CSV, Medeiros DM,Magaldi RB, Schettino GdPP, Lorenzi-Filho G, Kairalla RA, Deheinzelin D,Munoz C, Oliveira R, Takagaki TY,Ribeiro Carvalho CR (1998) Effect of aprotective-ventilation strategy on mor-tality in the acute respiratory distresssyndrome. N Engl J Med 338:347–354
11. Martin-Lefevre L, Roupie E, DreyfussD, Saumon G (1998) Can respiratorysystem pressure-volume (PV) curveanalysis predict the occurrence of volo-trauma? Am J Respir Crit Care Med157:A693
12. Gattinoni L, Pesenti A, Avalli L, RossiF, Bombino M (1987) Pressure-volumecurve of total respiratory system inacute respiratory failure: computedtomographic scan study. Am Rev Respir Dis 136:730–736
13. Ranieri VM, Suter PM, Tortorella C,De Tullio R, Dayer JM, Brienza A,Bruno F, Slutsky AS (1999) Effect ofmechanical ventilation on inflammato-ry mediators in patients with acute res-piratory distress syndrome: a random-ized controlled trial. JAMA 282:54–61
14. Ranieri VM, Eissa NT, Corbeil C,Chassé M, Braidy J, Matar N, Milic-Emili J (1991) Effects of positive end-expiratory pressure on alveolar recruit-ment and gas exchange in patients withthe adult respiratory distress syndrome.Am Rev Respir Dis 144:544–551
15. Mergoni M, Martelli A, Volpi A, Primavera S, Zuccoli P, Rossi A (1997)Impact of positive end-expiratory pres-sure on chest wall and lung pressurevolume curve in acute respiratory fail-ure. Am J Respir Crit Care Med156:846–854
16. Hickling KG (1998) The pressure-volume curve is greatly modified byrecruitment: a mathematical model ofARDS lungs. Am J Respir Crit CareMed 158:194–202
17. Jonson B, Svantesson C (1999) Elasticpressure-volume curves: what informa-tion do they convey? Thorax 54:82–87
18. Murray JF, Matthay MA, Luce JM,Flick MR (1988) An expanded defini-tion of the adult respiratory distresssyndrome. Am Rev Respir Dis138:720–723
19. Le Gall JR, Loirat P, Alperovitch A,Glaser P, Granthil C, Mathieu D, Mercier P, Thomas R, Villers D (1984)A simplified acute physiology score forICU patients. Crit Care Med 12:975–977
20. Varène P, Jacquemin C (1970) Airwaysresistance: a new method of computa-tion. In: Bouhuys A (ed) Airway dy-namics: physiology and pharmacology.Thomas, Springfield, Ill. pp 99–108
21. Servillo G, De Robertis E, Coppola M,Blasi F, Rossano F, Tufano R (2000)Application of a computerised methodto measure static pressure volumecurve in acute respiratory distress syn-drome. Intensive Care Med 26:11–14
22. Beydon L, Svantesson C, Brauer K,Lemaire F, Jonson B (1996) Respirato-ry mechanics in patients ventilated forcritical lung disease. Eur Respir J9:262–273
23. Bland MJ, Altman DG (1986) Statisti-cal methods for assessing agreementbetween two methods of clinical mea-surement. Lancet 8:307–310

849
24. Jonson B, Richard J-C, Straus C, Mancebo J, Lemaire F, Brochard L(1999) Pressure-volume curves andcompliance in acute lung injury. Evi-dence of recruitment above the lowerinflection point. Am J Respir Crit CareMed 159:1172–1178
25. Ranieri VM, Brienza N, Santostasi S,Puntillo F, Mascia L, Vitale N, GiulianiR, Memeo V, Bruno F, Fiore T,Brienza A, Slutsky A (1997) Impair-ment of lung and chest wall mechanicsin patients with acute respiratory dis-tress syndrome: role of abdominal dis-tension. Am J Respir Crit Care Med156:1082–1091
26. Gattinoni L, Pelosi P, Suter PM, Pedoto A, Vercesi P, Lissoni A (1998)Acute respiratory distress syndromecaused by pulmonary and extrapulmo-nary disease: different syndromes? Am J Respir Crit Care Med 158:3–11
27. Brunet F, Mira JP, Belghith M, MonchiM, Renaud B, Fierobe L, Hamy I,Dhainaut JF, Dall’Ava-Santucci J(1994) Extracorporeal carbon dioxideremoval technique improves oxygen-ation without causing overinflation.Am J Respir Crit Care Med 149:1557–1562
28. Gattinoni L, D’Andrea L, Pelosi P, Vitale G, Pesenti A, Fumagalli R(1993) Regional effects and mecha-nisms of positive end-expiratory pres-sure in early adult respiratory distresssyndrome. JAMA 269:2122–2135
29. Maggiore SM, Jonson B, Richard JC,Jaber S, Lemaire F, Brochard L (2001)Alveolar derecruitment at decrementalpositive end-expiratory pressure levelsin acute lung injury. Comparison withthe lower inflection point, oxygenationand compliance. Am J Respir Crit CareMed 164:795–801
30. De Robertis E, Servillo G, Tufano R,Jonson B (2001) Aspiration of deadspace allows isocapnic low tidal vol-ume ventilation in acute lung injury.Relationships to gas exchange and me-chanics. Intensive Care Med 27:1496–1503
31. Foti G, Cereda M, Sparacino ME, De Marchi L, Villa F, Pesenti A (2000)Effects of periodic lung recruitmentmaneuvers on gas exchange and respi-ratory mechanics in mechanically ven-tilated acute respiratory distress syn-drome (ARDS) patients. Intensive CareMed 26:501–507
32. Pelosi P, Cadringher P, Bottino N, Panigada M, Carrieri F, Riva E, LissoniA, Gattinoni L (1999) Sigh in acuterespiratory distress syndrome. AmJ Respir Crit Care Med 159:872–880
33. Cheney FW (1972) The effects of tidal-volume change with positive end-expi-ratory pressure in pulmonary edema.Anesthesiology 37:600–604
34. Richard GC, Maggiore SM, Jonson B,Mancebo J, Lemaire F, Brochard L(2001) Influence of tidal volume on al-veolar recruitment. Respective role ofPEEP and a recruitment maneuver. AmJ Respir Crit Care Med 163:1609–1613
35. Pelosi P, Cereda M, Foti G, GiacominiM, Pesenti A (1995) Alterations inlung and chest wall mechanics in pa-tients with acute lung injury: effects ofpositive end-expiratory pressure. AmJ Respir Crit Care Med 152:531–537
36. Dambrosio M, Roupie E, Mollet JJ,Anglade MC, Vasile N, Lemaire F,Brochard L (1997) Effects of PEEPand different tidal volumes on alveolarrecruitment and hyperinflation. Anesthesiology 87:495–503
37. Salazar E, Knowles JH (1964) An anal-ysis of pressure-volume characteristicsof lungs. J Appl Physiol 19:97–104
38. Svantesson C, John J, Taskar V, Evander E, Jonson B (1996) Respirato-ry mechanics in rabbits ventilated withdifferent tidal volumes. Respir Physiol106:307–316
39. Svantesson C, Drefeldt B, Jonson B(1997) The static pressure-volume rela-tionship of the respiratory system de-termined with a computer-controlledventilator. Clin Physiol 17:419–430