The University of Mississippi Geoinformatics Center NASA RPC – March, 2 2009 Evaluation for the...
39
The University of Mississippi Geoinformatics Center NASA RPC – March, 2 2009 Evaluation for the Integration of a Virtual Evapotranspiration Sensor Based on VIIRS and Passive Microwave Sensors into the Annualized Agricultural Non- Point Source (AnnAGNPS) Pollution Model Greg Easson, H. G. Momm The University of Mississippi Ronald Bingner USDA – ARS – National Sedimentation Laboratory
-
Upload
geraldine-conley -
Category
Documents
-
view
214 -
download
0
Transcript of The University of Mississippi Geoinformatics Center NASA RPC – March, 2 2009 Evaluation for the...

The University of Mississippi Geoinformatics CenterNASA RPC – March, 2 2009
Evaluation for the Integration of a Virtual Evapotranspiration Sensor Based on VIIRS and Passive Microwave Sensors into the Annualized
Agricultural Non-Point Source (AnnAGNPS) Pollution Model
Greg Easson, H. G. MommThe University of Mississippi
Ronald BingnerUSDA – ARS – National Sedimentation Laboratory

The University of Mississippi Geoinformatics CenterNASA RPC – March, 2 2009
Project Objectives
• To investigate the feasibility of using existing NASA results as source of ET estimates for AnnAGNPS pollution model
• To evaluate the continuity of the NASA-based remotely sensed ET estimates by the future missions

The University of Mississippi Geoinformatics CenterNASA RPC – March, 2 2009
Project Rationale
• Evapotranspiration (ET) plays an important role for modeling surface-lower atmospheric flux processes
• ET estimates in a continuous and spatially distributed fashion represents a challenge for scientists
• Remote sensing-based techniques are sought as an possible alternative

The University of Mississippi Geoinformatics CenterNASA RPC – March, 2 2009
Background: AnnAGNPS
• The Annualized Agricultural Non-Point Source
• Pollution model is a continuous watershed-scale computer simulation tool used to generate loading estimates for some constituents of agricultural non-point source pollution

The University of Mississippi Geoinformatics CenterNASA RPC – March, 2 2009
Background: AnnAGNPS (continued)
• Developed by USDA-NRCS • Event driven model• Simulates
– Surface flow– Sediment– Nutrients– Pesticides
• Used to evaluate Best Management Practices

The University of Mississippi Geoinformatics CenterNASA RPC – March, 2 2009
Background: AnnAGNPS (continued)
• Watershed is divided into cells
• Each of these cells requires 22 parameters
• Climate data is derived from field weather stations located within or nearby the watershed
• Thiessen polygon method

The University of Mississippi Geoinformatics CenterNASA RPC – March, 2 2009
Background: AnnAGNPS (continued)
• Problem when field weather stations are sparse or even non-existing

The University of Mississippi Geoinformatics CenterNASA RPC – March, 2 2009
Project Objectives
• To investigate the feasibility of using existing NASA results as source of ET estimates for AnnAGNPS pollution model
• To evaluate the continuity of the NASA-based remotely sensed ET estimates by the future missions

The University of Mississippi Geoinformatics CenterNASA RPC – March, 2 2009
Evaluation of the Integration of NASA Results into AnnAGNPS
• Modifications to AnnAGNPS
• Concept of “Virtual” field weather stations

The University of Mississippi Geoinformatics CenterNASA RPC – March, 2 2009
Evaluation of the Integration of NASA Results into AnnAGNPS (continued)
• Modifications to AnnAGNPS
MODIS ET DATA

The University of Mississippi Geoinformatics CenterNASA RPC – March, 2 2009
Evaluation of the Integration of NASA Results into AnnAGNPS (continued)
• Study SiteLong history of hydrologic work
Extensive infrastructure
USDA-ARS NSL past and ongoing projects

The University of Mississippi Geoinformatics CenterNASA RPC – March, 2 2009
Evaluation of the Integration of NASA Results into AnnAGNPS (continued)
• MOD16 daily images for 2004
• Provided by scientists at The University of Montana (Nishida et al., 2003, Cleugh et al., 2007, and Mu et al., 2007).
• Ground sampling distance (GSD) of approximately 5,000 meters
The University of Mississippi Geoinformatics CenterNASA RPC – March, 2 2009
Evaluation of the Integration of NASA Results into AnnAGNPS (continued)
• Two AnnAGNPS simulations– ET computed using the Penman equation– ET provided proxy-MOD16

The University of Mississippi Geoinformatics CenterNASA RPC – March, 2 2009
Evaluation of the Integration of NASA Results into AnnAGNPS (continued)
• Results:– Average
watershed ET
0 30 60 90
120
150
180
210
240
270
300
330
360
DAY OF YEAR
0
1
2
3
4
5
6
EV
AP
OT
RA
NS
PIR
AT
ION
(m
m)
MODIS ET
AnnAGNPS ET

The University of Mississippi Geoinformatics CenterNASA RPC – March, 2 2009
Evaluation of the Integration of NASA Results into AnnAGNPS (continued)
• Results:– Daily runoff
0 30 60 90
120
150
180
210
240
270
300
330
360
DAY OF YEAR
0
5000000
10000000
15000000
20000000
25000000
30000000
35000000
RU
NO
FF
(M
g)
M O D IS
AnnA G N PS

The University of Mississippi Geoinformatics CenterNASA RPC – March, 2 2009
Evaluation of the Integration of NASA Results into AnnAGNPS (continued)
• Results:– Spatial
distribution of the 2004 annual percent difference between ET from AnnAGNPS and from MODIS

The University of Mississippi Geoinformatics CenterNASA RPC – March, 2 2009
Evaluation of the Integration of NASA Results into AnnAGNPS (continued)
• Results:– Spatial
distribution of the 2004 annual percent difference between runoff from AnnAGNPS and from MODIS

The University of Mississippi Geoinformatics CenterNASA RPC – March, 2 2009
Project Objectives
• To investigate the feasibility of using existing NASA results as source of ET estimates for AnnAGNPS pollution model
• To evaluate the continuity of the NASA-based remotely sensed ET estimates by the future missions

The University of Mississippi Geoinformatics CenterNASA RPC – March, 2 2009
Comparison of Existing and Future NASA Results
• Due to the lack of published methodology describing the generation of ET estimates from VIIRS data, a different approach was considered
• Using the relationship between ET, VI, and LST, daily ET maps were generated from models created using multivariate linear regression techniques

The University of Mississippi Geoinformatics CenterNASA RPC – March, 2 2009
Comparison of Existing and Future NASA Results (continued)
• Lambin and Ehrlich’s feature space
Vegetation Index-1.0 1.0
Surf
ace
Tem
per
atur
eNo Evapotranspiration
Max Evapotranspiration
SoilMoistureAvailability
-0.2
No Evapotranspiration
Max Evapotranspiration
SurfaceResistance
Baresoil
PartialCover
Fullcover
Source: simplified from Lambin and Ehrlich (1996)

The University of Mississippi Geoinformatics CenterNASA RPC – March, 2 2009
Comparison of Existing and Future NASA Results (continued)
• Daily images from April 01, 2004 to July 31, 2004
• Re-sampled to 5,000 GSD
250 meter MODIS NDVI
pixels
400 meter proxy-VIIRS NDVI
pixels
1,000 meter MODIS LST
pixels
750 meter proxy-VIIRS LST pixels

The University of Mississippi Geoinformatics CenterNASA RPC – March, 2 2009
Comparison of Existing and Future NASA Results (continued)
• “Virtual” stations
Field
“Virtual”

The University of Mississippi Geoinformatics CenterNASA RPC – March, 2 2009
Comparison of Existing and Future NASA Results (continued)
• Simplified representation
5
1 2
3 4
DOY 15
1 2
3 4
DOY 25
1 2
3 4
DOY 35
1 2
3 4
DOY 4
Stations
DO
Y
51 2 3 4
51 2 3 4
51 2 3 4
51 2 3 4

The University of Mississippi Geoinformatics CenterNASA RPC – March, 2 2009
Comparison of Existing and Future NASA Results (continued)
• Simplified representation
92
112
132
152
172
192
212
0 10 20 30 40 50 60 70 80 90 100 110 120 130
Station NumberD
ay o
f Yea
rMODIS
ND
VI
92
112
132
152
172
192
212
0 10 20 30 40 50 60 70 80 90 100 110 120 130
Station Number
Day
of Y
ear
VIIRS
92
112
132
152
172
192
212
0 10 20 30 40 50 60 70 80 90 100 110 120 130
Station Number
Day
of Y
ear
LST
(K
elvi
n)
92
112
132
152
172
192
212
0 10 20 30 40 50 60 70 80 90 100 110 120 130
Station Number
Day
of Y
ear

The University of Mississippi Geoinformatics CenterNASA RPC – March, 2 2009
Comparison of Existing and Future NASA Results (continued)
• Model development– Stations 127 to 136 (physical stations)– Stepwise backward elimination (P-value
associated with Pearson’s Chi-Squared). – One model per day for each of the
sensors considered
542
32
210 LSTNDVILSTNDVILSTNDVIPET
The University of Mississippi Geoinformatics CenterNASA RPC – March, 2 2009
Comparison of Existing and Future NASA Results (continued)
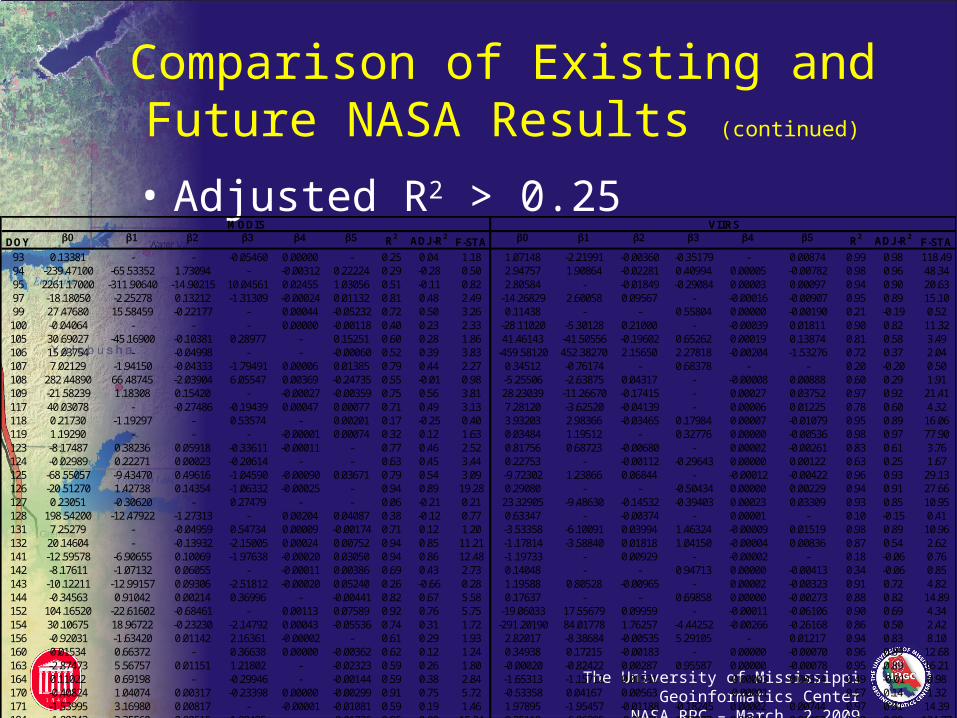
• Adjusted R2 > 0.25 DOY 0 1 2 3 4 5 R2 ADJ-R2
F-STA 0 1 2 3 4 5 R2 ADJ-R2F-STA
93 0.13381 - - -0.05460 0.00000 - 0.25 0.04 1.18 1.07148 -2.21991 -0.00360 -0.35179 - 0.00874 0.99 0.98 118.4994 -239.47100 -65.53352 1.73094 - -0.00312 0.22224 0.29 -0.28 0.50 2.94757 1.90864 -0.02281 0.40994 0.00005 -0.00782 0.98 0.96 48.3495 2261.17000 -311.90640 -14.90215 10.04561 0.02455 1.03056 0.51 -0.11 0.82 2.80584 - -0.01849 -0.29084 0.00003 0.00097 0.94 0.90 20.6397 -18.18050 -2.25278 0.13212 -1.31309 -0.00024 0.01132 0.81 0.48 2.49 -14.26829 2.60058 0.09567 - -0.00016 -0.00907 0.95 0.89 15.1099 27.47680 15.58459 -0.22177 - 0.00044 -0.05232 0.72 0.50 3.26 0.11438 - - 0.55804 0.00000 -0.00190 0.21 -0.19 0.52
100 -0.04064 - - - 0.00000 -0.00118 0.40 0.23 2.33 -28.11020 -5.30128 0.21000 - -0.00039 0.01811 0.90 0.82 11.32105 30.69027 -45.16900 -0.10381 0.28977 - 0.15251 0.60 0.28 1.86 41.46143 -41.50556 -0.19602 0.65262 0.00019 0.13874 0.81 0.58 3.49106 15.03754 - -0.04998 - - -0.00060 0.52 0.39 3.83 -459.58120 452.38270 2.15650 2.27818 -0.00204 -1.53276 0.72 0.37 2.04107 7.02129 -1.94150 -0.04333 -1.79491 0.00006 0.01385 0.79 0.44 2.27 0.34512 -0.76174 - 0.68378 - - 0.20 -0.20 0.50108 282.44890 66.48745 -2.03904 6.05547 0.00369 -0.24735 0.55 -0.01 0.98 -5.25506 -2.63875 0.04317 - -0.00008 0.00888 0.60 0.29 1.91109 -21.58239 1.18308 0.15420 - -0.00027 -0.00359 0.75 0.56 3.81 28.23039 -11.26670 -0.17415 - 0.00027 0.03752 0.97 0.92 21.41117 40.03078 - -0.27486 -0.19439 0.00047 0.00077 0.71 0.49 3.13 7.28120 -3.62520 -0.04139 - 0.00006 0.01225 0.78 0.60 4.32118 0.21730 -1.19297 - 0.53574 - 0.00201 0.17 -0.25 0.40 3.93203 2.98366 -0.03465 0.17984 0.00007 -0.01079 0.95 0.89 16.06119 1.19290 - - - -0.00001 0.00074 0.32 0.12 1.63 0.03484 1.19512 - 0.32776 0.00000 -0.00536 0.98 0.97 77.90123 -8.17487 0.38236 0.05918 -0.33611 -0.00011 - 0.77 0.46 2.52 0.81756 0.68723 -0.00680 - 0.00002 -0.00261 0.83 0.61 3.76124 -0.02989 0.22271 0.00023 -0.20614 - - 0.63 0.45 3.44 0.22753 - -0.00112 -0.29643 0.00000 0.00122 0.63 0.25 1.67125 -68.55057 -9.43470 0.49616 -1.04590 -0.00090 0.03671 0.79 0.54 3.09 -9.72302 1.23866 0.06844 - -0.00012 -0.00422 0.96 0.93 29.13126 -20.51270 1.42738 0.14354 -1.06332 -0.00025 - 0.94 0.89 19.28 0.29080 - - -0.50434 0.00000 0.00229 0.94 0.91 27.66127 0.23051 -0.30620 - 0.27479 - - 0.06 -0.21 0.21 23.32905 -9.48630 -0.14532 -0.39403 0.00023 0.03309 0.93 0.85 10.95128 198.54200 -12.47922 -1.27313 - 0.00204 0.04087 0.38 -0.12 0.77 0.63347 - -0.00374 - 0.00001 - 0.10 -0.15 0.41131 7.25279 - -0.04959 0.54734 0.00009 -0.00174 0.71 0.12 1.20 -3.53358 -6.10091 0.03994 1.46324 -0.00009 0.01519 0.98 0.89 10.96132 20.14604 - -0.13932 -2.15005 0.00024 0.00752 0.94 0.85 11.21 -1.17814 -3.58840 0.01818 1.04150 -0.00004 0.00836 0.87 0.54 2.62141 -12.59578 -6.90655 0.10069 -1.97638 -0.00020 0.03050 0.94 0.86 12.48 -1.19733 - 0.00929 - -0.00002 - 0.18 -0.06 0.76142 -8.17611 -1.07132 0.06055 - -0.00011 0.00386 0.69 0.43 2.73 0.14048 - - 0.94713 0.00000 -0.00413 0.34 -0.06 0.85143 -10.12211 -12.99157 0.09306 -2.51812 -0.00020 0.05240 0.26 -0.66 0.28 1.19588 0.80528 -0.00965 - 0.00002 -0.00323 0.91 0.72 4.82144 -0.34563 0.91042 0.00214 0.36996 - -0.00441 0.82 0.67 5.58 0.17637 - - 0.69858 0.00000 -0.00273 0.88 0.82 14.89152 104.16520 -22.61602 -0.68461 - 0.00113 0.07589 0.92 0.76 5.75 -19.06033 17.55679 0.09959 - -0.00011 -0.06106 0.90 0.69 4.34154 30.10675 18.96722 -0.23230 -2.14792 0.00043 -0.05536 0.74 0.31 1.72 -291.20190 84.01778 1.76257 -4.44252 -0.00266 -0.26168 0.86 0.50 2.42156 -0.92031 -1.63420 0.01142 2.16361 -0.00002 - 0.61 0.29 1.93 2.82017 -8.38684 -0.00535 5.29105 - 0.01217 0.94 0.83 8.10160 0.01534 0.66372 - 0.36638 0.00000 -0.00362 0.62 0.12 1.24 0.34938 0.17215 -0.00183 - 0.00000 -0.00070 0.96 0.89 12.68163 -2.87473 5.56757 0.01151 1.21802 - -0.02323 0.59 0.26 1.80 -0.00020 -0.82422 0.00287 0.95587 0.00000 -0.00078 0.95 0.89 16.21164 0.11022 0.69198 - -0.29946 - -0.00144 0.59 0.38 2.84 -1.65313 -1.15712 0.01531 - -0.00003 0.00374 0.49 -0.01 0.98170 -0.40824 1.04074 0.00317 -0.23398 0.00000 -0.00299 0.91 0.75 5.72 -0.53358 0.04167 0.00563 - -0.00001 - 0.57 0.14 1.32171 -1.53995 3.16980 0.00817 - -0.00001 -0.01081 0.59 0.19 1.46 1.97895 -1.95457 -0.01188 -0.18245 0.00002 0.00744 0.97 0.91 14.39184 -1.00342 3.35560 0.00515 1.88495 - -0.01726 0.95 0.89 15.24 9.35118 -6.06995 -0.06120 1.73237 0.00011 0.01452 1.00 0.99 124.77186 0.14622 - - -1.36564 0.00000 0.00383 0.36 0.04 1.11 -0.95869 1.84131 0.00519 -0.58123 -0.00001 -0.00509 0.96 0.89 13.88187 -9.26065 0.10186 0.06233 -0.23920 -0.00010 - 0.66 0.39 2.41 -0.17414 0.82210 0.00066 -0.43834 - -0.00124 0.55 0.19 1.54188 -3.14018 16.77496 - 15.40937 0.00008 -0.10720 0.57 0.23 1.68 -0.81386 5.38148 -0.00229 -6.45199 - 0.00418 1.00 0.99 184.00192 16.24589 38.55536 -0.19375 -8.56135 0.00043 -0.09389 0.59 0.08 1.16 1.29579 -3.99527 - 3.34977 - - 0.52 0.38 3.80193 0.81794 -2.16803 - 0.50127 -0.00001 0.00547 0.63 0.34 2.14 -0.27020 0.66701 0.00151 -0.52171 0.00000 - 0.59 0.26 1.80194 0.02522 - - 9.71569 0.00005 -0.04153 0.31 -0.03 0.92 -3.40011 11.50713 - -17.17810 -0.00005 0.03979 0.96 0.90 17.46196 -3.92925 13.31728 - - 0.00005 -0.04527 0.63 0.40 2.81 -5.24323 110.89420 -0.23284 84.27215 0.00133 -0.77803 0.74 0.08 1.13197 0.74048 -2.06183 - 1.64597 - - 0.38 0.21 2.17 1.43652 -1.00395 -0.00759 - 0.00001 0.00359 0.46 0.04 1.08200 0.17025 0.04323 - - 0.00000 - 0.08 -0.23 0.25 0.49038 -1.13324 - - 0.00000 0.00386 0.96 0.91 21.59201 0.11276 -0.20308 0.00023 0.19229 - - 0.73 0.60 5.41 0.90810 -2.16446 - 1.16962 0.00000 0.00205 0.77 0.59 4.22202 15.46965 - -0.10437 - 0.00018 - 0.35 0.17 1.92 -0.81103 0.89861 0.00412 - 0.00000 -0.00292 0.66 0.39 2.41203 6.74516 - -0.04538 - 0.00008 - 0.24 0.02 1.09 4.96079 0.61399 -0.03511 0.25224 0.00006 -0.00314 0.94 0.87 12.71204 8.65474 8.65207 -0.07974 - 0.00017 -0.02934 0.39 -0.10 0.79 -0.26944 1.77669 -0.00183 -0.85492 0.00001 -0.00252 0.82 0.60 3.71206 -6.18092 -10.20331 0.07000 -6.64358 -0.00020 0.06723 0.62 0.15 1.33 0.11327 - - - 0.00000 -0.00017 0.07 -0.30 0.19210 -5.06153 13.93010 - - 0.00006 -0.04661 0.11 -0.34 0.24 18.83512 -41.19674 -0.02939 20.73188 - 0.04186 0.45 0.01 1.02
MODIS VIIRS

The University of Mississippi Geoinformatics CenterNASA RPC – March, 2 2009
Comparison of Existing and Future NASA Results (continued)
• Results– Variability of models performance– Adjusted R2 – Predictors

The University of Mississippi Geoinformatics CenterNASA RPC – March, 2 2009
Comparison of Existing and Future NASA Results (continued)
R2 = 0.0018
0.00
0.05
0.10
0.15
0.20
0.25
0.30
0.00 0.05 0.10 0.15 0.20 0.25 0.30
MODIS Derived PET (inches)
VII
RS
Der
ived
PE
T (i
nche
s)
R2 = 0.9749
0.00
0.05
0.10
0.15
0.20
0.25
0.30
0.00 0.05 0.10 0.15 0.20 0.25 0.30
MODIS Derived PET (inches)
VII
RS
Der
ived
PE
T (i
nche
s)
R2 = 0.4154
0.00
0.05
0.10
0.15
0.20
0.25
0.30
0.00 0.05 0.10 0.15 0.20 0.25 0.30
MODIS Derived PET (inches)
VII
RS
Der
ived
PE
T (i
nche
s)
DOY 105 DOY 154 All DOY considered

The University of Mississippi Geoinformatics CenterNASA RPC – March, 2 2009
Comparison of Existing and Future NASA Results (continued)
• Simplified representation
92
112
132
152
172
192
212
0 10 20 30 40 50 60 70 80 90 100 110 120 130
Station NumberD
ay o
f Yea
rMODIS
ND
VI
92
112
132
152
172
192
212
0 10 20 30 40 50 60 70 80 90 100 110 120 130
Station Number
Day
of Y
ear
VIIRS
92
112
132
152
172
192
212
0 10 20 30 40 50 60 70 80 90 100 110 120 130
Station Number
Day
of Y
ear
LST
(K
elvi
n)
92
112
132
152
172
192
212
0 10 20 30 40 50 60 70 80 90 100 110 120 130
Station Number
Day
of Y
ear

The University of Mississippi Geoinformatics CenterNASA RPC – March, 2 2009
Comparison of Existing and Future NASA Results (continued)

The University of Mississippi Geoinformatics CenterNASA RPC – March, 2 2009
Conclusions
• Linking MODIS ET with AnnAGNPS was successfully performed.
•
• The use of MODIS ET can reduce the need to collect/generate dew point, wind speed, and cloud coverage.

The University of Mississippi Geoinformatics CenterNASA RPC – March, 2 2009
Conclusions (continued)
• Reducing uncertainty in input parameters will reduce the uncertainty in the model results.
• In addition, these values usually have temporal and spatial variability that are not easily taken into consideration when computing ET values.

The University of Mississippi Geoinformatics CenterNASA RPC – March, 2 2009
Conclusions (continued)
• MODIS-ET produced 35% less ET then AnnAGNPS-ET and resulted in a 10% increase in runoff.
• Large watershed system, climate parameters can be highly variable.

The University of Mississippi Geoinformatics CenterNASA RPC – March, 2 2009
Conclusions (continued)
• MODIS-ET provided a more comprehensive spatial variability capability than is not often available from measured climate stations.
• Additional remotely sensed data: precipitation and temperature.

The University of Mississippi Geoinformatics CenterNASA RPC – March, 2 2009
Conclusions (continued)
• The second objective of this research project was to investigate the continuity of future NASA missions in providing ET estimates to AnnAGNPS simulation model.
• Daily NDVI and LST maps from MODIS and proxy-VIIRS data were used to create two sets of daily ET maps.
The University of Mississippi Geoinformatics CenterNASA RPC – March, 2 2009
Conclusions (continued)
• Direct comparison between these two sets of daily ET maps indicates that the next generation of moderate resolution sensor will continue to be a potential source of ET estimates to simulation models such as AnnAGNPS.
• The VIIRS’s physical design features, such as improved signal to noise ratio and the attenuation of the “bowtie-shaped” footprint at large scan angles were not considered.

The University of Mississippi Geoinformatics CenterNASA RPC – March, 2 2009
Conclusions (continued)
• The spatial variability demonstrated by the VIIRS-based LST map can be in part attributed to the downscaling technique used in the simulation process.
• Further investigation should be conducted to estimate ET for different land use/land cover classes.

The University of Mississippi Geoinformatics CenterNASA RPC – March, 2 2009
Conclusions (continued)
• There are situations were the ET maps generated from VIIRS and from MODIS agreed.
• This demonstrates the potential of VIIRS to be used as the continuity mission, in providing ET estimates for AnnAGNPS pollution model.

The University of Mississippi Geoinformatics CenterNASA RPC – March, 2 2009
Acknowledgements
• Institute for Technology Development
• National Sedimentation Laboratory
• The University of Montana
• NASA and the University of Southern Mississippi