The United States Patent and Trademark Office July 19, 2005 The National Association of Patent...
36
The United States The United States Patent and Trademark Office Patent and Trademark Office July 19, 2005 July 19, 2005 The National Association of Patent Practitioners 2005 Patent Practice Update
-
date post
19-Dec-2015 -
Category
Documents
-
view
215 -
download
1
Transcript of The United States Patent and Trademark Office July 19, 2005 The National Association of Patent...

The United States The United States Patent and Trademark OfficePatent and Trademark Office
July 19, 2005July 19, 2005
The National Association of Patent Practitioners2005 Patent Practice Update

Contact InformationContact Information
John Doll
Acting Commissioner for Patents &
Deputy Commissioner for Patents Resources and Planning
e-mail: [email protected]
Phone: 571 272 8800

. . . and Examiner Production
Application Filings

FY 04 UPRFY 04 UPR1 Applications Filed Applications Filed
Technology Center FY 04 FY 03 to FY04 Growth Rate
1600 - Biotechnology and Organic Chemistry 38,164 -1.2%
1700 - Chemical and Materials Engineering 49,334 -0.5%
2100 - Computer Architecture Software and Information Security 34,653 17.9%
2600 - Communications 48,210 16.1%
2800 - Semiconductor, Electrical, Optical Systems 81,144 7.6%
3600 - Transportation, Construction, Electronic Commerce 47,489 4.8%
3700 - Mechanical Engineering, Manufacturing and Products 56,533 5.5%
UPR Total 355,527 6.6%
1 “UPR” = Utility, Plant, and Reissue Applications

UPR Applications FiledUPR Applications Filed
0
50000
100000
150000
200000
250000
300000
350000
400000
1995
1996
1997
1998
1999
2000
2001
2002
2003
2004
2005
FY 05 plan 375,080
(~6% above FY 04)
255,411 as of 6/3/2005
Current projection1.9% over plan

FY 04FY 05 3rd
QTRFY 05 Target
UPR1 FAOM2 288,315 210,674 297,614
UPR Disposals3 287,188 205,973 295,456
UPR Production Units4 287,752 208,324 296,535
PCT Production Units5 16,882 11,372 22,916
ProductionProduction
1 “UPR” = Utility, Plant, and Reissue Applications.2 “FAOM” = First Action on the Merits – first action count by an examiner after the filing of an application (does not
include restrictions or other miscellaneous actions).3 “Disposal” = An examiner allowance, abandonment, or disposals following a board decision.4 “Production Unit” = First action count plus disposal count divided by 2.5 “PCT” = Patent Cooperation Treaty. PCT applications are processed differently and tracked separately from US
National stage applications. For FY 05, 11,372 PU’s is 26,417 processed applications.

PCT Applications FiledPCT Applications Filed
FY 04 3rd QTR 04 3rd QTR 05
International Applications Received*
45,396 33,686 35,400
Demands Filed 19,894 15,135 7,430
371 Applications Filed 37,173 29,162 29,630
*Currently 54% of Chapter 1 filings designate USPTO as Searching Authority, in FY 04 it was 60%
* Demands down due to change to PCT practice permitting applicants to get to 30 months before filing national stage from Chapter 1 instead of having to file Chapter 2.

FY 2004FY 2004 (3rd QTR)
FY 2005 (3rd QTR)
Search Reports 17,935 9,926 12,788
International Preliminary Examination Reports (IPERs)
19,439 13,242 9,956*
PCT ProductionPCT Production
* * Number of IPERS down due to search and written opinion being available in the Number of IPERS down due to search and written opinion being available in the new form 237. new form 237.

. . . vs the Backlog
PENDENCY

FY 05 Patent PendencyFY 05 Patent Pendency (as of 7/1/2005) (as of 7/1/2005)
Technology CenterAverage 1st Action
Pendency (months)1Average Total
Pendency (months)2
1600 - Biotechnology and Organic Chemistry 22.4 31.6
1700 - Chemical and Materials Engineering 19.2 29.1
2100 - Computer Architecture Software and Information Security 32.5 42.1
2600 – Communications 29.8 42.3
2800 - Semiconductor, Electrical, Optical Systems 14.4 24.9
3600 - Transportation, Construction, Electronic Commerce 16.8 26.3
3700 - Mechanical Engineering, Manufacturing and Products 16.6 25.4
UPR Total (as of 7/1/2005) 20.2 28.5
FY 05 Target 20.7* 31.01 “Average 1st action pendency” is the average age from filing to first action for a newly filed application, completed during 1st quarter FY 2005.2 “Average total pendency” is the average age from filing to issue or abandonment of a newly filed application, completed during 1st quarter FY 2005.* Assuming current input and output estimates, the agency should achieve first action pendency of 21.3 months by the end of FY 2005 and total pendency of 30.2 months.

First Action Pendency by Art AreasFirst Action Pendency by Art Areas
High Pendency Art AreasPendency
1
(months)Low Pendency Art Areas
Pendency1
(months)1630 – Molecular Biology, DNA/RNA, Gene Therapy, Nucleic Acid
25.61625 – Heterocyclic Compounds and Uses
15.3
1764 – Distillation, Mineral Oil and Hydrocarbons
29.7 1752 – Radiation Imagery 12.6
2128 – Simulation and Modeling, Emulation of Computer Components
39.42125 – Manufacturing Control Systems and Chemical/ Mechanical/Electrical Control
17.8
2611 – Interactive Video Distribution
43.72636 – General Electrical Communication
17.9
2836 – Control Circuits 26.2 2833 – Electrical Connectors 8.6
3626 – Health Care, Insurance 48.3 3643 – Animal and Plant Husbandry 10.7
3762 – Body Treatment, Kinestherapy, and Exercising
26.9 3742 – Thermal Combustion Technology 11.4
1 “Average 1st action pendency” is the average age from filing to first action for a newly filed application, completed during
3rd quarter FY 2005.

Inventory by Art ExamplesInventory by Art Examples
High Inventory Art AreasMonths of Inventory*
Low Inventory Art AreasMonths of Inventory*
1614, 1615, and 1617 – Drugs, Bio-affecting and Body Treatment
47 – 53 1620 – Organic Chemistry 17
1743 – Chemical Analysis 371734 – Adhesive Bonding and Coating Apparatus
11
2127 – Computer Task Management 622125 – Manufacturing Control Systems and Chemical/ Mechanical/Electrical Control
14
2611 – Interactive Video Distribution 722651, 2653 – Information Storage and Retrieval
17
2836 – Control Circuits 44 2831 – Electrical Conductors 9
3620 – Business Methods 34 – 106 3651 – Conveying 9
3731 and 3737 – Medical Instruments, Diagnostic Equipment
46 – 543742 – Thermal and Combustion Technology
10
*The number of months it would take to reach a first action on the merits (e.g., an action addressing patentability issues) on a new application filed as of Jan 2005 at today’s production rate. Today’s production rate means that there are no changes in production due to hiring, attrition, changes to examination processing or examination efficiencies, and that applications are taken up in the order of filing in the given art unit/area. Of course, USPTO is taking aggressive steps to ensure changes that will significantly lower the inventory rates in high-inventory art areas.

1600 1700 2100 2600 2800 3600 3700 Total* Design
New Applications1 9/30/2004
55,402 63,923 71,778 97,380 77,651 56,738 65,005 508,878 18,451
New Applications1
7/1/200562,104 70,346 75,400 110,663 91,581 67,466 80,028 573,391 22,958
Overall Pending Applications2
9/30/200495,006 105,447 102,440 138,822 137,458 101,097 108,039 809,323 27,599
Overall Pending Applications2
7/1/2005105,066 115,891 115,398 161,479 154,333 113,775 126,124 907,901 35,432
TC Application InventoryTC Application Inventory
1 “New Application inventory” is the number of new applications designated or assigned to a technology center awaiting a first action.
2 “Overall Pending Application inventory” is the total number of applications designated or assigned to a technology center in an active status. Includes new applications; rejected awaiting response; amended; under appeal or interference; suspended; reexams and allowed applications awaiting grant publication.
*Total inventory includes applications not assigned to a particular TC, awaiting processing either pre- or post-examination.

Patent QualityPatent Quality(Shared Responsibility)(Shared Responsibility)

Quality of Products – FY 04Quality of Products – FY 04
Fiscal Year 2004
1600 1700 2100 2600 2800 3600 3700 DesignFY 04 Total
FY 05 Target
Patent In-Process
Examination Compliance
Rate1
76.4% 83.1% 88.3% 74.2% 86.8% 79.6% 81.7% 90.4% 82.0% 84.0%
Patent Allowance Error Rate2
4.40% 8.03% 3.05% 2.53% 3.39% 7.54% 9.01% 3.28% 5.32% 4.0%
1Compliance is the percent of office actions reviewed and found to be free of any in-process examination deficiency (an error that has significant adverse impact on patent prosecution).
2Patent allowance error rate is the percent of allowed applications reviewed having at least one claim which is considered unpatentable on a basis for which a court would hold a patent invalid. “Allowance” occurs before a patent is issued, so these errors are caught before any patent is actually granted.

Quality of Products – FY 05Quality of Products – FY 05
Third Quarter Fiscal Year 2005
1600 1700 2100 2600 2800 3600 3700 Design3rd
QTR FY 05
FY 05 Target
Patent In-Process
Examination Compliance
Rate*
81.4% 83.2% 90.9% 85.5% 91.5% 84.5% 86.7% 94.0% 86.8% 84.0%
Patent Allowance
Error Rate**4.35% 9.45% 4.19% 1.86% 4.55% 6.25% 7.53% 4.17% 5.35% 4.0%
Compliance and error rates as measured by OPQA. Compliance and error rates as measured by OPQA. *Compliance rates estimated by correcting for unresolved errors using reversal rate through 3*Compliance rates estimated by correcting for unresolved errors using reversal rate through 3rdrd quarter of FY 05. TC compliance rates not finalized at this time. quarter of FY 05. TC compliance rates not finalized at this time. **Estimates based on unresolved errors and historical reversal rates.**Estimates based on unresolved errors and historical reversal rates.

UPR Patents IssuedUPR Patents Issued
0
20,000
40,000
60,000
80,000
100,000
120,000
140,000
160,000
180,000
19
95
19
96
19
97
19
98
19
99
20
00
20
01
20
02
20
03
20
04
20
05
FY 2004 170,637
FY 2005 through 6/28/2005 113,688
FY 2005 Plan 176,837

Re-WorkRe-Work

Technology Centers Rework* StatisticsTechnology Centers Rework* Statistics
* Rework first actions are those actions that are in a Continuing, CPA or RCE application.
** As of May 21, 2005
FY 2002 FY 2003 FY 2004 FY 2005**
TC Summary
% FAOM Rework
% FAOM Rework
% FAOM Rework
% FAOM Rework
1600 36.4% 39.7% 40.3% 42.7%1700 25.2% 26.9% 27.1% 27.1%2100 23.9% 24.0% 24.6% 24.9%2600 24.8% 24.1% 24.3% 24.7%2800 19.1% 22.0% 24.9% 24.7%3600 17.7% 21.2% 23.1% 27.9%3700 22.2% 25.1% 24.0% 27.9%
UPR 23.2% 25.3% 26.1% 27.8%

Hiring andHiring and
Retention Retention
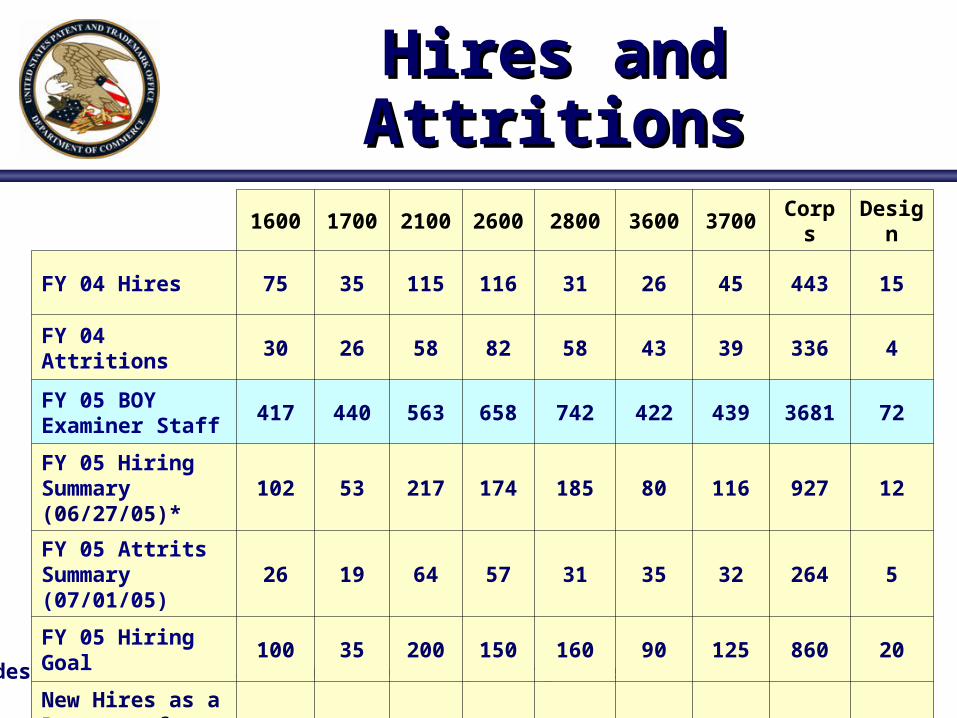
Hires and AttritionsHires and Attritions
*Includes hires on board and confirmed and pending offers
1600 1700 2100 2600 2800 3600 3700 Corps Design
FY 04 Hires 75 35 115 116 31 26 45 443 15
FY 04 Attritions 30 26 58 82 58 43 39 336 4
FY 05 BOY Examiner Staff
417 440 563 658 742 422 439 3681 72
FY 05 Hiring Summary (06/27/05)*
102 53 217 174 185 80 116 927 12
FY 05 Attrits Summary (07/01/05)
26 19 64 57 31 35 32 264 5
FY 05 Hiring Goal 100 35 200 150 160 90 125 860 20
New Hires as a Percent of Examiner Staffing in the TC
24% 8% 36% 23% 22% 21% 29% 23% 28%

Pre-Appeal Pre-Appeal
ConferencesConferences

Pre-Appeal ConferencePre-Appeal Conference
Background 21st Century Strategic Plan – Quality Approximately 60% of all appealed cases are “not”
forwarded to BPAI
Action Plan Review to determine whether Appeal is warranted
July 12, 2005 OG Notice

ReexaminationReexamination
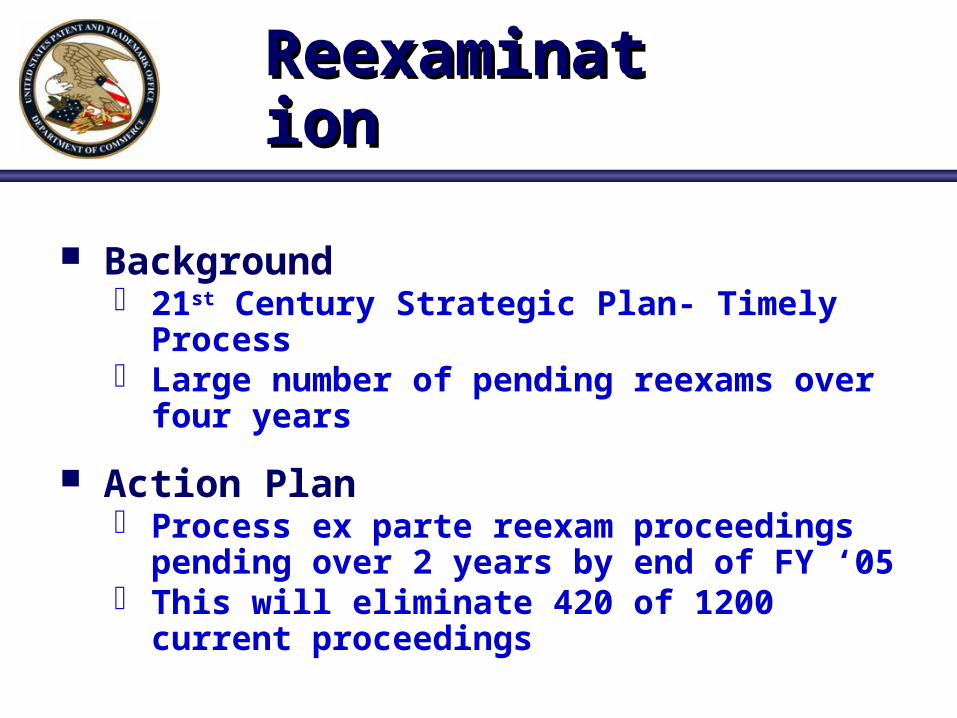
ReexaminationReexamination
Background 21st Century Strategic Plan- Timely Process Large number of pending reexams over four years
Action Plan Process ex parte reexam proceedings pending over
2 years by end of FY ‘05 This will eliminate 420 of 1200 current proceedings

PETITION to MAKE PETITION to MAKE SPECIAL SPECIAL
and Accelerated and Accelerated ExaminationExamination

Applications Eligible for Petition to Applications Eligible for Petition to Make SpecialMake Special
Subject Matter Eligiblefor Expedited Examination
Counter Terrorism HIV / AIDS / Cancer Energy Resources Environmental Quality Recombinant DNA Super-Conductivity Small Entity Biotechnology
Applications Manufacturing
Other Reasons to Expedite Examination
Applicant’s Age Applicant’s Health Infringement - Claimed Subject
Matter Accelerated Examination
Any application With pre-examination search With detailed explanation
distinguishing references deemed must closely related to the claims
Propose 12 months to final disposition in FY 2006

Petition to Make Special Petition to Make Special (All Categories) Statistics(All Categories) Statistics
FY 03 FY 04 FY 05Grand
Total
5 6 100 111
33 175 500 708
538 594 862 1,994
Fiscal Year Petition Filed
Number of Undecided Petitions to Make Special
Number of Granted Petitions to Make Special Awaiting First
Action
Total Number of Initial (Still Undecided) and Decided
Petitions to Make Special

Petition to Make Special Petition to Make Special (All Categories) Petition Disposition(All Categories) Petition Disposition
FY 03 FY 04 FY 05Grand
Total
90 53 58 201
189 180 351 720
1,254 1,391 1,037 3,682
5 6 100 111
1,538 1,630 1,546 4,714
Fiscal Year Petition Filed
Denied
Dismissed
Granted
Pending
Grand Total

Processing Times for Petitions to Make Processing Times for Petitions to Make Special (All Categories)Special (All Categories)
As of July 14, 2005. Includes only those that have had a first action after the petition decision.As of July 14, 2005. Includes only those that have had a first action after the petition decision.
FY 03 FY 04 FY 05
85 108 79
278.0 236.7 102.5
130 116 113
221.9 235.2 112.7
101 104 29
228.6 206.1 137.2
181 133 64
272.7 200.4 146.2
96 89 28
228.4 242.8 136.4
281 309 93
230.3 209.5 109.4
290 267 61
206.3 199.4 140.9
1164 1126 467
233.2 213.6 121.5Average Total
Fiscal Year Petition Filed
1600
1700
2100
2600
2800
3600
3700
Average Days from Petition Filing to First Action
Average Days from Petition Filing to First Action
Average Days from Petition Filing to First Action
Section VIII Petitions Granted
Average Days from Petition Filing to First Action
Section VIII Petitions Granted
Average Days from Petition Filing to First Action
Petitions Granted
Average Days from Petition Filing to First Action
Section VIII Petitions Granted
Section VIII Petitions Granted
Section VIII Petitions Total
Section VIII Petitions Granted
Average Days from Petition Filing to First Action
Section VIII Petitions Granted
TC

Accelerated ExaminationAccelerated Examination
• Current Version under Petition to Make Special Current Version under Petition to Make Special MPEP 708.02 VIII, 37 CFR 1.102MPEP 708.02 VIII, 37 CFR 1.102
• Current provisions:Current provisions:A.A. Petition/FeePetition/FeeB.B. Single invention or election without traverse to grantSingle invention or election without traverse to grantC.C. Pre-exam search listing field of searchPre-exam search listing field of searchD.D. One copy each reference deemed closest art (NPL, One copy each reference deemed closest art (NPL,
foreign)foreign)E.E. Distinguish references from the claims Distinguish references from the claims

Accelerated Examination Accelerated Examination Section VIII Petition StatisticsSection VIII Petition Statistics
FY 03 FY 04 FY 05Grand
Total
3 2 94 99
17 66 249 332
538 594 862 1,994
Fiscal Year Petition Filed
Number of Undecided Petitions for Accelerated Examination
Section VIII
Number of Granted Petitions for Accelerated Examination
Section VIII Awaiting First Action
Total Number of Initial (Still Undecided) and Decided
Acceleration Examination Section VIII Petitions

Accelerated Examination Section VIII Accelerated Examination Section VIII Petition DispositionPetition Disposition
FY 03 FY 04 FY 05Grand
Total
41 29 29 99
87 99 310 496
407 464 429 1,300
3 2 94 99
538 594 862 1,994
Granted
Pending
Grand Total
Fiscal Year Petition Filed
Denied
Dismissed

Processing Times for Accelerated Processing Times for Accelerated Examination Section VIII PetitionsExamination Section VIII Petitions
As of July 14, 2005. Includes only those that have had a first action after the petition decision.As of July 14, 2005. Includes only those that have had a first action after the petition decision.
FY 03 FY 04 FY 05
24 58 44
396.5 247.2 108.0
16 23 18
259.6 224.0 121.3
65 69 23
244.0 205.4 141.1
94 71 35
259.8 186.5 147.7
58 43 15
224.9 238.3 132.1
62 60 18
274.3 203.9 101.7
64 45 10
204.4 205.0 136.6
383 369 163
253.5 213.0 126.0Average Total
Fiscal Year Petition Filed
1600
1700
2100
2600
2800
3600
3700
Average Days from Petition Filing to First Action
Average Days from Petition Filing to First Action
Average Days from Petition Filing to First Action
Section VIII Petitions Granted
Average Days from Petition Filing to First Action
Section VIII Petitions Granted
Average Days from Petition Filing to First Action
Section VIII Petitions Granted
Average Days from Petition Filing to First Action
Section VIII Petitions Granted
Section VIII Petitions Granted
Section VIII Petitions Total
Section VIII Petitions Granted
Average Days from Petition Filing to First Action
Section VIII Petitions Granted
TC

Accelerated ExaminationAccelerated Examination
• Features of the proposed revision:Features of the proposed revision:
Move to the head of the lineMove to the head of the line Final Disposition within 12 monthsFinal Disposition within 12 months e-file application and all follow on paperse-file application and all follow on papers Single InventionSingle Invention Limited Number of ClaimsLimited Number of Claims Patentability ReportPatentability Report Possible Interview before 1Possible Interview before 1stst Action Action Shortened Statutory PeriodShortened Statutory Period Enforcement of special status in the Corps Enforcement of special status in the Corps
Thank You !!!Thank You !!!
John Doll
Acting Commissioner for Patents
e-mail: [email protected]
Office Phone: 571 272 8800
Direct Line: 571 272 8250