
The Unilateral Isometric Squat: Test Reliability, Inter ...
21
The Unilateral Isometric Squat 1 The Unilateral Isometric Squat: Test Reliability, Inter-limb Asymmetries, and Relationships with Limb Dominance ABSTRACT The aim of the present study was to determine test reliability, establish inter-limb asymmetries and their associations with force production capability on the dominant (D) and non-dominant (ND) limbs during the unilateral isometric squat test. Twenty-eight recreational sport athletes attended a single test session after familiarization and performed three trials on each limb with 140° of hip and knee flexion, to assess peak force (PF), rate of force development (RFD) and impulse at different time intervals. Reliability, inter-limb asymmetries and Pearson’s r correlations were computed thereafter. Test reliability was metric-dependent with only PF showing good levels of reliability on both limbs (CV = 5.44-5.70; ICC = 0.93-0.94). Inter-limb asymmetries ranged from 8.36-25.46%, with a tendency for RFD and impulse asymmetries to reduce as time intervals increased. Three significant negative relationships out of a possible 49 (r = -0.43 to -0.47; p < 0.05) were found between asymmetries and performance on the D limb. However, 31 significant negative correlations (r = -0.42 to -0.71; p < 0.05) were found between asymmetries and performance on the ND limb. These findings demonstrate that practitioners may only be able to use PF as a reliable test metric during a unilateral isometric strength test. Furthermore, the negative association between asymmetries and strength performance on the ND limb may indicate that the reduction of imbalances through targeted training interventions may be warranted. Key Words: Strength assessment; side-to-side differences; peak force
Transcript of The Unilateral Isometric Squat: Test Reliability, Inter ...
The Unilateral Isometric Squat
1
The Unilateral Isometric Squat: Test Reliability, Inter-limb
Asymmetries, and Relationships with Limb Dominance
ABSTRACT
The aim of the present study was to determine test reliability, establish inter-limb asymmetries
and their associations with force production capability on the dominant (D) and non-dominant
(ND) limbs during the unilateral isometric squat test. Twenty-eight recreational sport athletes
attended a single test session after familiarization and performed three trials on each limb with
140° of hip and knee flexion, to assess peak force (PF), rate of force development (RFD) and
impulse at different time intervals. Reliability, inter-limb asymmetries and Pearson’s r
correlations were computed thereafter. Test reliability was metric-dependent with only PF
showing good levels of reliability on both limbs (CV = 5.44-5.70; ICC = 0.93-0.94). Inter-limb
asymmetries ranged from 8.36-25.46%, with a tendency for RFD and impulse asymmetries to
reduce as time intervals increased. Three significant negative relationships out of a possible 49
(r = -0.43 to -0.47; p < 0.05) were found between asymmetries and performance on the D limb.
However, 31 significant negative correlations (r = -0.42 to -0.71; p < 0.05) were found between
asymmetries and performance on the ND limb. These findings demonstrate that practitioners
may only be able to use PF as a reliable test metric during a unilateral isometric strength test.
Furthermore, the negative association between asymmetries and strength performance on the
ND limb may indicate that the reduction of imbalances through targeted training interventions
may be warranted.
Key Words: Strength assessment; side-to-side differences; peak force
The Unilateral Isometric Squat
2
INTRODUCTION
Numerous methods exist when assessing an athlete’s strength capabilities such as isokinetic
dynamometry to measure torque (12,33), one-repetition maximum (1RM) testing during the
back squat exercise (16,34), and isometric tests assessing maximal force production via the
isometric mid-thigh pull (IMTP) or squat (9,14,18). Isokinetic dynamometry may offer useful
insight into inter- and intra-limb differences for the quadriceps and hamstring muscles at
different contraction velocities. However, such methods are typically confined to a laboratory
setting; thus, may not always be viable for practitioners in a team-sport environment (7). The
back squat is a commonly programmed exercise during strength programs and often suggested
as a means of assessing lower body strength (16,21,34). While the importance of this exercise
is not being disputed, it has been suggested that high levels of mobility are required for optimal
technique, which becomes especially important if using maximal loads (7). In addition,
assuming that optimal technique can be adhered to for this exercise, 1RM protocols (which are
often suggested) can be time-consuming, potentially reducing their usability with large groups
of athletes (26). With recent literature highlighting strength as a critical physical quality to
develop for both performance (36,37) and injury risk reduction (24), alternative methods of
strength assessment may need to be considered.
The IMTP or isometric squat offer practitioners with a useful indication of an athletes’ force
production capabilities and has been suggested to be more time-efficient than isokinetic
dynamometry and 1RM back squat testing (7). Further to this, isometric strength testing permits
the generation of force-time curves, which enables practitioners to examine rapid force
production characteristics over specific time intervals (13,18,38). In turn, this may provide
practitioners with some insight into athletes’ force production capacity during athletic tasks
underpinned by strength such as sprinting, jumping and changing direction (39). Previous
investigations have compared these two tests and reported acceptable reliability for peak force
The Unilateral Isometric Squat
3
([PF]: ICC ≥ 0.86, CV ≤ 9.4%) (9). Results of this study highlighted significantly greater peak
force values for the isometric squat; thus, it was suggested that if practitioners wish to establish
athletes’ true lower body maximal force production capabilities, the isometric squat might be
the preferred choice. However, this was conducted during bilateral testing and the literature
pertaining to a unilateral version of this test is limited (18,19).
Spiteri et al. (35) investigated the effect of strength (using the unilateral isometric squat test)
on foot kinetics and kinematics during a change of direction speed (CODS) task. Results
showed that greater lower body force production capabilities were associated with greater
magnitude plant foot kinetics, and thus, faster CODS performance. In addition, although not
the primary focus of their study, both limbs reported strong reliability for PF (ICC = 0.97; CV
= 5.5-7.0%). However, this was the only metric to report reliability statistics. Hart et al. (18)
assessed the reliability of PF and rate of force development (RFD) during the unilateral
isometric squat on dominant (D) and non-dominant (ND) limbs and reported acceptable
reliability (ICC ≥ 0.83) for both measures with the exception of RFD on the ND limb (ICC =
0.36). This test was also used to establish inter-limb strength asymmetries in 31 Australian
rules football athletes (19), where players were required to kick a ball to a target 20 m away.
For the purpose of data analysis, the sample was divided into accurate (n = 15) and inaccurate
(n = 16) kickers, and showed that the accurate group were almost perfectly symmetrical (1%
asymmetry). In contrast, the inaccurate group showed an 8% asymmetry with the non-kicking
limb (required to stabilise during the action of kicking) demonstrating weaker PF values. With
limited literature on the unilateral isometric squat to date, further research is warranted to
establish its ability to detect inter-limb asymmetries and its associations with strength capacity
(i.e., do larger asymmetry scores relate to reduced force production on a given limb), given
previous literature has highlighted that strength imbalances may be detrimental to physical and
sporting performance (5).
The Unilateral Isometric Squat
4
Therefore, the aims of the present study were threefold: 1) establish the reliability of the
unilateral isometric squat for multiple metrics when tested on a force platform, 2) quantify
inter-limb asymmetries for these associated metrics and, 3) establish the relationship between
inter-limb asymmetries and force-time characteristics for each limb. It was hypothesized that
significant negative relationships would exist between asymmetries and isometric squat
performance.
METHODS
Experimental Approach to the Problem
A familiarization session provided subjects with the opportunity to practice test procedures as
many times as required after all relevant test instructions had been given; thus, reducing any
potential learning effects from the exercise. One week later, subjects attended a single test
session and performed three trials of the unilateral isometric squat on each limb. This test was
chosen for two reasons: 1) recent research has shown that the isometric squat may be better at
depicting isometric force production than the isometric IMTP, albeit bilaterally (9) and, 2)
recent research has investigated the unilateral IMTP (14,38); thus, it was decided that
comparable research was needed on the isometric squat test. Procedures were conducted on a
single force platform (PASPORT force plate, PASCO Scientific, California, USA) sampling at
1000 Hz. A standardised dynamic warm up consisting of dynamic stretches to the lower body
(multi-planar lunges, inchworms, ‘world’s greatest stretch’) was conducted before data
collection, followed by three practice trials on each limb at approximately 60, 80, and 100%
perceived effort for the isometric squat test. Three minutes of rest was provided after the final
warm up trial and the first data collection trial.
The Unilateral Isometric Squat
5
Subjects
Twenty-eight male recreational sport athletes with a background in soccer and rugby (age =
27.29 ± 4.6 years; mass = 80.72 ± 9.26 kg; height = 1.81 ± 0.06 m) volunteered to take part in
this study. A minimum of 27 participants was determined from a priori power analysis using
G*Power (Version 3.1, University of Dusseldorf, Germany) implementing statistical power of
0.8 and a type 1 alpha level of 0.05 which has been used in comparable literature (13). Inclusion
criteria required all subjects to have a minimum of one year’s resistance training experience,
with any subject excluded from the study if they had any lower body injury at the time of
testing. Subjects were required to complete informed consent forms to demonstrate that they
were willing and able to undertake all testing protocols. Ethical approval was granted from the
London Sport Institute research and ethics committee at Middlesex University.
Procedures
Unilateral Isometric Squat Test.
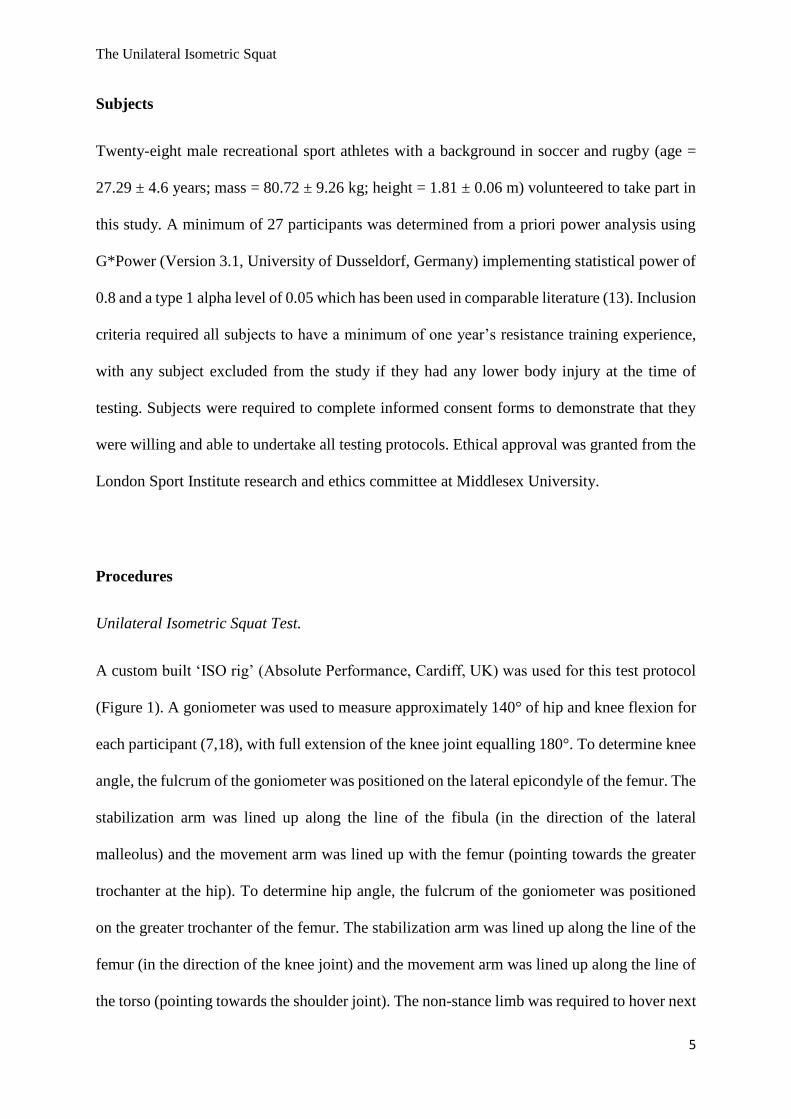
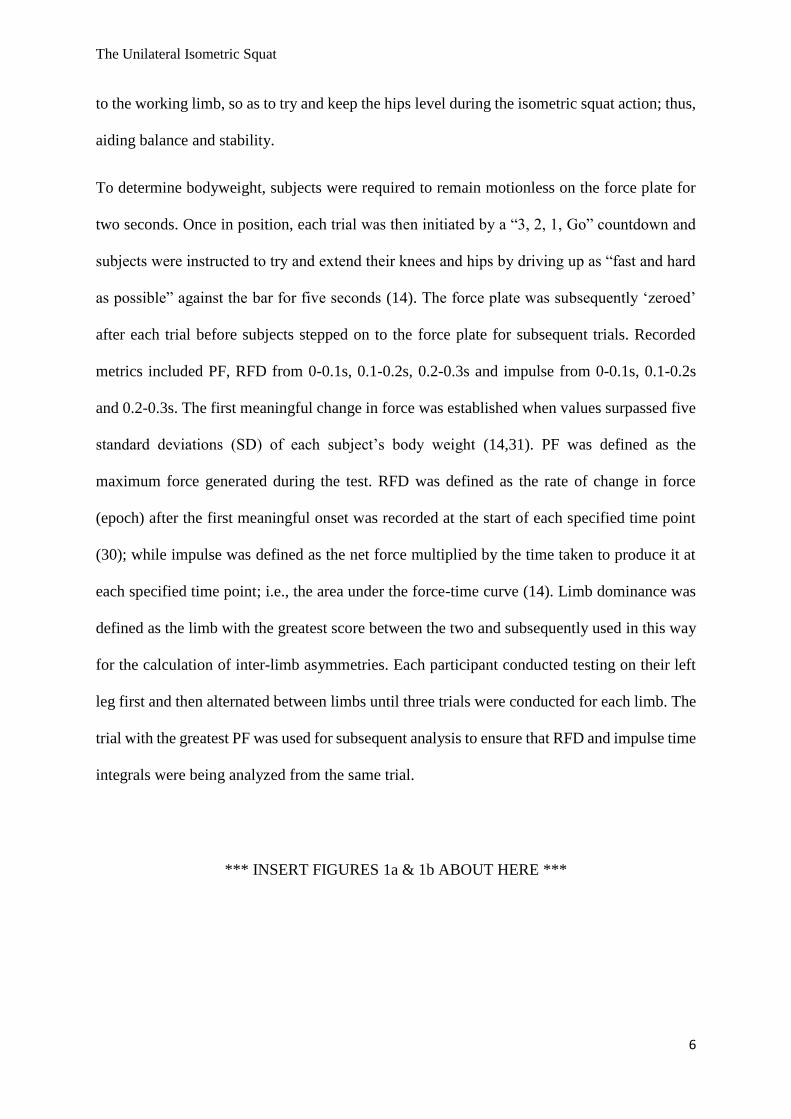
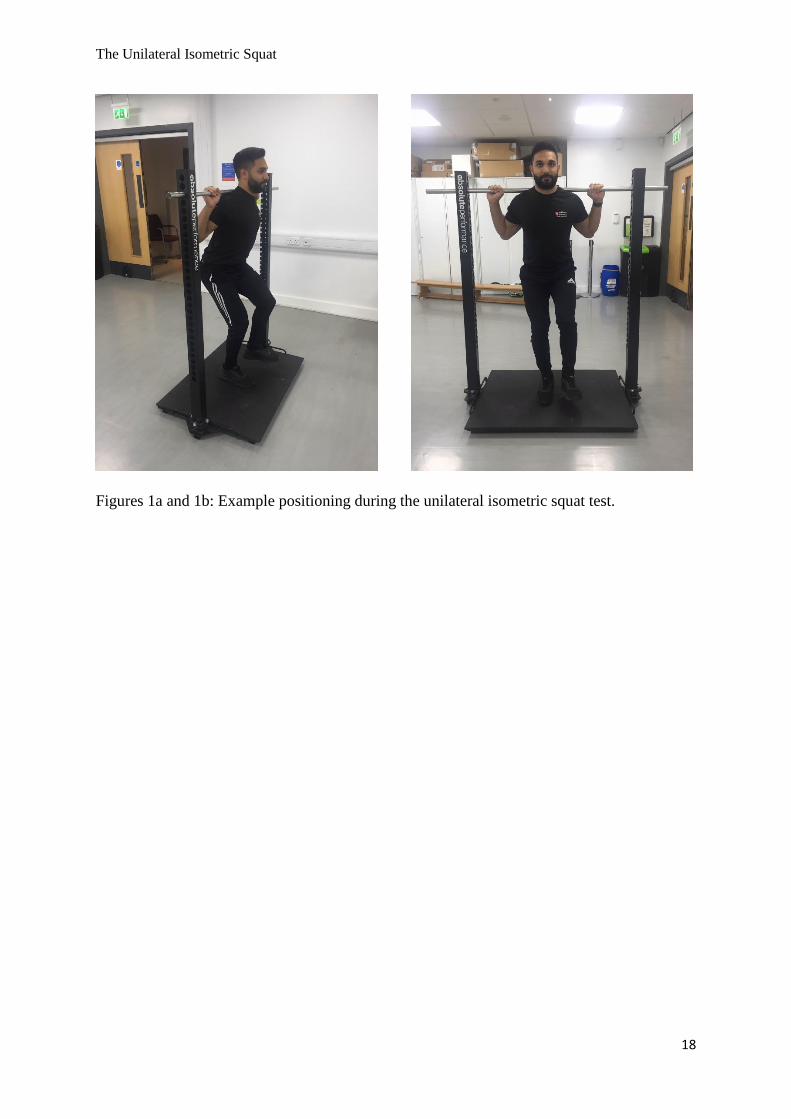
A custom built ‘ISO rig’ (Absolute Performance, Cardiff, UK) was used for this test protocol
(Figure 1). A goniometer was used to measure approximately 140° of hip and knee flexion for
each participant (7,18), with full extension of the knee joint equalling 180°. To determine knee
angle, the fulcrum of the goniometer was positioned on the lateral epicondyle of the femur. The
stabilization arm was lined up along the line of the fibula (in the direction of the lateral
malleolus) and the movement arm was lined up with the femur (pointing towards the greater
trochanter at the hip). To determine hip angle, the fulcrum of the goniometer was positioned
on the greater trochanter of the femur. The stabilization arm was lined up along the line of the
femur (in the direction of the knee joint) and the movement arm was lined up along the line of
the torso (pointing towards the shoulder joint). The non-stance limb was required to hover next
The Unilateral Isometric Squat
6
to the working limb, so as to try and keep the hips level during the isometric squat action; thus,
aiding balance and stability.
To determine bodyweight, subjects were required to remain motionless on the force plate for
two seconds. Once in position, each trial was then initiated by a “3, 2, 1, Go” countdown and
subjects were instructed to try and extend their knees and hips by driving up as “fast and hard
as possible” against the bar for five seconds (14). The force plate was subsequently ‘zeroed’
after each trial before subjects stepped on to the force plate for subsequent trials. Recorded
metrics included PF, RFD from 0-0.1s, 0.1-0.2s, 0.2-0.3s and impulse from 0-0.1s, 0.1-0.2s
and 0.2-0.3s. The first meaningful change in force was established when values surpassed five
standard deviations (SD) of each subject’s body weight (14,31). PF was defined as the
maximum force generated during the test. RFD was defined as the rate of change in force
(epoch) after the first meaningful onset was recorded at the start of each specified time point
(30); while impulse was defined as the net force multiplied by the time taken to produce it at
each specified time point; i.e., the area under the force-time curve (14). Limb dominance was
defined as the limb with the greatest score between the two and subsequently used in this way
for the calculation of inter-limb asymmetries. Each participant conducted testing on their left
leg first and then alternated between limbs until three trials were conducted for each limb. The
trial with the greatest PF was used for subsequent analysis to ensure that RFD and impulse time
integrals were being analyzed from the same trial.
*** INSERT FIGURES 1a & 1b ABOUT HERE ***
The Unilateral Isometric Squat
7
Statistical Analyses
Initially, all force-time data were saved as text files and analysed unfiltered (13) in a custom-
built spreadsheet in Microsoft Excel™ in line with recent suggestions from Chavda et al. (11).
All data were expressed as means and standard deviations (SD), and later transferred into SPSS
(V.24, Chicago, IL, USA) for additional analyses. Reliability was quantified for each metric
using the coefficient of variation (CV) and intraclass correlation coefficient (ICC). However,
given that it is highly plausible that one of these methods may report strong reliability while
the other shows unacceptable variability, results were interpreted in line with previous
suggestions from Bradshaw et al. (8). When considered together, average reliability was
considered ‘good’ if ICC > 0.67 and CV < 10%, ‘moderate’ if ICC < 0.67 or CV > 10%, or
‘poor’ if ICC < 0.67 and CV > 10% (8). Inter-limb asymmetries were quantified as the
percentage difference between limbs using the formula proposed by Bishop et al. (3,4):
(100/(maximum value)*(minimum value)*-1+100). Given that the desired goal for all metrics
in the present study was to demonstrate the highest value possible, the authors suggest that this
equation (which uses the maximum value as a reference value) is a valid means of quantifying
inter-limb differences for unilateral tests (3). Pearsons r correlations were conducted to
determine the relationships between the asymmetry score and test scores for D and ND limbs
respectively. Statistical significance for these relationships were set at p < 0.05. Finally, the
magnitude of change was quantified between limbs using Cohen’s d effect sizes: (MeanD –
MeanND)/SDPooled. These were interpreted in line with a suggested scale by Hopkins et al. (22)
where < 0.2 = trivial; 0.2-0.6 = small; 0.6-1.2 = moderate; 1.2-2.0 = large; 2.0-4.0 = very large;
and > 4.0 = near perfect.
The Unilateral Isometric Squat
8
RESULTS
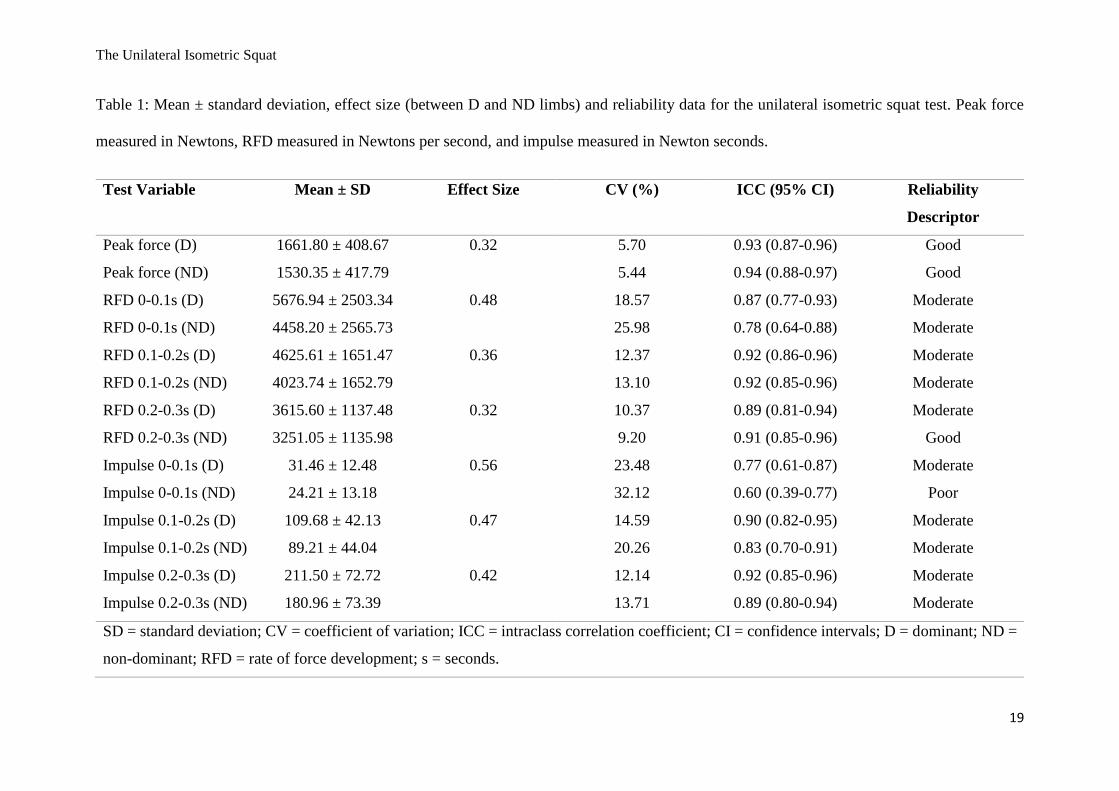
Mean scores, effect sizes and test reliability data are presented in Table 1. The majority of
metrics demonstrated moderate reliability, with the exception of PF on both limbs and RFD on
the ND limb (0.2-0.3s) which showed good reliability, and impulse on the ND limb (0-0.1s)
which showed poor reliability. When determining magnitude of change between limbs, effect
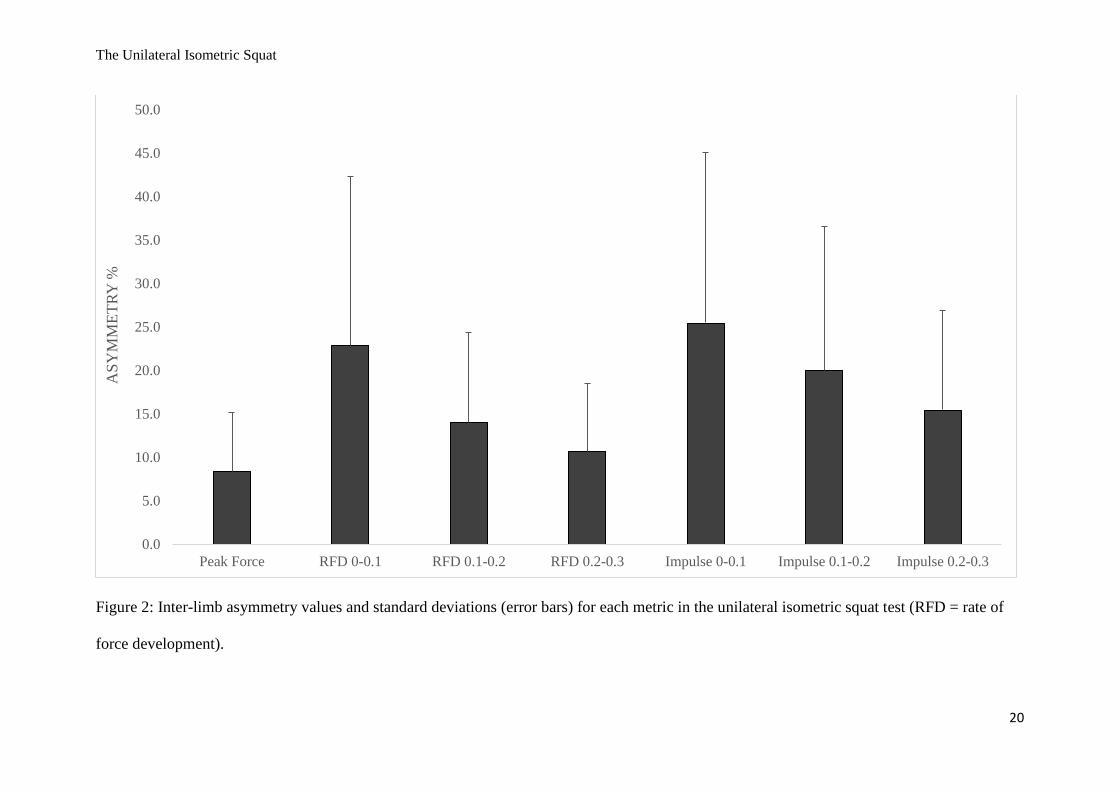
sizes were small (0.32 to 0.56) for all metrics. For asymmetry (Figure 2), the smallest
differences were seen for PF (8.36%) and a noticeable trend was evident for these inter-limb
differences when RFD and impulse were viewed. Asymmetries were largest during the first
timeframe (0-0.1s) and continued to decrease from 0.1-0.2 and 0.2-0.3s respectively. Finally,
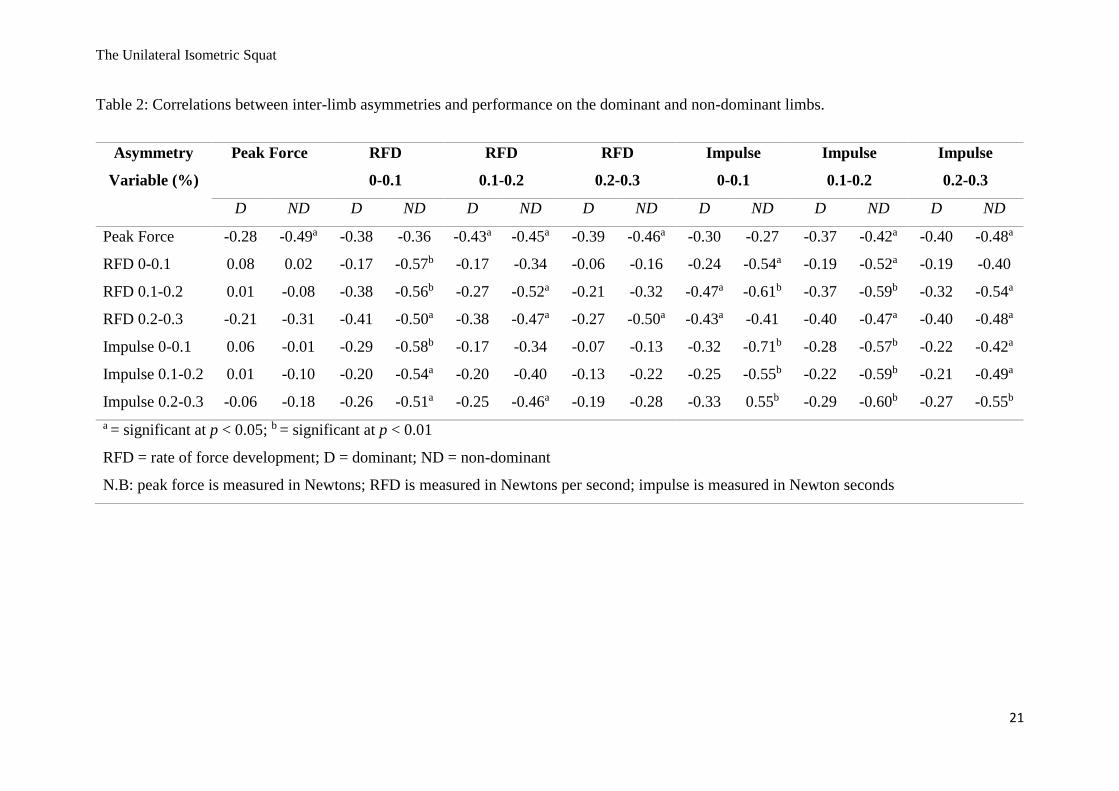
relationships between asymmetry scores and limb dominance are presented in Table 2. Of note,
all significant relationships (p < 0.05) were negative indicating that larger asymmetries were
indicative of reduced force outputs. Three significant negative relationships were shown with
the D limb (r range = -0.43 to -0.47), whilst 31 negative correlations (out of a possible 49) were
reported with the ND limb (r range = -0.42 to -0.71).
*** INSERT TABLE 1 ABOUT HERE ***
*** INSERT FIGURE 2 ABOUT HERE ***
*** INSERT TABLE 2 ABOUT HERE ***
DISCUSSION
The aims of the present study were to establish the reliability of the unilateral isometric squat
across a range of metrics and quantify their associated inter-limb asymmetries. A further aim
was to establish the relationships between the asymmetry scores and performance on the D and
The Unilateral Isometric Squat
9
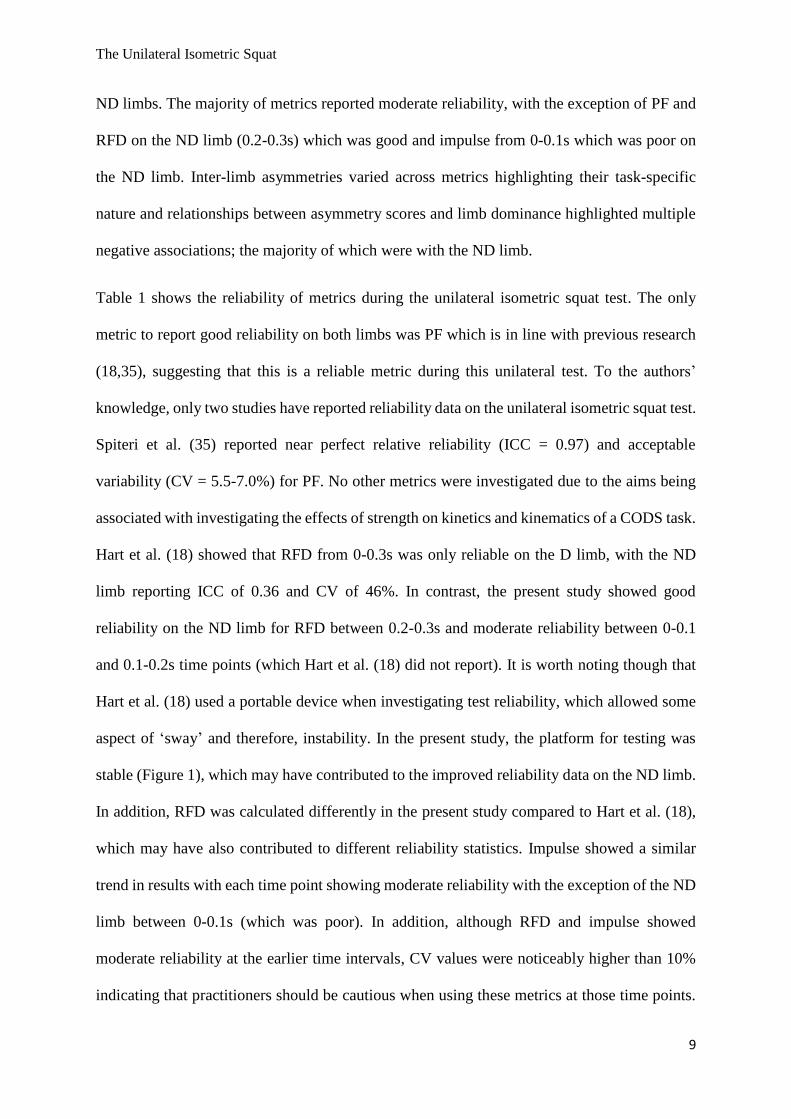
ND limbs. The majority of metrics reported moderate reliability, with the exception of PF and
RFD on the ND limb (0.2-0.3s) which was good and impulse from 0-0.1s which was poor on
the ND limb. Inter-limb asymmetries varied across metrics highlighting their task-specific
nature and relationships between asymmetry scores and limb dominance highlighted multiple
negative associations; the majority of which were with the ND limb.
Table 1 shows the reliability of metrics during the unilateral isometric squat test. The only
metric to report good reliability on both limbs was PF which is in line with previous research
(18,35), suggesting that this is a reliable metric during this unilateral test. To the authors’
knowledge, only two studies have reported reliability data on the unilateral isometric squat test.
Spiteri et al. (35) reported near perfect relative reliability (ICC = 0.97) and acceptable
variability (CV = 5.5-7.0%) for PF. No other metrics were investigated due to the aims being
associated with investigating the effects of strength on kinetics and kinematics of a CODS task.
Hart et al. (18) showed that RFD from 0-0.3s was only reliable on the D limb, with the ND
limb reporting ICC of 0.36 and CV of 46%. In contrast, the present study showed good
reliability on the ND limb for RFD between 0.2-0.3s and moderate reliability between 0-0.1
and 0.1-0.2s time points (which Hart et al. (18) did not report). It is worth noting though that
Hart et al. (18) used a portable device when investigating test reliability, which allowed some
aspect of ‘sway’ and therefore, instability. In the present study, the platform for testing was
stable (Figure 1), which may have contributed to the improved reliability data on the ND limb.
In addition, RFD was calculated differently in the present study compared to Hart et al. (18),
which may have also contributed to different reliability statistics. Impulse showed a similar
trend in results with each time point showing moderate reliability with the exception of the ND
limb between 0-0.1s (which was poor). In addition, although RFD and impulse showed
moderate reliability at the earlier time intervals, CV values were noticeably higher than 10%
indicating that practitioners should be cautious when using these metrics at those time points.
The Unilateral Isometric Squat
10
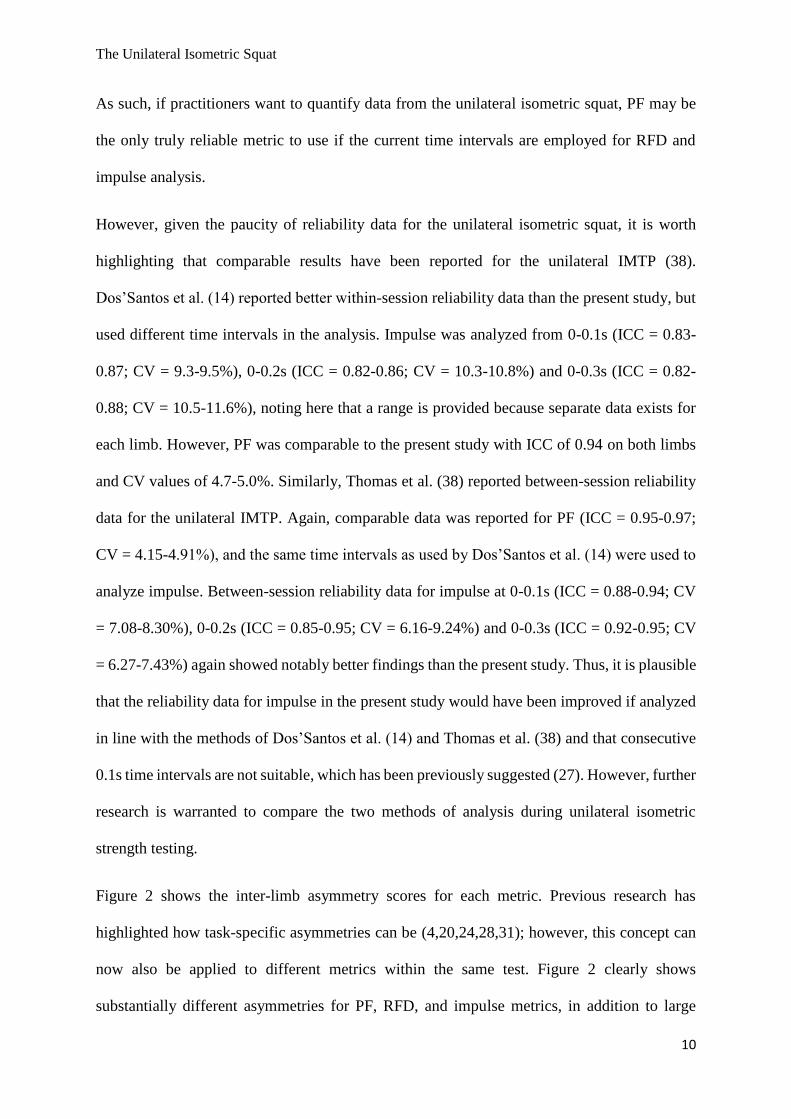
As such, if practitioners want to quantify data from the unilateral isometric squat, PF may be
the only truly reliable metric to use if the current time intervals are employed for RFD and
impulse analysis.
However, given the paucity of reliability data for the unilateral isometric squat, it is worth
highlighting that comparable results have been reported for the unilateral IMTP (38).
Dos’Santos et al. (14) reported better within-session reliability data than the present study, but
used different time intervals in the analysis. Impulse was analyzed from 0-0.1s (ICC = 0.83-
0.87; CV = 9.3-9.5%), 0-0.2s (ICC = 0.82-0.86; CV = 10.3-10.8%) and 0-0.3s (ICC = 0.82-
0.88; CV = 10.5-11.6%), noting here that a range is provided because separate data exists for
each limb. However, PF was comparable to the present study with ICC of 0.94 on both limbs
and CV values of 4.7-5.0%. Similarly, Thomas et al. (38) reported between-session reliability
data for the unilateral IMTP. Again, comparable data was reported for PF (ICC = 0.95-0.97;
CV = 4.15-4.91%), and the same time intervals as used by Dos’Santos et al. (14) were used to
analyze impulse. Between-session reliability data for impulse at 0-0.1s (ICC = 0.88-0.94; CV
= 7.08-8.30%), 0-0.2s (ICC = 0.85-0.95; CV = 6.16-9.24%) and 0-0.3s (ICC = 0.92-0.95; CV
= 6.27-7.43%) again showed notably better findings than the present study. Thus, it is plausible
that the reliability data for impulse in the present study would have been improved if analyzed
in line with the methods of Dos’Santos et al. (14) and Thomas et al. (38) and that consecutive
0.1s time intervals are not suitable, which has been previously suggested (27). However, further
research is warranted to compare the two methods of analysis during unilateral isometric
strength testing.
Figure 2 shows the inter-limb asymmetry scores for each metric. Previous research has
highlighted how task-specific asymmetries can be (4,20,24,28,31); however, this concept can
now also be applied to different metrics within the same test. Figure 2 clearly shows
substantially different asymmetries for PF, RFD, and impulse metrics, in addition to large
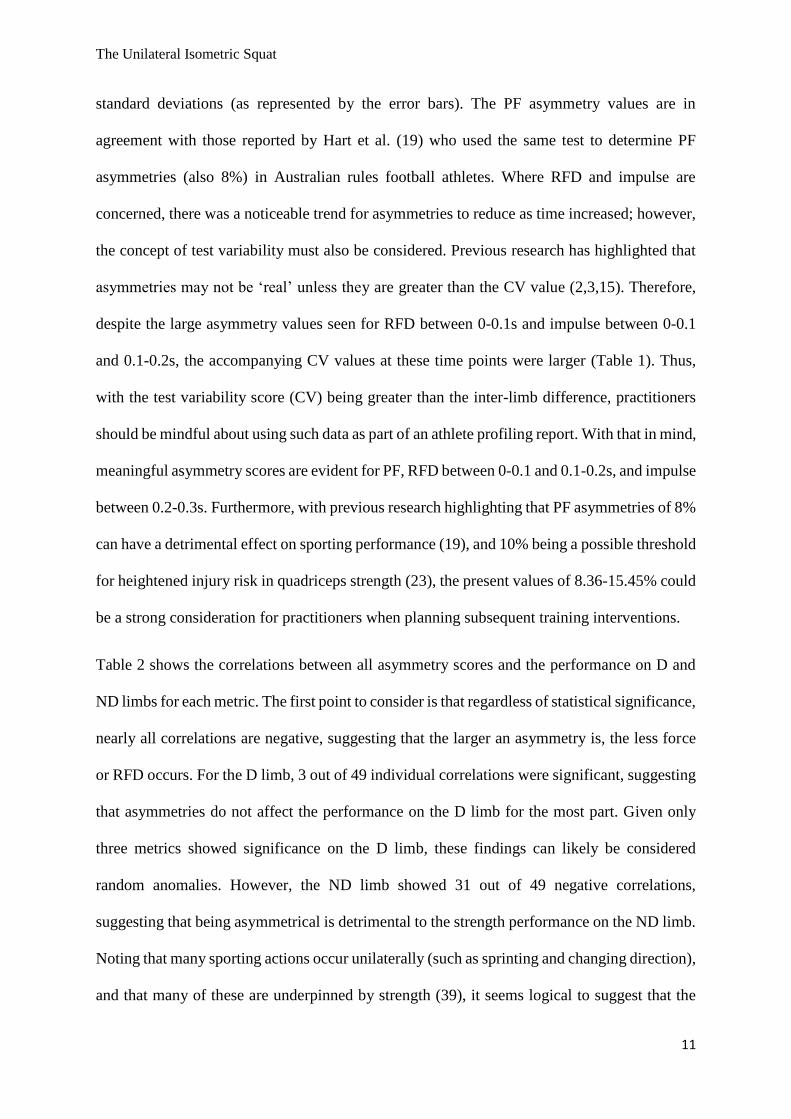
The Unilateral Isometric Squat
11
standard deviations (as represented by the error bars). The PF asymmetry values are in
agreement with those reported by Hart et al. (19) who used the same test to determine PF
asymmetries (also 8%) in Australian rules football athletes. Where RFD and impulse are
concerned, there was a noticeable trend for asymmetries to reduce as time increased; however,
the concept of test variability must also be considered. Previous research has highlighted that
asymmetries may not be ‘real’ unless they are greater than the CV value (2,3,15). Therefore,
despite the large asymmetry values seen for RFD between 0-0.1s and impulse between 0-0.1
and 0.1-0.2s, the accompanying CV values at these time points were larger (Table 1). Thus,
with the test variability score (CV) being greater than the inter-limb difference, practitioners
should be mindful about using such data as part of an athlete profiling report. With that in mind,
meaningful asymmetry scores are evident for PF, RFD between 0-0.1 and 0.1-0.2s, and impulse
between 0.2-0.3s. Furthermore, with previous research highlighting that PF asymmetries of 8%
can have a detrimental effect on sporting performance (19), and 10% being a possible threshold
for heightened injury risk in quadriceps strength (23), the present values of 8.36-15.45% could
be a strong consideration for practitioners when planning subsequent training interventions.
Table 2 shows the correlations between all asymmetry scores and the performance on D and
ND limbs for each metric. The first point to consider is that regardless of statistical significance,
nearly all correlations are negative, suggesting that the larger an asymmetry is, the less force
or RFD occurs. For the D limb, 3 out of 49 individual correlations were significant, suggesting
that asymmetries do not affect the performance on the D limb for the most part. Given only
three metrics showed significance on the D limb, these findings can likely be considered
random anomalies. However, the ND limb showed 31 out of 49 negative correlations,
suggesting that being asymmetrical is detrimental to the strength performance on the ND limb.
Noting that many sporting actions occur unilaterally (such as sprinting and changing direction),
and that many of these are underpinned by strength (39), it seems logical to suggest that the
The Unilateral Isometric Squat
12
correction of these imbalances and strengthening for the ND limb could be advantageous.
Furthermore, a recent critical review of the effects of asymmetry on athletic performance
highlighted that the reduction of imbalances could be seen from a ‘windows of opportunity’
perspective (28). In essence, with additional focus being provided to the weaker limb, this may
assist in reducing any existing side-to-side differences and enhance overall force output
bilaterally. Given the volume of negative relationships reported on the ND limb in the present
study, this may be a viable option for practitioners to consider if similar results are found with
their athletes. Previous research has suggested that unilateral training is most likely a
favourable method for reducing inter-limb asymmetries (6,10,17). In this context, it may be
suggested that exercises such as split squats, step ups, and lunges might be appropriate for
reducing strength imbalances; thus, improving the performance of the ND limb in a task such
as the unilateral isometric squat.
This study was not without some limitations. Firstly, it only investigated within-session
reliability data; thus, further research should aim to establish between-session reliability data
for the chosen metrics. This between-session analysis should also be computed for asymmetry
data as well, noting that we alluded to the task-specific nature of asymmetry earlier. In addition,
these findings can only be attributed to recreational sport athletes. Given the importance of
strength for athletic development (36,37), future research should also aim to establish reliability
data in elite athlete populations for unilateral isometric tasks.
In summary, PF may be the only truly reliable metric when analyzing force-time curves from
the unilateral isometric squat test. With real inter-limb asymmetries of 8.36-15.45% and
multiple relationships with reduced force characteristics on the ND limb, it is suggested that
the reduction of between-limb differences in strength may be warranted.
The Unilateral Isometric Squat
13
PRACTICAL APPLICATIONS
The findings of the present study show that if practitioners wish to use the unilateral isometric
squat to assess force production capabilities of each limb, PF may be the only metric to interpret
with real confidence given its strong reliability. Asymmetries in strength as small as 6.6% have
been shown to correlate with reduced jump performance (1), therefore the inter-limb
differences reported in the present study can be considered quite large. When their effects on
the force production capability of the ND limb are considered as well, the results indicate that
practitioners should be mindful of such large imbalances and it seems logical to suggest that
practitioners may wish to consider reducing these imbalances. If said imbalances are viewed
as ‘windows of opportunity’, the addition of unilateral strength exercises such as split squats,
lunges and step ups in conjunction with bilateral lifts, may help to reduce asymmetries. The
relevance here being that many sporting actions occur unilaterally for team sport athletes (such
as sprinting and changing direction), many of which are underpinned by strength. Thus, the
reduction of strength asymmetries seems like a logical suggestion for athlete populations.
The Unilateral Isometric Squat
14
REFERENCES
1. Bailey C, Sato K, Alexander R, Chiang C-Y and Stone M. Isometric force production
symmetry and jumping performance in collegiate athletes. J Trainology 2: 1-5, 2013.
2. Bishop C, Read P, Chavda S and Turner A. Asymmetries of the lower limb: The
calculation conundrum in strength training and conditioning. Strength Cond J 38: 27-
32, 2016.
3. Bishop C, Read P, Lake J, Chavda S and Turner A. Inter-limb asymmetries:
Understanding how to calculate differences from bilateral and unilateral tests. Strength
Cond J 40: 1-6, 2018.
4. Bishop C, Read P, McCubbine J, and Turner A. Vertical and horizontal asymmetries
are related to slower sprinting and jump performance in elite youth female soccer
players. J Strength Cond Res (Published ahead of print).
5. Bishop C, Turner A, and Read P. Effects of inter-limb asymmetries on physical and
sports performance: A systematic review. J Sports Sci 36: 1135-1144, 2018.
6. Bishop C, Turner A and Read P. Training methods and considerations for practitioners
to reduce interlimb asymmetries. Strength Cond J 40: 40-46, 2018.
7. Bishop C, Turner A, Jarvis P, Chavda S and Read P. Considerations for selecting field-
based strength and power fitness tests to measure asymmetries. J Strength Cond Res
31: 2635-2644, 2017.
8. Bradshaw E, Hume P, Calton M and Aisbett B. Reliability and variability of day-to-
day vault training measures in artistic gymnastics. Sports Biomech 9: 79-97, 2010.
9. Brady C, Harrison A, Flanagan E, Haff G and Comyns T. A comparison of the isometric
mid-thigh pull and isometric squat: Intraday reliability, usefulness and the magnitude
of difference between tests. Int J Sports Physiol Perform (Published ahead of print).
10. Brown SR, Feldman ER, Cross MR, Helms ER, Marrier B, Samozino P, and Morin J-
B. The potential for a targeted strength training programme to decrease asymmetry and
increase performance: A proof of concept in sprinting. Int J Sports Physiol Perform 12:
1392-1397, 2017.
11. Chavda S, Bromley T, Jarvis P, Williams S, Bishop C, Turner A, Lake J and Mundy P.
Force-time characteristics of the countermovement jump: Analyzing the curve in Excel.
Strength Cond J 40: 67-77, 2018.
The Unilateral Isometric Squat
15
12. Costa Silva JRL, Detanico D, Dal Pupo J and Freitas C. Bilateral asymmetry of knee
and ankle isokinetic torque in soccer players u20 category. Braz J Kinanthro Human
Perf 17: 195-204, 2015.
13. Dos’Santos T, Lake J, Jones P and Comfort P. Effect of low-pass filtering on isometric
midthigh pull kinetics. J Strength Cond Res 32: 983-989, 2018.
14. Dos’Santos T, Thomas C, Jones P, & Comfort P. Assessing muscle-strength asymmetry
via a unilateral-stance isometric midthigh pull. Int J Sports Physiol Perform 12: 505-
511, 2017.
15. Exell T, Irwin G, Gittoes M and Kerwin D. Implications of intra-limb variability on
asymmetry analyses. J Sports Sci 30: 403-409, 2012.
16. Flanagan S and Salem G. Bilateral differences in the net joint torques during the squat
exercise. J Strength Cond Res 21: 1220-1226, 2007.
17. Gonzalo-Skok O, Tous-Fajardo J, Suarez-Arrones L, Arjol-Serrano JL, Casajus JA, and
Mendez-Villanueva A. Single-leg power output and between-limbs imbalances in
team-sport players: Unilateral versus bilateral combined resistance training. Int J Sports
Physiol Perform 12: 106-114, 2017.
18. Hart N, Nimphius S, Cochrane J and Newton R. Reliability and validity of unilateral
and bilateral isometric strength measures using a customised, portable apparatus. J Aust
Strength Cond 20: 61-67, 2012.
19. Hart N, Nimphius S, Spiteri T and Newton R. Leg strength and lean mass symmetry
influences kicking performance in Australian Football. J Sports Sci Med 13: 157-165,
2014.
20. Hart N, Spiteri T, Lockie R, Nimphius S and Newton R. Detecting deficits in change
of direction performance using the preplanned multidirectional Australian football
league agility test. J Strength Cond Res 28: 3552-3556, 2014.
21. Hodges S, Patrick R and Reiser R. Effects of fatigue on bilateral ground reaction force
asymmetries during the squat exercise. J Strength Cond Res 25: 3107-3117, 2011.
22. Hopkins W, Marshall S, Batterham A, and Hanin J. Progressive statistics for studies in
sports medicine and exercise science. Med Sci Sports Exerc 41: 3-13, 2009.
23. Kyritsis P, Bahr R, Landreau P, Miladi R, and Witvrouw E. Likelihood of ACL graft
rupture: Not meeting six clinical discharge criteria before return to sport is associated
with a four times greater risk of rupture. Brit J Sports Med 50: 946–951, 2016.
The Unilateral Isometric Squat
16
24. Lauersen J, Bertelsen D and Andersen L. The effectiveness of exercise interventions to
prevent sports injuries: A systematic review and meta-analysis of randomised
controlled trials. Brit J Sports Med 48: 871-877, 2014.
25. Lockie R, Callaghan S, Berry S, Cooke E, Jordan C, Luczo T and Jeffriess M.
Relationship between unilateral jumping ability and asymmetry on multidirectional
speed in team-sport athletes. J Strength Cond Res 28: 3557-3566, 2014.
26. Loturco I, Nakamura F, Kobal R, Gil S, Pivetti B, Pereira L and Roschel H. Traditional
periodization versus optimum training load applied to soccer players: effects on
neuromuscular abilities. Int J Sports Med 37: 1051-1059, 2016.
27. Maffiuletti N, Aagaard P, Blazevich A, Folland J, Tillin N and Duchateau J. Rate of
force development: Physiological and methodological considerations. Euro J Appl
Physiol 116: 1091-1116, 2016.
28. Maloney S. The relationship between asymmetry and athletic performance: A critical
review. J Strength Cond Res (Published ahead of print).
29. Maloney SJ, Fletcher IM and Richards J. A comparison of methods to determine
bilateral asymmetries in vertical leg stiffness. J Sports Sci 34: 829-835, 2016.
30. Marshall J, Turner A, Jarvis P, Maloney S, Cree J and Bishop C. Postactivation
potentiation and change of direction speed in elite academy rugby players. J Strength
Cond Res (Published ahead of print).
31. Owen N, Watkins J, Kilduff L, Bevan H, & Bennett M. Development of a criterion
method to determine peak mechanical power output in a countermovement jump. J
Strength Cond Res 28: 1552-1558, 2014.
32. Read P, Oliver J, Myer G, De Ste Croix M and Lloyd R. The effects of maturation on
measures of asymmetry during neuromuscular control tests in elite male youth soccer
players. Pediatric Exerc Sci 44: 1-23, 2017.
33. Ruas CV, Brown LE and Pinto RS. Lower-extremity side-to-side strength asymmetry
of professional soccer players according to playing position. Kinesiology 2: 188-192,
2015.
34. Sato K and Heise G. Influence of weight distribution asymmetry on the biomechanics
of a barbell squat. J Strength Cond Res 26: 342-349, 2012.
35. Spiteri T, Cochrane J, Hart N, Haff G and Nimphius S. Effect of strength on plant foot
kinetics and kinematics during a change of direction task. Euro J Sport Sci 13: 646-
652, 2013.
The Unilateral Isometric Squat
17
36. Suchomel T, Nimphius S and Stone M. The importance of muscular strength in athletic
performance. Sports Med 46: 1419-1449, 2016.
37. Suchomel T, Nimphius S, Bellon C and Stone M. The importance of muscular strength:
Training considerations. Sports Med 48: 765-785, 2018.
38. Thomas C, Comfort P, Jones P and Dos’Santos T. Between-session reliability of the
unilateral stance isometric mid-thigh pull. J Aust Strength Cond 25: 6-10, 2017.
39. Young W, James R and Montgomery I. Is muscle power related to running speed with
changes of direction? J Sports Med Phys Fit 42: 282-288, 2002.
The Unilateral Isometric Squat
18
Figures 1a and 1b: Example positioning during the unilateral isometric squat test.
The Unilateral Isometric Squat
19
Table 1: Mean ± standard deviation, effect size (between D and ND limbs) and reliability data for the unilateral isometric squat test. Peak force
measured in Newtons, RFD measured in Newtons per second, and impulse measured in Newton seconds.
Test Variable Mean ± SD Effect Size CV (%) ICC (95% CI) Reliability
Descriptor
Peak force (D)
Peak force (ND)
RFD 0-0.1s (D)
RFD 0-0.1s (ND)
RFD 0.1-0.2s (D)
RFD 0.1-0.2s (ND)
RFD 0.2-0.3s (D)
RFD 0.2-0.3s (ND)
Impulse 0-0.1s (D)
Impulse 0-0.1s (ND)
Impulse 0.1-0.2s (D)
Impulse 0.1-0.2s (ND)
Impulse 0.2-0.3s (D)
Impulse 0.2-0.3s (ND)
1661.80 ± 408.67
1530.35 ± 417.79
5676.94 ± 2503.34
4458.20 ± 2565.73
4625.61 ± 1651.47
4023.74 ± 1652.79
3615.60 ± 1137.48
3251.05 ± 1135.98
31.46 ± 12.48
24.21 ± 13.18
109.68 ± 42.13
89.21 ± 44.04
211.50 ± 72.72
180.96 ± 73.39
0.32
0.48
0.36
0.32
0.56
0.47
0.42
5.70
5.44
18.57
25.98
12.37
13.10
10.37
9.20
23.48
32.12
14.59
20.26
12.14
13.71
0.93 (0.87-0.96)
0.94 (0.88-0.97)
0.87 (0.77-0.93)
0.78 (0.64-0.88)
0.92 (0.86-0.96)
0.92 (0.85-0.96)
0.89 (0.81-0.94)
0.91 (0.85-0.96)
0.77 (0.61-0.87)
0.60 (0.39-0.77)
0.90 (0.82-0.95)
0.83 (0.70-0.91)
0.92 (0.85-0.96)
0.89 (0.80-0.94)
Good
Good
Moderate
Moderate
Moderate
Moderate
Moderate
Good
Moderate
Poor
Moderate
Moderate
Moderate
Moderate
SD = standard deviation; CV = coefficient of variation; ICC = intraclass correlation coefficient; CI = confidence intervals; D = dominant; ND =
non-dominant; RFD = rate of force development; s = seconds.
The Unilateral Isometric Squat
20
Figure 2: Inter-limb asymmetry values and standard deviations (error bars) for each metric in the unilateral isometric squat test (RFD = rate of
force development).
0.0
5.0
10.0
15.0
20.0
25.0
30.0
35.0
40.0
45.0
50.0
Peak Force RFD 0-0.1 RFD 0.1-0.2 RFD 0.2-0.3 Impulse 0-0.1 Impulse 0.1-0.2 Impulse 0.2-0.3
AS
YM
ME
TR
Y %
The Unilateral Isometric Squat
21
Table 2: Correlations between inter-limb asymmetries and performance on the dominant and non-dominant limbs.
Asymmetry
Variable (%)
Peak Force RFD
0-0.1
RFD
0.1-0.2
RFD
0.2-0.3
Impulse
0-0.1
Impulse
0.1-0.2
Impulse
0.2-0.3
D ND D ND D ND D ND D ND D ND D ND
Peak Force -0.28 -0.49a -0.38 -0.36 -0.43a -0.45a -0.39 -0.46a -0.30 -0.27 -0.37 -0.42a -0.40 -0.48a
RFD 0-0.1 0.08 0.02 -0.17 -0.57b -0.17 -0.34 -0.06 -0.16 -0.24 -0.54a -0.19 -0.52a -0.19 -0.40
RFD 0.1-0.2 0.01 -0.08 -0.38 -0.56b -0.27 -0.52a -0.21 -0.32 -0.47a -0.61b -0.37 -0.59b -0.32 -0.54a
RFD 0.2-0.3 -0.21 -0.31 -0.41 -0.50a -0.38 -0.47a -0.27 -0.50a -0.43a -0.41 -0.40 -0.47a -0.40 -0.48a
Impulse 0-0.1 0.06 -0.01 -0.29 -0.58b -0.17 -0.34 -0.07 -0.13 -0.32 -0.71b -0.28 -0.57b -0.22 -0.42a
Impulse 0.1-0.2 0.01 -0.10 -0.20 -0.54a -0.20 -0.40 -0.13 -0.22 -0.25 -0.55b -0.22 -0.59b -0.21 -0.49a
Impulse 0.2-0.3 -0.06 -0.18 -0.26 -0.51a -0.25 -0.46a -0.19 -0.28 -0.33 0.55b -0.29 -0.60b -0.27 -0.55b
a = significant at p < 0.05; b = significant at p < 0.01
RFD = rate of force development; D = dominant; ND = non-dominant
N.B: peak force is measured in Newtons; RFD is measured in Newtons per second; impulse is measured in Newton seconds


