THE UNIFIED GOVERNMENT OF ATHENS-CLARKE COUNTY FY …
455
THE UNIFIED GOVERNMENT OF ATHENS-CLARKE COUNTY FY 2022 ANNUAL OPERATING & CAPITAL BUDGET JULY 1, 2021 - JUNE 30, 2022
Transcript of THE UNIFIED GOVERNMENT OF ATHENS-CLARKE COUNTY FY …
THE UNIFIED GOVERNMENT OF ATHENS-CLARKE COUNTY
FY 2022 ANNUAL OPERATING & CAPITAL BUDGET
JULY 1, 2021 - JUNE 30, 2022

ATHENS-CLARKE COUNTY MISSION STATEMENT
Athens-Clarke County, an open and responsive government,
facilitating a positive environment
for individuals to obtain a high quality of life and local organizations to achieve success
by providing innovative, high quality services and
responsible stewardship of the community’s resources, to benefit current and future generations.
Adopted by the Mayor and Commission November 4, 1997

SECTION A ‐ INTRODUCTION Mayor’s Transmittal Letter ............................................................................................. A‐1
Mayor & Commission ...................................................................................................... A‐5
List of Principal Officials .................................................................................................. A‐6
ACCGOV Organizational Charts ....................................................................................... A‐7
SECTION B ‐ BUDGET SUMMARY Executive Summary ......................................................................................................... B‐1
Strategic Plan .................................................................................................................. B‐2
General Fund Summary .................................................................................................. B‐3
All Funds Summary .......................................................................................................... B‐4
FY22 Revenues ................................................................................................................ B‐5
General Fund Revenues .............................................................................................. B‐5
Other Revenue Changes ............................................................................................. B‐9
FY22 Expenses ............................................................................................................... B‐11
Current Services ........................................................................................................ B‐11
New Initiatives .......................................................................................................... B‐12
SPLOST Impacts ........................................................................................................ B‐14
Additional Positions and Other Personnel Changes ................................................. B‐14
Authorized Positions by Department ....................................................................... B‐15
Changes to Compensation and Benefits................................................................... B‐16
FY22 Budget Ordinance ................................................................................................. B‐18
Development of FY22 Operating Budget ...................................................................... B‐22
Legal and Charter Requirements .............................................................................. B‐22
Budget Development Process .................................................................................. B‐22
SECTION C ‐ DEPARTMENT BUDGETS Airport .............................................................................................................................. C‐1
Animal Services ................................................................................................................ C‐5
Attorney ........................................................................................................................... C‐8
Board of Elections ..........................................................................................................C‐11
Building Inspection .........................................................................................................C‐14
Central Services ..............................................................................................................C‐17
Clerk of Courts ................................................................................................................C‐24
Cooperative Extension Service .......................................................................................C‐26
Coroner ..........................................................................................................................C‐28
Corrections .....................................................................................................................C‐29
Debt Service ...................................................................................................................C‐34
District Attorney .............................................................................................................C‐35
Economic Development .................................................................................................C‐38
Finance ...........................................................................................................................C‐42
Fire & Emergency Services .............................................................................................C‐45
Housing & Community Development ............................................................................C‐49
Human Resources ..........................................................................................................C‐54
Independent Agencies ...................................................................................................C‐58

Information Technology .................................................................................................C‐59
Juvenile Court .................................................................................................................C‐61
Leisure Services ..............................................................................................................C‐63
Magistrate Court ............................................................................................................C‐68
Manager .........................................................................................................................C‐72
Mayor & Commission ....................................................................................................C‐80
Municipal Court ..............................................................................................................C‐82
Operational Analysis ......................................................................................................C‐85
Other Financing Uses .....................................................................................................C‐87
Other General Administration .......................................................................................C‐88
Planning & Zoning ..........................................................................................................C‐92
Police Services ................................................................................................................C‐96
Probate Court .............................................................................................................. C‐104
Public Utilities.............................................................................................................. C‐106
Sheriff .......................................................................................................................... C‐110
Solicitor General .......................................................................................................... C‐115
Solid Waste.................................................................................................................. C‐119
State Court .................................................................................................................. C‐125
Superior Courts ........................................................................................................... C‐127
Tax Assessors ............................................................................................................... C‐132
Tax Commissioner ....................................................................................................... C‐135
Transit ......................................................................................................................... C‐138
Transportation & Public Works ................................................................................... C‐142
SECTION D ‐ CAPITAL BUDGET & CAPITAL IMPROVEMENT PLAN Capital Improvement Plan & FY22 Capital Budget Narrative ......................................... D‐1
Summary of Major Projects ............................................................................................ D‐2
General Capital Projects Fund ......................................................................................... D‐3
Economic Development Capital Fund ........................................................................... D‐10
Fleet Management Fund ............................................................................................... D‐11
Fleet Replacement Fund ............................................................................................... D‐12
Hotel/Motel Tax Fund ................................................................................................... D‐13
Internal Support Fund ................................................................................................... D‐14
Landfill Enterprise Fund ................................................................................................ D‐15
Solid Waste Enterprise Fund ......................................................................................... D‐16
Stormwater Management Enterprise Fund .................................................................. D‐17
Water & Sewer Enterprise Fund ................................................................................... D‐18
Project Data Sheets by Department ..................................................... D‐20 through D‐180
SECTION E ‐ BUDGETS BY FUND Budgets by Fund Introduction .......................................................................................... E‐1
All Funds Summary by Fund Type .................................................................................... E‐2
All Funds Expenditures Summary by Fund ....................................................................... E‐4
General Fund .................................................................................................................... E‐5
Hotel/Motel Fund ............................................................................................................ E‐8
Community Development Block Grant Fund ................................................................... E‐9
Revolving Loan Fund ...................................................................................................... E‐10
Emergency Telephone System Fund .............................................................................. E‐11
HUD HOME Grant Fund .................................................................................................. E‐12
Grants Fund .................................................................................................................... E‐13
Alternative Dispute Resolution Fund ............................................................................. E‐14
Affordable Housing Fund ............................................................................................... E‐15
Supportive Housing Fund ............................................................................................... E‐16
Special Programs Fund ................................................................................................... E‐17
Building Inspection Fund ................................................................................................ E‐18
Sheriff Inmate Fund ........................................................................................................ E‐19
Corrections Inmate Fund ............................................................................................... E‐20
American Rescue Plan Special Revenue Fund ................................................................ E‐21
Mall Area Tax Allocation District .................................................................................... E‐22
West Broad/Hawthorne Tax Allocation District Fund .................................................... E‐23
Newton Bridge Tax Allocation District Fund .................................................................. E‐24
East Downtown Tax Allocation District Fund ................................................................. E‐25
North Avenue Tax Allocation District Fund .................................................................... E‐26
Lexington Road Tax Allocation District Fund ................................................................. E‐27
Public Facilities Authority Capital Fund .......................................................................... E‐28
Economic Development Capital Projects Fund .............................................................. E‐29
General Capital Projects Fund ........................................................................................ E‐30
SPLOST Debt Service Fund ............................................................................................. E‐31
Airport Fund ................................................................................................................... E‐32
Landfill Fund ................................................................................................................... E‐33
Public Transit Fund ......................................................................................................... E‐34
Water & Sewer Fund ..................................................................................................... E‐35
Solid Waste Collection Fund .......................................................................................... E‐37
Stormwater Utility Fund ................................................................................................. E‐38
Internal Support Fund .................................................................................................... E‐39
Fleet Management Fund ................................................................................................ E‐40
Fleet Replacement Fund ................................................................................................ E‐41
Insurance & Claims Fund ................................................................................................ E‐42
Health Insurance Fund ................................................................................................... E‐43
Interfund Transfers & Charges ....................................................................................... E‐44
SECTION F ‐ INDEPENDENT AGENCIES Appropriation Summary of Independent Agency Budgets .............................................. F‐1
Independent Agencies Budget Overview ......................................................................... F‐2
SECTION G ‐ OTHER INFORMATION Athens‐Clarke County Demographic Information ........................................................... G‐1
CDBG and Home Grants .................................................................................................. G‐3

Debt Service Requirements ............................................................................................. G‐6
Athens‐Clarke County Fiscal Policies ............................................................................... G‐9
Schedule of Fees and Charges ....................................................................................... G‐15
SECTION H – GLOSSARY Glossary of Terms ............................................................................................................ H‐1
Acronyms ........................................................................................................................ H‐6


Sustainability outcomes can also be found in new purchase of leaf vacuums and shifting county operations to battery operated leaf blowers ($75,000 in capital).
$36,000 of funding has been added for camera systems to deter illegal dumping that has become a problem in several areas of the county.
Gateway and Corridor Maintenance: this budget includes two additional landscape maintenance positions to improve gateway and corridor appearances, beginning the 2nd quarter of FY22 ($100,000).
Youth activities and family supports are also a key element of a Healthy, Livable and Sustainable Community. The FY22 budget prioritizes this focus area, including continuation of the Neighborhood Leaders program, the Youth Commission, the Grand Slam summer youth program and a host of other activities including: The three-year pilot of Young Urban Builders is extended, given the great success of the program
and opportunity to both provide trade skills to high school youth and support home repair needs of those in Athens without the means to provide for their homes’ ideal physical upkeep ($100,000).
“Counselors In Training”, providing summer employment for up to 23 teens ages 15-18 which will develop self-esteem, peer relations, interpersonal skills, and leadership qualities while working in our summer camp programs ($60,000).
Continued renovations to both Lay Park and East Athens Park centers to include art rooms and programming equipment software to include video production/editing, graphic design, and robotics ($190,000).
$100,000 has been budgeted for additional youth development programming that will be more clearly defined and implemented during FY22.
Juneteenth educational events to include community education culminating in Athens’ first community-wide celebration event for Juneteenth, with local youth involved in both visual and performing arts ($20,000).
$50,000 of capital funding has been budgeted for an environmental study of the Dunlap and Pittard Road areas.
Public Safety initiatives, focused on becoming a Safe and Prepared Community, provide dignity to the public and improve safety continue as a key considerations: As the Department of Corrections continues to enhance employment skills and life skills supports
for those incarcerated individuals, including with the transition of 10 more beds for the Transition Center program in which inmates work for pay in the community, there is the addition of a part-time social worker to support personal development, rehabilitative needs and recidivism reduction. Success measures in these areas will be tracked ($30,000).
The Jerry Nesmith Co-Responder Unit will be bolstered with four additional Licensed Clinical Social Workers who will be paired with re-deployed ACCPD officers – creating a total of seven units. This also presages development of a more thorough front-line behavioral health emergency response program through collaboration between the Safety and Justice Committee and other partner entities, and using emerging funding streams ($336,000).
An initiative to partner with an external agency to create an Alternative Crisis Response Team beginning the second quarter of FY22 ($277,000).
In addition to activities through the SPLOST program and partnerships, we are developing Shared Prosperity through housing and homeless supports:
FY22 Budget A-2

FY22 Budget A-3

FY22 Budget A-4

Kelly Girtz Mayor
Patrick Davenport District 1 Commissioner
Mariah Parker District 2 Commissioner
Melissa Link District 3 Commissioner
Allison Wright District 4 Commissioner
Tim Denson District 5 Commissioner
Jesse Houle District 6 Commissioner
Russell Edwards District 7 Commissioner
Carol Myers District 8 Commissioner
Ovita Thornton District 9 Commissioner
Mike Hamby District 10 Commissioner
Mayor and Commission
FY22 Budget A-5

Elected Officials Clerk of Courts Beverly Logan State Court Chief Judge Ethelyn Simpson
Coroner Sonny Wilson State Court Judge Charles Auslander
District Attorney Deborah Gonzalez Superior Court Chief Judge Eric Norris
Magistrate Court Chief Judge
Patricia Barron Superior Court Judge H. Patrick Haggard
Probate Court Judge Susan Schaffer Superior Court Judge Lawton Stephens
Sheriff John Q. Williams Superior Court Judge Lisa Lott
Solicitor General C.R. Chisholm Tax Commissioner Toni Meadow
Appointed Officials Manager Blaine H. Williams Economic Development Director Ilka McConnell
Assistant Manager Josh Edwards Finance Director David Boyd
Assistant Manager Niki Jones Housing & Community Development Director
Hayley Banerjee
Attorney Judd Drake Human Resources Director Jeff Hale
Internal Auditor Stephanie Maddox Information Technology Director Travis Cooper
Airport Director Mike Mathews Juvenile Court Judge Amanda Trimble
Animal Services Director Kristall Barber Leisure Services Director Kent Kilpatrick
Building Inspection Director
Doug Hansford Municipal Court Judge Ryan Hope
Central Services Director Andrew Saunders Planning & Zoning Director Brad Griffin
Chief of Fire & Emergency Services
Jeff Scarbrough Public Information Officer Jeff Montgomery
Chief of Police Cleveland Spruill Public Transit Director Pat Hale (Interim)
Chief Tax Appraiser Kirk Dunagan Public Utilities Director Hollis Terry (Interim)
Clerk of Commission Jean Spratlin Solid Waste Director Suki Janssen
Corrections Warden Ray Covington Supervisor of Elections & Voter Registration
Charlotte Sosebee
County Extension Coordinator
Jackie Dallas Transportation & Public Works Director
Stephen Bailey (Interim)
Principal Officials
FY22 Budget A-6

G -
FY22 Budget A-7
taylot
Rectangle

Co
mm
issi
on
ers
Ma
yor
and
Co
mm
issi
on
May
or's
Exe
cutiv
e A
ssis
tan
t
Cle
rk o
f C
omm
issi
on
Jean
Sp
ratli
n
Dep
uty
Cle
rk o
f C
omm
issi
on
Ch
ristin
e
Ho
wa
rd
Judd
Dra
ke
Ke
lly G
irtz
, Ma
yor
Ste
phan
ieM
add
ox
Va
cant
Va
cant
___
___
___
____
___
___
___
__ _
___
___
_K
elly
Gir
tz,
Ma
yor
D
ate
Att
orn
eyV
aca
nt A
ttor
ney
Va
cant
Ope
ratin
g S
erv
ices
and
Dep
artm
ents
(Se
e O
rga
niza
tiona
l Cha
rts)
Bla
ine
W
illia
ms
Rya
nH
ope
Leg
alA
ssis
tant
Ro
bin
Ga
iley
Pa
tric
k D
ave
np
ort (
Dis
tric
t 1)
Ma
riah
Pa
rke
r (D
istr
ict
2)M
elis
sa L
ink
(Dis
tric
t 3
)A
lliso
n W
righ
t (D
istr
ict
4)T
im D
en
son
(Dis
tric
t 5
)Je
sse
Hou
le (
Dis
tric
t 6
)R
uss
ell E
dw
ard
s (D
istr
ict
7)
Ca
rol M
yers
(D
istr
ict
8)
Ovi
ta T
hor
nton
(D
istr
ict
9)
Mik
e H
am
by (
Dis
tric
t 1
0)
Att
orn
ey*
Man
age
r*
Mun
icip
al C
our
tJu
dg
e
Se
e
Org
aniz
atio
nal
Cha
rt
Inte
rna
lA
ud
itor*
Man
age
me
nt
An
aly
stA
dm
inis
trat
ive
Ass
ista
nt
Ma
yor
and
Co
mm
issi
on
Chi
ef
Ass
ista
nt
Att
orn
ey
Sh
errie
H
ines
Inve
stig
ato
rS
ean
Pa
lmat
eer
De
bora
h A
rno
ld
*Ch
art
er
Offi
cers
FY22 Budget A-8
LAMBRC
Typewritten Text
4/16/2021

Ma
na
ger
's O
ffic
e
Ass
ista
nt
Ma
na
ger
Co
nstit
utio
nal
Offi
cers
Bui
ldin
g In
spe
ctio
n
Dir
ecto
rP
ublic
Util
itie
sD
irec
tor
Tra
nsp
orta
tion
&P
ublic
Wor
ksD
irec
tor
Tra
nsit
Dir
ecto
r
Ma
nag
er
Ass
ista
nt
Ma
na
ger
Hu
man
Re
sou
rce
sD
irec
tor
Sol
id W
ast
e D
irec
tor
Lei
sure
Ser
vice
s D
irec
tor
Co
rre
ctio
nsD
irec
tor
Fin
ance
Dir
ecto
r
Jud
icia
lO
ffice
rs
Airp
ort
Dir
ecto
r
Pol
ice
Ch
ief
Exe
cutiv
eA
ssis
tant
Cyn
thia
Lam
brig
ht
Ch
ief
Info
rmat
ion
Offi
cer
***
Sec
tion
s o
f M
an
age
rs O
ffic
e--
----
----
- A
ppo
inte
d b
y ot
he
rs
Sup
erv
iso
r o
fE
lect
ions
Ho
usin
g &
C
om
mu
nity
D
eve
lopm
en
t D
irec
tor
Pla
nni
ng
Dir
ecto
rP
ublic
Info
rma
tion
Offi
cer*
**
Fire
& E
me
rge
ncy
Ser
vice
sD
irec
tor
Eco
no
mic
De
velo
pme
nt
Dir
ecto
r
Ch
ief
Dat
a
Offi
cer*
**
Ma
yor
&
Co
mm
issi
on
___
___
__
___
___
___
___
__
__
___
___
__
Dat
eB
lain
e H
. Will
iam
sU
nifi
ed G
ove
rnm
ent o
f A
the
ns-C
lark
e C
oun
ty M
anag
er
Josh
Ed
wa
rds
Nik
i Jo
nes
Bla
ine
H. W
illia
ms
Sus
tain
abili
ty
Offi
cer*
**
Co
ope
rativ
eE
xte
nsio
n C
oor
d/A
ge
nt
Ce
ntra
l Se
rvic
esD
irec
tor
Incl
usi
on O
ffic
er**
*
Ch
ief
Tax
App
rais
er
Org
ani
zatio
nal
De
velo
pme
nt
Adm
inis
tra
tor*
**
Man
age
men
t A
na
lyst
Sa
rah
Ge
org
e
Ani
ma
l Se
rvic
es
Dir
ecto
r
Ca
pita
l Pro
ject
sD
irec
tor*
**
FY22 Budget A-9
LAMBRC
Typewritten Text
4/16/2021

Overall Budget
This Budget includes a General Fund Budget of $148.5 million for FY22, $8.0 million more than the FY21 Budget. The Operating Budget for All Funds totals $228.8 million. The Capital Budget for all funds is $45.8 million. In total, the Operating and Capital Budget for FY22, $274.2 million, is $7.6 million more than the FY21 Original Budget.
Millage Rate The millage rate for FY22 (property tax year 2021) is 13.7 mills, the same rate as FY21. Property Tax information for FY22 is included on page B‐5 of this section.
Use of Fund Balance The FY22 Budget for the General Fund includes the use of $5.6 million of Fund Balance‐ $2.443 million for operations and $3.139 million for capital.
Department Requests
ACCGov Departments requested $9.3 million in FY22 ($9.0 million in the General Fund) for operating expenditures for new initiatives, new programming, additional positions and SPLOST/TSPLOST operating budget impacts. This budget includes roughly $4.6 million for these additional expenses ($2.1 in the General Fund). See pages B‐12 to 14 for information on these increases to departmental budgets.
Additional Positions
The FY22 Budget includes 15 new fulltime authorized positions across all funds (6 in the General Fund), bringing the authorized level of positions to 1,744. See page B‐14 in this section for a list of additional positions.
Pay Adjustment
- The Budget includes $1.9 million for the FY22 portion of a revised pay plan for public safety employees, which was implemented in FY21.
- The Budget also includes $750,000 to increase the minimum hourly pay rate for both fulltime and part‐time/seasonal positions to $15 per hour.
- Across all funds, the Budget includes approximately $1.1 million ($627,000 in the General Fund) for the Performance Management Program (PMP) to encourage retention and reward active general employees who meet the highest levels of performance. The $1.1 million total is equivalent to 2% of pay and related benefits and will be added to departmental budgets based on their proportional share of total salaries. Individual pay increases for general employees will depend on performance.
Executive Summary
FY22 Budget B-1

The Management Team will work with employees and the Mayor and Commission to define priorities and strategies through a two year organization‐wide strategic plan spanning fiscal years 2022 and 2023. Staff will look at existing public input and bring to light known organizational strengths, weaknesses, opportunities and threats.
This work will help to better identify and maintain what is working well, and focus effort on areas in need of improvement. This plan will fit in with the long term strategies identified and set out in other documents, including the Comprehensive Plan.
A yearlong dialog among more than 700 ACCGov employees has yielded a set of Core Values, and a third‐party polling organization will soon have the results of an impartial, statistically robust community survey that will be helpful in examining alignment with resident needs over time.
These tools, along with renewed examination of mission and vision statements, will serve as guides for developing the projects and doing the work necessary to reach stated goals. In tandem with departmental strategic plans, the organizational plan will build on successes while mitigating threats. Periodic communication about progress toward measures of performance will be delivered to the community, and used in deciding how to efficiently allocate resources.
FY22 Budget B-2
FY22 Budget Summary
New for FY22 - Strategic Plan:

FY21 FY22
Approved Approved
Budget Budget $▲ %▲Revenues:
Property Taxes 68,175,350 73,488,850 5,313,500 7.8%
Sales Tax 24,650,000 25,900,000 1,250,000 5.1%
Other Taxes 21,960,500 22,955,000 994,500 4.5%
Licenses & Permits 961,310 865,880 (95,430) ‐9.9%
Intergovernmental Revenues 1,380,403 1,204,790 (175,613) ‐12.7%
Charges for Services 13,788,970 11,992,685 (1,796,285) ‐13.0%
Fines & Forfeitures 3,586,382 1,896,943 (1,689,439) ‐47.1%
Other Revenues 670,725 716,325 45,600 6.8%
Other Financing Sources 3,993,283 3,850,175 (143,108) ‐3.6%
Total Revenues $139,166,923 $142,870,648 $3,703,725 2.7%
Prior Year Fund Balance 1,313,629 2,443,136 1,129,507 86.0%
Prior Year Fund Balance ‐ Capital 0 3,139,000 3,139,000 ‐‐
Total Revenues & Other Sources $140,480,552 $148,452,784 $7,972,232 5.7%
Expenditures:
General Government 29,508,105 31,802,047 2,293,942 7.8%
Judicial 11,163,075 11,442,605 279,530 2.5%
Public Safety 59,926,499 61,629,362 1,702,863 2.8%
Public Works 15,680,291 16,436,332 756,041 4.8%
Cultural And Recreation 8,535,108 8,499,761 (35,347) ‐0.4%
Housing And Development 4,440,583 3,662,355 (778,228) ‐17.5%
Independent Agencies 5,826,343 5,936,922 110,579 1.9%
Debt Service 1,312,446 1,315,141 2,695 0.2%
Total Operating Expenditures $136,392,450 $140,724,525 $4,332,075 3.2%
Other Financing Uses ‐ Oper. 1,576,102 2,077,259 501,157 31.8%
Total Operating Expenditures $137,968,552 $142,801,784 $4,833,232 3.5%
& Other Financing Uses
Other Financing Uses ‐ Capital 2,512,000 5,651,000 3,139,000 125.0%
Total Operating & Capital $140,480,552 $148,452,784 $7,972,232 5.7%
Expenditures
Summary FY22 Annual Operating and Capital Budget
Commission Approved
General Fund Summary
FY22 Budget B-3

FY22 FY22 FY22
Operating Capital Approved
Budget Budget Budget
Revenues:
Property Taxes 71,470,850 2,512,000 73,982,850
Sales Tax 25,900,000 25,900,000
Other Taxes 25,525,000 30,000 25,555,000
Licenses & Permits 2,503,082 2,503,082
Intergovernmental Revenues 8,664,295 8,664,295
Charges for Services 103,805,913 10,828,525 114,634,438
Fines & Forfeitures 2,156,693 2,156,693
Other Revenues 1,908,157 1,908,157
Other Financing Sources 9,136,709 5,651,000 14,787,709
Total Revenues $251,070,699 $19,021,525 $270,092,224
Prior Year Fund Balance 5,365,751 3,139,000 8,504,751
Use of Unrestricted Net Position 4,535,546 29,324,475 33,860,021
Total Revenues & Other Sources $260,971,996 $51,485,000 $312,456,996
Less Interfund Transfers & Charges (32,214,965) (5,651,000) (37,865,965)
Total Revenues $228,757,031 $45,834,000 $274,591,031
Expenditures:
General Government 75,454,523 821,600 76,276,123
Judicial 12,944,364 12,944,364
Public Safety 65,472,967 1,116,144 66,589,111
Public Works 60,392,159 43,346,256 103,738,415
Cultural And Recreation 9,184,761 550,000 9,734,761
Housing And Development 9,160,024 9,160,024
Independent Agencies 8,191,382 8,191,382
Debt Service 13,852,226 13,852,226
Total Operating Expenditures $254,652,406 $45,834,000 $300,486,406
Other Financing Uses 5,959,370 5,651,000 11,610,370
Total Expenditures & Other Financing Uses $260,611,776 $51,485,000 $312,096,776
Less Interfund Transfers & Charges (32,214,965) (5,651,000) (37,865,965)
Total Expenditures $228,396,811 $45,834,000 $274,230,811
Designated for Future Capital Improvements 360,220 360,220
& Debt Service Requirements
Total Expenditures & Designations $228,757,031 $45,834,000 $274,591,031
Summary FY22 Annual Operating and Capital Budget
Commission Approved
All Funds Summary
FY22 Budget B-4

Total General Fund Operating Revenue is projected to be $142.9 million in FY22, approximately $3.7
million or 2.7% more than the FY21 Budget.
Property Taxes
Total General Fund Property Taxes are projected to be $73.5 million, approximately $5.3 million more than
originally estimated for FY21. The budget estimate for property taxes is based on the current millage rate of
13.70 mills, which continues the 0.25 reduction approved in FY21. Based on current estimates from the Board
of Tax Assessors and the Tax Commissioner, the 2021 net Tax Digest is $5.1 billion, a net increase
approximately 8.1% over the 2020 Tax Digest. Property tax revenues include real and personal property, motor
vehicle taxes (prior to March 2013), Title Ad Valorem Taxes or TAVT (motor vehicle after March 2013), real
estate transfer and intangible recording taxes.
Based on current local share percentages, ACCGov’s TAVT and Motor Vehicle Taxes are estimated to be
$5.0 million in FY22, an increase of $700,000 from the FY21 Budget. The TAVT estimate for FY22 is based
on the current 6.6% tax rate and state set allocation percentages.
Real estate Transfer and Intangible Recording Taxes are estimated to generate $1.0 million, the same as
FY21 Budget.
In FY22, Property Tax Revenue is projected to be 51% of the General Fund Operating Revenue. The following
graph shows that property taxes as a percentage of General Fund Revenues have ranged from 45% to 51%
since FY13. The FY22 Budget continues the careful balance of General Fund Revenues from Property Taxes
(51%), Sales Taxes (18%), and other General Fund sources (31%). However, as other revenues such as Fines &
Forfeitures and Charges for Services decline, the dependence on Property Tax Revenue grows.
$0.0
$10.0
$20.0
$30.0
$40.0
$50.0
$60.0
$70.0
$80.0
Property Taxes Sales Tax Other Taxes All Others
General Fund Major Revenues (Budgeted)with 5 Year Average Annual Change
FY17 FY18 FY19 FY20 FY21 FY22
Millions
10.1%
3.2% 0.9% -1.8%
General Fund Revenues
FY22 Revenues
FY22 Budget B-5

Athens‐Clarke County, Georgia
Property Tax Rates
(Per $1,000 of Assessed Value)
Last Ten Years (2012‐2021)
Note: In 1978, the City and County implemented a rollback of property taxes based on the receipt of local
option sales tax revenues as required by Georgia Law.
45% 46% 45% 45% 45% 46% 46%49% 49%
51%
0%
10%
20%
30%
40%
50%
60%
Property Taxes as % of the General Fund(FY13‐FY22)
State General Sales Tax General Total
Calendar of Debt Gross Reduction Net Debt Tax
Year Georgia General Service Total Rate (1) Rate Service Total Rates
2012 0.20 20.00 ‐‐‐ 20.00 19.56 ‐5.86 13.70 ‐‐‐ 13.70 33.90
2013 0.15 20.00 ‐‐‐ 20.00 20.08 ‐6.13 13.95 ‐‐‐ 13.95 34.10
2014 0.10 20.00 ‐‐‐ 20.00 19.94 ‐5.99 13.95 ‐‐‐ 13.95 34.05
2015 0.05 20.00 ‐‐‐ 20.00 20.13 ‐6.18 13.95 ‐‐‐ 13.95 34.00
2016 0.00 20.00 ‐‐‐ 20.00 20.07 ‐6.12 13.95 ‐‐‐ 13.95 33.95
2017 0.00 20.00 ‐‐‐ 20.00 19.70 ‐5.75 13.95 ‐‐‐ 13.95 33.95
2018 0.00 20.00 ‐‐‐ 20.00 19.69 ‐5.74 13.95 ‐‐‐ 13.95 33.95
2019 0.00 20.00 ‐‐‐ 20.00 19.41 ‐5.46 13.95 ‐‐‐ 13.95 33.95
2020 0.00 20.00 ‐‐‐ 20.00 19.113 ‐5.413 13.70 ‐‐‐ 13.70 33.700
2021 0.00 20.00 ‐‐‐ 20.00 18.762 ‐5.062 13.70 ‐‐‐ 13.70 33.700
Athens‐Clarke County
County School District
FY22 Revenues
FY22 Budget B-6

Local Option Sales Taxes (LOST) An estimate of $25.9 million is included for FY22, a $1,250,000 (5%) increase over the FY21 Original Budget.
LOST revenues have averaged a 2.8% annual increase over the five fiscal years ending June 30, 2020.
Other Taxes
Other Taxes are projected to be $23.0 million in FY22, $994,500 higher compared to the FY21 Budget. This
estimate reflects current trends in revenues for franchise fees, business taxes, and alcohol and rental car
excise taxes.
Franchise Fees on electricity, gas, telephone and cable services are estimated to be $8.0 million in FY22
based on current trends and rates, an increase of $366,000 from the current budget.
The Insurance Premium Tax is the largest Other Tax and is estimated to generate $9.5 million based on
current trends, a $756,000 increase over the FY21 Budget. This tax is based on the value of insurance sold
in the county, and is collected by the state and remitted annually to ACCGov each October.
Excise tax revenues are estimated at $2.9 million in FY22, $102,500 lower than last year. Excise taxes on
beer, wine, and liquor are estimated to generate $2.2 million, the same as FY21. The excise tax on mixed
drinks and rental motor vehicles are anticipated to generate $575,000 and $175,000 respectively in FY22.
Based on current trends, revenues from annual Occupation Tax Certificates or Business Licenses are
estimated to be $1.7 million in FY22, about the same as what was budgeted for in FY21.
Delinquent Tax Collections are estimated to be $345,000, the same level as FY21.
Licenses and Permits
Revenue from alcohol license fees are anticipated to decline slightly in FY22 by approximately $95,000 to a
total of 845,900 compared to the FY21 Budget.
$0
$5
$10
$15
$20
$25
$30
Millions
Local Option Sales Tax (LOST) Collection History
FY22 Revenues
FY22 Budget B-7

Charges for Services
This budget includes an estimate of $12.0 million in FY22 for Charges for Services, $1.8 million less than FY21.
Downtown parking fee revenues, as managed by the Athens Downtown Development Authority (ADDA),
are anticipated to generate $2.8 million in FY22 (this amount does not include an estimated $500,000 from
parking fine revenue in the downtown area) a decrease of $750,000 compared to the pre‐pandemic
revenue estimate. The ADDA managed parking program includes the revenue from the operations of the
Washington Street Building, the College Avenue Parking Deck, on‐street metered parking spaces, and
parking lots (note: 20% of the net revenue goes back to ADDA per contract).
Based on the current cost allocation plan, total administrative overhead charges for services provided by
the General Fund to other funds will be $3.0 million, approximately $300,000 more than FY21. The cost
allocation study was updated in FY21 resulting in additional charges to the enterprise funds and for the
Building Inspection Fund.
Revenue from collection of taxes on behalf of other governmental entities by the Tax Commissioner’s
Office is estimated to be $2.4 million in FY22.
Leisure Services is estimated to generate $750,000 million in FY22 and includes fees in accordance with the
Pricing Policy approved by the Mayor and Commission in December 2018. This represents a decrease of
$433,000 from the FY21 Budget due to reduced activity caused by the pandemic.
The FY22 Budget for Probation fees is $150,000. In addition, the Budget includes $100,000 in revenue from
the in‐house drug‐testing program and $60,000 in supervision fees for the pre‐trial programs in State and
Municipal Courts, the same as FY21. These fees total $310,000 for FY22, a decrease of $431,500 (58%)
from the FY21 Budget, and based on current trends.
Fees and recording costs in FY22 for Superior Court ($530,000) and Probate Court ($150,000) are similar to
FY21 based on current revenue trends, while fees for Magistrate Court ($250,000) are projected to decline
$60,000 from FY21.
Fines & Forfeitures
Based on revenue trends over the last twelve months, total revenues from fines are estimated to be $1.9
million in FY22, a decrease of $1.7 million from the FY21 Budget.
Revenue from the Municipal Court fines is projected to generate roughly $800,000 in FY22, a decrease of
$1.0 million from the FY21 Budget. Fine revenues from the Superior, State, Magistrate, and Juvenile Courts
are anticipated to generate $303,000 in total, down almost $50,000 from the FY21 Budget.
Based on current trends, ADDA collected parking fines in the downtown area are estimated to be $500,000
in FY22, $450,000 less than originally budgeted for in FY21.
In FY21, the Red Light Camera Program moved from the Special Programs Fund to the General Fund. Fine
revenues from this program are projected at $175,000, a decrease of $155,000 from the FY21 Budget.
FY22 Revenues
FY22 Budget B-8

Other Financing Sources
The budget includes $20,000 collected by the Sheriff’s Department for reporting information to the Social
Security Administration during the year. The FY22 Budget also includes an operating transfer of $90,340 from
the Hotel/Motel Tax Fund, $70,200 less than FY21.
Also, the FY22 Budget reflects transfers of $3.7 million (similar to FY21) from Enterprise and Internal Service
Funds to fund the annual cost for pension and other post‐retirement benefits (OPEB) expenses for employees
in those funds. This transfer in does not increase the net cost or benefit to the General Fund, it only shifts
where these expense and liabilities are recorded.
Use of Fund Balance
The FY22 Budget plans the use of $5.6M in Fund Balance, $4.3M more than the $1.3M in the FY21 Budget.
Based on the current financial and economic conditions, the General Fund Balance is not expected to drop
below the two month operating reserve amount (16.7% or $24.7M) by the end of FY22.
Transit Fund
Total revenue of $4.0 million is projected for FY22. Currently, Federal funding is estimated to be almost $3.9
million in FY22, based on the current grant contract and funding from the CARES Act.
Similar to FY21, there will be no General Fund contribution to the Transit Fund. Additional funding to support
Transit remaining fare‐free for FY22 with services expanding to the pre‐pandemic complement of routes is
expected to come with funds from the American Rescue Plan.
Water and Sewer Fund
Water and Sewer Fund revenues for FY22 are projected to be $57.0 million, an increase of $3.4 million from
the FY21 Budget. For FY22, Water and Sewer rates will remain unchanged, with only a few minimal fee
changes for industrial and construction fees.
Hotel‐Motel Special Revenue Fund
Receipts from this $0.07 tax are estimated to be $2.6 million in FY22, a $773,000 or 22.9% decrease from the
FY21 Original Budget based on recent trends and due to a decreased hotel motel activity caused by the
pandemic.
Building Inspection Special Revenue Fund
The FY22 Budget estimates $1.5 million of revenue, a $226,800 increase over FY21. The FY22 budget proposes
fee increases to cover software and technology costs. These fee increases to customers should be offset by
savings in printing costs and other efficiencies resulting from the new software implementation. The FY22
budget also includes an increase of 5% to the building valuation table.
Enterprise Funds Major Revenue Changes
Special Revenue Funds Major Revenue Changes
FY22 Revenues
FY22 Budget B-9

Tax Allocation Districts
New in the FY22 Budget are individual special revenue funds to account for revenues and expenditures for the
six Tax Allocation Districts (TADs) approved by the Mayor and Commission on November 10, 2020. Across all
six funds, a total of approximately $500,000 in property tax revenue growth will now be available to fund
approved redevelopment activities.
American Rescue Plan Special Revenue Fund
The FY22 Budget includes an initial expenditure budget of $2.2 million to account for the American Rescue Plan
Act, State and Local Fiscal Recovery Funds proceeds. This includes anticipated expenditures of the ARP
“revenue replacement” funds, as well as any designated projects/programs anticipated to fall into one of the
other ARP eligible expenditure categories. Actual expenditures in the ARP special revenue fund are pending
release of final Treasury guidance and confirmation of grant eligibility.
The balance of the $57.6M in ARP funds awarded ACCGov will be budgeted for specific purposes in the coming
months following Mayor and Commission review and approval of eligible grant program expenditures.
Internal Service Funds support operating departments. These services are copier, postage, printing, fleet
maintenance, fleet replacement, and self‐funded insurance programs. Revenues for Internal Service Funds are
generated by allocating costs to operating departments for such services. The funding for these allocated costs
is included in the departments’ operating budget as indirect expenses. Revenues generated for each Internal
Service Fund are designed to offset annual operating expenses rather than to accrue income.
Internal Service Funds Major Revenue Changes
FY22 Revenues
FY22 Budget B-10

Each year, Departments and Offices are asked to develop budgets to deliver current services within a budget limit. For FY22, they were limited to a budget equal to the FY21 Budget (not including salary and benefits). Twenty departments submitted budget requests over their limits totaling roughly $3.5 million with the remaining departments submitting requests at or below the limit. This Budget includes the following increases in the General Fund totaling $470,400:
Department Budget Item Amount
Information Technology Microsoft Licensing Increases 60,000
ERP Replacement Maintenance Increase 93,500
Subtotal $153,500
Police Fully Fund FY21 Mental Health Co‐Responders $67,700
Animal Services Kennel Technicians – Contract Labor 25,000
Additional Medical Services 17,600
Subtotal $42,600
Attorney Additional Legal Expenses $40,000
Manager’s Office Performance Management Software Fees ‐ GIO $32,100
Juvenile Court Increased Days for Part‐Time Judge $30,000
Superior Court Electronic Monitoring – Probation $26,000
Fire SCBA Annual Testing $23,000
Leisure Services Full Funding for PT Outreach Position 10,000
UGA Veterinarian Contract Costs 4,000
Subtotal $14,000
Solid Waste Additional Neighborhood Cleanup Funds 7,000
CBD Leaf Blower Alternatives 4,000
Subtotal $11,000
Central Services E. Athens N’hood Health Center Bldg. Maint. $9,800
Other Departments and Offices $20,700
Fleet Replacement $1.4 million has been added to the General Fund to fund the vehicle replacement program. This includes $643,000 to restore funding for non‐public safety vehicle replacement, which was eliminated in FY21. It also includes $770,000 to begin funding a portion of the vehicle replacement contributions for public safety vehicles. This funding was eliminated in FY20 and FY21, shifting replacement costs entirely to the SPLOST 2020 program. All other funds have been increased by a total of $98,500 to implement the fifth year of a five year plan to increase annual contribution to the Fleet Replacement Fund to gradually bring the annual amount to full funding. In FY05 and again in FY11, approved budgets included reductions or discounts in contributions to the Fleet Replacement Program totaling 35%. These past discounted contributions, as well as elimination of funding in FY20 and FY21, resulted in a shortfall in funding and a backlog of replacements.
Maintaining Current Services
FY22 Expenses
FY22 Budget B-11

Increases for New Initiatives and Additional Positions ACCGov departments requested a total of $5.3 million in FY22 for new initiatives and additional positions ($5.0 million in the General Fund). The FY22 Budget includes $1.7 million in the General Fund and $2.1 million across all funds (listed below) of the total request. For more information on individual new initiatives, see the appropriate department page in Section C.
Department New Initiative/Additional Position Amount
General Fund
Board of Elections Warranty Costs for New Equipment $64,100
Election Assistant $60,000
Poll Worker Pay Increase $13,000
Subtotal $137,100
Coroner’s Office Increase Coroner Pay $16,100
Corrections Part‐Time Social Worker $30,000
District Attorney Additional ADA/External Relations Position (6 months) $33,000
Additional Administrative Assistant Position $30,000
Subtotal $63,000
Economic Development Joint Development Authority (split funded w/ARP) $11,900
Fire Career Pathway Program $80,000
Housing & Community Dev. Young Urban Builders $100,000
Human Resources Health Clinic Feasibility Study 40,000
Compensation & Payroll Consulting Services 33,000
Pension Ordinance and Offerings Review 30,000
Additional Position: HR Senior Generalist (net cost) (3,000)
Subtotal $100,000
Leisure Services Youth Commission Costs $6,000
Manager’s Office Public Engagement Coordinator – PIO 90,300
Energy Program Coordinator – Sustainability (6 mos.) 53,500
DEI Training Program – Inclusion 134,900
GARE Membership ‐ Inclusion 5,000
Subtotal $283,700
Other Gen Admin/Transfer Disparity Study $400,000
Police Additional Mental Health Co‐Responder Teams (four) 335,600
State Court General Fund Support for DUI/Drug Court $50,000
Subtotal – General Fund $1,613,400
Affordable Housing Fund
Housing & Community Dev. Inclusionary Zoning Monitor $120,000
Other General Admin Study to Analyze Building & Zoning Codes $30,000
Subtotal – Affordable Housing Fund $150,000
E‐911 Fund
Police Central Communications (E911) Training $25,000
Hotel/Motel Fund
Central Services Gateway & Corridors Grounds Workers $100,000
New Initiatives, Additional Positions, SPLOST Impacts and Other Major Changes
FY22 Expenses
FY22 Budget B-12

Water & Sewer Fund
Public Utilities Additional Maintenance Mechanic Position 49,400
Additional Facilities Locator Position 35,500
Water Treatment Plant Interns 29,000
Water Resources Lab Tech Intern 14,500
Subtotal – Water & Sewer Fund $128,400
Landfill Fund
Solid Waste Commercial Compost Operator $49,300
Tax Allocation District Funds
Economic Development TAD Specialist 65,000
Facilitate TAD District Advisory Committees 25,000
Update Redevelopment Plans 15,000
Subtotal – Tax Allocation Funds $105,000
Transit Fund
Transit Additional Administrative Asst. (convert 2PT to 1FT) (2,700)
Additional Route Supervisor (convert 2PT to 1FT) (7,000)
Subtotal – Transit Fund ($9,700)
In addition, the Commission has identified the initiatives listed below to be funded from the ARP Fund. Since final Treasury guidance had not yet been issued at the time of budget adoption, the Mayor and Commission authorized the Manager to identify and reduce General Fund budgets equal to the approved revenue replacement amount and transfer eligible General Fund expenditures to the ARP Special Revenue Fund in FY22.
Department New Initiative Amount
American Rescue Act Fund
Revenue Replacement
Economic Development Continuation of Athens Community Corps (partial yr) $250,000
Joint Development Authority (split w/General Fund) $38,100
Subtotal $288,100
HCD Neighborhood Leaders Program $750,000
Leisure Services Youth Development Programming $100,000
Other General Admin Alternative Crisis Response Team (9 months) $276,800
Homeless Resident Support $220,000
Subtotal $496,800
Solid Waste Illegal Dumping Camera System $36,000
Subtotal – Revenue Replacement $1,670,900
Designated Programs
Leisure Services Additional Youth Development Programming $400,000
Municipal Garden Program $150,000
Subtotal – Designated Programs $550,000
Total American Rescue Act Fund $2,220,900
FY22 Expenses
FY22 Budget B-13

SPLOST Impacts The FY22 Budget includes funding of $37,750 in Central Services for additional operating support for SPLOST projects. This includes $33,000 for building maintenance for the Downtown public restroom building and additional building maintenance for Ben Burton and Dudley Parks.
Summary of FY22 Fulltime Authorized Position Changes Commission Approved
GENERAL FUND
Number Fulltime Position Type
Board of Elections 1 Elections Assistant New Initiative
District Attorney 1 ADA/External Relations (6 months) New Initiative
District Attorney 1 Administrative Assistant New Initiative
Human Resources 1 Senior Human Resources Generalist New Initiative
Manager's Office ‐ Public Info 1 Community Engagement Specialist New Initiative
Manager's Office ‐ Sustainability 1 Energy Program Coordinantor (6 mos.) New Initiative
Total General Fund 6
OTHER FUNDS
Number Fulltime Position Type
Hotel/Motel Fund
Central Services 2 Grounds Worker I New Initiative
Tax Allocation District Funds
Economic Development 1 Tax Allocation Distric Specialist New Initiative
CDBG CARES Grant
Housing & Community Development 1 Homeless Specialist New Initiative
Water & Sewer Fund
Public Utilities 1 Plant Maintenance Mechanic New Initiative
Public Utilities 1 Facilities Locator New Initiative
Landfill Fund
Solid Waste 1 Comost Equipment Operator New Initiative
Transit Fund
Transit 1 Administrative Assistant II New Initiative
Transit 1 Route Supervisor New Initiative
Total Other Funds 9
Total Additional Fulltime Positions 15
Department
Department
FY22 Expenses
FY22 Budget B-14

Authorized Positions FY17 to FY22 (Approved)
FY 2017 FY 2018 FY 2019 FY 2020 FY 2021 FY 2022 Change
Department Authorizations Authorizations Authorizations Authorizations Authorizations Approved FY21 to FY22
Legislative Group
Attorney 6 6 6 6 6 6 0
Mayor and Commission 1 1 1 1 1 1 0
Clerk of Commission 2 2 2 2 2 2 0
Office of Operational Analysis 3 3 3 3 3 3 0
Total Legislative Group 12 12 12 12 12 12 0
Elected & Constitutional Group
Courts
Superior Court 33 34 34 35 38 38 0
State Court 7 7 7 7 7 7 0
Magistrate Court 11 11 11 11 11 11 0
Municipal Court 10 10 10 10 10 10 0
Probate Court 6 6 6 6 6 6 0
Juvenile Court 4 5 5 5 5 5 0
Courts Subtotal 71 73 73 74 77 77 0
Elected Officials
District Attorney 26 28 28 28 28 30 2
Solicitor General 17 18 18 18 18 18 0
Clerk of Superior Court 19 21 21 21 22 22 0
Tax Commissioner 19 19 19 19 19 19 0
Sheriff 194 194 194 194 194 194 0
Elected Officials Subtotal 275 280 280 280 281 283 2
Total Elected & Constitutional Group 346 353 353 354 358 360 2
Manager Group
Airport 7 7 7 7 7 7 0
Animal Services - - - 12 13 13 0
Building Inspections & Permits 23 23 24 24 24 24 0
Central Services 102 102 103 94 96 98 2
Corrections 43 43 43 45 48 48 0
Economic Development 4 4 4 5 5 6 1
Finance 28 28 28 28 29 29 0
Fire & Emergency Services 186 187 187 187 187 187 0
Housing & Community Development 8 8 8 11 11 12 1
Human Resources 21 21 21 21 22 23 1
Information Technology 19 23 23 23 23 23 0
Leisure Services 73 73 73 73 74 74 0
Manager 5 5 5 5 7 7 0
Emergency Management 1 0 0 0 0 0 0
Office of Inclusion 0 0 0 1 2 2 0
Organizational Development 3 3 3 3 3 3 0
Public Information 3 3 3 3 3 4 1
Office of Sustainability 0 2 2 2 2 3 1
Geographic Information Office 0 2 2 2 3 3 0
SPLOST 3 3 3 3 3 3 0
Planning 21 19 18 18 18 18 0
Police 309 318 319 320 331 331 0
Public Utilities 195 194 194 198 198 200 2
Solid Waste 61 61 62 62 63 64 1
Transit 66 68 71 77 79 81 2
Transportation & Public Works 81 87 88 89 90 90 0
Subtotal 1262 1284 1291 1313 1341 1353 12
Board of Elections 3 3 3 4 4 5 1
Cooperative Extension 1 1 1 1 1 1 0
Tax Assessor 13 13 13 13 13 13 0
Subtotal 17 17 17 18 18 19 1
Total Manager Group 1279 1301 1308 1331 1359 1372 13
Grand Total 1637 1666 1673 1697 1729 1744 15
FY22 Expenses
FY22 Budget B-15

For FY22, the number of fulltime employees compared to the Athens‐Clarke County population (per thousand) will remain below 14 as shown in the graph below. This is based on 1,744 fulltime authorized positions, an increase of twelve positions compared to the current level.
Changes to Employee Compensation Across all funds, the Budget includes approximately $1.1 million ($627,000 in the General Fund) for the Performance Management Program (PMP) to encourage retention and reward active employees who meet the highest levels of performance. The $1.1 million total is equivalent to 2% of pay and related benefits and will be added to departmental budgets based on their proportional share of total salaries. Individual pay increases for employees will depend on performance. The FY22 General Fund budget includes $1.9 million for the FY22 portion of a revised pay plan for public safety employees, which was implemented in FY21. The General Fund also includes $750,000 to increase the minimum hourly pay rate for both fulltime and part‐time/seasonal positions to $15 per hour. Beginning in FY20, departmental budgets for full‐time positions in the General Fund have factored in estimated vacancy savings. For FY22, this vacancy savings reduces compensation budgets in the General Fund by $3.0 million. Employee Health In FY22, funding to the Employee Health Insurance Fund for active employees allows continuation of the three existing health plans (Conventional POS, Consumer Healthy Solutions (CHS) Select with HSA and CHS Value with HSA). The FY22 Budget for the Employee Health Insurance Fund is estimated to be $17.7 million, up from the FY21 budget of $16.4 million, based on current trends for claims expenses. Across all funds, the Employer contribution is estimated at $12.6 million ($8.9 million in the General Fund) and the Employee contribution estimated at $5.1 million.
13.1 13.1 13.4 13.1 13.0 13.2 13.2 13.3 13.2 13.2
0
2
4
6
8
10
12
14
16
FY13 FY14 FY15 FY16 FY17 FY18 FY19 FY20 FY21 FY22
ACCGov Fulltime Employees Per 1,000 Residents(FY13‐FY22)
Compensation and Benefits for FY22
FY22 Expenses
FY22 Budget B-16

Retiree Health In order to maintain current benefits, funding for Retiree Health Insurance and life insurance (Other Post‐Employment Benefits – OPEB), will remain at the FY21 total of $6.6 million per year. This estimate is based on the number of retirees compared to previous years, current trends in claims expenses, and the monthly HRA contribution for some retirees 65 and older. For FY22, retirees hired prior to 7/1/2002 will receive $2,961.12/year and retirees hired 7/1/2002 or later will receive$2,376.00/year. The FY22 funding level will pay for Pre‐65 retiree health claims, administration expenses, HRA contributions, and special protection payments for eligible prescription costs.
Pension Program Based on actuarial estimates and current benefits, ACCGov’s total annual required contribution to the Pension Trust Fund for FY22 is estimated to be $11.5 million. This contribution will come from $10.8 million ($7.9 million net from the General Fund) in current contributions, the same as FY21, and $700,000 from accumulated credits in the Pension program.
FY22 Expenses
FY22 Budget B-17

AN ORDINANCE TO PROVIDE FOR THE RAISING OF REVENUES AND THE APPROPRIATION OF FUNDS FOR ATHENS‐CLARKE COUNTY, GEORGIA, FOR THE FISCAL YEAR 2022 BEGINNING JULY 1, 2021 AND ENDING JUNE 30, 2022 TO PROVIDE FOR THE OPERATIONS OF GOVERNMENT DEPARTMENTS, BOARDS, AGENCIES, ELECTED OFFICES, AND OTHER GOVERNMENTAL ACTIVITIES; TO PROVIDE FOR THE LEVEL OF PERSONNEL AUTHORIZED FOR THE VARIOUS DEPARTMENTS AND AGENCIES; TO PROVIDE FOR A CAPITAL BUDGET; TO ESTABLISH 2021 PROPERTY TAX RATES; TO ESTABLISH COMPENSATION FOR THE CHARTER OFFICERS; TO ESTABLISH RATES AND STRUCTURE OF FISCAL YEAR 2022 HEALTH INSURANCE PROGRAMS; TO ESTABLISH FEES AND CHARGES; TO REPEAL CONFLICTING ORDINANCES; TO PROVIDE EFFECTIVE DATES; AND FOR OTHER PURPOSES. THE COMMISSION OF ATHENS‐CLARKE COUNTY, GEORGIA, HEREBY ORDAINS AS FOLLOWS:
SECTION 1. Pursuant to Section 7‐405 of the Charter, the sums of money as summarized in Exhibit A attached hereto and made a part of this Ordinance, shall be and are hereby adopted as the Operating Budget and the Capital Budget for Athens‐Clarke County for Fiscal Year 2022 (FY22), beginning July 1, 2021 and ending June 30, 2022.
SECTION 2. The appropriation of funds for all departments and agencies shall be as provided for in Exhibit A and supporting schedules.
SECTION 3. Each of the Enterprise and Internal Service Funds shall be operated in accordance with Proprietary Fund accounting standards and procedures and shall not be governed by the Governmental Fund budgetary accounting principles; however, the budgetary estimates upon which such budgets are adopted shall be retained in memorandum form for budget control purposes and utilized in the preparation of comparative operating statements.
SECTION 4. The personnel levels provided for in the Personnel Authorization Schedule for all departments and agencies, as provided in the budget document entitled "FY2022 Annual Operating and Capital Budget: The Unified Government of Athens‐Clarke County July 1, 2021–June 30, 2022" are hereby adopted as the maximum employment levels for such departments and agencies and shall not be increased without the approval of the Mayor and Commission.
SECTION 5. All financial operations shall be accounted for in accordance with Generally Accepted Accounting Principles and Standards.
SECTION 6. In accordance with the Official Code of Georgia Annotated Sections 33‐8‐8.1 and 33‐8‐8.2, the proceeds from the tax on insurance premiums, estimated to be $9,545,000 for FY22, shall be used for the provision of services to all residents of Athens‐Clarke County.
SECTION 7. In accordance with the Official Code of Georgia Annotated Section 46‐5‐133, 46‐5‐134,
and 46‐5‐134.2; the monthly "9‐1‐1 charge" of $1.50 per exchange access facility, the $1.50 per month “wireless enhanced 9‐1‐1 charge”, and the $1.50 per retail transaction for the “pre‐paid wireless charge” are reaffirmed for the period July 1, 2021 – June 30, 2022.
SECTION 8. The Manager is further authorized to transfer sums up to $15,000 from the General Fund Contingency to meet unbudgeted obligations of the Government. The Manager is required to notify the Mayor and Commission of each of these transfers from Contingency at the next scheduled regular meeting under the provisions of Section 7‐408 of the Charter of the Unified Government of Athens‐Clarke County, Georgia.
FY22 Budget Ordinance
FY22 Budget B-18

SECTION 9. The Manager is further authorized to transfer sums within each fund’s capital budget among projects and accounts up to $100,000 to meet project obligations of the government. The Manager is required to notify the Mayor and Commission of each of these transfers at the next scheduled regular meeting under the provisions of Section 7‐408 of the Charter of the Unified Government of Athens‐Clarke County, Georgia.
SECTION 10. The Manager is further authorized to approve the application for grants and accept
grants on behalf of the government up to $50,000 and to amend the Operating or Capital Budget for the grants as needed. This authority is permitted if the grant meets all of the following conditions: (1) matching funds are appropriated or the grant does not require matching funds; (2) the government will not be required to otherwise commit resources or maintain any services after the end of the grant period; (3) no positions will be added with the grant; and (4) no vehicles will be added to the government’s Fleet Replacement Program as a result of acceptance of the grant.
The Manager is required to notify the Mayor and Commission of approval or acceptance of each grant at the next scheduled regular meeting under the provisions of Section 7‐400 of the Charter of the Unified Government of Athens‐Clarke County, Georgia. The Manager and appropriate staff are authorized to execute all required documents associated with grants accepted under this provision.
SECTION 11. The budget document, entitled "FY2022 Annual Operating and Capital Budget: The Unified Government of Athens‐Clarke County July 1, 2021–June 30, 2022" shall be maintained on file in the Office of the Clerk of Commission.
SECTION 12. The ad valorem tax rate for Athens‐Clarke County is hereby levied for the year 2021 upon all real and personal property within the government not exempt from taxation under law as follows:
Maintenance and Operations (General Fund) 13.70 mills SECTION 13. Under authority of the Act creating the Downtown Athens Development Authority, 1977
Ga. Laws 3533‐3538, there is hereby levied and assessed for the year 2021 on the real property in the downtown Athens area (said downtown area most recently defined in House Bill No. 590, 2017 Ga. Laws 3900‐3903), a tax of one (1) mill upon the value of said real estate as fixed by the Tax Digest of Athens‐Clarke County.
SECTION 14. Pursuant to Sections 4‐101, 4‐103, and 4‐104 of the Charter of the Unified Government
of Athens‐Clarke County, the annual compensation of the charter officers, as provided for by ordinance and contract for FY22, shall be $187,887 plus a $6,000 car allowance for the Manager, shall be $155,257 plus a $4,800 car allowance for the Attorney and shall be $89,307 plus a $4,800 car allowance for the Internal Auditor.
SECTION 15. Pursuant to Official Code of Georgia Annotated Section 48‐13‐93(a)‐(2), the proceeds of the excise tax on the rental charge for motor vehicles, projected to be $175,000 during FY22, shall be used for promoting industry, trade, commerce, and tourism. The proceeds from this tax in FY22 shall be used to support the Athens‐Clarke County Economic Development Department, with an estimated budget of $1,127,000.
SECTION 16. Pursuant to Section 1‐9‐19 of the Code of Ordinances of the Unified Government of Athens‐Clarke County, the Benefits Summary of the Health Insurance and Health Benefits Program and the premiums or contributions for employees and retirees, as applicable, shall be as follows:
(a) Pursuant to Athens‐Clarke County Code Section 1‐9‐19(a), the government shall provide as an
FY22 Budget Ordinance
FY22 Budget B-19
option to employees the plans of health insurance coverage as described in the Summary Plan Document entitled “Consumer Healthy Solutions (CHS) Plan with a Health Savings Account (HSA) Medical Benefit Booklet for the Unified Government of Athens‐Clarke County,” effective January 1, 2021, and prepared by Anthem for the Unified Government of Athens‐Clarke County. This booklet is on file and available for public inspection in the office of the Clerk of Commission, Room 204, City Hall, 301 College Avenue, Athens, Georgia and on file and available for public inspection in the office of the Human Resources Department, 375 Satula Ave., Athens, Georgia. Any plan changes effective January 1, 2022 may result in new summary plan documents, which will be available for public inspection in the office of the Clerk of Commission in or around January, 2022. This Section 16 shall be subject to amendment by the Commission to incorporate any such plan changes prior to the effective date of such changes.
(b) During the first open enrollment period, employees have the option to select from among the following health insurance coverage: the option described in the preceding paragraph or the plans of health insurance coverage as described in the Summary Plan Document entitled “BlueChoice Option Point of Service Open Access dated January 1, 2021 –Conventional Plan Benefit Booklet for the Unified Government of Athens‐Clarke County,” Administered by Anthem, incorporated herein by reference. This booklet is on file and available for public inspection in the office of the Clerk of Commission, Room 204, City Hall, 301 College Avenue, Athens, Georgia and on file and available for public inspection in the office of the Human Resources Department, 375 Satula Ave., Athens, Georgia. Any plan changes effective January 1, 2022 may result in new summary plan documents, which will be available for public inspection in the office of the Clerk of Commission in or around January, 2022. This Section 16 shall be subject to amendment by the Commission to incorporate any such plan changes prior to the effective date of such changes.
(c) Pursuant to Athens‐Clarke County Code Section 1‐9‐19(b), the Designated Plan for retirees not yet 65 years of age and the Designated Dependent Plan for spouses of retirees not yet 65 years of age, and eligible dependent children, shall be that plan described as the BlueChoice Point of Service (POS) Open Access Plan of health insurance coverage as further described in the Summary Plan Document entitled “BlueChoice Option Point of Service Open Access dated January 1, 2021– Traditional Plan Benefit Booklet for the Unified Government of Athens‐Clarke County,” administered by Anthem, incorporated herein by reference. This booklet is on file and available for public inspection in the office of the Clerk of Commission, Room 204, City Hall, 301 College Avenue, Athens, Georgia and on file and available for public inspection in the office of the Human Resources Department, 375 Satula Ave., Athens, Georgia. The plan options for retirees and for retiree dependent coverage shall be any other health insurance coverage plans offered to employees in (a) and (b) above. Any plan changes effective January 1, 2022 may result in new summary plan documents, which will be available for public inspection in the office of the Clerk of Commission in or around January, 2022. This Section 16 shall be subject to amendment by the Commission to incorporate any such plan changes prior to the effective date of such changes.
(d) Those retirees not yet 65 years of age who are eligible for PPO shall be provided the plan of health insurance coverage as described in the Summary Plan Document entitled “Blue Choice PPO Benefit Booklet for the Unified Government of Athens‐Clarke County,” administered by BlueCross Blue Shield of Georgia, dated January 1, 2021 incorporated herein by reference. This booklet is on file and available for public inspection in the office of the Clerk of Commission, Room 204, City Hall, 301 College Avenue, Athens, Georgia and on file and available for public inspection in the office of the Human Resources Department, 375 Satula Ave., Athens, Georgia. Any plan changes effective January 1, 2022 may result in new summary plan documents, which will be available for public inspection in the office of the Clerk of Commission in or around January, 2022. This Section 16 shall be subject to amendment by the Commission to incorporate any such plan changes prior to the effective date of such changes.
(e) The premiums to be paid for the programs of health insurance for employees are set forth in
FY22 Budget Ordinance
FY22 Budget B-20

the document entitled "The Unified Government of Athens‐Clarke County 2021 Benefits Enrollment Guide: Enhancing Your Total Reward as a Valuable Resource for Our Community,” incorporated herein by reference and on file and available for public inspection in the office of the Clerk of Commission, Room 204, City Hall, 301 College Avenue, Athens, Georgia and on file and available for public inspection in the office of the Human Resources Department, 375 Satula Ave., Athens, Georgia. The premiums to be paid for plans effective January 1, 2022 will be set forth in the document entitled “The Unified Government of Athens‐Clarke County 2022 Benefits Enrollment Guide,” which will be made available for public inspection in the office of the Clerk of Commission in or around October, 2021. This Section 16 shall be subject to amendment by the Commission to incorporate any such changes in premiums.
(f) The premiums to be paid for the programs of health insurance for those retirees, under age 65, subject to such insurance as described in paragraphs (c) and (d) hereof are set forth in the document entitled "The Unified Government of Athens‐Clarke County Pre‐65 Retiree Rate Sheet – Effective January 1, 2021 – December 31, 2021,” incorporated herein by reference and on file and available for public inspection in the office of the Clerk of Commission, Room 204, City Hall, 301 College Avenue, Athens, Georgia and on file and available for public inspection in the office of the Human Resources Department, 375 Satula Ave., Athens, Georgia. The premiums to be paid for plans effective January 1, 2022 will be set forth in the document entitled “The Unified Government of Athens‐Clarke County 2022 Retiree Benefits Enrollment Guide,” which will be made available for public inspection in the office of the Clerk of Commission in or around October, 2021. This Section 16 shall be subject to amendment by the Commission to incorporate any such changes in premiums.
(g) Pursuant to Athens‐Clarke County Code Section 1‐9‐19(c) the government shall provide to retirees who are age 65 or older those health benefits as described in the “2021 Enrollment Guide: Enroll in Additional Medicare Coverage” and “Via Benefits Reimbursement Guide: The Unified Government of Athens‐Clarke County Health Reimbursement Arrangement HRA,” and incorporated herein by reference. Such documents are on file and available for public inspection in the office of the Clerk of Commission, Room 204, City Hall, 301 College Avenue, Athens, Georgia and on file and available for public inspection in the office of the Human Resources Department, 375 Satula Ave., Athens, Georgia.
SECTION 17. Pursuant to the Code of Athens‐Clarke County, Georgia, Section 2‐6‐2 “Schedule of Fees to be adopted annually”, the Schedule of Fees and Charges as provided for in the budget document entitled "FY2022 Annual Operating and Capital Budget: The Unified Government of Athens‐Clarke County July 1, 2021–June 30, 2022" are hereby adopted.
SECTION 18. The effective date of this ordinance shall be July 1, 2021. SECTION 19. All Ordinances or parts of ordinances in conflict with this Ordinance are hereby repealed.
Adopted June 15, 2021 by Commission
Approved June 22, 2021 by Mayor
FY22 Budget Ordinance
FY22 Budget B-21

There are a number of requirements under Georgia Law and the Unified Government’s Charter that must be met as a part of preparing and adopting the Annual Budget. These requirements include:
Budgets must be balanced so that projected expenditures do not exceed projected revenues and available fund balances.
Budgets must be provided at least at the department level and be separated by fund.
A separate Operating and Capital Budget must be submitted and adopted.
The Mayor’s Recommended Budget must be submitted to the Commission at least 60 days prior to beginning of the fiscal year.
At the time the Recommended Budget is provided to the Commission, it shall be made available for public review.
Public Hearings must be held to receive public input on the proposed budget at least one week prior to the budget being adopted.
Public Hearings must be held to receive public input if the proposed budget includes an increase in the property tax as defined by the Taxpayer Bill of Rights (O.C.G.A. 48‐5‐32.1).
During the fiscal year, the Mayor and Commission may change the Budget as needed through the adoption of a budget ordinance identifying the change. Also, departments can transfer budget funds between line items within their department’s budget to cover unanticipated expenses with approval of the Finance Director. However, the department’s total budget or number of full‐time authorized positions cannot increase without Mayor and Commission approval.
The Annual Operating and Capital Budget is the financial plan for raising revenues and expending funds for all Athens‐Clarke County departments, offices and constitutional officials.
The process to develop the Annual Operating and Capital Budget begins about nine months prior to the beginning of the fiscal year. Departments and Constitutional Officials submit Operating and Capital Budget requests for review by the Manager and the Mayor. Prior to May 1 each year, the Mayor must submit a Recommended Budget to the Commission for review. The Commission will review the Mayor’s Recommended Budget and make any adjustments they feel are necessary and adopt the budget in June. Major steps in the Annual Budget development process include:
October – Mayor & Commission provide Budget goals and directions and November Operating Budget directions sent to Departments & Offices November Departments Submit Capital Project requests and
updates to the 5 year Capital Improvement Plan (CIP).
Legal and Charter Requirements for the Annual Budget
Annual Budget Development Process
FY22 Budget Development
FY22 Budget B-22

January Departments Submit Operating Budget Requests.
January ‐ Manager and Mayor meet with Department and February Constitutional Officials to review Budget requests. February Mayor and Commission review Independent Agencies Budget Requests.
April Mayor sends a Recommended Budget to Commission. May ‐ June Commission reviews Mayor Recommended Budget. June Commission adopts budget for next fiscal year
and establishes the property tax millage rate. July Budget for next fiscal year begins on July 1.
FY22 Budget Development
FY22 Budget B-23

To promote a safe, consistent, and efficient aviation environment; provide quality aviation products and
services; and serve as a catalyst in the creation and development of aviation related industry in Athens – Clarke
County. The airport will strive for self‐sufficiency through the development and implementation of competitive
rates and fees.
Build on and maintain modern and technologically up‐to‐date airport facilities and infrastructure.
Achieve and maintain financial self‐sufficiency.
Foster a work environment that leads to high employee morale.
Establish scheduled and increase non‐scheduled passenger service.
Expand the general aviation experience.
Inform and connect community, businesses, and customers.
Meet with the Airport Authority monthly to coordinate airport operations.
Work with the Airport Authority, consultants, and ACC to secure a new airline.
Meet with airport engineers monthly to manage airport projects.
Coordinate airport projects with the GDOT and FAA on a monthly basis.
Meet monthly with the Operations Supervisor and Business Coordinator to review the airport financials and
operational status.
Meet monthly with the operations staff to review airport issues.
Work to involve employees in airport projects and operations.
Mission
Goals
Objectives
Airport
FY22 Budget C-1

Performance Measures
Airport
FY22 Budget C-2

The Airport’s operations are funded through the Airport Enterprise Fund. The Airport Enterprise Fund earns
revenue primarily through fuel sales and leasing space.
The Approved Budget for the Airport includes no significant changes.
Fuel sales are projected to generate a gross margin of $887,000 while leases are projected to generate
$550,000 of revenue.
Salary and benefit changes are due to performance management pay, personnel turnover and/or
reallocation of benefits applied by Human Resources.
For more information on the Airport Enterprise Fund see page E‐32. For information on individual fees, see
the Schedule of Fees and Charges beginning on page G‐15.
(All figures in $1,000s) FY20 FY21 FY22 FY22
Appropriations by Type Actual Budget Requested Approved $▲ %▲Salary & Benefits $645.9 $636.5 $617.6 $617.6 ($18.9) ‐3.0%
Operating $1,547.2 $2,023.8 $1,922.8 $1,922.8 ($101.0) ‐5.0%
Total $2,193.1 $2,660.3 $2,540.4 $2,540.4 ($119.9) ‐4.5%
FY20 FY21 FY22 FY22
Appropriations by Division Actual Budget Requested Approved $▲ %▲Administration $260.7 $317.9 $322.7 $322.7 $4.8 1.5%
Airport Services $1,777.9 $2,165.7 $2,041.0 $2,041.0 ($124.7) ‐5.8%
Airport Maintenance $154.5 $176.7 $176.7 $176.7 $0.0 0.0%
Total $2,193.1 $2,660.3 $2,540.4 $2,540.4 ($119.9) ‐4.5%
FY20 FY21 FY22 FY22
Appropriations by Fund Actual Budget Requested Approved $▲ %▲Airport Fund $2,187.6 $2,660.3 $2,540.4 $2,540.4 ($119.9) ‐4.5%
Hotel/Motel Fund $5.6 $0.0 $0.0 $0.0 $0.0 ‐‐
Total $2,193.2 $2,660.3 $2,540.4 $2,540.4 ($119.9) ‐4.5%
Budget Highlights
Appropriation Summary
Airport
FY22 Budget C-3

FY22 FY22
FY20 FY21 Requested Approved ▲Fulltime Authorized Positions 7 7 7 7 0
(all numbers in thousands of dollars) 5 ‐ Year CIP
Capital Appropriations
FY20
Year End
Balance
FY21
Budget
FY22
Approved
FY23‐FY26
Proposed
FY27‐31
ProposedGeneral Capital Projects FundCurrent ServicesD‐20 Matching Funds for Airport Capital Improvement Grants 244.1 ‐ ‐ 1,457.3 1,825.0D‐21 Maintain Airport Facilities and Equipment 32.0 25.0 65.0 105.0 315.0
D‐22 N Aircraft Rescue and Fire Fighting Proximity Suits & Gear and
SCBA Tank and Breathing Apparatus
‐ ‐ 21.5 ‐ ‐
General Capital Projects Fund Total 276.1 25.0 86.5 1,562.3 2,140.0
Capital Budgets, 5-Year CIP and Project Forecast
Authorized Positions
Airport
FY22 Budget C-4

We are Athens‐Clarke County Animal Services, an open admission shelter and compassionate team of animal welfare professionals. Through our Adoption Center, we provide quality care and seek positive outcomes for all animals that come through our doors. Through our Field Services, we aim to protect community members and neglected animals by enforcing laws and educating the public. We are a resource for our community and work to keep people and their pets together where possible.
Create a caring environment where animals are evaluated upon arrival and receive the medical and
behavioral support they need, in order to produce the most positive outcomes possible for each
animal.
Consistently provide standardized care to all animals upon arrival and evaluations that lead to
improved and individualized care.
Ensure sufficient staffing, training, and resources to maintain a healthy and humane shelter that
provides for the welfare, enrichment, and socialization of the animals for the duration of each animal’s
tenure at the shelter
Ensure appropriate, timely, and individualized medical care to resolve illnesses and injuries early,
reduce disease spread, and prevent the exacerbation of existing problems.
Protect the safety of both animals and residents by reducing the number of needy and homeless animals in the community and improving legal compliance.
Improve community access to needed resources through private and public partnerships.
Maximize positive and safe outcomes for all animals.
Increase successful adoptions through an approach that encourages and educates all community
members on becoming adopters.
Evaluate and adjust adoption process to support great matches and provide post‐adoption support.
Maximize efforts to reunite lost pets with owners.
Afford all customers prompt, courteous, and impartial service.
Accomplish immediate medical assessments to encourage disease control and more clearly identify the individual animal’s outcome path
Continue to develop protocols and SOPs, fully train staff, spot‐check for compliance, and update as
necessary.
Improve access to, and utilization of, low or no cost spay/neuter services, vaccine and microchip
clinics, dog training and pet food pantry programs, both at the shelter and in targeted, high‐needs
communities.
Improve ACCAS’s online presence to market available pets and engage potential adopters.
Evaluate and pursue potential options for obtaining veterinary support.
Evaluate current staffing, equipment, and supplies and make changes needed to achieve appropriate
standard of care.
Mission
Goals
Objectives
Animal Services
FY22 Budget C-5

Outcomes and Performance Measures Current Goal FY16 FY17 FY18 FY19 FY20 Trend Comments or Analysis
Number of Sick Animal Calls Data only 115 67 120 36 33 Very Similar to last year
Number of Animal Bite Calls Data only 155 125 148 154 118 Down slightly
Number of Rabies Vouchers Purchased When Reclaiming an Impounded Animal
Data only 143 157 140 154 147 Very Similar to last year
Number of Dog Running-at-large Calls Data only 1,449 1,192 1,221 1,040 760 Some Service call types will be down due to the last part of the year we were emergency only due to COVID
Number of Vicious Animal Calls Data only 32 21 94 44 58 Up slightly
Number of Barking Dog Complaints Data only 90 93 72 73 50 Some Service call types will be down due to the last part of the year we were emergency only due to COVID
Number of Trapped Cat Transport Requests Data only 125 43 40 36 19 More people are bringing them to us.
Number of Animal Neglect Calls Data only 270 266 409 310 229 Public education programs and better coordination with courts may impact recurring issues.
Number of Injured Animal Calls Data only 192 120 187 188 123 Down from last year may have to do with COVID since the public was grounded for part of the year.
Number of Warnings Issued Data only 911 829 1,022 980 482 Some Service call types will be down due to the last part of the year we were emergency only due to COVID
Number of Citations Issued Data only 71 75 154 194 115 Some Service call types will be down due to the last part of the year we were emergency only due to COVID
Ratio of Warnings to Citations >20 13 11 7 5 4 We are still achieving compliance through education over punishment
Number of Animals Impounded Data only 1,969 1,690 2,363 2,055 1,772 Down from last year may have to do with COVID since the public was grounded for part of the year.
Number of Animals Adopted Data only 550 444 571 444 459 This has increased despite the pandemic
Number of Owner Reclaimed Animals Data only 287 340 330 314 206 This has decreased the last year
Number of Animals Transferred to Rescue Groups
Data only 733 614 1,004 949 826 Down from last year but we have added several long distance rescue partners.
Number of Visitors and Volunteers Data only 11,292 9,580 11,250 7,380 5,428 Down from last year which is directly related to COVID since the public was grounded for part of the year.
Euthanasia Rate (Total Animals Euthanized / Total Animal Dispositions)
<2.0% 0.7% 1.8% 0.4% 13.2% 9.8%
This calculation has changed to include more transparent data of ALL dogs and cat dispositions and euthanasias- not only 'adoptable/available' animals. This is the total number of cats and dogs euthanized no matter their status, divided by the cats and dogs with outcomes (which includes adopted, DAK, Euthanized, Reclaimed, RTO, Turned Over to Rescue). 174/1772 = .09812 = 9.8%
Animal Services
Protect and promote the public health,
safety,
Manage a shelter for impounded animals.
and protect animals from inhumane treatment.
quality of life,
Encourage compliance with animal control ordinances.
Performance Measures
Animal Services
FY22 Budget C-6

The FY22 Budget of $1.2 million for Animal Services includes the following funding from the General Fund:
$25,000 increase in Contract Labor for Kennel Technicians to provide assistance with cleaning and caring for the animals to maintain industry standards
$17,625 increase in Medical Services for rising costs to care for sick and injured animals
Full funding for the fulltime Animal Control Officer position, which was added for the last six months of FY21.
$10,481 is included for vehicle replacement charges. General Fund vehicle replacement charges were removed from the FY21 Budget by the Mayor and Commission and have been reinstated for FY22.
Salary and benefit changes are due to personnel turnover and/or reallocation of benefits applied by Human Resources. For information on individual fees, see the Schedule of Fees and Charges beginning on page G‐15.
(All figures in $1,000s) FY20 FY21 FY22 FY22
Appropriations by Type Actual Budget Requested Approved $▲ %▲Salary & Benefits $522.5 $783.9 $888.0 $808.1 $24.2 3.1%
Operating $171.5 $364.4 $437.2 $417.5 $53.1 14.6%
Total $694.0 $1,148.3 $1,325.2 $1,225.6 $77.3 6.7%
FY22 FY22
FY20 FY21 Requested Approved ▲Fulltime Authorized Positions 12 13 14 13 0
Budget Highlights
Appropriation Summary
Authorized Positions
Animal Services
FY22 Budget C-7

The Athens‐Clarke County Attorney’s Office provides legal services to Unified Government of Athens‐Clarke
County through its representation, including the Mayor and Commission, the Manager, Constitutional Officers,
and all other Departments and Divisions of the Athens‐Clarke County Government. The Attorney’s Office handles
legal matters, including instituting and defending lawsuits except for lawsuits covered by liability insurance. The
Office communicates with the Justice Department and other Federal and State agencies to keep the Athens‐
Clarke County government in compliance with Federal and State laws and regulations. The Attorney’s Office
researches and drafts proposed local legislation concerning Athens‐Clarke County. In addition, the Office
researches and drafts ordinances and resolutions to be considered for adoption by the Mayor and Commission.
The office drafts or reviews all contracts and deeds to be executed or accepted by the government. A
representative of the Attorney's Office attends all meetings of the Mayor and Commission, Planning
Commission, Historic Preservation Commission, Hearings Board, and Board of Tax Assessors, as well as
Commission work sessions and committee meetings.
Our primary goal is to continue to provide the legal services needed to serve the Unified Government. We will
also expand the services we provide to ensure that acts of the Government are reviewed and are modified, if
necessary, to accord with applicable law.
Work with the Mayor and Commission as they identify new priority projects that require assistance from the
Attorney’s Office.
Continue to proceed as necessary against properties that have been identified for demolition as a result of changes to the Unified Government's secured structure ordinance.
Continue to work with the Legislative Review Committee and the Government Operations Committee to provide legal assistance as needed.
Continue to assist departments and offices in responding to an increasing number of public records requests, under the Open Records Act.
Continue to work with the Economic Development Department regarding specific economic development projects.
Continue “quality of life” ordinance enforcement and regulatory and administrative support for alcoholic beverages, taxicabs and red light camera and school bus stop arm camera programs.
Continue to supply support for enterprise fund activities, such as Public Utilities, Airport, Transit and Stormwater Utility.
Assist the Human Resources Department with ongoing personnel issues, policy development and claims management.
Provide litigation support for claims counsel on pending claims cases.
Assist the Department of Transportation and Public Works with compliance with state and federal environmental laws and regulations.
Work with the Police, Fire, and Solid Waste Departments to protect public health safety regarding activities in the Downtown District, particularly enforcement of fire safety, alcoholic beverages and solid waste ordinances.
Review and advise departments throughout the government regarding contracts.
Mission and Goals
Objectives
Attorney
FY22 Budget C-8
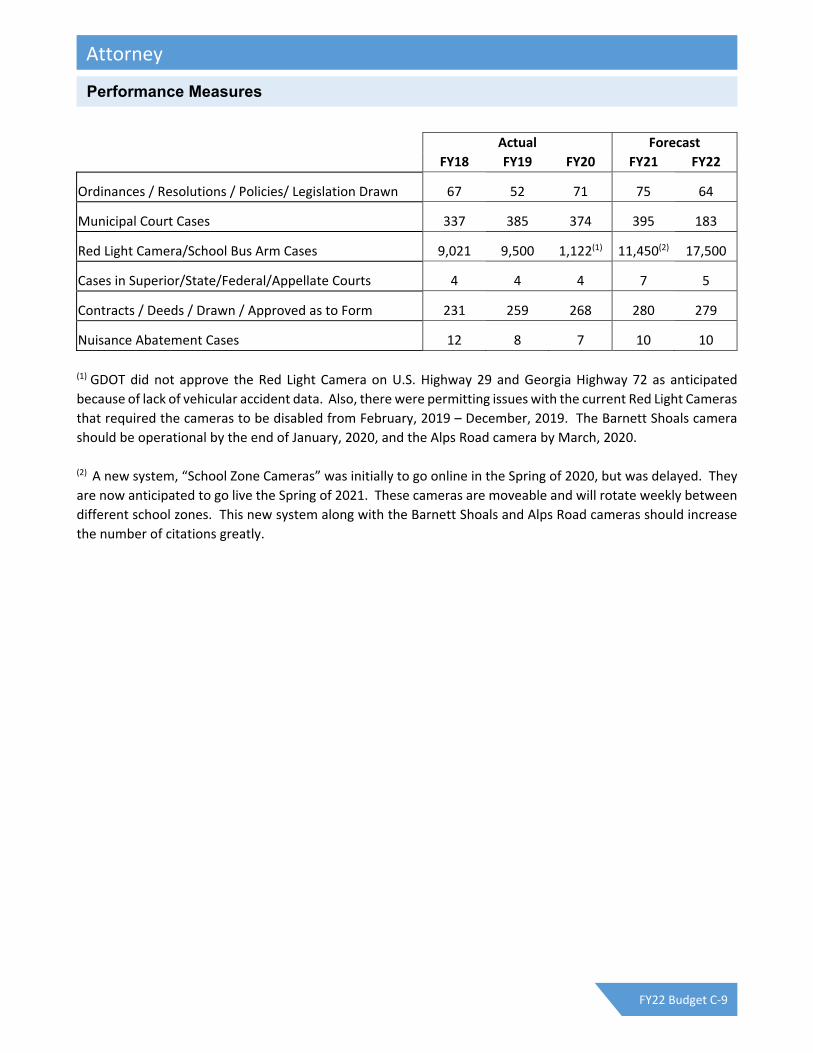
(1) GDOT did not approve the Red Light Camera on U.S. Highway 29 and Georgia Highway 72 as anticipated
because of lack of vehicular accident data. Also, there were permitting issues with the current Red Light Cameras
that required the cameras to be disabled from February, 2019 – December, 2019. The Barnett Shoals camera
should be operational by the end of January, 2020, and the Alps Road camera by March, 2020.
(2) A new system, “School Zone Cameras” was initially to go online in the Spring of 2020, but was delayed. They
are now anticipated to go live the Spring of 2021. These cameras are moveable and will rotate weekly between
different school zones. This new system along with the Barnett Shoals and Alps Road cameras should increase
the number of citations greatly.
Actual Forecast
FY18 FY19 FY20 FY21 FY22
Ordinances / Resolutions / Policies/ Legislation Drawn 67 52 71 75 64
Municipal Court Cases 337 385 374 395 183
Red Light Camera/School Bus Arm Cases 9,021 9,500 1,122(1) 11,450(2) 17,500
Cases in Superior/State/Federal/Appellate Courts 4 4 4 7 5
Contracts / Deeds / Drawn / Approved as to Form 231 259 268 280 279
Nuisance Abatement Cases 12 8 7 10 10
Performance Measures
Attorney
FY22 Budget C-9

$40,000 is included for Professional Legal Expenses (of a requested $80,000). This covers costs associated
with requiring an outside counsel, cost not covered by insurance, or for professional expenses for
matters outside the expertise of the Department.
$1,300 is included for vehicle replacement charges. General Fund vehicle replacement charges were
removed from the FY21 Budget by the Mayor and Commission and have been reinstated for FY22.
Salary and benefit changes are due to personnel turnover and/or reallocation of benefits applied by
Human Resources.
(All figures in $1,000s) FY20 FY21 FY22 FY22
Appropriations by Type Actual Budget Requested Approved $▲ %▲
Salary & Benefits $608.4 $640.2 $639.0 $622.0 ($18.2) ‐2.8%
Operating $95.1 $83.1 $164.1 $124.1 $41.0 49.3%
Total $703.5 $723.3 $803.1 $746.1 $22.8 3.2%
FY22 FY22
FY20 FY21 Requested Approved ▲Fulltime Authorized Positions 6 6 6 6 0
Budget Highlights
Appropriation Summary
Authorized Positions
Attorney
FY22 Budget C-10

The mission of the Athens‐Clarke County Board of Elections is to provide excellent election services, ensuring
accessibility, protecting the integrity of votes, and maintaining a transparent, accurate and fair process. Our
vision is to provide the best possible election services for the voters and candidates of Athens‐Clarke County.
Enhance voter registration, voting opportunities and voter education for the citizens of ACC.
Provide quality information and excellent customer service to candidates, public officers, poll workers and elected officials.
Maintain knowledge of federal and state election laws.
Provide a team of well‐prepared and responsive poll workers for all elections held in FY22 Budget.
Properly conduct successful elections during the FY22 Budget to include a General Municipal Election for the City of Winterville and a General Primary Election.
Properly assign and appropriate the necessary amount of equipment to our 24 polling locations and five or more Early/Advance Voting Locations.
Accurately assign voters to political districts in Athens‐Clarke County with minimal errors.
Provide additional Early/Advance Voting opportunities by surveying the county for potential satellite sites and surveying the current Election Day polling locations to determine the need for relocation.
Reorganize office staff duties to ensure efficiency and productivity of providing excellent services as it relates to absentee balloting and advance voting.
Create a call center to handle calls related to voter registration and elections during the election cycle leading up to the 2022 General Primary Election.
Successfully complete a redistricting project from the 2020 Census and reapportionment process.
Seek possibilities for a location that will house a combined facility for elections staff and equipment to ensure wisely distributed workload.
Successfully maintain and update statewide voter registration system daily.
Properly maintain Easy File and timely receive campaign filings from all Elected Officials and Candidates for the 2022 Election Season.
Conduct two major elections: the General Municipal Election for the City of Winterville and a General
Primary Election, during FY22 Budget with no legal challenges or irregularities.
Distribute printed election material to the citizens of Athens‐Clarke County at public meetings and gatherings throughout the year.
Efficiently hire and properly train over 200 poll workers, election officials and other staff on proper handling, assembling, troubleshooting and testing of voting equipment.
Properly organize, store and transport all voting equipment located at the facility warehouse on Lexington Road.
Provide assistance and input on committees for state election organizations and the Secretary of State Elections Division.
Evaluate and implement improvements to existing 24 polling sites and identify locations that are more conducive to our election needs.
Maintain training and education required of Superintendents and Supervisors of Elections.
Conduct Advance Voting and adding additional sites to allow the Athens‐Clarke County voters with other options for voting; adding Sunday voting and additional Saturday voting when necessary.
Mission
Goals
Objectives
Board of Elections
FY22 Budget C-11

Athens-Clarke County Board of ElectionsOutcomes and Performance Measures
Current Goal
FY16 FY17 FY18 FY19 FY20 Comments or Analysis
We provide election and voter registration services for the citizens of Athens-Clarke County
Registered Active Voters 65,000 51,199 60,411 56,316 56,977 78,170This # has varied from fiscal to fiscal. Will impact voter turnout percentages.
Average Total Active Voters per Polling Location
3,000 2,438 2,877 2,816 2,849 3,257This # has increased as total active voters has increased.
Election Day Voters (EDV) 36%6,455
(12.61%)19,431
(32.16%)12,380
(18.62%)20,367
(28.85%)9,111
(11.91%)
This # has increased dramatically. However, AIP and ABM numbers remains equally favorable options for voting.
Advance Voters (AIP) 45%1,375
(2.69%)23,423
(38.77%)5,935
(8.92%)20,014
(28.35%)23,811
(31.12%)This has increased dramatically. Will impact # of voting locations and precincts in the future.
Absentee Voters (ABM) 6%197
(.38%)2,718
(4.50%)511
(.77%)3,047
(4.32%)18,674
(24.41%)This has increased dramatically. Will impact # of voting locations and precincts in the future.
# Voting Precincts 24 24 24 24 24 24This remains steady and may impact precinct consolidating in the future.
# Voting Locations 15 21 21 20 20 24This # has decreased. Voters taking advantage of early processes of voting may impact # of less locations in the future.
# Early Voting Locations 3 1 4 3 4 6This # has increased as the favor of Early/Advance Voting.
# Poll Officers 175 165 224 175 189 197This # has varied from fiscal to fiscal. Consideration of decreasing # polling places will also decrease # of poll workers.
# Laborers* 200 178 250 185 200 238Laborers include the total # poll workers and part-time seasonal office staff.
Voting Equipment Inventory (DRE Touch Screens)
245 245 245 245 245 871
2019 General Assembly approved new voting system. As of 2020, Athens-Clarke County is now custodian of 332 Printers, 331 Ballot Marking Devices, 41 Election Day Scanners, 164 Poll Pads, 2 Central Scanners & 1 Server
Total # Machines actually used 200 125 205 181 191 700This # varies based on ballot content and # active voters per polling location.
Ballot Printing Cost $12,000 $43,066 $7,458 $4,533 $5,967 $320 Varies from FY to FY.
# Training hours (average of 3hrs/worker)
600 495 672 525 540 1200O.C.G.A. § 21-2-99 requires adequate training of poll workers prior to each election cycle. New equipment required additional hours of training.
# Voter IDs Created Data Only 526 711 723 804 497SEB Rule 183-1-20 requires issuance of Voter ID Cards to any voter who does not possess any of the 6 acceptable forms of ID required for voting.
Performance Measures
Board of Elections
FY22 Budget C-12

The FY22 Budget of $1M for Board of Elections includes the following funding from the General Fund:
$60,000 increase to add one fulltime Election Assistant position
$13,000 to provide a pay increase to poll workers
$64,148 increase for Elections Equipment Warranty to provide maintenance and repair of all voting equipment
Two elections are scheduled in FY22: o General Municipal Election – City of Winterville November 2021 o General Primary Election May 2022
Part‐time Seasonal was reduced by $13,490 per the department’s request in accordance with the number of elections.
Salary and benefit changes not included in the items above are due to personnel turnover and/or reallocation of benefits applied by Human Resources.
(All figures in $1,000s) FY20 FY21 FY22 FY22
Appropriations by Type Actual Budget Requested Approved $▲ %▲Salary & Benefits $656.3 $696.4 $773.5 $769.3 $72.9 10.5%
Operating $269.3 $163.0 $239.1 $239.1 $76.1 46.7%
Total $925.6 $859.4 $1,012.6 $1,008.4 $149.0 17.3%
FY22 FY22
FY20 FY21 Requested Approved ▲Fulltime Authorized Positions 4 4 5 5 1
Athens-Clarke County Board of ElectionsOutcomes and Performance Measures
Current Goal
FY16 FY17 FY18 FY19 FY20 Comments or Analysis
and protect the integrity of the vote.
% Voter Turnout 76% 27.43% 75.59% 28.34% 61.57% 67.52%This # varies. An FY that includes a General Election normally results in a higher voter turnout.
% of polling places handicap accessible
100% 100% 100% 100% 100% 100%Federal Law § 508 requires ADA compliance of all polling locations. An annual survey is completed to ensure 100% compliant.
% of polling places in compliance (equipment)
100% 100% 100% 100% 100% 100%SEB Rule 183-1-12-.02 requires VWD devices for all polling locations. Locations are equipped to take care of the needs of all voters.
% of polling places in compliance (size)
100% 100% 100% 100% 100% 100%Federal Law § 508 requires ADA compliance of all polling locations. An annual survey is completed to ensure 100% space compliance.
Registration Data Error Rate 100% 0% 0% 0% 0% 0%Office staff conducts a daily audit process to ensure 100% error in data entry.
Budget Highlights
Appropriation Summary
Authorized Positions
Board of Elections
FY22 Budget C-13

The Athens‐Clarke County Building Permits and Inspection Department exists for the purpose of protecting the
public's health, safety, and general welfare. We accomplish this by ensuring compliance with adopted codes
that regulate structural strength, stability, sanitation, lighting, ventilation, fire safety, and other hazards
associated with construction, alteration, removal, demolition, use, or occupancy of buildings, structures, or
property.
Maximize the number of properties and structures that comply with adopted standards.
Provide quality inspections, customer service, and development services that are efficient, cost effective,
accurate, and responsive to the citizens of Athens‐Clarke County.
Improve the safety and appearance of properties and buildings within Athens‐Clarke County by enforcing
local ordinances, property maintenance codes, and construction codes.
To perform 98% of all inspections of footing, slabs, excavations, electrical service changes and emergency
repairs within four business hours of the time the work is ready for inspection.
To perform at least 95% of all requested rough‐in and final inspections within two workdays.
To respond to at least 95% of all single‐family soil erosion complaints and to initiate compliance and/or
enforcement processes within eight business hours.
To process 95% of all single‐family and secondary permit applications within one workday.
To investigate 99% of all complaints received by our office within three business days.
To investigate 100% of the housing and nuisance complaints received and initiate compliance and/or
enforcement action.
To respond to 100% of ordinance violation complaints and initiate compliance and/or enforcement action.
To provide proactive enforcement of illegal signs erected without permits or in the public right‐of‐way.
To provide proactive code compliance and enforcement services that educates and provides an
understanding of the compliance process to citizens.
To recover through permit fees 100% of the operating expenses for the Construction Division.
Mission
Goals
Objectives
Building Permits & Inspection
FY22 Budget C-14

The Building Inspection Department primarily operates within two separate funds. The Code Enforcement
Division is fully funded by the General Fund, while the Construction Inspection and Administration divisions are
funded through the Building Inspection Special Revenue Fund.
The Approved Budget for Building Permits & Inspection includes budgeted funding from the General fund for;
$13,696 for vehicle replacement charges. General Fund vehicle replacement charges were removed from
the FY21 Budget by the Mayor and Commission and have been reinstated for FY22.
Performance Measure Goal FY18 FY19 FY20 Reference
Building Permits Issued 900 1,050 1,471 1,176 Electrical Permits Issued 800 957 1,119 1,286 HVAC/Gas Permits Issued 600 1,057 1,321 1,207 Plumbing Permits Issued 600 683 1,058 861 Total Construction Inspections 9,000 11,282 14,054 14,809
Front Yard Parking 400 293 442 296 Roll Cart Violations 500 434 395 416 Sign Ordinance Violations 3,000 4,359 3,947 3,938 Litter/Accumulation of Refuse 700 881 854 647
Junked Vehicles 300 576 551 284
Customer service satisfaction survey 90% N/A N/A N/AInspections conducted within 2 business days of requested time 95% N/A N/A N/A
Building Inspection Department staff are committed to protecting the public's safety by ensuring compliance with adopted building codes…
...and by ensuring compliance with ordinances that enhance quality of life for Athens-Clarke County citizens.
We strive to provide these services to the citizens of Athens-Clarke County in a customer friendly and accountable way.
Performance Measures
Budget Highlights
Building Permits & Inspection
FY22 Budget C-15

The Approved Budget for Building Permits & Inspection includes increased budgeted revenue for the Building
Inspection fund and increased expenses of;
$110,410 for Updated Fees & Charges to cover technology costs, an increase to the plan review submittal
fee for software that will be offset by savings to the user from printing and transportation, and a
building valuation table increase of 5%.
Salary and benefit changes are due to performance management pay, personnel turnover and/or
reallocation of benefits applied by Human Resources.
For more information on the Building Inspection Fund (which also includes some expenses for Planning and
Zoning), see page E‐18. For information on individual fees, see the Schedule of Fees and Charges beginning on
page G‐15.
(All figures in $1,000s) FY20 FY21 FY22 FY22
Appropriations by Type Actual Budget Requested Approved $▲ %▲Salary & Benefits $1,640.7 $1,856.0 $1,849.2 $1,849.2 ($6.8) ‐0.4%
Operating $181.9 $221.6 $395.7 $395.7 $174.1 78.6%
Total $1,822.6 $2,077.6 $2,244.9 $2,244.9 $167.3 8.1%
FY20 FY21 FY22 FY22
Appropriations by Division Actual Budget Requested Approved $▲ %▲Administration $314.3 $338.6 $503.5 $503.5 $164.9 48.7%
Construction Inspection $597.1 $790.4 $758.8 $758.8 ($31.6) ‐4.0%
Code Enforcement $911.2 $948.5 $982.6 $982.6 $34.1 3.6%
Total $1,822.6 $2,077.5 $2,244.9 $2,244.9 $167.4 8.1%
FY20 FY21 FY22 FY22
Appropriations by Fund Actual Budget Requested Approved $▲ %▲Building Inspection Fund $882.6 $1,101.1 $1,233.7 $1,233.7 $132.6 12.0%
General Fund $856.8 $891.7 $924.3 $924.3 $32.6 3.7%
Affordable Housing Fund $54.5 $56.8 $58.3 $58.3 $1.5 2.6%
Water & Sewer Fund $28.8 $28.0 $28.6 $28.6 $0.6 2.1%
Total $1,822.7 $2,077.6 $2,244.9 $2,244.9 $167.3 8.1%
FY22 FY22
FY20 FY21 Requested Approved ▲Fulltime Authorized Positions 24 24 24 24 0
Appropriation Summary
Authorized Positions
Building Permits & Inspection
FY22 Budget C-16

To provide our customers, both public and internal, with efficient and cost effective high quality services which meet or exceed their expectations and which promote the image of the Unified Government and the Athens‐Clarke County community. General Fund
Provide a high level of customer service that exceeds our customers’ expectations.
Provide superior quality of life services that enhance the Athens‐Clarke County community.
Protect the health and safety of the public and internal customers.
Provide a quality work environment for ACC employees.
Encourage, promote and support staff performance and development.
Provide professional stewardship to protect, enhance, and maximize the life of government facilities.
Provide high quality support services at the lowest possible cost.
Use environmentally friendly processes and materials in all services and activities. Internal Services Fund
To be responsive to customer needs.
To provide timely and accurate financial reports.
To maintain records in accordance with approved policy and procedures.
Minimize service disruptions to our customers. Fleet Management Fund Provide a safe and effective fleet for Athens‐Clarke County departments
Complete at least 90% of the Facilities Management work orders within 30 days.
Adhere to Landscape Management maintenance schedules at least 90% of the time.
Ensure that 90% of all copier/telephone repair requests are completed within 24 hours.
Submit indirect billing, finance reports within 30 days of the receipt of charges from vendors.
Assure FCC compliance of the 800 MHz system 100% of the time.
Ensure that 90% of the fleet receives preventive maintenance prior to reaching the scheduled maintenance mileage.
Outcomes and Performance Measures Current Goal FY18 FY19 FY20 FY21 FY22 Trend Comments or Analysis
FCC Compliance 100% 100% 100% 100% 100% 100% Regulatory
System Availability 100% 100% 100% 100% 100% 100% Up-time minus system busy time
Number of ACCUG subscriber radio units Data only 1,080 1,094 1,097 1,104 1,087
Number of UGA subscriber radio units Data only 461 466 474 486 486
Number of Special Event Permits Issued Data only 53 54 33 10 20 FY20, FY21 & FY22 COVID impact.
Central Services / Administration
Ensure continuous operation of the 800 MHz radio system providing critical public safety and general government communications
Review, coordinate with other departments, and issue Special Event permits for community enhancing events
Mission & Goals
Objectives
Performance Measures
Central Services
FY22 Budget C-17

Outcomes and Performance Measures Current Goal FY18 FY19 FY20 FY21 FY22 Trend Comments or Analysis
Acres of Park and Open Space Maintained per Employee (total 415 acres)
33 43 47 43 40 34* Greenway and Rails-to-Trail expansions increasing acres maintained. *With additional position requested in FY22.
Miles of Rights-of-Way Maintained per Employee (total 1,200 lane miles)
75 96 96 96 96 96
Acres of Facilities Grounds Maintained per Employee (total 100 acres)
30 31 31 31 31 31
Percent of Routes Completed on Schedule 85%New for FY19
90% 90% 80%* 90%** *COVID Impact. **With additional position requested in FY22.
Number of Landscape Installations and Renovations
Data only 15 40 37 15 20
Number of Athletic Field Repairs and Renovations
Data only 2 0 0 0 5
Number of Private Property Tree Assessments
Data only 377 367 386 344 350
Total Tree Canopy Cover for Athens-Clarke County (measured every 5 years)
45% 63% - 63% - 63%Goal is defined in the ACC Tree Management Ordinance
Total Customer Calls for Services Data onlyNew for FY19
376 364 400 300
Percent of Service Calls Responded To Within 1 Workday
85%New for FY19
96% 96% 94% 97%
Percent of Service Calls Completed Within 5 Workdays
95%New for FY19
100% 100% 100% 100%
Provide public tree assessment and management as well as community outreach.
Strive to satisfy our customers.
Provide safe, functional, and aesthetically pleasing open space management at ACC parks, facilities, and rights-of-way.
Central Services / Landscape Management
Outcomes and Performance Measures Current Goal FY18 FY19 FY20 FY21 FY22 Trend Comments or Analysis
Number of Structures Maintained Data only 224 199 194 200 205
Number of Work Orders Data only 9,383 8,804 8,560 8,362 8,613
Square Footage Maintained for all maintenance and repairs
Data only 2,035,833 2,044,637 2,040,314 2,051,242 2,057,983
Avg. Number of Work Orders per Maintenance Employee
<425 419 419 408 398 410 Measures workload by average volume of work performed per maintenance employee
Avg. Square Footage Maintained per Maintenance Employee
90,000 96,945 97,364 97,158 97,678 97,999 Measures average amount of responsibility per maintenance employee
Cost per Square Foot for Maintenance <$1.75 $1.90 $1.93 $1.99 $2.05 $2.11
Cost per Square Foot for Custodial Services
<$2.11 $1.58 $1.88 $1.94 $2.00 $2.06
Preventive Maintenance vs. Corrective Maintenance
75%58% PM 42% CM
61% PM 39% CM
63% PM 37% CM
Preventive Maint. as percent of Total Maint. cost shows preventive program effectiveness (ref: IFMA)
Central Services / Facilities Management
Ensure a safe, productive, and positive image of Athens-Clarke County Facilities
by providing a high quality physical environment through dependable customer service
and sound fiscal practices.
New for FY20
Outcomes and Performance Measures Current Goal FY18 FY19 FY20 FY21 FY22 Trend Comments or Analysis
Copier Repair Requests Completed Within 24 Business Hours of Service Request.
100% 100% 100% 100% 100% 100%
Telephone System Repair Within 24 Business Hours of Request.
100% 100% 100% 100% 100% 100%
Records Issued to Customers Within 72 Business Hours of Request.
100% 100% 100% 100% 100% 100%
Mail Delivered and Picked‐Up on Time Per
Published Schedule. 100% 100% 100% 100% 90%* 100% *COVID impact
Central Services / Internal Support
Central Services
FY22 Budget C-18

Outcomes and Performance Measures Current Goal FY18 FY19 FY20 FY21 FY22 Trend Comments or Analysis
Number of Preventive Maintenance Inspections Completed
>1600 1,453 1,389 1,293 1,300 1,340
Number of Corrective Maintenance Service Calls
<75 152 210 216 212 210 As the fleet ages, maintenance issues continue to rise.
Percentage of Vehicles/Equip Exceeding Replacement Criteria Not Replaced
10% 18% 16% 12% 10% 10% Replacement criteria revised in FY18. Funding constraints limits # of replacements each year.
Number of Catastrophic Failures <5 3 12 14 12 10
Compliance with Georgia Environmental Protection Division Regulations
100% 100% 100% 100% 100% 100% Regulatory requirement
Number of Inspections of Fueling Equipment and Storage Tanks
45 40 45 46 46 45 Needed to maintain regulatory compliance
Ensure reliable fuel availability for ACCUG vehicles and equipment.
Central Services / Fleet Management
Ensure safe, reliable, and safe vehicles and equipment are available to enable all ACCUG departments to complete their service delivery.
Provide a modern fleet of vehicles and equipment that are reliable and efficient.
Central Services
FY22 Budget C-19

The Central Services Department is supported by the General Fund, Internal Support Fund, Fleet Management Fund and the Hotel/Motel Fund. The FY22 Budget for Central Services includes: General Fund
FY22 includes funding of $10.3 million (not including debt service of $542,000) for the cost of Administration, Landscape Management & Facilities Management.
$9,800 increase in Facilities Management for service contracts and building maintenance cost associated with the East Athens Neighborhood Health Center expansion on McKinley Drive.
$33,000 increase in Facilities Management for building and equipment maintenance cost associated with the new SPLOST funded Downtown Public Restroom facility.
$4,750 increase in Facilities Management for building and equipment maintenance cost associated with new SPLOST funded Pavilions and Restrooms at Ben Burton and Dudley Parks.
Annual funding for the fulltime Fleet Training position, which is split funded between the General Fund and Workforce Development, and was added for the last six months of FY21 to enhance career development while working with incarcerated individuals on marketable skills for re‐entry into the workforce.
Full funding for the fulltime Landscape Grounds Worker position, which was added for the last six months of FY21 to support service continuation to SPLOST funded greenways and rail‐trails.
Annual contract for downtown parking services with Athens Downtown Development Authority (ADDA) is projected to generate $3.3 million in fees and fines.
ADDA’s FY22 parking expenditures are estimated at $2.2 million, the same level as the FY21 Budget.
Assuming above noted level of parking revenue in FY22, the Parking Management Agreement service fee to ADDA will be $203,000 ($240,000 less than FY21 Budget) and ACCGov’s portion of net parking revenues will be $812,000 ($960,000 less than FY21 Budget).
$191,317 is included for vehicle replacement charges. General Fund vehicle replacement charges were removed from the FY21 Budget by the Mayor and Commission and have been reinstated for FY22.
Internal Support Fund
Internal Support Fund provides services to other government departments for copier, phone, postage, paper,
printing, and 800 MHz radio.
The FY22 Budget for the Internal Support Fund of $1.6 million reflects no significant changes to services or
programs.
Fleet Management Fund
The FY22 Budget is $2.6 million to allocate ACCGov vehicle costs for repair, maintenance and bulk fuel.
Fuel costs are based on a purchase price of $2.00/gallon for gasoline & $2.14/gallon for diesel (same prices
used for FY21 budgeting).
Hotel/Motel Fund
$100,000 is budgeted to add two fulltime Grounds Worker positions, beginning in the second quarter of
FY22, to maintain beautification installations along corridors.
Budget Highlights
Central Services
FY22 Budget C-20

Salary and benefit changes for Central Services not included in the items above are due to personnel turnover, changes in the vacancy factor, and/or reallocation of benefits applied by Human Resources.
For more information on the Internal Support, Fleet Management and Hotel/Motel Funds, see Section E. For
information on individual fees, see the Schedule of Fees and Charges beginning on page G‐15.
(All figures in $1,000s) FY20 FY21 FY22 FY22
Appropriations by Type Actual Budget Requested Approved $▲ %▲Salary & Benefits $5,610.8 $5,636.1 $5,990.6 $5,885.2 $249.1 4.4%
Operating $7,370.5 $8,466.2 $8,892.2 $8,724.5 $258.3 3.1%
Total $12,981.3 $14,102.3 $14,882.8 $14,609.7 $507.4 3.6%
FY20 FY21 FY22 FY22
Appropriations by Division Actual Budget Requested Approved $▲ %▲Administration $331.8 $380.4 $471.6 $466.6 $86.2 22.7%
Animal Control $191.5 $0.0 $0.0 $0.0 $0.0 ‐‐
Internal Support $2,794.5 $3,321.2 $3,324.3 $3,317.6 ($3.6) ‐0.1%
Landscape Management $2,749.1 $2,830.4 $3,360.5 $3,122.8 $292.4 10.3%
Facilities Management $4,245.5 $4,400.1 $4,536.7 $4,513.0 $112.9 2.6%
800 MHz Radio System $526.2 $590.2 $602.6 $602.6 $12.4 2.1%
Fleet Management $2,142.7 $2,580.0 $2,587.1 $2,587.1 $7.1 0.3%
Total $12,981.3 $14,102.3 $14,882.8 $14,609.7 $507.4 3.6%
FY20 FY21 FY22 FY22
Appropriations by Fund Actual Budget Requested Approved $▲ %▲General Fund $9,357.9 $9,925.8 $10,695.2 $10,322.1 $396.3 4.0%
Hotel/Motel Fund $5.7 $0.0 $0.0 $100.0 $100.0 ‐‐
Internal Support Fund $1,475.0 $1,596.5 $1,600.5 $1,600.5 $4.0 0.3%
Fleet Management Fund $2,142.7 $2,580.0 $2,587.1 $2,587.1 $7.1 0.3%
Total $12,981.3 $14,102.3 $14,882.8 $14,609.7 $507.4 3.6%
Appropriation Summary
Central Services
FY22 Budget C-21

(all numbers in thousands of dollars) 5 ‐ Year CIP
Capital Appropriations
FY20
Year End
Balance
FY21
Budget
FY22
Approved
FY23‐FY26
Proposed
FY27‐31
ProposedGeneral Capital Projects FundCurrent ServicesD‐23 Facilities Life Cycle Maintenance Program 135.9 ‐ 1,262.8 10,228.2 9,522.5D‐25 800 MHz Subscriber Radio Life Cycle 241.6 50.0 200.0 1,600.0 2,000.0D‐26 Landscaping Equipment Life Cycle Replacement ‐ 75.0 75.0 537.0 660.0D‐29 800 MHz Radio Infrastructure Replacement 125.0 25.0 150.0 1,000.0 1,250.0D‐30 Landscape & Community Tree Program 0.6 ‐ ‐ 60.0 75.0D‐31 Parking Lot Life Cycle Maintenance & Repair 20.9 25.0 25.0 160.0 200.0D‐32 Upgrade Fuel Sites ‐ 30.0 ‐ ‐ ‐D‐33 N Tree Hazard Reduction ‐ ‐ ‐ 240.0 300.0D‐34 Parking Facilities 50.8 ‐ ‐ 80.0 100.0D‐37 Replace Internal Support Equipment 40.0 10.0 10.0 40.0 50.0D‐38 Parking Decks Life Cycle Replacement 8.7 25.0 ‐ 200.0 250.0D‐43 Energy Management Improvements 13.1 ‐ ‐ 30.0 150.0
Current Services Total 636.8 240.0 1,722.8 14,175.2 14,557.5
Additions & ImprovementsD‐35 Renovations/Space Allocation Plan 393.8 ‐ ‐ 120.0 150.0D‐36 N Urban Forestry Crew ‐ ‐ ‐ 335.0 115.0D‐40 Downtown Enhancement Project 114.8 60.0 60.0 240.0 300.0D‐41 N Additional Rural Roadside Mowing Crew ‐ ‐ ‐ 300.0 ‐Additions and Improvements Total 508.5 60.0 60.0 995.0 565.0
General Capital Projects Fund 1,145.3 300.0 1,782.8 15,170.2 15,122.5
Fleet Management FundCurrent ServicesD‐28 Fleet Management Shop Equipment Life Cycle Replacement 10.0 10.0 10.0 40.0 50.0D‐32 Upgrade Fuel Sites 0.7 ‐ ‐ 80.0 100.0Current Services Total 10.7 10.0 10.0 120.0 150.0
Fleet Management Fund Total 10.7 10.0 10.0 120.0 150.0
Fleet Replacement FundCurrent ServicesD‐24 Fleet Replacement Program ‐ 1,295.4 3,853.0 14,250.0 18,750.0Current Services Total ‐ 1,295.4 3,853.0 14,250.0 18,750.0
Fleet Replacement Fund Total ‐ 1,295.4 3,853.0 14,250.0 18,750.0
Hotel/Motel FundCurrent ServicesD‐30 Landscape & Community Tree Program ‐ ‐ ‐ 60.0 75.0D‐39 Community Events Program 14.5 40.0 30.0 160.0 200.0Current Services Total 14.5 40.0 30.0 220.0 275.0
Hotel/Motel Fund Total 14.5 40.0 30.0 220.0 275.0
Current ServicesD‐27 Mobile Communications Van Equipment Replacement ‐ 17.0 17.0 68.0 37.4D‐37 Replace Internal Support Equipment 84.4 15.0 15.0 60.0 75.0D‐42 Telephone System Life Cycle Replacement 55.3 25.0 25.0 100.0 125.0Current Services Total 139.7 57.0 57.0 228.0 237.4
Internal Support Fund Total 139.7 57.0 57.0 228.0 237.4
Central Services Total 1,310.2 1,702.4 5,732.8 29,988.2 34,534.9
Capital Budgets, 5-Year CIP and Project Forecast
Central Services
FY22 Budget C-22

FY22 FY22
FY20 FY21 Requested Approved ▲Fulltime Authorized Positions 94 96 100 98 2
Authorized Positions
Central Services
FY22 Budget C-23

To effectively and efficiently file and record all proceedings, actions, orders and minutes and to perform all
duties and functions mandated by law, of the Superior and State Courts of Athens‐Clarke County and to
protect and secure all records entrusted therein.
To provide electronic index and images for deeds 1970‐1983, in house and on GSCCCA, ongoing.
Completed 1986‐1991, contract pending for 1984‐1985
To image all cases for the years 1993‐2002, on going
To link civil and criminal digitized images from the FY17 and FY18 capital project within our case
management system for availability on the public internet docket
To digitize bound newspaper books from 1800’s to 1900’s, on going
Actual Forecast
CY18 CY19 CY20 CY21 CY22
Civil Filed Superior and State 2,904 2,810 2,227
Not Available
Civil Disposed Superior and State 3,003 2,393 2,004
Criminal Filed Superior and State 6,875 8,125 6,160
Criminal Disposed Superior and State 6,729 8,185 5,662
Land Record Instruments processed 24,865 25,808 20,817
General Minutes processed 5,672 4,356 2,331
Appeals filed/processed to Board of Equal 115 209 218
Board of Equalization Hearings Conducted 49 157 157
The Approved Budget for the Clerk of Courts includes no significant changes.
Salary and benefit changes are due to performance management pay, personnel turnover, changes in the
vacancy factor, and/or reallocation of benefits applied by Human Resources.
Mission & Goals
Objectives
Performance Measures
Budget Highlights
Clerk of Courts
FY22 Budget C-24

(All figures in $1,000s) FY20 FY21 FY22 FY22
Appropriations by Type Actual Budget Requested Approved $▲ %▲Salary & Benefits $1,178.3 $1,174.2 $1,234.3 $1,226.3 $52.1 4.4%
Operating $208.4 $384.1 $384.1 $384.1 $0.0 0.0%
Total $1,386.7 $1,558.3 $1,618.4 $1,610.4 $52.1 3.3%
FY22 FY22
FY20 FY21 Requested Approved ▲Fulltime Authorized Positions 21 22 22 22 0
(all numbers in thousands of dollars) 5 ‐ Year CIP
Capital Appropriations
FY20
Year End
Balance
FY21
Budget
FY22
Approved
FY23‐FY26
Proposed
FY27‐31
ProposedGeneral Capital Projects FundAdditions & ImprovementsD‐44 N Deed Indexing (years 1970‐1983) ‐ ‐ ‐ ‐ ‐Additions & Improvements Total ‐ ‐ ‐ ‐ ‐Capital Appropriations Total ‐ ‐ ‐ ‐ ‐
Appropriation Summary
Capital Budgets, 5-Year CIP and Project Forecast
Authorized Positions
Clerk of Courts
FY22 Budget C-25

The mission of UGA Cooperative Extension is to extend lifelong learning to the people of Georgia through unbiased, research‐based education in agriculture, the environment, communities, youth and families. Cooperative Extension provides education and information for all citizens of Athens‐Clarke County in the areas of Families, Food & Nutrition, Agriculture, Horticulture, & the Environment, and Youth Development.
Family and Consumer Sciences & Supplemental Nutrition Assistance Program Education To respond to clientele calls regarding food safety, home food preservation, healthy lifestyles, weight
management, chronic disease prevention and management. To provide consumer information regarding financial management and budgeting. To provide nutrition and food management training to low‐income families, empowering them to get the
best nutrition within a limited budget. To help professional food handlers and consumers learn safe food handling practices to prevent food
borne illness. To provide consumer information to create greater radon awareness and promote testing. Adapt programming to virtual format when feasible and continue reaching clients Agriculture & Natural Resources To respond to clientele calls regarding soil samples, water samples, insect, disease and plant identification,
tree care and other issues. To provide a series of comprehensive training courses through the Master Gardener, Master Composter
and Master Naturalist Programs which train volunteers in subject specific areas who can then extend this knowledge throughout the community.
To provide educational opportunities through informational and activity booths staffed by Master Gardener and Master Composter volunteers at events throughout the region as well as weekly booths at two area Farmers Markets during the market season.
To provide information and offer programs that will encourage environmental stewardship and promote water quality through the Master Naturalist program.
Adapt programming to virtual format when feasible and continue reaching clients
4‐H and Youth Development To provide a variety of leadership opportunities for elementary, middle and high school students. To provide community involvement and service activities for young people to develop citizenship skills in
their community. To provide monthly educational programs in all elementary schools and middle schools in Athens‐Clarke
County. Educational programs are also offered to home school students, as well as evening programs for high school students.
To offer a series of judging event activities in order to help young people develop decision‐making skills. To assist with coordinating Youth Leadership Athens for high school juniors. Adapt programming to virtual format when feasible and continue reaching clients
Mission & Goals
Objectives
Cooperative Extension
FY22 Budget C-26

Actual Forecast
FY18 FY19 FY20 FY21 FY22
Educational Classes Provided 746 1,215 353 500 500
Total Teaching Contacts 10,326 9,866 5,030 7,500 7,500
Soil Analysis Diagnostics 709 571 476 800 800
Water and Microbiology Diagnostics 184 138 155 150 150
Pathology, Plant & Insect ID 378 91 65 250 250
Radon Kits Distributed 28 26 24 30 20
Educational Newsletters Distributed 25,000 26,056 29,800 25,000 25,000
Phone, Office & Email Consultations 8,546 4,500 466 6,000 2,000
Home Visit Consultations 26 25 10 20 20
Education Exhibit Contacts 8,500 4,390 1,620 0 0
Social Media Posts 0 0 164 250 0
Social Media Circulation 0 0 35,530 45,000 0
The FY22 Budget of $231,000 for Cooperative Extension reflects no significant changes to services or
programs.
$2,861 is included for vehicle replacement charges. General Fund vehicle replacement charges were removed from the FY21 Budget by the Mayor and Commission and have been reinstated for FY22.
Salary and benefit changes are due to personnel turnover and reallocation of benefits applied by Human
Resources.
(All figures in $1,000s) FY20 FY21 FY22 FY22
Appropriations by Type Actual Budget Requested Approved $▲ %▲Salary & Benefits $158.4 $154.5 $169.8 $151.2 ($3.3) ‐2.1%
Operating $52.8 $84.4 $79.6 $80.0 ($4.4) ‐5.2%
Total $211.2 $238.9 $249.4 $231.2 ($7.7) ‐3.2%
FY22 FY22
FY20 FY21 Requested Approved ▲Fulltime Authorized Positions 1 1 1 1 0
Performance Measures
Budget Highlights
Appropriation Summary
Authorized Positions
Cooperative Extension
FY22 Budget C-27

Our mission is to fulfill the statutory requirements of the Coroner’s Office of Athens‐Clarke County in a manner
that is professional, efficient and compassionate to the citizens of Athens‐Clarke County.
Our goal is to manage the resources allocated to this office in a responsible manner that enables the Coroner’s
Office to provide caring and compassionate services in a time of crisis for the citizens of Athens‐Clarke County.
The Approved Budget for the Coroner’s Office includes budgeted funding from the General fund for;
$16,068 for a pay increase for the Coroner Position to bring it in line with peer positions.
$5,850 for morgue operational expenses to fully fund the projected morgue operations costs from the new
facility.
$2,104 for vehicle operations to fully fund the projected vehicle operations costs.
$1,633 for vehicle replacement charges to begin funding a portion of the vehicle replacement
contributions for public safety vehicles. This funding was shifted entirely to the SPLOST 2020 program
for FY20 and FY21.
Salary and benefit changes not included in the items above are due to reallocation of benefits applied by
Human Resources.
(All figures in $1,000s) FY20 FY21 FY22 FY22
Appropriations by Type Actual Budget Requested Approved $▲ %▲Salary & Benefits $18.8 $18.9 $36.0 $36.0 $17.1 90.5%
Operating $36.5 $38.1 $47.6 $47.6 $9.5 24.9%
Total $55.3 $57.0 $83.6 $83.6 $26.6 46.7%
FY22 FY22
FY20 FY21 Requested Approved ▲Fulltime Authorized Positions 0 0 0 0 0
Mission
Goals
Budget Highlights
Appropriation Summary
Authorized Positions
Coroner
FY22 Budget C-28

The mission of the Athens‐Clarke County Department of Corrections is to provide a humane and safe environment for staff, offenders, returning citizens, and the community at large through the use of modern correctional management techniques and supervision.
Comply fully with all Georgia Department of Corrections audit standards.
To clearly define (classification process) how offender skills development programs are to be used and supervised.
To provide ongoing mandated training for all Corrections’ staff and Athens‐Clarke County personnel that are supervising offenders and returning citizens.
To comply with all Athens‐Clarke County policies and procedures.
To maintain order and control of the offenders and returning citizens in our custody
To reduce offender drug usage through random drug testing.
To maintain sanitation standards and proper safety practices.
To provide security and safety inspections of all offender skills development program sites.
To provide meals at a reasonable cost to the Athens‐Clarke County Jail, County Correctional Institution and Diversion/Transition Center.
To prevent offender escapes and injuries to staff or offenders.
To fully meet health and sanitation standards for Food Service. Diversion Center: The mission of the Athens‐Clarke County Diversion/Transition Center is to provide quality cost‐effective management of non‐violent Athens‐Clarke county returning citizens, whose confinement in traditional incarceration would limit them from more quickly integrating into society, while at the same time building their skill sets that will encourage successfully re‐entering back into our community.
Create a secured, drug and alcohol free residential environment for returning citizens who would otherwise be incarcerated or subject to incarceration.
Encourage and assist returning citizens in developing strong work habits.
Provide returning citizens access to treatment, counseling, educational opportunities and related services.
Ensure returning citizens are held accountable for their crimes by requiring them to pay court ordered fines, fees and restitution.
Provide vocational and life skills training.
Ensure that parents failing to pay child support are able and obligated to work while providing them opportunities reconnect with their children.
Ensure returning citizens have a job within 30 days of entry into the program and maintain consistent employment during their sentence.
Provide opportunities for community service, in addition to the required employment, as ordered by the court and as an alternative to some fines.
Reduce participating returning citizen recidivism.
Score 100% on all Georgia Department of Corrections audits.
Score 100% on all health inspections.
Receive and classify offenders from the State of Georgia and the ACC Jail for skills development programs.
Reduce incidences of offender skills development program injuries to zero.
Maintain incidences of assaults with weapons at zero.
Mission & Goals
Objectives
Corrections
FY22 Budget C-29

Maintain offender escapes at zero.
Reduce the number of positive drug screen results from offenders and returning citizens to zero.
Provide mandated training for Corrections’ personnel and all Athens‐Clarke County personnel in other departments who supervise offender skills development programs.
Conduct daily safety and security inspections of offender skills development program sites.
Diversion Center:
Achieve 90% returning citizen occupancy rate.
80% of returning citizens will successfully complete available programs or skill development.
100% of returning citizens entering the Diversion/Transition Center will find jobs or be placed in a job relevant to their skills.
100% of employed returning citizens will make payment of fines, fees and per diem costs.
100% of returning citizens owing child support payments will maintain those payments.
100% of returning citizens will receive a monthly drug/alcohol screen. Additional screening will be made according to the returning citizen’s record and/or personal behavior.
Case workers and staff will visit returning citizens’ job sites and employers weekly or as necessary.
100% of returning citizens in need of education or skills development (GED, certification, technical certification, etc.) will be placed in an available program(s).
Zero walk‐aways from the Diversion/Transition Center.
Provide 40 hours of program relevant training to all staff.
Case workers to meet with returning citizens on their caseload a minimum of once a week.
Caseworkers to complete returning citizen assessments the same day of arrival.
Corrections
FY22 Budget C-30
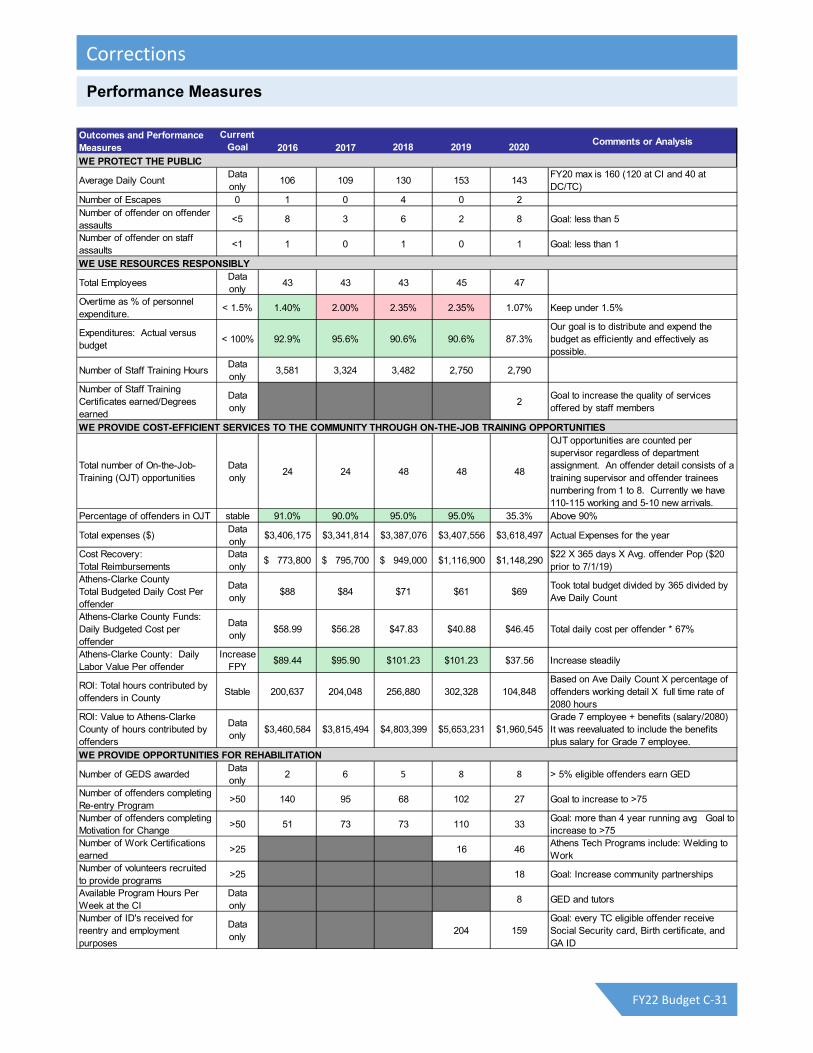
Outcomes and Performance Measures
Current Goal 2016 2017 2018 2019 2020
Comments or Analysis
WE PROTECT THE PUBLIC
Average Daily CountData only
106 109 130 153 143FY20 max is 160 (120 at CI and 40 at DC/TC)
Number of Escapes 0 1 0 4 0 2Number of offender on offender assaults
<5 8 3 6 2 8 Goal: less than 5
Number of offender on staff assaults
<1 1 0 1 0 1 Goal: less than 1
Total EmployeesData only
43 43 43 45 47
Overtime as % of personnel expenditure.
< 1.5% 1.40% 2.00% 2.35% 2.35% 1.07% Keep under 1.5%
Expenditures: Actual versus budget
< 100% 92.9% 95.6% 90.6% 90.6% 87.3%Our goal is to distribute and expend the budget as efficiently and effectively as possible.
Number of Staff Training HoursData only
3,581 3,324 3,482 2,750 2,790
Number of Staff Training Certificates earned/Degrees earned
Data only
2Goal to increase the quality of services offered by staff members
Total number of On-the-Job-Training (OJT) opportunities
Data only
24 24 48 48 48
OJT opportunities are counted per supervisor regardless of department assignment. An offender detail consists of a training supervisor and offender trainees numbering from 1 to 8. Currently we have 110-115 working and 5-10 new arrivals.
Percentage of offenders in OJT stable 91.0% 90.0% 95.0% 95.0% 35.3% Above 90%
Total expenses ($)Data only
3,406,175$ 3,341,814$ 3,387,076$ 3,407,556$ 3,618,497$ Actual Expenses for the year
Cost Recovery: Total Reimbursements
Data only
773,800$ 795,700$ 949,000$ 1,116,900$ 1,148,290$ $22 X 365 days X Avg. offender Pop ($20 prior to 7/1/19)
Athens-Clarke County Total Budgeted Daily Cost Per offender
Data only
$88 $84 $71 $61 $69Took total budget divided by 365 divided by Ave Daily Count
Athens-Clarke County Funds: Daily Budgeted Cost per offender
Data only
$58.99 $56.28 $47.83 $40.88 $46.45 Total daily cost per offender * 67%
Athens-Clarke County: Daily Labor Value Per offender
Increase FPY
$89.44 $95.90 $101.23 $101.23 $37.56 Increase steadily
ROI: Total hours contributed by offenders in County
Stable 200,637 204,048 256,880 302,328 104,848Based on Ave Daily Count X percentage of offenders working detail X full time rate of 2080 hours
ROI: Value to Athens-Clarke County of hours contributed by offenders
Data only
3,460,584$ 3,815,494$ 4,803,399$ 5,653,231$ 1,960,545$ Grade 7 employee + benefits (salary/2080) It was reevaluated to include the benefits plus salary for Grade 7 employee.
Number of GEDS awardedData only
2 6 5 8 8 > 5% eligible offenders earn GED
Number of offenders completing Re-entry Program
>50 140 95 68 102 27 Goal to increase to >75
Number of offenders completing Motivation for Change
>50 51 73 73 110 33Goal: more than 4 year running avg Goal to increase to >75
Number of Work Certifications earned
>25 16 46Athens Tech Programs include: Welding to Work
Number of volunteers recruited to provide programs
>25 18 Goal: Increase community partnerships
Available Program Hours Per Week at the CI
Data only
8 GED and tutors
Number of ID's received for reentry and employment purposes
Data only
204 159Goal: every TC eligible offender receive Social Security card, Birth certificate, and GA ID
WE PROVIDE COST-EFFICIENT SERVICES TO THE COMMUNITY THROUGH ON-THE-JOB TRAINING OPPORTUNITIES
WE PROVIDE OPPORTUNITIES FOR REHABILITATION
WE USE RESOURCES RESPONSIBLY
Performance Measures
Corrections
FY22 Budget C-31
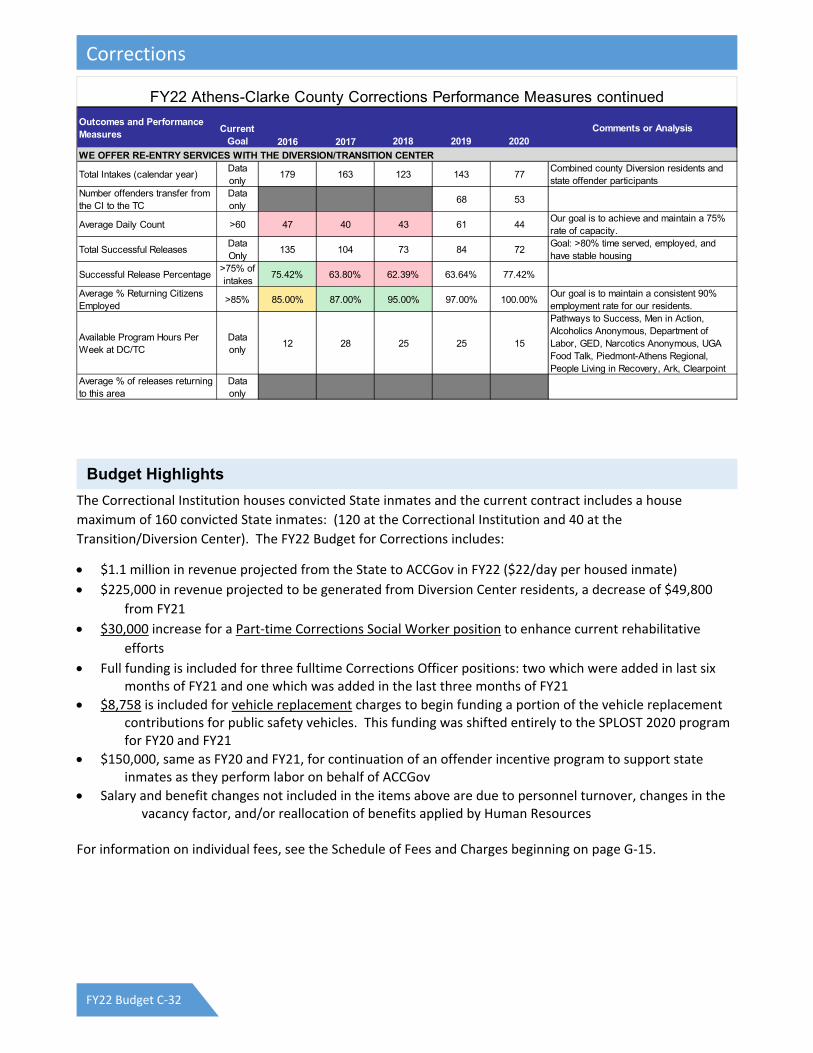
The Correctional Institution houses convicted State inmates and the current contract includes a house
maximum of 160 convicted State inmates: (120 at the Correctional Institution and 40 at the
Transition/Diversion Center). The FY22 Budget for Corrections includes:
$1.1 million in revenue projected from the State to ACCGov in FY22 ($22/day per housed inmate)
$225,000 in revenue projected to be generated from Diversion Center residents, a decrease of $49,800
from FY21
$30,000 increase for a Part‐time Corrections Social Worker position to enhance current rehabilitative
efforts
Full funding is included for three fulltime Corrections Officer positions: two which were added in last sixmonths of FY21 and one which was added in the last three months of FY21
$8,758 is included for vehicle replacement charges to begin funding a portion of the vehicle replacementcontributions for public safety vehicles. This funding was shifted entirely to the SPLOST 2020 program for FY20 and FY21
$150,000, same as FY20 and FY21, for continuation of an offender incentive program to support stateinmates as they perform labor on behalf of ACCGov
• Salary and benefit changes not included in the items above are due to personnel turnover, changes in the vacancy factor, and/or reallocation of benefits applied by Human Resources
For information on individual fees, see the Schedule of Fees and Charges beginning on page G‐15.
Outcomes and Performance Measures
Current Goal 2016 2017 2018 2019 2020
Comments or Analysis
Total Intakes (calendar year)Data only
179 163 123 143 77Combined county Diversion residents and state offender participants
Number offenders transfer from the CI to the TC
Data only
68 53
Average Daily Count >60 47 40 43 61 44Our goal is to achieve and maintain a 75% rate of capacity.
Total Successful ReleasesData Only
135 104 73 84 72Goal: >80% time served, employed, and have stable housing
Successful Release Percentage>75% ofintakes
75.42% 63.80% 62.39% 63.64% 77.42%
Average % Returning Citizens Employed
>85% 85.00% 87.00% 95.00% 97.00% 100.00%Our goal is to maintain a consistent 90% employment rate for our residents.
Available Program Hours Per Week at DC/TC
Data only
12 28 25 25 15
Pathways to Success, Men in Action, Alcoholics Anonymous, Department of Labor, GED, Narcotics Anonymous, UGA Food Talk, Piedmont-Athens Regional, People Living in Recovery, Ark, Clearpoint
Average % of releases returning to this area
Data only
WE OFFER RE-ENTRY SERVICES WITH THE DIVERSION/TRANSITION CENTER
FY22 Athens-Clarke County Corrections Performance Measures continued
Budget Highlights
Corrections
FY22 Budget C-32

(All figures in $1,000s) FY20 FY21 FY22 FY22
Appropriations by Type Actual Budget Requested Approved $▲ %▲Salary & Benefits $2,919.9 $3,079.9 $3,261.0 $3,251.0 $171.1 5.6%
Operating $734.8 $995.2 $1,013.0 $1,008.0 $12.8 1.3%
Total $3,654.7 $4,075.1 $4,274.0 $4,259.0 $183.9 4.5%
FY20 FY21 FY22 FY22
Appropriations by Division Actual Budget Requested Approved $▲ %▲Administration $411.3 $535.0 $475.4 $475.4 ($59.6) ‐11.1%
Food Services $449.2 $612.7 $612.1 $602.1 ($10.6) ‐1.7%
Security Operations $1,738.6 $1,714.1 $1,793.7 $1,788.7 $74.6 4.4%
Diversion Center $1,055.6 $1,213.3 $1,392.7 $1,392.7 $179.4 14.8%
Total $3,654.7 $4,075.1 $4,273.9 $4,258.9 $183.8 4.5%
FY20 FY21 FY22 FY22
Appropriations by Fund Actual Budget Requested Approved $▲ %▲General Fund $3,598.5 $4,025.1 $4,223.9 $4,208.9 $183.8 4.6%
Corrections Inmate Fund $51.9 $50.0 $50.0 $50.0 $0.0 0.0%
Grants Fund $4.3 $0.0 $0.0 $0.0 $0.0 ‐‐
Total $3,654.7 $4,075.1 $4,273.9 $4,258.9 $183.8 4.5%
FY22 FY22
FY20 FY21 Requested Approved ▲Fulltime Authorized Positions 45 48 48 48 0
(all numbers in thousands of dollars) 5 ‐ Year CIP
Capital Appropriations
FY20
Year End
Balance
FY21
Budget
FY22
Approved
FY23‐FY26
Proposed
FY27‐31
ProposedGeneral Capital Projects FundCurrent ServicesD‐45 Food Service Equipment Life Cycle Replacement 30.2 20.0 20.0 80.0 30.0D‐46 N Officer Portable Radio and Charging Station Purchase ‐ ‐ 10.0 40.0 10.0
D‐47 N Corrections Institution Building Renovation and Life Safety
Equipment Installation
‐ ‐ ‐ 1,227.3 ‐
Current Services Total 30.2 20.0 30.0 1,347.3 40.0
Appropriation Summary
Capital Budgets, 5-Year CIP and Project Forecast
Authorized Positions
Corrections
FY22 Budget C-33

Debt Service includes the Government’s payments for Guaranteed Revenue Debt, Revenue Bonds, and other
long‐term liabilities.
General Fund – This budget includes $541,700 of funding for annual debt service for the bonds issued in
2011 to finance a portion of the Washington Street Building and $501,900 for principal and interest on
the debt service for the bonds issued in 2012 for the site improvements for the Caterpillar Project. The
budgeted payments include $13,000 in bond fees. A GMA Lease was incurred for Munis Software in
2020. The budget includes $258,539 for principal and interest on the debt service.
SPLOST Debt Service Fund – The $3.1 million budget for debt service and fees represents the debt
incurred after the approval of SPLOST 2020.
TSPLOST Fund – The $2.1 million budget for debt service and fees represents the debt incurred after the
approval of TSPLOST 2018.
Airport Fund – This Budget includes $13,553 for the interest payments for the notes issued to finance two
projects at the Airport. The first project financed the construction of T‐Hangars in 2003; the second
project financed Executive Hangars in 2009. The Airport Enterprise Fund is responsible for the
repayment of these notes. Including principal and interest, the total debt payments for FY22 will be
$108,243.
Landfill Fund – $104,300 is included in the budget for the Landfill Fund for debt interest and bond fees
related to the construction of Phase V Cell 1A‐1B. Total FY22 debt payments for principal and interest
are estimated to total $692,559.
Water & Sewer Fund – The budget for the Water and Sewer Enterprise Fund includes $9,075,556 for the
interest component of debt service to repay the bonds refunded in 2015 to upgrade and expand the
three water reclamation facilities and two notes issued through the State of Georgia Environmental
Finance Authority (GEFA) in 2007 and 2009. There was a decrease in the Budget for FY17 as the result
of the refinancing of the 2008 bonds in May, 2015. Total FY22 debt service and fees for the Water and
Sewer Enterprise Fund will be $16.6 million.
Internal Support Fund – The $269,500 budget represents the fourth year of a five year capital lease for the
new voice over IP (VOIP) phone system that was installed in FY19.
(All figures in $1,000s) FY20 FY21 FY22 FY22
Appropriations by Fund Actual Budget Requested Approved $▲ %▲General Fund $1,050.3 $1,312.4 $1,315.1 $1,315.1 $2.7 0.2%
Public Facility Auth. Fund $529.2 $524.8 $0.0 $0.0 ($524.8) ‐100.0%
SPLOST Debt Service Fund $38.5 $3,702.2 $3,074.3 $3,074.3 ($627.9) ‐17.0%
Airport Fund $18.1 $15.1 $13.6 $13.6 ($1.5) ‐9.9%
Landfill Fund $131.7 $104.3 $104.3 $104.3 $0.0 0.0%
Water & Sewer Fund $9,445.6 $9,075.6 $9,075.6 $9,075.6 $0.0 0.0%
Internal Support Fund $31.8 $262.2 $269.4 $269.4 $7.2 2.7%
Fleet Replacement Fund $32.8 $0.0 $0.0 $0.0 $0.0 ‐‐
Total $11,278.0 $14,996.6 $13,852.3 $13,852.3 ($1,144.3) ‐7.6%
Mission
Budget Highlights
Appropriation Summary
Debt Service
FY22 Budget C-34

The Western Judicial Circuit District Attorney Office keeps the community safe by holding those accountable
for committing crimes and causing harm; by providing services that protect and preserve the rights of victims
and defendants; and by building and maintaining partnerships with other law enforcement agencies,
community organizations and government entities. After careful consideration of the facts, the evidence, the
circumstances, the law, and the desired outcome for a just resolution, we follow the principles of fair and just
prosecution, balancing the community’s needs for offender accountability and restorative justice.
A community in which crime, suffering, and inequity are reduced and just resolutions for both victims and
defendants are guided by the belief that every decision and action we make has long‐lasting consequences.
The Office of the District Attorney serves primarily as the prosecuting attorney in the Superior Court of Athens‐
Clarke and Oconee Counties. In Athens‐Clarke County, the District Attorney is responsible for the prosecution
of all criminal cases involving at least one felony charge. Additionally, there is a responsibility to pursue, when
appropriate, certain civil actions such as RICO, drug, gambling, and bond forfeitures. The District Attorney also
serves as the prosecuting attorney in the Juvenile Court in those instances when a child (less than 17 years of
age) is accused of a delinquent and/or unruly act. In addition, the District Attorney represents the State of
Georgia in the Georgia Supreme Court and Georgia Court of Appeals in those cases arising out of this
jurisdiction. Lastly, the District Attorney’s Office handles preliminary hearings and special bond hearings in
Magistrate Court, operates a Pretrial Diversion Program, and staffs three alternative courts – a Drug Court
Program, Treatment and Accountability Court, and a Veteran’s Court.
Prioritize the prosecution of Serious Violent Felonies and those involving Special Victims (Sexual Assault &
Trafficking, Child Abuse/Molestation, Domestic Violence and Elder Abuse)
Prioritize juvenile justice through collaboration with community stakeholders and youth development
organizations, supporting a Youth Accountability Court, and implementing restorative practice
initiatives.
Research, design and implement a data transparency project including the development of a website with
a publicly‐accessible data dashboard.
Continuous evaluation and review of office policies and protocols.
Restructure the office to better meet the needs of the community we serve and ensure fiscal
responsiveness, and effective use of resources.
Ensure training opportunities for prosecutors, investigators and victim advocates on issues such as
restorative sentencing, trauma‐informed prosecution, trauma‐informed advocacy, combating human
trafficking and gang violence; and other related matters.
Implement a process to better screen and triage cases during intake to ensure a focus on serious crimes
including a more streamlined process transfer of cases process between the Solicitor General and
District Attorney offices.
Mission
Vision
Function
Objectives
District Attorney
FY22 Budget C-35

Create and implement a plan to collaborate with other law enforcement agencies and community
organizations to combat gun violence and drug distribution in our community.
Ensure the review and update completion of the Western Judicial Circuit Child Abuse Protocol and the
Sexual Assault Response Protocol.
Complete a physical space utilization assessment and implement a plan for more effective productivity.
Continue with Phase II of an Audit of the DA’s office.
Actual Forecast
CY18 CY19 CY18 CY19 CY18
New Felony Cases Received 1,601 1,463 1,382 1,500 1,600
Dismissals (incl. PTP Dismissals) 143 114 188 130 145
Transfers to Solicitor‐General 54 44 53 50 55
Superior Court
Bond Hearings 981 928 1,129 995 1,062
Arraignments 1,865 1,479 914 1,675 1,700
Motion Hearings 299 184 269 300 350
Status Conferences 966 1,177 939 1,200 1,250
Jury Trials
Cases Scheduled for Trial 1238 1,041 259 1,150 1,250
Number of Jury Trials 31 22 3 36 40
Number of Days in Trial 116 77 11 145 150
Average Days / Trial 3.74 3.5 3.6 4 5
Number of ADA Days in Trial 236 149 6 250 300
Probation Cases Filed 1,052 1,141 912 1,200 1,300
Probation Status Conferences 1,290 1,451 1,141 1,500 1,600
Juvenile Court
Delinquent Cases Filed 847 784 671 785 800
Traffic 87 58 33 60 65
Subpoenas Issued and Served (by DA Investigators) 16,109 13,055 2,990 14,000 15,000
Victim Assistance
Total Active Victims Served 2,961 3,363 4,677 5,000 5,550
Total Victim Services Provided 40,539 37,083 66,792 75,000 70,000
Civil Forfeiture Actions
Opened 48 59 48 65 70
Closed 36 64 55 70 75
The FY22 Budget for the District Attorney’s Office includes:
$33,000 for an additional fulltime ADA/External Relations position (6 months).
$30,000 for an additional Administrative Assistant position.
The District Attorney requested $28,300 to restore reductions that were taken by the Mayor and
Commission in FY10 and FY12. The District Attorney also requested $7,900 for uniforms and equipment
Performance Measures
Budget Highlights
District Attorney
FY22 Budget C-36

and $22,600 for increases to various operating accounts. These requested increases for current services
were not recommended nor approved.
The District Attorney also requested $10,000 for a public transparency project/website and $8,000 for a
pay increase for the Chief Investigator position. These requests were not recommended nor approved.
Salary and benefit changes are due to personnel turnover, changes in the vacancy factor, and/or
reallocation of benefits applied by Human Resources.
The District Attorney’s Office includes 11 fulltime positions in the Special Programs Fund that are paid for
by reimbursements from Oconee County.
There are also two fulltime victim assistance positions in the Special Programs Fund that are funded from
5% fine add‐on revenues.
(All figures in $1,000s) FY20 FY21 FY22 FY22
Appropriations by Type Actual Budget Requested Approved $▲ %▲Salary & Benefits $2,044.1 $2,100.0 $2,202.5 $2,146.5 $46.5 2.2%
Operating $115.0 $106.2 $178.9 $110.1 $3.9 3.7%
Total $2,159.1 $2,206.2 $2,381.4 $2,256.6 $50.4 2.3%
FY20 FY21 FY22 FY22
Appropriations by Division Actual Budget Requested Approved $▲ %▲District Attorney $1,983.3 $2,027.8 $2,208.5 $2,083.7 $55.9 2.8%
Victim Assistance $175.8 $178.4 $172.9 $172.9 ($5.5) ‐3.1%
Total $2,159.1 $2,206.2 $2,381.4 $2,256.6 $50.4 2.3%
FY20 FY21 FY22 FY22
Appropriations by Fund Actual Budget Requested Approved $▲ %▲General Fund $1,364.0 $1,387.4 $1,534.8 $1,410.0 $22.6 1.6%
Special Programs Fund $795.1 $818.9 $846.5 $846.5 $27.6 3.4%
Total $2,159.1 $2,206.3 $2,381.3 $2,256.5 $50.2 2.3%
FY22 FY22
FY20 FY21 Requested Approved ▲Fulltime Authorized Positions 28 28 30 30 2
Appropriation Summary
Authorized Positions
District Attorney
FY22 Budget C-37

Athens‐Clarke County, an open and responsive government, will facilitate a positive environment for
individuals to obtain a high quality of life and local organizations to achieve success by providing innovative,
high‐quality services and responsible stewardship of the community’s resources, to benefit current and future
generations.
Fundamental to Athens‐Clarke County’s high quality of life for individuals and success of local organizations is
an environment conducive to economic prosperity and opportunity.
Therefore, the mission of the Economic Development Department is to facilitate economic growth through
support, outreach, and partnerships. We respect Athens’ unique character and endeavor to build a stronger
community than that which was entrusted to us.
Identify and recruit economic development opportunities that support and enhance Athens‐Clarke County’s
quality of life, increase the tax base and provide opportunities for sustained, livable wages for workers;
Provide site location assistance to domestic and international companies planning new or expanded facilities;
assistance shall include but not limited to identifying financial and human resources available to support such
developments;
Utilize marketing media and outreach efforts to promote the competitive advantages to businesses and
industries of choosing to locate in Athens‐Clarke County;
Support businesses and industries currently operating within Athens‐Clarke County by strengthening
relationships and encouraging re‐investment and job creation utilizing various economic development tools
and resources;
Coordinate where appropriate with local entities with an economic development interest that may include the
Athens Area Chamber of Commerce, the University of Georgia, the Classic Center, the Convention and Visitors
Bureau, the SBDC and others to promote entrepreneurship, tourism and community development; also for the
purpose of receiving assistance with economic development recruitment efforts managed by the Department;
Maintain a current inventory of facilities and properties available for industrial/business development; develop
recommendations for strategies to meet emerging infrastructure and natural resource needs to support future
industrial and business development;
Support development through the coordination of various departments and by offering innovative results
oriented solutions to the development process in Athens‐Clarke County;
Utilize all available economic development tools to put Athens‐Clarke County in a position to be developed
responsibly and to the highest and best use.
Mission
Goals
Economic Development
FY22 Budget C-38

Support
Attend all meetings of the Atlanta Highway, Lexington Highway, and Prince Avenue Corridor Committees
and provide information regarding any available economic development tools and feedback/suggestions
for redevelopment.
Lead 100% of visioning meetings and garner feedback about their experience with process.
Actively market and share information regarding the state Opportunity Zone tax credit with businesses
located within the state OZs.
Partner with the private sector to deliver an inclusive and accessible space for the entrepreneurial
community to utilize for innovation and growth.
Outreach
Target 30 new projects in FY21 by maintaining contact with appropriate stakeholders and seeking out any
potential for the area.
Host one state project manager event.
Participate in 6 speaking engagements to various civic, social, neighborhood, social, and business groups in
FY22 to update the community on various economic development initiatives and news.
Engage in 24 outreach visits to real estate developers, site selection consultants, and project managers.
Engage in 12 client meetings with key brokers, site selection consultants, and project managers.
Attend 3 conferences to seek out opportunity and to remain knowledgeable of any new or changing
economic development programs or tools.
Make 24 existing industry visits to employers in Athens‐Clarke County.
Partnerships
Continue to partner and support the University of Georgia where appropriate to bolster the
entrepreneurship and creative community in Athens by engaging in 3 student projects and participating in
mentorship & internship programs.
Participate in the Manufacturer’s Roundtable meetings and workforce subcommittee meetings to
harmonize with local educational system, industry, and community partners in the ongoing work to align
the curriculum relevant to industry’s current and future workforce needs.
Assist with launching new Manufacturer's Human Resources Committee and support the group in working
on projects they identify.
Participate in 6 events in partnership with groups in the entrepreneurial community.
Objectives
Economic Development
FY22 Budget C-39

Economic Development operates with funding from the General Fund and the Hotel/Motel Fund.
The Approved Budget for Economic Development includes budgeted funding for;
$250,000 for the Athens Community Corps to fully fund the program in FY22 in concert with the previously
allocated funding and to continue the program. The program is budgeted in the ARP Fund as a
“Revenue Replacement” item.
$50,000 for a Joint Development Authority. $38,130 is budgeted in the ARP Fund as a “Revenue
Replacement” item and $11,870 is included in the General Fund.
The Approved Budget for Economic Development includes budgeted funding from the Tax Allocation District
Funds for;
$65,000 for a Tax Allocation District Specialist allocated by estimated revenue to assist with the 6 new Tax
Allocation Districts.
$25,000 to Facilitate the Tax Allocation District Advisory Committee Formation to engage a consultant to
manage this process, under the supervision and with the participation of Economic Development.
$15,000 to Update Redevelopment Plans to apply to renew to the 7 Opportunity Zone designations with
the GA Department of Community Affairs.
Salary and benefit changes not included in the items above are due to performance management pay,
personnel turnover, changes in the vacancy factor, and/or reallocation of benefits applied by Human
Resources.
Performance MeasureAnnual
GoalFY17 FY18 FY19 FY20
FY21 YTD
FY22 Comments
New Projects: Recruitments or Expansions 20 18 20 20 X 9
# Announcements of Recruitments or Expansions 2 3 2 2 2 1FY21 YTD: ByoPlanet Expansion (12-2020)
# Jobs Created from Incentivized ProjectsIncrease
YOY/ / / New
Avg Annual Wage of Incentivized ProjectsIncrease
YOY/ / / / New
# Visioning Meetings Facilitated, in Collaboration with ACC Plans Review Depts.
12 / / / / New
# Opportunity Zone Applications Certified & Submitted to GA DCA for Review
12 / / / / New
# Existing Business Retention Visits 25 18 25 25 X 6
# Existing Businesses Connected with GDEcD for Potenti 15 / / / / New
# Visits with State Project Partners: GDEcD Project Mana 25 / / / / New
# Presentations to Community Groups 10 / / / / New
# Visits with Workforce-Related Communiy Stakeholders / Organizations
36 / / / / New
Attract, Create, Expand, and Retain Businesses through Support & Assistance
Outreach & Relationship-Building
Performance Measures
Budget Highlights
Economic Development
FY22 Budget C-40

(All figures in $1,000s) FY20 FY21 FY22 FY22
Appropriations by Type Actual Budget Requested Approved $▲ %▲Salary & Benefits $275.0 $381.9 $715.7 $730.7 $348.8 91.3%
Operating $360.8 $343.9 $411.5 $446.5 $102.6 29.8%
Total $635.8 $725.8 $1,127.2 $1,177.2 $451.4 62.2%
FY20 FY21 FY22 FY22
Appropriations by Fund Actual Budget Requested Approved $▲ %▲General Fund $458.2 $551.1 $847.2 $624.1 $73.0 13.2%
Hotel/Motel Fund $177.6 $115.0 $115.0 $100.0 ($15.0) ‐13.0%
Special Programs Fund $0.0 $59.7 $60.0 $60.0 $0.3 0.5%
ARP Fund $0.0 $0.0 $0.0 $288.1 $288.1 ‐‐
Tax Allocation Districts $0.0 $0.0 $105.0 $105.0 $105.0 ‐‐
Total $635.8 $725.8 $1,127.2 $1,177.2 $451.4 62.2%
FY22 FY22
FY20 FY21 Requested Approved ▲Fulltime Authorized Positions 5 5 6 6 1
Appropriation Summary
Authorized Positions
Economic Development
FY22 Budget C-41
The Finance Department supports the Manager’s Office by guiding the government’s financial operations. It employs conservative fiscal policies emphasizing financial stability and resilience. The department collects and processes data, advises management in financial matters, provides information to various stakeholders, monitors budgetary trends, and provides various financial reports. Focus areas include:
Commitment to Transparency and Reliable Financial Reports
Monitoring Budgetary and Financial Trends
Proactive Management
Revenue Diversity
Balanced Budget
Prepare Annual Financial Reports (AFR) and Annual Budget Documents that serve as policy documents,
financial plans and communication tools.
Ongoing budget review process in order to realign budget appropriations with unexpected trends.
Utilize multi‐year financial forecasting, including operating trends, the future operational impact of proposed capital projects and the five‐year capital improvement program to identify future challenges and opportunities.
Provide management information regarding revenue diversity.
Assist the Manager’s Office with providing a balanced budget document to the Mayor and Commission.
File AFR and Annual Budget Documents with required recipients within the timeframe required by state
law and receive formal, external recognition for financial reporting excellence (from the Government Finance Officers Association for the AFR). Receive “Unmodified” (clean) independent audit opinion letters (AFR).
Provide management with information necessary to maintain stable General Obligation and Public Utility bond ratings.
Provide financial reports (monthly, quarterly and as needed) to management. Assist management with budgetary decisions through accurate General Fund revenue estimates and forecasting of unassigned fund balance under various scenarios.
Mission
Goals
Objectives
Finance
FY22 Budget C-42

Performance Measures
Finance
FY22 Budget C-43

The FY22 Budget of $2.5 million for Finance reflects no significant changes to services or programs.
Salary and benefit changes are due to personnel turnover and/or reallocation of benefits applied by Human
Resources.
For information on individual fees, see the Schedule of Fees and Charges beginning on page G‐15.
(All figures in $1,000s) FY20 FY21 FY22 FY22
Appropriations by Type Actual Budget Requested Approved $▲ %▲Salary & Benefits $1,963.1 $2,237.3 $2,290.5 $2,280.5 $43.2 1.9%
Operating $202.0 $227.7 $227.7 $227.7 $0.0 0.0%
Total $2,165.1 $2,465.0 $2,518.2 $2,508.2 $43.2 1.8%
FY20 FY21 FY22 FY22
Appropriations by Division Actual Budget Requested Approved $▲ %▲Administration $440.8 $520.0 $528.8 $528.8 $8.8 1.7%
Financial Services $503.3 $588.6 $595.9 $590.9 $2.3 0.4%
Accounting $455.8 $458.5 $472.4 $472.4 $13.9 3.0%
Budget Management $327.8 $347.7 $355.2 $355.2 $7.5 2.2%
Purchasing $437.6 $550.2 $565.9 $560.9 $10.7 1.9%
Total $2,165.3 $2,465.0 $2,518.2 $2,508.2 $43.2 1.8%
FY22 FY22
FY20 FY21 Requested Approved ▲Fulltime Authorized Positions 28 29 29 29 0
Budget Highlights
Appropriation Summary
Authorized Positions
Finance
FY22 Budget C-44

Athens‐Clarke County Fire & Emergency Services Department takes pride in providing prompt, dependable,
and professional services to reduce the impact of emergencies in our community with dedication to education
and training.
• Achieve an average turnout time of 80 seconds for fire and special operations emergency responses.• Achieve an average turnout time of 60 seconds for medical emergency responses.• Assemble a minimum of 15 personnel on the scene of structure fires within 8 minutes of dispatch, 90% of
the time. • Meet the department’s FY22 property inspection schedule for all properties on file as of July 1, 2021.• Provide fire safety information to 75% of all kindergarten through grade 3 students, public and private.
(6,028 of 8,038 students) • Achieve 85% compliance for fire code violations within thirty (30) days of issuance of a Notice of Violation.• Review 100% of all non‐one/two family construction plans for code compliance prior to issuance of a
Certificate of Occupancy. • Perform all fire & life safety inspections on new construction projects within five (5) business days of
notification by the Building Inspection Department. • Conduct cause and origin examinations on all suspicious structure fires and all fires with civilian injuries or
fatalities; identifying fire cause factors and responsible agents of fire events. • Conduct pre‐planning and building familiarization inspections at least once every year for all non‐one/two
family dwelling buildings within our jurisdiction. • Conduct annual training required by ISO to maintain our fire protection class to include: 8 half day drills, 4
half day multi‐company drills, 2 night drills, 20 hours per member of company training, 12 hours per member of officer training, 4 half day trainings on driver and operator training, 40 hours of new driver training, 1 half day training on radioactivity or hazardous materials, and a minimum of 240 hours of new recruit training for new firefighters.
• Annually provide at least the minimum training hours as required by the Georgia Firefighter Standards andTraining Council, American Heart Association, and the Georgia Department of Public Health to recertify our personnel for the following certifications based on personnel assignments; Firefighter (24 hours), Hazmat (24 hours), Technical Rescue: Search & rescue/ Water rescue/ Rope rescue/Structural Collapse search and rescue/Confined space search and rescue/Wilderness search and rescue/(24 hours), Fire Inspector (24 hours), Fire Investigator (24 hours), CPR (4 hours), EMT (20 hours).
• Conduct at least twelve (12) hours of Auto/Mutual Aid training in FY22 with affected ACCFES companies incompliance with agreements and ISO requirements.
• Increase community awareness of ACCFES services through social media efforts to increase ourfollowers/likes by 5% in FY22.
• Increase the number of certified EMTs by 15 in FY22 within the Department to improve the level ofcare/service for emergencies.
• Strengthen the existing false alarm ordinance to be reasonable and enforceable to reduce the number offalse alarms by 10% in FY22.
• Meet 100% of the Storm Ready Community requirements to maintain certification.
• Review NIMS requirements for 100% of ACCUG departments and develop plan for compliance.
• Meet 100% compliance with Emergency Management Performance Grant for FY22
• Fill all requirement administrative positions for LEPC and begin formation of sub committees by close ofFY22
Mission
Goals
Fire & Emergency Services
FY22 Budget C-45
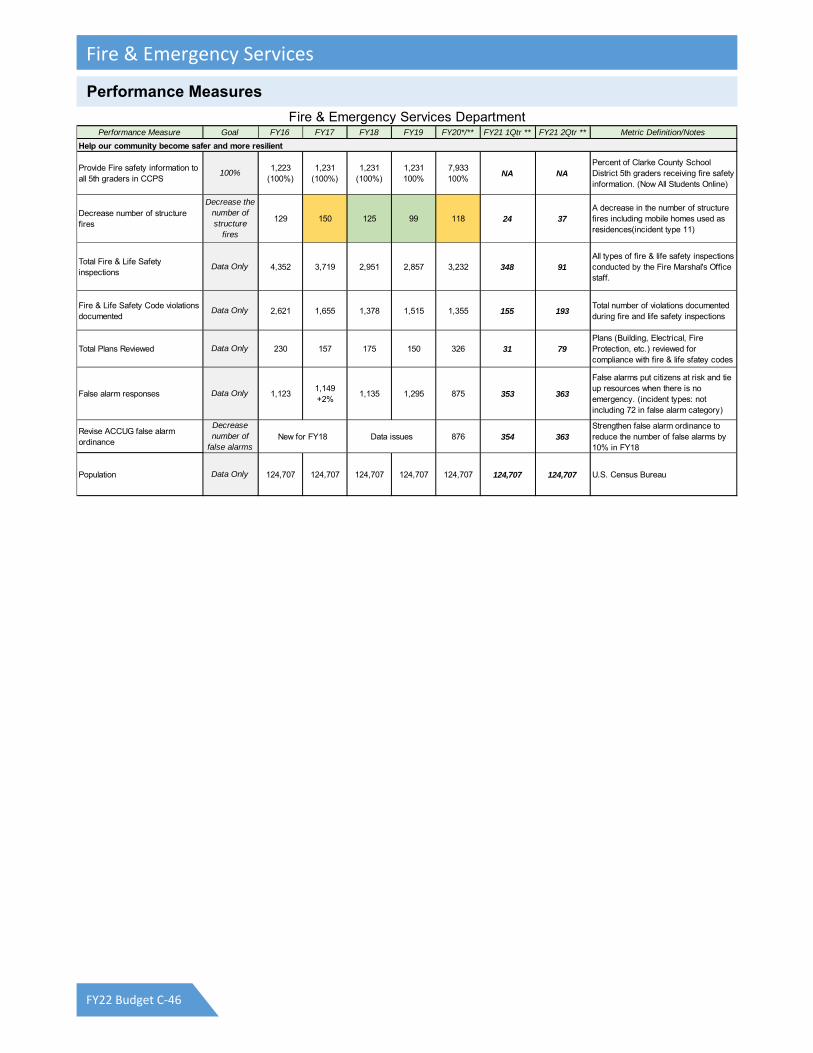
Performance Measure Goal FY16 FY17 FY18 FY19 FY20*/** FY21 1Qtr ** FY21 2Qtr ** Metric Definition/Notes
Provide Fire safety information to all 5th graders in CCPS
100%1,223
(100%)1,231
(100%)1,231
(100%)1,231 100%
7,933 100%
NA NAPercent of Clarke County School District 5th graders receiving fire safety information. (Now All Students Online)
Decrease number of structure fires
Decrease the number of structure
fires
129 150 125 99 118 24 37A decrease in the number of structure fires including mobile homes used as residences(incident type 11)
Total Fire & Life Safety inspections
Data Only 4,352 3,719 2,951 2,857 3,232 348 91All types of fire & life safety inspections conducted by the Fire Marshal's Office staff.
Fire & Life Safety Code violations documented
Data Only 2,621 1,655 1,378 1,515 1,355 155 193Total number of violations documented during fire and life safety inspections
Total Plans Reviewed Data Only 230 157 175 150 326 31 79Plans (Building, Electrical, Fire Protection, etc.) reviewed for compliance with fire & life sfatey codes
False alarm responses Data Only 1,1231,149 +2%
1,135 1,295 875 353 363
False alarms put citizens at risk and tie up resources when there is no emergency. (incident types: not including 72 in false alarm category)
Revise ACCUG false alarm ordinance
Decrease number of
false alarms876 354 363
Strengthen false alarm ordinance to reduce the number of false alarms by 10% in FY18
Population Data Only 124,707 124,707 124,707 124,707 124,707 124,707 124,707 U.S. Census Bureau
Data issues
Fire & Emergency Services Department
Help our community become safer and more resilient
New for FY18
Performance Measures
Fire & Emergency Services
FY22 Budget C-46

The FY22 Budget for Fire & Emergency Services includes the following funding from the General Fund:
• $80,000 increase for a program to enhance recruitment, workforce development and diversity
• $23,000 increase for annual Self‐Contained Breathing Apparatus (SCBA) Testing to ensure safetyof equipment protecting Firefighters
$293,244 is included for vehicle replacement charges to begin funding a portion of the vehiclereplacement contributions for public safety vehicles. This funding was shifted entirely to the SPLOST 2020 program for FY20 and FY21
• The FY22 Budget of $14.9 million reflects no other significant changes to the department
Salary and benefit changes are due to personnel turnover, changes in the vacancy factor, and/or reallocation
of benefits applied by Human Resources.
Performance Measure Goal FY16 FY17 FY18 FY19 FY20*/** FY21 1Qtr ** FY21 2Qtr ** Metric Definition/Notes
Fire & Emergency Services Department
Budget Highlights
Fire & Emergency Services
FY22 Budget C-47

(All figures in $1,000s) FY20 FY21 FY22 FY22
Appropriations by Type Actual Budget Requested Approved $▲ %▲Salary & Benefits $13,257.9 $13,419.1 $14,291.6 $13,407.5 ($11.6) ‐0.1%
Operating $1,023.8 $1,058.2 $1,579.8 $1,454.5 $396.3 37.5%
Total $14,281.7 $14,477.3 $15,871.4 $14,862.0 $384.7 2.7%
FY20 FY21 FY22 FY22
Appropriations by Division Actual Budget Requested Approved $▲ %▲Administration $262.0 $234.6 $465.2 $369.6 $135.0 57.5%
Fire Prevention $689.9 $701.4 $688.3 $667.6 ($33.8) ‐4.8%
Fire Suppression $13,329.8 $13,541.3 $14,717.9 $13,824.8 $283.5 2.1%
Total $14,281.7 $14,477.3 $15,871.4 $14,862.0 $384.7 2.7%
FY22 FY22
FY20 FY21 Requested Approved ▲Fulltime Authorized Positions 187 187 193 187 0
(all numbers in thousands of dollars) 5 ‐ Year CIP
Capital Appropriations
FY20
Year End
Balance
FY21
Budget
FY22
Approved
FY23‐FY26
Proposed
FY27‐31
ProposedGeneral Capital Projects FundCurrent ServicesD‐48 N Fire Apparatus Replacement ‐ Rescue Unit ‐ ‐ ‐ 396.0 ‐D‐49 N Fire Apparatus Replacement ‐ Ladder 7 ‐ ‐ ‐ 732.0 915.0D‐50 Replace Mobile Data Terminals 154.3 50.0 50.0 200.0 250.0D‐54 N Hose & Appliances ‐ ‐ 25.0 ‐ ‐Current Services Total 154.3 50.0 75.0 1,328.0 1,165.0
Additions & ImprovementsD‐51 N Renovate and Expand Fire Training Center ‐ ‐ ‐ 1,391.0 ‐D‐52 N Diversity and Workforce Development Project ‐ ‐ ‐ 140.8 110.0D‐53 N Construct Emergency Operations Center ‐ ‐ ‐ 719.5 ‐Additions and Improvements Total ‐ ‐ ‐ 2,251.3 110.0
Capital Appropriations Total 154.3 50.0 75.0 3,579.3 1,275.0
Appropriation Summary
Capital Budgets, 5-Year CIP and Project Forecast
Authorized Positions
Fire & Emergency Services
FY22 Budget C-48

The Housing and Community Development (HCD) department provides funding for the creation and
rehabilitation of affordable housing, fosters and coordinates services for disadvantaged populations, and
promotes economic mobility among residents of Athens‐Clarke County.
Provide accurate information, comprehensive research and timely advice to the public, management and
staff in support of housing, economic development and community development designed to foster positive community outcomes.
Increase affordable housing activity and production in Athens‐Clarke County through an ongoing and continuously updated strategic planning process that will result in greater funding opportunities, better community awareness of all housing programs and available services as well as stronger public and private sector partnerships.
Partner with ACC departments and housing program providers to reduce slum and blight in neighborhoods through the demolition of dilapidated structures.
Help low‐ to moderate‐income residents and the chronically unemployed overcome barriers to full‐time regular employment.
Encourage the growth and establishment of the local small‐ to medium sized businesses in order to encourage job creation.
Improve the public health and welfare of Athens‐Clarke County residents.
Partner with social service and shelter providers to reduce homelessness in Athens‐Clarke County.
Encourage citizen participation in decision‐making processes with particular emphasis on participation by persons of low and moderate incomes.
Secure CDBG, HOME, Supportive Housing Services, Supportive Housing, and Shelter + Care Grant funds to
assist community partners in the provision of housing, shelter and community development projects and programs.
Allocate entitlement and competitive grant funds to community partners through Mayor and Commission approval processes in a timely manner.
Partner with community organizations to develop accurate scopes of services and contracts for all grant‐funds in a timely manner.
Provide technical assistance, guidance and monitor all contracted agency expenditures and performance monthly.
Process reimbursements to sub‐recipient agencies in a timely manner.
Reimburse ACC expenditures for sub‐recipient activities from grant sources efficiently.
Administer all grant programs efficiently and accurately and document regulatory compliance to minimize financial risk to ACC.
Ensure all expenditures for program administration are at or below statutory caps. Submit accurate reports to HUD and other primary funding agencies on time.
Mission
Goals
Objectives
Housing & Community Development
FY22 Budget C-49

Outcomes and Performance Measures Goal FY16 FY17 FY18 FY19 FY20
Comments or Analysis
Creates and rehabilitates affordable housing,
# Affordable housing units
supported with CDBG/HOMESteady Increase 40 41 57 80 51
Total # affordable housing units supported
with CDBG/HOME
# Affordable rental housing units
createdData Only 16 0 0 12 2
# Affordable rental housing units created
through HOME, CDBG funding
# Affordable housing units
acquiredData Only 3 5 8 0 0
# Affordable rental housing units acquired
through HOME, CDBG funding
# Affordable homes newly
constructedData Only 3 1 2 3 4
# Affordable homes newly constructed
through HOME, CDBG funding
# Demolitions of dilapidated
homesData Only 7 6 4 4 1
# Demolitions of dilapidated LMI homes
(funded through general fund and CDBG)
# Rehabilitations of LMI homes Data Only 48 54 47 47 46# LMI homes rehabilitated through
CDBG/HOME
% Housing cost‐burdened
homeownersData Only 27.50% N/A N/A N/A 42.60%
% Homeowners paying more than 30% of
income on housing (American Community
Survey estimate)
% Housing cost‐burdened renters Data Only 63.00% N/A N/A N/A 58.10%
% Renters paying more than 30% of income
on housing (American Community Survey
estimate)
Housing and Community Development
Performance Measures
Housing & Community Development
FY22 Budget C-50

Outcomes and Performance Measures Goal FY16 FY17 FY18 FY19 FY20
Comments or Analysis
Housing and Community Development
fosters and coordinates services for disadvantaged populations, and
% LMI persons served in all CDBG
projects
At least 70%
(HUD regulation)98% 95% 95% >70% >70% % LMI persons served in all CDBG projects
% LMI persons served in public
facilities projectsAt least 51%
(HUD Regulation)68% 68% 86% N/A
% LMI persons served in CDBG public
facilities projects
% Change in homelessness
2015‐2016
Percentage
Change ‐3% (2016
‐8.50% ‐0.88% 6.70% ‐11.30% ‐11.39%% Change in annual Point in Time count of
homeless persons in ACC
# Homeless persons in ACC Data Only 226 224 239 212 210# Homeless persons in annual Point in Time
(PIT) count
% Homeless persons unsheltered
32% National
Average (2016
AHAR)
40.30% 33.90% 38.90% 21.70% 32%% Homeless persons counted in PIT who
were unsheltered
% Homeless persons sheltered
68% National
Average (2016
AHAR)
59.70% 66.10% 61.10% 78.30% 68%% Homeless persons counted in PIT who
were sheltered
% Chronically homeless
population
14% National
Average (2016
AHAR)
14.20% 21.90% 22.20% 27% 24%% Persons counted in PIT who were
chronically homeless
% Homeless veterans
7.2% National
Average (2016
AHAR)
8.85% 6.25% 3.77% 6.60% 7%% Persons counted in PIT who were
veterans
% Homeless persons in families
35% National
Average (2016
AHAR)
16.80% 30.40% 23.80% 39.60% 31%% Persons counted in PIT who were
homeless family members
# Permanent supportive housing
bedsData Only 154 191 238 266 206
Total # permanent supportive housing beds
in ACC
# Homeless persons receiving
rapid rehousing (RRH) assistanceData Only 69 89 76 59 39
# Homeless persons receiving short‐ to
medium‐term rental assistance in annual
PIT
promotes economic mobility among residents of Athens‐Clarke County.
% Disbursement of revolving loan
fund
70% (HUD
Regulation)N/A N/A 0% 43% 28%
% total assets loaned to businesses,
program revitalized in FY18, 33% loaned in
FY18
% Loans repaid timely 100% N/A N/A N/A 100% 100%% of loans in default status, loans will be
repaid started in FY18
% LMI persons served51% (HUD
Regulation)N/A N/A N/A 95% 95%
% of people served through CDBG:
Economic Development‐funded programs
who are LMI
# of small business
workshops/sessionsData Only N/A N/A N/A 55
# of facilitated sessions to grow &
strengthen small businesses, 2 held YTD in
FY18
Housing & Community Development
FY22 Budget C-51

The Housing & Community Development (HCD) Department administers the Housing & Urban Development
(HUD) funded Community Development Block grant (CDBG), HOME Investment Partnership (HOME) program
and Supportive Housing Program (SHP). Funds from all three grants are accounted for in separate special
revenue funds.
The FY22 Budget for HCD includes the following funding:
$60,300 increase for a new fulltime Homeless Specialist position with funding through CDBG CARES Act
$120,000 increase for Inclusionary Zoning Monitoring with funding through Affordable Housing Fund
$100,000 increase for support of the Young Urban Builders (YUB) program to address youth unemployment & perform owner‐occupied rehabilitation in the West Broad Neighborhood
$77,000 in continued support of programs that support Mayor & Commission Strategic Commitments & Goals: o Athens Well Being Project $ 7,000 o Georgia Initiative for Community Housing (GICH) membership $ 5,000 o GICH Study and Report $ 15,000 o Homeless Street Outreach $ 30,000 o Homeless Management Information System (HMIS) fee $ 20,000
The Approved Budget for HCD includes moving $750,000 of funding for the Neighborhood Leaders Program from the General Fund to the ARP Fund. The CDBG FY22 Budget is based on funding of $1,363,769.
$18,968 of this total is reprogrammable CDBG Funds.
Proposed Programs and activities for FY22 are summarized below as approved by the Mayor &
Commission on April 6, 2021:
Affordable Housing $ 641,500
Micro‐enterprise, Economic Dev. & Neighborhood Revitalization $ 217,000
Public Services $ 201,720
Public Facilities $ 34,589
Administration $ 268,960
FY22 CDBG Total $1,363,769
The HOME program is designed to increase homeownership and affordable housing opportunities for low‐
income families in the community.
The FY22 appropriation for HOME program is $691,534.
Based on the FY22 Action Plan, HOME funds will be used for the following activities:
Housing & Community Development $ 622,381
Administration $ 69,153
FY22 HOME Total $ 691,534
The Supportive Housing Program is designed to promote development of supportive housing and services to
assist homeless persons in transition from homelessness; and enable them to live as independently as
possible.
The FY22 Supportive Housing allocation, $323,000, is the same as FY21.
Budget Highlights
Housing & Community Development
FY22 Budget C-52
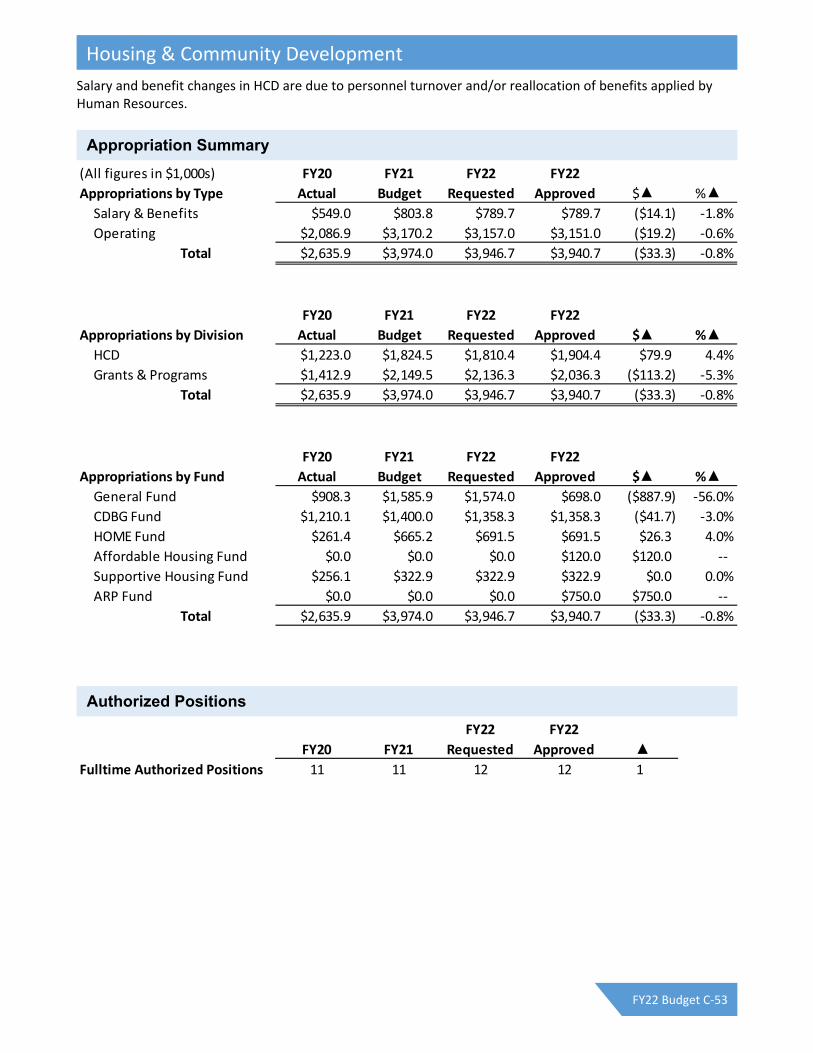
Salary and benefit changes in HCD are due to personnel turnover and/or reallocation of benefits applied by Human Resources.
(All figures in $1,000s) FY20 FY21 FY22 FY22
Appropriations by Type Actual Budget Requested Approved $▲ %▲Salary & Benefits $549.0 $803.8 $789.7 $789.7 ($14.1) ‐1.8%
Operating $2,086.9 $3,170.2 $3,157.0 $3,151.0 ($19.2) ‐0.6%
Total $2,635.9 $3,974.0 $3,946.7 $3,940.7 ($33.3) ‐0.8%
FY20 FY21 FY22 FY22
Appropriations by Division Actual Budget Requested Approved $▲ %▲HCD $1,223.0 $1,824.5 $1,810.4 $1,904.4 $79.9 4.4%
Grants & Programs $1,412.9 $2,149.5 $2,136.3 $2,036.3 ($113.2) ‐5.3%
Total $2,635.9 $3,974.0 $3,946.7 $3,940.7 ($33.3) ‐0.8%
FY20 FY21 FY22 FY22
Appropriations by Fund Actual Budget Requested Approved $▲ %▲General Fund $908.3 $1,585.9 $1,574.0 $698.0 ($887.9) ‐56.0%
CDBG Fund $1,210.1 $1,400.0 $1,358.3 $1,358.3 ($41.7) ‐3.0%
HOME Fund $261.4 $665.2 $691.5 $691.5 $26.3 4.0%
Affordable Housing Fund $0.0 $0.0 $0.0 $120.0 $120.0 ‐‐
Supportive Housing Fund $256.1 $322.9 $322.9 $322.9 $0.0 0.0%
ARP Fund $0.0 $0.0 $0.0 $750.0 $750.0 ‐‐
Total $2,635.9 $3,974.0 $3,946.7 $3,940.7 ($33.3) ‐0.8%
FY22 FY22
FY20 FY21 Requested Approved ▲Fulltime Authorized Positions 11 11 12 12 1
Appropriation Summary
Authorized Positions
Housing & Community Development
FY22 Budget C-53

The Human Resources Department works in partnership with the Unified Government to recruit, retain, and
reward an engaged, prepared, and committed workforce to serve the citizens of Athens‐Clarke County in an
environment of diversity, excellence, responsiveness, transparency, and fairness.
Attract, retain and reward talented and empowered employees.
Promote transparency through improved access to information
Improve internal efficiency and effectiveness.
Document and share our actions to cultivate a culture of innovation by piloting new ideas and adopting
those with demonstrated benefits.
Protect lives, property, and the environment by forming partnerships and implementing programs for a
safer, more resilient Athens‐Clarke County.
The Human Resources Department seeks to enhance the quality of work experience for all Athens‐Clarke
County employees and retirees and the quality of life for all Athens‐Clarke County citizens through effective,
respectful, and compassionate human resource practices.
Professionalism, Safety, Respect, Timeliness, Excellence, Collaboration, Inclusion, Diversity and Wellness
Strategy #1: Attract, retain and reward talented employees
Proposed action:
Annually monitor and adjust compensation and benefits to remain a competitive employer.
Work with the Inclusion & Diversity Officer to analyze, monitor, and develop goals that address
recruitment and retention of employees that reflect the community they serve.
Effectively administer the Pension Plan to retain long‐term employees.
Pay a living wage to all full‐time, part‐time and seasonal employees.
Modify and enhance the current Performance Management Program.
Expand the Great Promise Program, establish the Experiential Learning Program and other internship
programs. Fully fund public safety promotional process and conduct assessment centers as necessary.
Effectively resolve employee relations matters as necessary.
Mission
Goals
Vision
Values
Objectives
Human Resources
FY22 Budget C-54

Strategy #2: Improve internal efficiency and effectiveness
Proposed action:
Enhance and maintain existing Human Resources software systems; prepare for implementation of new
Enterprise Resource Planning System.
Review, inventory, and update human resource written policies within and across departments.
Update Human Resources website and intranet site.
Strategy #3: Create empowered and engaged employees
Proposed action:
Continue recruiting diversity initiative with the Great Promise Partnership.
Continue to brand ACCGOV as an employer of choice that will help to recruit and retain employees.
Continue to fund the ACCGOV employee recognition program.
Contain health care costs through review, analysis and management of claims and promotion of the
Wellness Program to employees and retirees through increased participation in wellness screenings,
fitness programs, healthy hours, and nutrition and wellness classes.
Continue to develop succession planning program for retention of top talent and to put the organization in
the position as retirements continue to impact departments.
PERFORMANCE MEASURE GOAL FY14 FY15 FY16 FY17 FY18 FY19 FY20Comments or Analysis
Turnover Rate <10% 10.9% 10.1% 11.8% 11.8% 12.9% 12.5% 12.4%Reclassification <5 7 12 16 15 - - - Employment Application/Criminal History >10,000 5,979 6,377 11,068 11,500 8,680 8,834 7,994 Payroll - # of Maintenance Entries <9,000 9,594 10,300 9,616 10,840 4,789 4,944 4,589 Health Risk Assessment/Wellness >650 729 751 749 1,084 1,023 1,083 531 Disciplinary Actions & Dismissals <60 151 106 51 88 99 92 54 Harassment/Discrimination Issues 0 4 3 1 4 3 3 2
Worker's Comp Claims Filed <100 132 114 124 42 113 120 88 Lawsuits 0 7 12 10 15 15 9 8 Liability Claims/Transactions <200 445 418 413 181 374 303 127 Random Drug Testing (Budget) 587 587 793 348 351 293 90
Attract, retain and reward talented and empowered employees.
Protect lives, property, and the environment by forming partnerships and implementing programs for a safer, more resilient Athens-Clarke County.
Performance Measures
Human Resources
FY22 Budget C-55
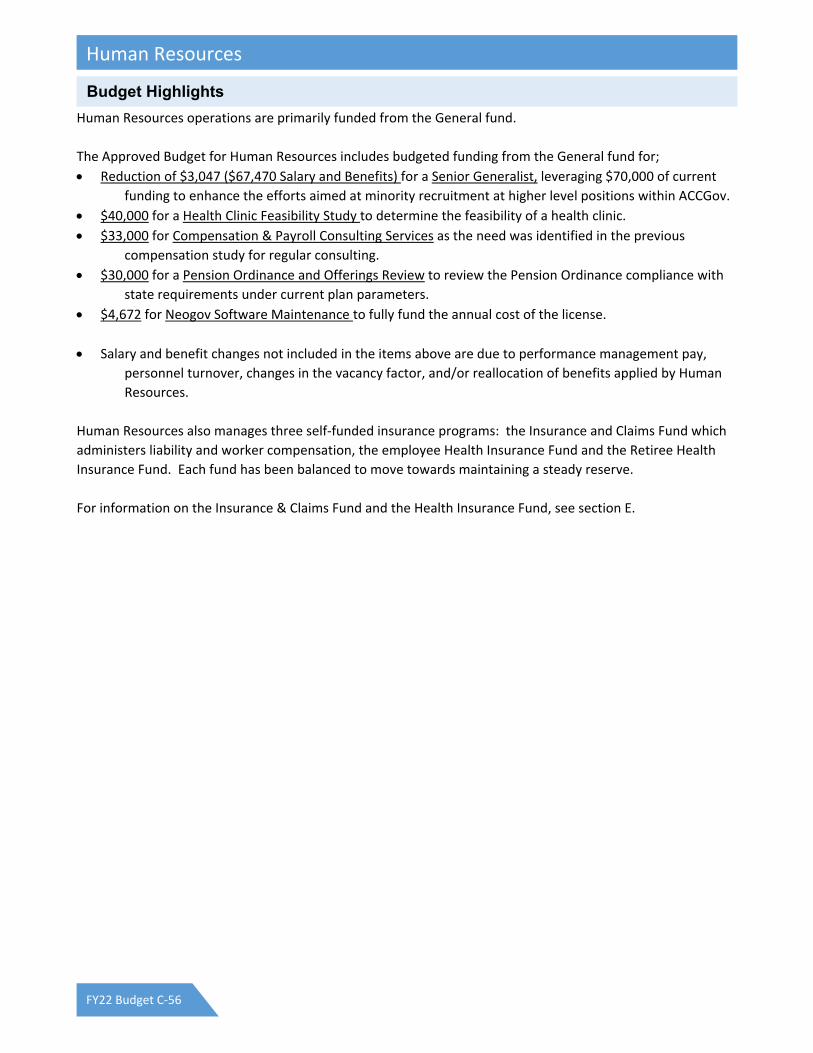
Human Resources operations are primarily funded from the General fund.
The Approved Budget for Human Resources includes budgeted funding from the General fund for;
Reduction of $3,047 ($67,470 Salary and Benefits) for a Senior Generalist, leveraging $70,000 of current
funding to enhance the efforts aimed at minority recruitment at higher level positions within ACCGov.
$40,000 for a Health Clinic Feasibility Study to determine the feasibility of a health clinic.
$33,000 for Compensation & Payroll Consulting Services as the need was identified in the previous
compensation study for regular consulting.
$30,000 for a Pension Ordinance and Offerings Review to review the Pension Ordinance compliance with
state requirements under current plan parameters.
$4,672 for Neogov Software Maintenance to fully fund the annual cost of the license.
Salary and benefit changes not included in the items above are due to performance management pay,
personnel turnover, changes in the vacancy factor, and/or reallocation of benefits applied by Human
Resources.
Human Resources also manages three self‐funded insurance programs: the Insurance and Claims Fund which
administers liability and worker compensation, the employee Health Insurance Fund and the Retiree Health
Insurance Fund. Each fund has been balanced to move towards maintaining a steady reserve.
For information on the Insurance & Claims Fund and the Health Insurance Fund, see section E.
Budget Highlights
Human Resources
FY22 Budget C-56

(All figures in $1,000s) FY20 FY21 FY22 FY22
Appropriations by Type Actual Budget Requested Approved $▲ %▲Salary & Benefits $1,749.7 $1,873.6 $2,184.0 $1,997.3 $123.7 6.6%
Operating $907.6 $1,181.1 $1,145.8 $1,178.6 ($2.5) ‐0.2%
Total $2,657.3 $3,054.7 $3,329.8 $3,175.9 $121.2 4.0%
FY20 FY21 FY22 FY22
Appropriations by Division Actual Budget Requested Approved $▲ %▲Administration $535.0 $578.3 $699.4 $511.6 ($66.7) ‐11.5%
Employment $603.7 $711.3 $788.8 $785.6 $74.3 10.4%
Benefits & Wellness $1,212.5 $1,446.4 $1,482.6 $1,521.8 $75.4 5.2%
Compensation & Payroll $306.1 $318.7 $359.0 $356.9 $38.2 12.0%
Total $2,657.3 $3,054.7 $3,329.8 $3,175.9 $121.2 4.0%
FY20 FY21 FY22 FY22
Appropriations by Fund Actual Budget Requested Approved $▲ %▲General Fund $1,525.1 $1,768.7 $2,061.8 $1,907.9 $139.2 7.9%
Special Programs Fund $92.2 $25.0 $25.0 $25.0 $0.0 0.0%
Insurance & Claims Fund $455.5 $509.2 $463.7 $463.7 ($45.5) ‐8.9%
Health Insurance Fund $584.7 $751.9 $779.3 $779.3 $27.4 3.6%
Total $2,657.5 $3,054.8 $3,329.8 $3,175.9 $121.1 4.0%
FY22 FY22
FY20 FY21 Requested Approved ▲Fulltime Authorized Positions 21 22 26 23 1
Appropriation Summary
Authorized Positions
Human Resources
FY22 Budget C-57

Independent Agencies are either legal, separate entities or ACCGov Commissions not included within an
ACCGov department budget.
FY22 Budget allocates $6.3 million for Independent Agencies in the following funds:
o General Fund $4,042,798
o Hotel/Motel Tax Special Revenue Fund $2,228,460
o Special Programs Special Revenue Fund (Project Safe) $ 26,000
(Fine revenues designated for victim assistance programs per State Law)
In addition, $1,894,124 is included for indigent defense (GA Public Defender Standards Council contract).
Additional information is provided in Section “F” of this document.
*Envision Athens FY19 & FY20 funding based on Mayor & Commission approved agreement on May 1, 2018 and included in the Other
General Administration portion of those budgets. The FY20 Budget data is reflected here for comparison purposes.
FY20 FY21 FY22 FY22
General Fund Budget Budget Requested Approved $▲ %▲Advantage Behavioral Health 180,206 180,206 180,206 180,206 0 0.0%
Athens‐Clarke County Libraries 2,028,197 2,098,197 2,146,186 2,146,186 47,989 2.3%
Athens Community Council on Aging 287,300 287,300 287,300 287,300 0 0.0%
Clarke County Public Health Department 946,354 946,354 946,354 946,354 0 0.0%
Department of Family & Children Services 208,600 208,600 208,600 208,600 0 0.0%
Total Quasi‐Governmental $3,650,657 $3,720,657 $3,768,646 $3,768,646 $47,989 1.3%
FY20 FY21 FY22 FY22
Budget Budget Requested Approved $▲ %▲Athens Neighborhood Health Center 100,000 100,000 100,000 100,000 0 0.0%
Athens Tutorial Program 3,500 3,500 3,500 3,500 0 0.0%
Envision Athens* 75,000 75,000 96,750 96,750 21,750 29.0%
United Way of NE GA 2‐1‐1 24,402 24,402 24,402 24,402 0 0.0%
Total Community Service Agencies $202,902 $202,902 $224,652 $224,652 $21,750 10.7%
FY20 FY21 FY22 FY22
Budget Budget Requested Approved $▲ %▲Athens Cultural Affairs Commission 21,000 21,000 21,000 21,000 0 0.0%
Athens in Motion Commission 0 0 12,000 12,000 12,000 ‐‐
Oconee Rivers Greenway Commission 16,500 16,500 16,500 16,500 0 0.0%
Total ACCGov Commissions $37,500 $37,500 $49,500 $49,500 $12,000 32.0%
Total General Fund $3,891,059 $3,961,059 $4,042,798 $4,042,798 $81,739 2.1%
Hotel/Motel Tax Special Revenue Fund
FY20 FY21 FY22 FY22
Budget Budget Requested Approved $▲ %▲Classic Center Authority 2,035,875 1,831,202 1,411,540 1,411,540 (419,662) ‐22.9%
Convention & Visitors Bureau 1,178,250 1,059,797 816,920 816,920 (242,877) ‐22.9%
Total Hotel/Motel Fund $3,214,125 $2,890,999 $2,228,460 $2,228,460 ($662,539) ‐22.9%
Special Programs/Special Revenue Fund
FY20 FY21 FY22 FY22
Budget Budget Requested Approved $▲ %▲Project Safe, Inc. 26,000 26,000 26,000 26,000 0 0.0%
Total Special Revenue Fund $26,000 $26,000 $26,000 $26,000 $0 0.0%
Grand Total Independent Agencies $7,131,184 $6,878,058 $6,297,258 $6,297,258 ($580,800) ‐8.4%
Budget Highlights
Appropriation Summary
Independent Agencies
FY22 Budget C-58

To empower the Athens‐Clarke County Unified Government's responsible stewardship of the community's
resources by leveraging secure, effective technology, and quality support.
Strategic Goals
Information Technology has identified seven strategic goals that will be fulfilled in the coming years.
Goal 1: Invest in Technology and Develop Policy that Protects ACCGov Data and Information
Goal 2: Proactively Seek Out Opportunities where Technology can Help Departments Become More Productive
Goal 3: Invest in Solutions to Deliver Excellence in Information Technology Service to ACCGov Workforce
Goal 4: Deploy Robust Information Technology Infrastructure that Continually Provides Technology Services
Goal 5: Promote an Empowered Workforce through Innovation
Goal 6: Become a Leader in Technology Governance
Goal 7: Deploy Solutions to Become an Open, Transparent, and Responsive Government
Performance Measures Goal 2017 2018 2019 2020 2021 Proj. 2022 Comments or Analysis
Gain and then maintain a virtual server to physical server ratio of 3:1 (75% virtual: 25% physical)
3V:1P (75%)77V:39P (66%)
109V:47P (70%)
127V:38P (68.6%)
165V:48P (77%)
178V:55P (76%)
185V:45P (80.4%)
A physical server is a single server operating system on a single piece of hardware. A virtual server is an
encapsulated operating system that shares a single piece of hardware with other virtual servers. FY17 was the first year of virtual machines. Moving forward, IT will look to
virtual servers to maximize hardware investment and reduce data center power and cooling.
% of IT projects completed on schedule and within budget
100%100% on 7
projects100% on 6
projects
80% on 5 projects (VoIP was delayed-AT&T porting
issues)
100% 100% 100%
IT projects are initiated and funded by the IT Department. They are large in scope, and used to support the IT
needs of the government. As good stewards of county resources, IT works hard to finish within budget by the
projected date.
% of network computing devices using high efficiency power
supplies100% 13% 25% 35% 42% 56% 65%
As good stewards of county resources, IT has adopted a green initiative to reduce power consumption throughout
the government.
% of work orders resolved within 24 hrs
87% 86% 87% 85% 87% 78% 87%Providing responsive, quality support by solving problems
quickly.
% of infrastructure uptime 99% 99% 99% 99.9% 99.9% 99.9% 99.9%
Infrastructure up time is the basic building block to supplying effective technology. 99% availability allows 3 days, 15 hours and 40 minutes of aggregate downtime per year. 99.9% availability allows 8 hours, 46 minutes
per year. 99.99% availability allows 52 minutes, 36 seconds of aggregate downtime.
Keep latency < 5 ms between data centers
< 5 ms NA 3ms 3ms 3ms 3ms 3msLatency is the time it takes for a packet to traverse the
network to its destination. Very important to maintain this low latency figure to support ACC's infrasructure.
Replace devices at the end of their lifecycle. We are currently
on a 6 year usable life plan.
All eligible devices that
have reached 6 years of
service = 100 - 300 devices most years.
203 185 242 200 284 244
Squeezing out 6 years on the majority of devices is a big money saver, optimal lifecycle = 3 to 4 years. Because of fluctuations in buying cycles, the target number will
vary each year. Key is years of service.
To empower the Athens-Clarke County Unified Government's stewardship of the community's resources by leveraging secure, effective technology,
and quality customer support.
Mission
Performance Measures
Information Technology
FY22 Budget C-59

$153,500 is included for Microsoft Licensing increases and ERP Replacement Maintenance increases.
$3,700 is included for vehicle replacement charges. General Fund vehicle replacement charges were removed from the FY21 Budget by the Mayor and Commission and have been reinstated for FY22.
Salary and benefit changes are due to personnel turnover and/or reallocation of benefits applied by Human Resources.
The IT Department is primarily funded through the General Fund, but also includes one fulltime position in the Water and Sewer Fund.
(All figures in $1,000s) FY20 FY21 FY22 FY22
Appropriations by Type Actual Budget Requested Approved $▲ %▲Salary & Benefits $1,654.0 $1,789.1 $1,954.9 $1,797.5 $8.4 0.5%
Operating $1,463.7 $1,895.3 $2,710.5 $2,052.6 $157.3 8.3%
Total $3,117.7 $3,684.4 $4,665.4 $3,850.1 $165.7 4.5%
FY20 FY21 FY22 FY22
Appropriations by Fund Actual Budget Requested Approved $▲ %▲General Fund $2,951.7 $3,622.5 $4,601.6 $3,786.2 $163.7 4.5%
Special Programs Fund $104.7 $0.0 $0.0 $0.0 $0.0 ‐‐
Water & Sewer Fund $61.3 $62.0 $63.9 $63.9 $1.9 3.1%
Total $3,117.7 $3,684.5 $4,665.5 $3,850.1 $165.6 4.5%
FY22 FY22
FY20 FY21 Requested Approved ▲Fulltime Authorized Positions 23 23 23 23 0
(all numbers in thousands of dollars) 5 ‐ Year CIP
Capital Appropriations
FY20
Year End
Balance
FY21
Budget
FY22
Approved
FY23‐FY26
Proposed
FY27‐31
ProposedGeneral Capital Projects FundCurrent ServicesD‐55 Information Technology Equipment Replacement Program 431.9 350.0 400.0 1,680.0 1,750.0Current Services Total 431.9 350.0 400.0 1,680.0 1,750.0
Capital Appropriations Total 431.9 350.0 400.0 1,680.0 1,750.0
Budget Highlights
Appropriation Summary
Capital Budgets, 5-Year CIP and Project Forecast
Authorized Positions
Information Technology
FY22 Budget C-60

The purpose of Georgia’s Juvenile Courts is to secure for each child who comes within the jurisdiction of the
court such care and guidance, preferably in his own home, as will secure his or her moral, emotional, mental,
and physical welfare as well the safety of both the child and the community. The intention of the General
Assembly of Georgia in creating the juvenile code is to strengthen and preserve family relationships,
countenancing the removal of a child from his or her home only when state intervention is essential to protect
such child and enable him or her to live in security and stability. (O.C.G.A. 15‐11‐1, Effective January 1, 2014.)
The mission of the Athens‐Clarke County Juvenile Court is to protect the well‐being of the child under the
Court’s jurisdiction, providing guidance and control as necessary, while balancing the needs and best interest
of the community, while fulfilling the intent of the newly rewritten Juvenile Code.
The goal of the Athens‐Clarke County Juvenile Court is to serve the community and the children whose cases
are before the court by balancing the requirements of law, the best interest of the child and the community,
and to fulfill the mandated requirements of the newly rewritten juvenile code within the bounds of the
resources provided by the Athens‐Clarke County Government.
Protect the community
Promote accountability for violations of law
Provide treatment and rehabilitation and equip juvenile offenders with the ability to live responsibly and
productively
In every proceeding to guarantee due process of law, as required by the Constitutions of the United States
and the State of Georgia, through which every child and his or her parent and all other interested parties
are assured fair hearings at which legal rights are recognized and enforced.
Actual Forecast
CY17 CY18 CY19 CY20 CY21
All Case Types Disposed 2,123 2,113 777 519 843
Delinquent cases filed 1,104 555 401 287 389
Delinquent cases disposed 964 1,810 460 301 425
All Case Types Filed 2,253 916 799 530 672
Unruly Cases Disposed 78 124 114 55 72
Traffic Cases Filed 122 62 99 28 56
Traffic Cases Disposed 79 436 68 35 48
Deprivation/Dependency Cases Filed 934 132 188 117 160
Deprivation/Dependency Cases Disposed 592 109 96 98 103
Termination of Parental Rights Filed 21 21 29 21 25
Termination of Parental Rights Disposed 22 62 21 9 18
Special Proceedings filed 72 26 28 35 42
Special Proceedings Disposed 42 110 18 20 23
Mission
Goals
Objectives
Performance Measures
Juvenile Court
FY22 Budget C-61

The Budget for the Juvenile Court includes budgeted funding from the General fund for;
$30,000 for increased days for the Part‐Time Judge. This request would allow the Part‐Time Judge to move
from 2.5 to 4 days per week. The extra days would allow for time to efficiently manage the case load.
Salary and benefit changes are due to personnel turnover and/or reallocation of benefits applied by
Human Resources.
The court also requested $69,000 to move a Program Coordinator in the Family Dependency Treatment
Court from the Grants Fund to the General Fund and $50,000 to fully fund the Senior Case
Management Specialist in the General Fund rather than the Grants Fund. This position is currently
funded 50% in the Grants Fund and 50% in the General Fund. Neither request was recommended or
approved.
(All figures in $1,000s) FY20 FY21 FY22 FY22
Appropriations by Type Actual Budget Requested Approved $▲ %▲Salary & Benefits $395.4 $343.2 $518.7 $358.3 $15.1 4.4%
Operating $399.1 $264.0 $272.0 $264.0 $0.0 0.0%
Total $794.5 $607.2 $790.7 $622.3 $15.1 2.5%
FY20 FY21 FY22 FY22
Appropriations by Fund Actual Budget Requested Approved $▲ %▲General Fund $600.9 $607.2 $790.7 $622.3 $15.1 2.5%
Grants Fund $193.6 $0.0 $0.0 $0.0 $0.0 ‐‐
Total $794.5 $607.2 $790.7 $622.3 $15.1 2.5%
FY22 FY22
FY20 FY21 Requested Approved ▲Fulltime Authorized Positions 5 5 5 5 0
Budget Highlights
Appropriation Summary
Authorized Positions
Juvenile Court
FY22 Budget C-62

The mission of the Athens‐Clarke County Leisure Services Department is to build a healthier and more livable
community by creating opportunities to learn, to create and to play in quality parks, programs and facilities
that are valued by our citizens.
Implement the first phase of the new Leisure Services Strategic Plan.
Support Mayor and Commission key initiatives by partnering with other departments to deliver youth job
opportunities and a Juneteenth community celebration.
Build new community outreach opportunities that were placed on hold during the pandemic, with a focus
on connecting with underserved neighborhoods.
Analyze post‐pandemic programming and services with a goal of incorporating operational changes that
are safe, efficient, and effective.
Enhance the department’s sense of value and position in the community by improving operational
outcomes in the areas of marketing, branding, and public information.
Maximize the efficiency of operations by fully implementing City Works.
Implement remaining SPLOST 2011 and TSPLOST projects involving Firefly Trail, Greenway, and Dudley
Park; begin plans for approved Tier 1 projects in SPLOST 2020.
With approved funding, implement the first of several Counselor In Training (CIT) programs that provide
teens with seasonal employment, job skills, and personal resume development.
Work with Inclusion Office and minority community leaders to plan and implement the first ACCGov
Juneteenth celebration in partnership with local agencies.
Implement the FY21 funded mobile “Pop‐up Park” program that was placed on hold during the pandemic;
take recreation and information to citizens throughout the community, with a focus on under‐served
communities; reintroduce the CCSD partnership with the Gaines Elementary School after school
program; host more online opportunities and in‐person meetings targeted toward receiving
community feedback on leisure opportunities.
Analyze effectiveness of all virtual programs and services created during the pandemic and maintain long‐
term use where appropriate as opportunities return to pre‐pandemic levels; continue applicable
protocols that ensure safety of staff and participants.
Implement a new Leisure Services YouTube Channel that brings all virtual programming and promotions to
one location in an effort to improve community service; complete work and implement phase one of
the department’s Marketing Plan; continue to work on staff training in social media and brand
awareness without losing each facilities individual identity.
Streamline City Works processes by providing transparent work order information to facility supervisors
and generating quarterly performance reports based on City Works data.
Implement new segments of the Firefly and Greenway Trails to include staff patrols, inspections, and
maintenance; develop programming and rental services that maximize development of Dudley and
Burton Parks; work with the SPLOST Office and community partners on initial implementation of
SPLOST 2020 Tier 1 projects.
Mission
Goals
Objectives
Leisure Services
FY22 Budget C-63

Key ≥100% ≥80% ≤79%
Performance Measure FY14 FY15 FY18 FY19 FY20FY21 2nd Quarter
Acres of park land per 1,000 citizens
21.36 21.36 21.69 22.41 22.41 20.41
Acres of developed land for recreation
1973 1973 1,980 1,980 1,980 1,980
Acres of undeveloped land for conservation
520 520 552 552 552 552
# of developed parks per residents
1 for every 5,836
residents
1 for every 5,836
residents
1 for every 5,558
residents
1 for every 5,558
residents
1 for every 5,558
residents
1 for every 5,558
residents
Miles of bike and walking trails
35 40 45 45 45 47
# of programs offered NA NA 1,030 1,162 1,156 517
# of program participants NA NA 15,539 18,692 11,469 3,418
# of aquatic visitors 39,796 38,670 44,682 34,613 20,002 6,819
# of scholarship participants
NA NA 966 1,045 651 658
Vouchers allocated and used
NA NA801547
893746
559303
70
Value of Vouchers and Vouchers used
NA NA$16,020$10,746
$17,860$14,654
$14,820$6,991
$140$0
# of after school participants
NA NA 81 65 198 82
Number of grants awarded 2 3 4 7 4 2
Cash value of grants awarded
$35,000 $80,050 $61,793 $119,450 $26,266 $14,951
Value of donations & sponsors
$35,876 $21,671 $22,259 $37,815 $49,650 $6,887
# of volunteers & recorded volunteer hours
1,70120,040 hrs
1,65224,091 hrs
1,11423,183 hrs
1,375 21,393 hrs
73712,967 hrs
1301,827 hrs
Monetary value for volunteers
$445,890 $555,779 $572,388 $544,023 $329,750 $46,461
Annual operating budget per capita
61.60 61.69 $66.78 $62.06
Revenue vs Expenditures 15% 15% 15% 15%
# of FT staff per 10,000 residents 8.4 Staff members
86% 86% 86% 76% 72% 72%
Recreation user satisfaction
NA NA 90% 93% 93%
# of facility rentals (includes special events)
NA NA 1,887 1,789 1,032 0
% of repeat program participants
NA NA 81% 77% 65% 28%
Hourly value of $25.43 is from Independent Sector, a National Volunteer Advocacy Organization
FY20/FY21 is the transitioned from fiscal year to calendar year. Renewals begin in January 2021.
Roster Report - registrations only
Covid-19 impact - majority virtual classes only
United States Tennis AssociationGCA Partner Grant
Covid-19--pools and splashpads were open very briefly in July
Transition from FY to calendar year--18 month. Total for FY21 includes all of FY20 and the first 6 months of FY21
Scholarships expire on 12/31/2020--very few applications due to free virtual programming and Covid-19.
115 of the 517 activities canceled due to Covid-19
NRPA Benchmark - 1 for every 2,181Any site with added recreation amenities; 21 developed sites for public access
FY22 will add ~7 miles of Rails to Trails and Greenway combined
Data Only
978 Data Only 967
WE CREATE OPPORTUNITIES TO LEARN, CREATE, AND PLAY
1 for every 5,836
residents
GOAL
527
1,973
FY16
10.1 acres per 1,000 residents
WE BUILD A HEALTHIER AND MORE LIVABLE COMMUNITY
≥ 2,000≥ 40,000 hrs
1,50722,417 hrs
Data Only
520
1,973
$150,000
15,923
$78,205
7
1,43230,213 hrs
$46,228
$528,145
4
$13,673
$31,100
LE
ISU
RE
SE
RV
ICE
S
97%
Data Only
1 for every 2,181 residents
Data Only
92
40
Data Only 1,328
107
Data Only NA NA
Data Only
≥12
69% 85%≥ 90%
8.4 = 100% 86%
16%
97%
1,755
86%
15%
FY21 Notes
NRPA Benchmark - 10.1Latest census totals 127,330 residents; FY21 is ~2,600 acres due to Rails to Trails/Greenway expansions
Data Only
Data Only 16,104
21.36
1 for every 5,836
residents
40
971
32,630
NA
Data Only
38,934
NA
FY17
21.42
WE PROVIDE QUALITY PARKS, PROGRAMS, AND FACILITIES THAT ARE VALUED BY OUR CITIZENS
This number may reduce due to cap limits in the new scholarship program
$736,849
$100,000
90%
1,869 Data Only
$65.01
≥ 20%
FY16 and FY17 will be for summer camps only; FY18 and beyond includes camps and programs; FY21 - no surveys completed due to virtual programming
FY21 Covid-19 impact - no large gatherings
NRPA Benchmark - $74.67 ; Waiting on Finance year end reports from FY20
NRPA Benchmark - 8.4
Waiting on Finance year end reports from FY20
$62.67 $74.67 of annual
operating per capita
Performance Measures
Leisure Services
FY22 Budget C-64

The Approved Budget for the Leisure Services Department includes budgeted funding from the General fund
for;
$9,963 for the Part‐time Outreach Position to fully fund the position that was included in the FY21 budget
and was only funded to begin in the second half of FY21.
$6,000 for a Youth Commission to start a youth commission program.
$4,000 for the UGA Veterinarian Contract to fund the increasing costs of the services.
$92,397 for vehicle replacement charges. General Fund vehicle replacement charges were removed from
the FY21 Budget by the Mayor and Commission and have been reinstated for FY22.
The Approved Budget for the Leisure Services Department includes budgeted funding in the American Rescue
Plan Fund for;
$100,000 for youth development programming as a “Revenue Replacement” item.
$400,000 for additional youth development programming as a designated program.
$150,000 for a municipal garden program as a designated program.
Salary and benefit changes not included in the items above are due to performance management pay,
personnel turnover, changes in the vacancy factor, and/or reallocation of benefits applied by Human
Resources.
For information on individual fees, see the Schedule of Fees and Charges beginning on page G‐15.
Budget Highlights
Leisure Services
FY22 Budget C-65

(All figures in $1,000s) FY20 FY21 FY22 FY22
Appropriations by Type Actual Budget Requested Approved $▲ %▲Salary & Benefits $5,615.4 $6,011.2 $6,485.8 $6,009.9 ($1.3) 0.0%
Operating $1,933.3 $2,558.8 $2,822.2 $3,174.9 $616.1 24.1%
Total $7,548.7 $8,570.0 $9,308.0 $9,184.8 $614.8 7.2%
FY20 FY21 FY22 FY22
Appropriations by Fund Actual Budget Requested Approved $▲ %▲Administration $1,996.0 $2,532.8 $2,715.7 $3,142.8 $610.0 24.1%
Arts Division $1,340.1 $1,367.2 $1,391.3 $1,358.7 ($8.5) ‐0.6%
Park Services $0.0 $0.0 $0.0 $0.0 $0.0 ‐‐
Recreation Division $2,445.6 $2,773.6 $2,865.3 $2,784.8 $11.2 0.4%
Nature Division $1,767.1 $1,896.4 $2,335.7 $1,898.5 $2.1 0.1%
Total $7,548.8 $8,570.0 $9,308.0 $9,184.8 $614.8 7.2%
FY20 FY21 FY22 FY22
Appropriations by Fund Actual Budget Requested Approved $▲ %▲General Fund $7,535.6 $8,535.0 $9,273.0 $8,499.8 ($35.2) ‐0.4%
Special Programs Fund $3.4 $35.0 $35.0 $35.0 $0.0 0.0%
Grants Fund $9.7 $0.0 $0.0 $0.0 $0.0 ‐‐
ARP Fund $0.0 $0.0 $0.0 $650.0 $650.0 ‐‐
Total $7,548.7 $8,570.0 $9,308.0 $9,184.8 $614.8 7.2%
Appropriation Summary
Leisure Services
FY22 Budget C-66

FY22 FY22
FY20 FY21 Requested Approved ▲Fulltime Authorized Positions 73 74 76 74 0
(all numbers in thousands of dollars) 5 ‐ Year CIP
Capital Appropriations
FY20
Year End
Balance
FY21
Budget
FY22
Approved
FY23‐FY26
Proposed
FY27‐31
ProposedGeneral Capital Projects FundCurrent ServicesD‐56 Parks ‐ R&M Existing Facilities ‐ 57.0 200.0 4,977.3 3,040.9D‐57 Pool Repairs and Renovations 37.8 50.0 150.0 725.6 350.3D‐58 Bridge and Boardwalk Inspection and Replacement 27.7 ‐ ‐ 1,929.4 845.3D‐59 Pavement Repair and Maintenance 6.6 ‐ ‐ 1,666.1 536.1D‐60 Park Equipment ‐ Replacement / Life Cycle 2.9 ‐ 75.0 1,469.8 1,150.6D‐61 N Cook's Trail Improvements ‐ ‐ ‐ 6,524.8 ‐D‐62 Improve Bear Hollow Zoo Exhibits & Visitor Amenities ‐ ‐ ‐ ‐ 8,364.0D‐63 Ben Burton Park Repairs and Renovations ‐ ‐ ‐ 2,223.8 ‐D‐64 Create a Property Boundary Program ‐ ‐ ‐ 150.0 100.0D‐65 Memorial Park Renovations ‐ ‐ ‐ 1,519.0 9,331.0D‐66 Bishop Park Renovations ‐ ‐ ‐ ‐ 20,500.0D‐67 Dudley Park Improvements ‐ ‐ ‐ ‐ 5,164.0D‐68 N Sandy Creek Park Improvements ‐ ‐ ‐ ‐ 6,703.0D‐69 N Satterfield Park Improvements ‐ ‐ ‐ ‐ 4,697.0D‐70 N Southeast Clarke Park Improvements ‐ ‐ ‐ 2,330.0 14,317.0D‐71 N Virginia Callaway‐Cofer Walker Park Improvements ‐ ‐ ‐ ‐ 4,440.0D‐72 Morton Theatre Fork Lift Replacement ‐ ‐ ‐ 35.0 ‐D‐78 N Cooks Property Master Plan ‐ ‐ ‐ 50.0 ‐D‐79 N Rock and Shoals Master Plan ‐ ‐ 100.0 50.0 ‐D‐80 N Whitehall Shoals Visioning Plan ‐ ‐ ‐ 25.0 ‐D‐81 N Barber Creek & Chicopee Gun Emplacement Vision Plan ‐ ‐ ‐ 25.0 ‐D‐82 N Undeveloped Greenspaces Vision Plan ‐ ‐ ‐ 25.0 ‐Current Services Total 75.0 107.0 525.0 23,725.9 79,539.2
Additions & ImprovementsD‐73 Trails & Open Spaces Compact Track Loader Equipment ‐ ‐ ‐ 35.0 ‐D‐74 N New Athens Creative Theatre Facility ‐ ‐ ‐ 2,500.0 10,055.0D‐75 Portable Soccer Pitch System ‐ ‐ ‐ ‐ 35.0D‐76 N East Athens Community Center‐Space Modernization ‐ ‐ ‐ ‐ 7,000.0D‐77 N Lay Park Community Center‐Space Modernization ‐ ‐ ‐ ‐ 7,000.0Additions and Improvements Total ‐ ‐ ‐ 2,535.0 24,090.0
Capital Appropriations Total 75.0 107.0 525.0 26,260.9 103,629.2
Capital Budgets, 5-Year CIP and Project Forecast
Authorized Positions
Leisure Services
FY22 Budget C-67

The Mission of the Magistrate Court is to deliver justice to the citizens of Athens‐Clarke County by:
(1) Ruling on disputed civil claims or approving mutual settlements in civil cases involving:
(a) Claims up to $15,000;
(b) Dispossessory proceedings between landlords and tenants; (c) Abandoned motor vehicle foreclosures;
(d) Personal property foreclosures; and (e) Garnishments.
(2) Managing preliminary matters in criminal cases by:
(a) Having a judge available 24 hours a day, seven days a week (including holidays) to consider requests for the issuance of arrest warrants and search warrants in misdemeanor and felony cases;
(b) Conducting hearings seven days a week (including holidays) to set bail for persons arrested, including the review of financial circumstances, and imposition of special conditions of pre‐trial release;
(c) Communicating with victims of domestic violence and victims of other violent or sex crimes to determine safety issues prior to consideration of bail;
(d) Presiding over felony preliminary hearings; (e) Presiding over warrant application hearings brought by both private citizens and law enforcement
officials; (f) Assigning a Superior Court Judge to each criminal case where bond has been set by a Magistrate Court
Judge (by Special Order of the Superior Court Judges, entered January 10, 2005). (g) Assigning a State Court Judge to each criminal case where bond has been set by a Magistrate Court
Judge (by Special Order of the State Court Judges, entered December 20, 2016). (h) Conducting hearings to set bail for persons arrested after indictment (true bill) by the grand jury on
cases where the Magistrate Judge would otherwise have the authority to set bail (by Special Order of the Superior Court Judges, entered January 11, 2006).
(3) Appointing defense counsel and presiding over the arraignment, trial, sentencing, and probation
revocation hearings in cases involving misdemeanor deposit account fraud (“bad checks”) less than
$1,500.00.
Goal #1
Continue to provide the highest level of services to the public by maximizing office efficiency and accuracy.
Objective #1
(a) Employ clerk staff sufficient to meet the operational needs of the Court. (b) Train new employees. (c) Continue to meet all statutory mandates for the scheduling and resolution of cases. (d) Maintain a current calendar with no backlog of pending cases. (e) Continue to maintain clerical errors and omissions at or below 5%. Continue to maintain errors on
filing of Statement of Claims, Dispossessory Warrants and Warrant Applications at or below 6%.
Mission
Goals and Objectives
Magistrate Court
FY22 Budget C-68

Goal #2
Continue to seek input both internally from department staff and externally from the judicial and legal
community, the business community, and other interested parties on ways to improve the operation of the
court, and make ongoing revisions to court procedures and court policies to implement the suggestions.
Objective #2
(a) Continue to hold quarterly staff meetings and receive input from the judges and court staff on department policies and procedures.
(b) Schedule periodic forums with members of the legal community, business community, and other interested parties to solicit input on ways to improve court operations.
(c) Continue to participate in the monthly Legal Pop‐up Clinics and provide information to the public on the resources available in Magistrate Court and provide copies of Magistrate Court forms.
(d) Continue to participate in refresher training for police officers and sheriff’s deputies on court procedures.
(e) Maintain open communication and coordination with all law enforcement.
Goal #3
Maximize the use of computer technology and the Internet to enhance and streamline court functions.
Objective #3
(a) Maintain and update the court’s webpage to ensure public access to information about the Magistrate Court, including links to frequently requested forms.
(b) Continue using the Electronic Warrant Interchange (EWI) program for efficient issuance of warrants.
(c) Continue using specialized software for access to police reports, which reduces paperwork, reduces the workload of police and court staff, and protects unauthorized release of information.
(d) Work with the County Law Library staff and its Legal Clinic volunteers to provide information about Magistrate Court.
(e) Establish and maintain video equipment to conduct virtual hearing during times of emergencies.
Goal #4
Develop and implement new data management system with SPLOST funds.
Objective #4
(a) In coordination with court, jail and law enforcement staff, develop data exchange system for sharing criminal records information.
(b) Work with Court Administrator to develop and implement a new case management system to manage civil cases, garnishments, and to promote other automated processing.
(c) Implement imaging project for all case files stored off‐site.
Magistrate Court
FY22 Budget C-69

Actual CY 20 Performance Measures
CY18 CY19 CY 20* Goal Actual
Goal #1
Warrant Application Filings 198 144 108
Criminal Arrest Warrants 6,310 7,099 6,612
Search Warrants 241 255 193 80% Returned 54% Returned
Criminal Hearings 2,916 2,947 2,765 5% Error Rate 12.8%
Civil Filings 4,707 5,037 3,192 5% Error Rate 10.9%
Civil Hearings 1,853 1,893 727 5% Error Rate 19.1%
Garnishment Answers 1,453 1,030 663 5% Error Rate Less than 1%
Goal #2
Quarterly Staff Meetings (4 sessions) 100% 100% 4 sessions 100% 100%
Monthly Pop‐Up Clinics (2 sessions
prior to pandemic) 100% 100%
2
sessions 100% 100%
Goal #3 – Technology
Magistrate Court Web Page Views 9,309 10,680 21,314 10% Increase 50% Increase
Arrest Warrants by EWI 5,118 5,847 5,675 80% Electronic 99%
Blood Search Warrants by EWI 4 0 1
Dispossessory E‐Filing 255 256 219 10% Increase Not Met
Public use of County Law Library
(New)
Goal #4
Criminal Data Exchange 100% 100% Met
New case management system 80% 80% Met
Imaging & Scanning (Off‐site Files) 20% Met
Financials (transactions in dollars) $807,894 $780,198 $480,357 5% Increase Not Met
*CY20 affected by COVID‐19 pandemic
Performance Measures
Magistrate Court
FY22 Budget C-70

$4,510 is included for operating expenses to cover additional costs. An increase in multiple expense items
necessitated a request for additional operating funds.
Other than the above additional operating expenses, there are no significant changes in the FY22 Budget
for the Magistrate Court.
Salary and benefit changes not included in the items above are due to performance management pay,
personnel turnover, changes in the vacancy factor, and/or reallocation of benefits applied by Human
Resources.
(All figures in $1,000s) FY20 FY21 FY22 FY22
Appropriations by Type Actual Budget Requested Approved $▲ %▲Salary & Benefits $759.5 $808.8 $828.0 $823.0 $14.2 1.8%
Operating $49.7 $73.3 $77.5 $77.5 $4.2 5.7%
Total $809.2 $882.1 $905.5 $900.5 $18.4 2.1%
FY20 FY21 FY22 FY22
Appropriations by Division Actual Budget Requested Approved $▲ %▲Court Operations $469.1 $539.0 $552.6 $547.6 $8.6 1.6%
Court Judge's Office $340.1 $343.0 $353.0 $353.0 $10.0 2.9%
Total $809.2 $882.0 $905.6 $900.6 $18.6 2.1%
FY22 FY22
FY20 FY21 Requested Approved ▲Fulltime Authorized Positions 11 11 11 11 0
Budget Highlights
Appropriation Summary
Authorized Positions
Magistrate Court
FY22 Budget C-71

The Office of the Manager is responsible for the implementation of all policies, programs, contracts,
ordinances, and resolutions as approved and directed by the Mayor and Commission. This office performs the
administrative functions of the government which support the activities of the Mayor and Commission. The
ACCGov Charter dictates the authority and the responsibility of the Manager.
During FY22, the Manager’s Office will focus on the following goals and objectives:
Guide the organization to produce a positive year‐end fund balance while minimizing operational and
service delivery interruptions.
Continue to monitor and evaluate both short‐term and long‐term financial projections and develop
recommendations to meet future operational challenges and/or opportunities.
Assist the Mayor and Commission in their efforts and intent to reform the criminal justice system.
Work with the Transit Department to implement a tiered approach to Fare Free Transit as directed by the
Mayor and Commission.
Continue the management of the SPLOST 2020 program, continue the management of the TSPLOST 2018
Program and pursue the closeout phase of the SPLOST 2011 Program.
Assist the Mayor and Commission in their efforts and intent to create more affordable housing and mixed
income neighborhoods within Athens‐Clarke County.
Support the Public Utilities Department in evaluating potential future water source alternatives and
implementing the service delivery plan.
Continue to support the Solid Waste Department’s efforts to refine and enhance solid waste reduction
efforts in order to meet defined Mayor and Commission goals. Adjust rates to fully realize revenue
recovery in each cost center.
Assist the Mayor and Commission in their efforts and intent to invest in human infrastructure, especially in
regards to the Prosperity Package.
Work with relevant departments to complete and implement the RFP process for a GIS‐Based Permitting
and Development Management System, including conversion to a fully digital plans review process.
Work with Corrections on programs to create opportunities for rehabilitated offenders.
Work with the Mayor’s Youth assembly to identify opportunities for at‐risk youth.
Monitor ACCGov’s ability to maintain competitive market wage adjustments and benefits to recruit and
retain employees.
Facilitate the completion of the Sustainability Plan. Further, to develop a strategy for ACCGov to become
100% clean and renewable energy by 2035.
Implement a performance metrics initiative tied to the M&C Strategic Commitments with public facing
dashboards.
Coordinate and cooperate with Office of Operational Analysis studies in order to seek improvements to
government functions and efficiencies.
Identify funding and partnership opportunities to implement various Corridor study recommendations
(Atlanta Hwy, Lexington Rd, Prince Ave).
Monitor and report on progress of the FY21‐FY22 M&C Goals and Strategies, establish a link with ongoing
agenda items, and implementing FY22 budget goals.
Mission & Goals
Goals/Objectives
Manager's Office
FY22 Budget C-72
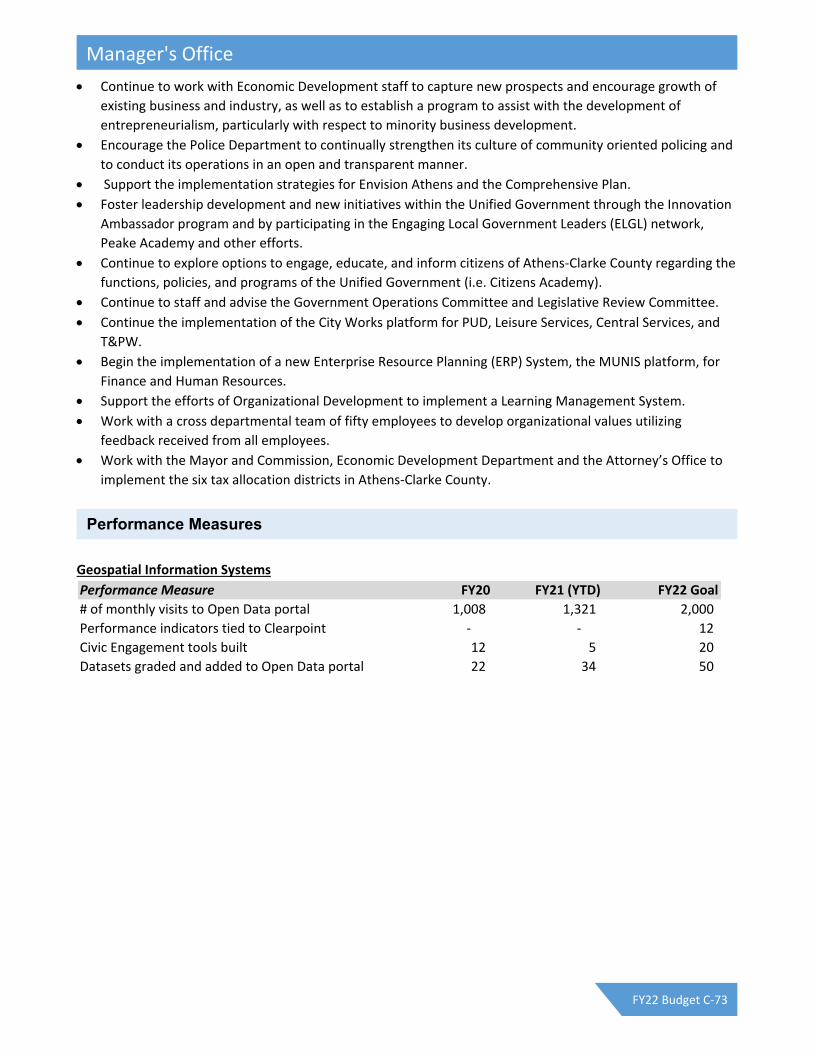
Continue to work with Economic Development staff to capture new prospects and encourage growth of
existing business and industry, as well as to establish a program to assist with the development of
entrepreneurialism, particularly with respect to minority business development.
Encourage the Police Department to continually strengthen its culture of community oriented policing and
to conduct its operations in an open and transparent manner.
Support the implementation strategies for Envision Athens and the Comprehensive Plan.
Foster leadership development and new initiatives within the Unified Government through the Innovation
Ambassador program and by participating in the Engaging Local Government Leaders (ELGL) network,
Peake Academy and other efforts.
Continue to explore options to engage, educate, and inform citizens of Athens‐Clarke County regarding the
functions, policies, and programs of the Unified Government (i.e. Citizens Academy).
Continue to staff and advise the Government Operations Committee and Legislative Review Committee.
Continue the implementation of the City Works platform for PUD, Leisure Services, Central Services, and
T&PW.
Begin the implementation of a new Enterprise Resource Planning (ERP) System, the MUNIS platform, for
Finance and Human Resources.
Support the efforts of Organizational Development to implement a Learning Management System.
Work with a cross departmental team of fifty employees to develop organizational values utilizing
feedback received from all employees.
Work with the Mayor and Commission, Economic Development Department and the Attorney’s Office to
implement the six tax allocation districts in Athens‐Clarke County.
Geospatial Information Systems
Performance Measure FY20 FY21 (YTD) FY22 Goal
# of monthly visits to Open Data portal 1,008 1,321 2,000
Performance indicators tied to Clearpoint ‐ ‐ 12
Civic Engagement tools built 12 5 20
Datasets graded and added to Open Data portal 22 34 50
Performance Measures
Manager's Office
FY22 Budget C-73
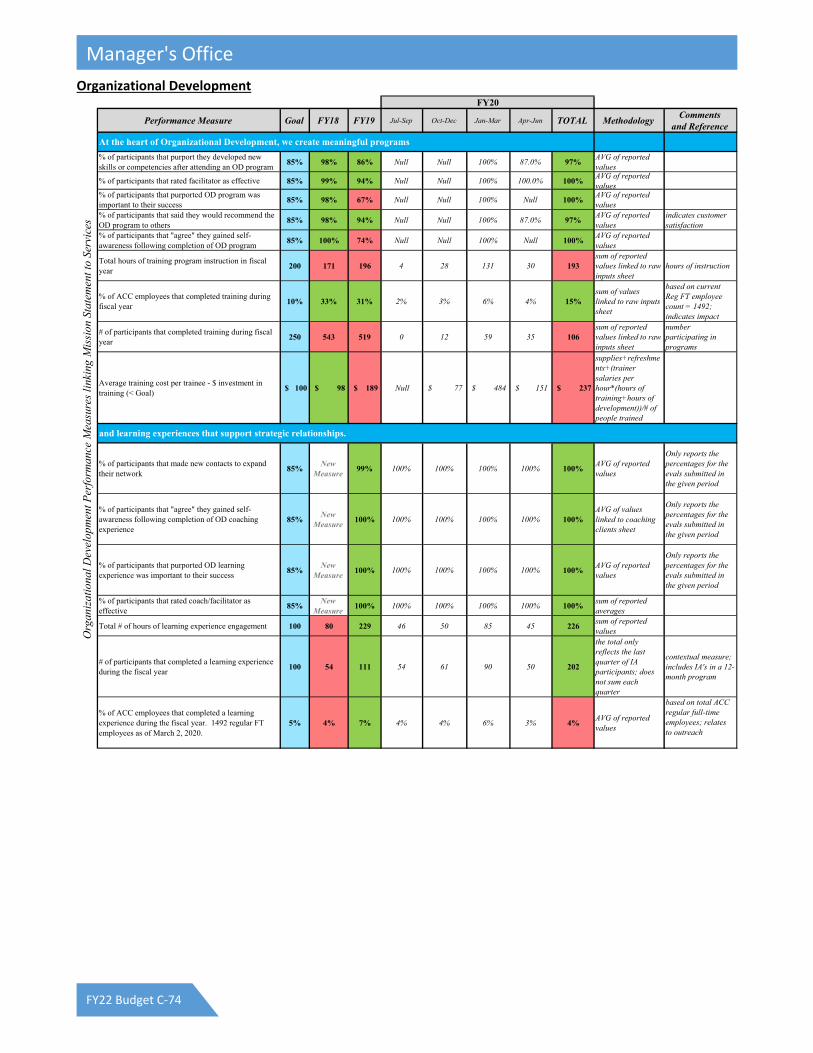
Organizational Development
FY20
Performance Measure Goal FY18 FY19 Jul-Sep Oct-Dec Jan-Mar Apr-Jun TOTAL MethodologyComments
and Reference
% of participants that purport they developed new skills or competencies after attending an OD program
85% 98% 86% Null Null 100% 87.0% 97%AVG of reported values
% of participants that rated facilitator as effective 85% 99% 94% Null Null 100% 100.0% 100%AVG of reported values
% of participants that purported OD program was important to their success
85% 98% 67% Null Null 100% Null 100%AVG of reported values
% of participants that said they would recommend the OD program to others
85% 98% 94% Null Null 100% 87.0% 97%AVG of reported values
indicates customer satisfaction
% of participants that "agree" they gained self-awareness following completion of OD program
85% 100% 74% Null Null 100% Null 100%AVG of reported values
Total hours of training program instruction in fiscal year
200 171 196 4 28 131 30 193sum of reported values linked to raw inputs sheet
hours of instruction
% of ACC employees that completed training during fiscal year
10% 33% 31% 2% 3% 6% 4% 15%sum of values linked to raw inputs sheet
based on current Reg FT employee count = 1492; indicates impact
# of participants that completed training during fiscal year
250 543 519 0 12 59 35 106sum of reported values linked to raw inputs sheet
number participating in programs
Average training cost per trainee - $ investment in training (< Goal)
$ 100 $ 98 $ 189 Null $ 77 $ 484 $ 151 $ 237
supplies+refreshments+(trainer salaries per hour*(hours of training+hours of development))/# of people trained
% of participants that made new contacts to expand their network
85%New
Measure 99% 100% 100% 100% 100% 100%
AVG of reported values
Only reports the percentages for the evals submitted in the given period
% of participants that "agree" they gained self-awareness following completion of OD coaching experience
85%New
Measure 100% 100% 100% 100% 100% 100%
AVG of values linked to coaching clients sheet
Only reports the percentages for the evals submitted in the given period
% of participants that purported OD learning experience was important to their success
85%New
Measure 100% 100% 100% 100% 100% 100%
AVG of reported values
Only reports the percentages for the evals submitted in the given period
% of participants that rated coach/facilitator as effective
85%New
Measure 100% 100% 100% 100% 100% 100%
sum of reported averages
Total # of hours of learning experience engagement 100 80 229 46 50 85 45 226sum of reported values
# of participants that completed a learning experience during the fiscal year
100 54 111 54 61 90 50 202
the total only reflects the last quarter of IA participants; does not sum each quarter
contextual measure; includes IA's in a 12-month program
% of ACC employees that completed a learning experience during the fiscal year. 1492 regular FT employees as of March 2, 2020.
5% 4% 7% 4% 4% 6% 3% 4%AVG of reported values
based on total ACC regular full-time employees; relates to outreach
Org
aniz
atio
nal D
evel
opm
ent P
erfo
rman
ce M
easu
res
link
ing
Mis
sion
Sta
tem
ent t
o Se
rvic
es
At the heart of Organizational Development, we create meaningful programs
and learning experiences that support strategic relationships.
Manager's Office
FY22 Budget C-74

Public Information Office
Performance Measure Goal FY15 FY16 FY17 FY18 FY19 FY20
Website visitorsData Only
1.60 million 1.80 million 1.89 million 2 million 2.06 million 2.65 million
Website pageviewsData Only
4.12 million 4.54 million 4.23 million 4.3 million 4.22 million 5 million
Website notification subscriptions (all notifications)
Data Only
27,145 (1/1/15)
N/A33,878
(6/14/17)37,818 42,972 53,003
Number of downloads from website
Data Only
1.1 million 685,795 732,801 1.1 million 1.05 million 1.8 million
NewsFlashes distributed 52 59 61 52 103 78 92NewsFlash items posted on accgov.com homepage
75 N/A N/A 50 (7 mo.) 206 225 209
Number of social media accounts managed (@accgov)
Data Only
N/A N/A 8 8 7 7
Social media following/subscribers for main ACC accounts
TBD N/A N/A N/A 12,190 14,93922,993
(May 4)
Minutes of video watched on social media
Data Only
N/A N/A N/A 166,804 215,842 1.72 million
Hours of Mayor & Commission meetings broadcast / streamed
Data Only
28:57 43:54 48:17 53:31 84:06 120:57
Minutes of non-meeting video produced
360 N/A N/A 36 (11/16 - 6/1 276 166 203
Number of offices featured in videos | newsflashes | homepage
TBD N/A N/A 7 | 20 | 19 28 | 21 | 25 21 | 26 | 29 24 | 34 | 26
Number of film project inquiries assisted
Data Only
7 11 23 25 25 17
Number served in outside group presentations, panels & tours
Data Only
N/A N/A N/A 185 266 119
Public digital displays managed
Data Only
9 9 9 7 7 7
Number of department website liaisons trained
Data Only
N/A 56 15 13 32 40
Number of department social media liaisons trained (SM@RT Team)
Data Only
N/A N/A 16 22 10 23
Number of social media accounts monitored
Data Only
N/A N/A N/A 70 73 90
Number of locations claimed and monitored in Google Business
Data Only
N/A N/A N/A N/A 93 102
Social Media Resource & Training (SM@RT) Team Best Practice & Training Session Hours
8 N/A N/A N/A 6 7.5 14.25
The Public Information Office provides clear and open communications through a variety of outlets about the government's goals, activities, and services
and coordinates and collaborates with other departments’ communications staff.
Manager's Office
FY22 Budget C-75

Sustainability Office
Outcomes and Performance Measures Current Goal FY16 FY17 FY18 FY19 FY20 Data Source Comments or Analsys
% of the community protected as greenspaceIncreasing to ≥20% by
202020.2% 20.6% ACC Sustainability Office
Source: ACC Sustainability Office; Next Steps- evaluate quality, connectivity, location, functionality to meet ecosystem goals
# of sites where natural area management is directed by an ecological management plans.
Increasing Annually 0 1 300.0% ACC Sustainability Office
"Ecological Management Plan" is defined as a long-term stewardship plan with defined objectives, short-term management prescriptions, and resource needs in order to achieve defined management goals. Source: ACC Sustainability Office
# of acres of ACC-owned natural areas under management.
Increasing - 40 51 60 70 ACC Sustainability Office
"Under Management" is defined as the implementation of intentional management actions (including taking no action) as directed by a site specific ecological management plan. Source: ACC Sustainability Office
% tree canopy cover in Athens-Clarke County.
≥45% 63.0% 63.0% 63.0% 63.0% 63.0% ACC Central Services. As measured by ACC sampling protocol using updated aerial photographs. FY19 metrics reflect updated analysis of the 2018 aerial photos. Source: ACC Central Services.
MW of renewable energy produced on, or consumed by ACC properties
Increasing Every 3 Years 5.863 5.883 6.541 6.593 6.593 ACC Sustainability Office Source: ACC Sustainability Office
ACC fuel consumption per citizen served.Decreasing Every 3
Years7.2 6.8 6.5 6.7 6.7
ACC Finance &Central Services
Source: ACC Finance & Central Services
ACC water consumption per citizen served.Decreasing ≤ 685 Gallons by 2050
744 737 742 748 748 ACC Public Utilities685 gallons accounts for a 70% reduction from a 2007 baseline. Source: ACC Public Utilities
MMBtu's of ACC energy use avoided through conservation measures.
Increasing to ≥ 9,550 2,786 3,221 6,176 10,987 10,987 ACC Sustainability Office9,550 MBTUs accounts for a 15% reduction in facility energy use from CY2007. Source: ACC Sustainability Office
ACC greenhouse gas emissions per citizen served.
Decreasing at Five Year Intervals to ≥50%
Reduction Over a 2005 Baseline
ACC Sustainability Office Source: ACC Sustainability Office
% of citizens who commute to work by driving alone.
Decreasing to ≤60% by 2050
74.6% 75.4% 74.6% 73.2% 72.7% American Community SurveyGoal Source: STAR community rating system. Data Source: American Community Survey
% of ACC fleet that is hybrid or alternatively fueled.
Increasing to ≥50% by 2050
- 4.5% 6.5% 6.6% 6.6% ACC Sustainability OfficeCalculations exclude non-motorized, small engine tools, and heavy equipment.
# of individuals engaged in Sustainability Office affiliated apprenticeships, internships, or job-training programs
4 per FTE 12 8 10 ACC Sustainability Office Source: ACC Sustainability Office
% of owner occupied homes Data Only 40.5% 38.5% 38.5% 39.0% 39.0% American Community Survey Source: American Community Survey; % of people living at or below the federal poverty level.
Decreasing to ≤18.5% by 2030
36.6% 35.2% 34.1% 36.9% 36.9% American Community SurveyGoal Source: STAR community rating system. Data Source: American Community Survey
American Community Survey civilian labor force annual unemployment rate (%)
Data Only 9.2% 8.6% 7.6% 6.4% 3.2% American Community Survey Source: American Community Survey
Cumulative thousand square feet of green buildings in the community.
Increasing Every 3 Years to ≥3,000 by 2050
928 934 934 934 934 ACC Sustainability Office Source: ACC Sustainability Office
% of population over 25 years with post-secondary degree attainment.
45% 45.9% 47.0% 47.9% 49.3% 44.0% American Community SurveyGoal Source: STAR community rating system. Data Source: American Community Survey
Value of sustained budget savings associated with energy, fleet, and water conservation projects.
$400,000 by FY29 $75,900 $100,900 $195,917 $248,920 $248,920 ACC Sustainability Office Source: ACC Sustainability Office
Value of grants, rebates, and donations affiliated with Sustainability Office activities.
Data Only $64,276 $389,764 $755,384 ACC Sustainability Office Source: ACC Sustainability Office
Amount of fine particulate matter in outside air
≤12 μg/m³ 8.8 8.2 7.6 7.6 8.324-hour PM2.5 calculated as the annual mean, averaged over 3 years. Sourced from the GA EPD air quality monitoring station located on Barnett Shoals Road. Source: Georgia DNR - EPD
Amount of ground level ozone found in outside air.
≤0.070 ppm 0.059 0.062 0.063 0.066 0.064Annual fourth-highest daily maximum 8-hour concentration, averaged over 3 years. Goal source: Clean Air Act.
# of people engaged by the Sustainability Office through in-person educational and volunteer activities.
100 per FTE 260 410 350 ACC Sustainability Office Source: ACC Sustainability Office
% of RS, C, O, and RM zoned properties within 1 mile of a recreational amenity.
Increasing every 3 Years to ≥70% by 2050
ACC Sustainability Office Source: ACC Sustainability Office
% of RS, and RM zones properties located with 1 mile of healthful food.
Increasing Every 3 Years ≥67% by 2050
ACC Sustainability OfficeGoal Srouce: USDA Food Desert Definition. Data Source: ACC Sustainability Office
% of RS, C, O, and RM zoned properties within 1 mile of transit stops or flex routes.
Increasing Every 3 Years ≥65% by 2050
ACC Sustainability Office Source: ACC Sustainability Office
% of population with health insurance coverage.
Data Only 83.5% 84.6% 85.3% 86.0% 86.5% American Community Survey Source: American Community Survey
Under Development - FY22
Under Development - FY22
We work with our staff and community to improve environmental stewardship,
Under Development - FY19
enhance our economy,
and advance social responsibility.
Georgia DNR - EPD
Under Development - FY22
Under Development - FY20
New for FY18
New for FY18
New for FY18
New for FY18
Manager's Office
FY22 Budget C-76

The Manager’s Office consists of six offices funded through the General Fund.
The Approved Budget for the Manager’s Office includes budgeted funding from the General fund for;
Administration Office
$18,900 for National Neighborhood Survey was moved from the Administration Office to the
Geospatial Information Office
Public Information Office
$90,280 ($67,470 Salary & Benefits) for a Community Engagement Specialist to focus on citizen
interaction and engagement activities
Sustainability Office
$53,508 for an Energy Program and Conservation Coordinator to develop and implement management
strategies, conservation program and policies. The position will start in the second half of the year
and will leverage $30,000 of current funding to partially fund the 6 months of operating expenses
and salary and benefits.
Inclusion Office
$134,894 for Blue Level Diversity, Equality and Inclusion Training to effectively implement structural
shifts that are sustainable.
Geospatial Information Office
$32,100 for the Clearpoint Performance Management Platform to fully fund the annual program
expenses.
$18,900 for National Neighborhood Survey was moved from the Administration Office to the GIO
Salary and benefit changes not included in the items above are due to performance management pay,
personnel turnover, changes in the vacancy factor, and/or reallocation of benefits applied by Human
Resources.
Budget Highlights
Manager's Office
FY22 Budget C-77

(All figures in $1,000s) FY20 FY21 FY22 FY22
Appropriations by Type Actual Budget Requested Approved $▲ %▲Salary & Benefits $1,635.8 $1,804.3 $2,454.6 $2,040.5 $236.2 13.1%
Operating $554.8 $748.6 $1,144.7 $942.2 $193.6 25.9%
Total $2,190.6 $2,552.9 $3,599.3 $2,982.7 $429.8 16.8%
FY20 FY21 FY22 FY22
Appropriations by Division Actual Budget Requested Approved $▲ %▲Manager's Administration $762.0 $818.5 $892.2 $835.9 $17.4 2.1%
Public Information Office $338.3 $346.5 $521.7 $440.9 $94.4 27.2%
Organizational Development $279.1 $307.2 $315.9 $289.9 ($17.3) ‐5.6%
Geographic Info. Office $312.8 $357.7 $445.9 $452.1 $94.4 26.4%
Sustainability Office $378.0 $434.0 $541.2 $474.9 $40.9 9.4%
Office of Inclusion $120.3 $289.0 $882.4 $489.0 $200.0 69.2%
Total $2,190.5 $2,552.9 $3,599.3 $2,982.7 $429.8 16.8%
FY20 FY21 FY22 FY22
Appropriations by Fund Actual Budget Requested Approved $▲ %▲General Fund $2,171.6 $2,553.0 $3,599.3 $3,031.3 $478.3 18.7%
Special Programs Fund $10.0 $0.0 $0.0 $0.0 $0.0 ‐‐
Grants Fund $8.9 $0.0 $0.0 $0.0 $0.0 ‐‐
Total $2,190.5 $2,553.0 $3,599.3 $3,031.3 $478.3 18.7%
Appropriation Summary
Manager's Office
FY22 Budget C-78
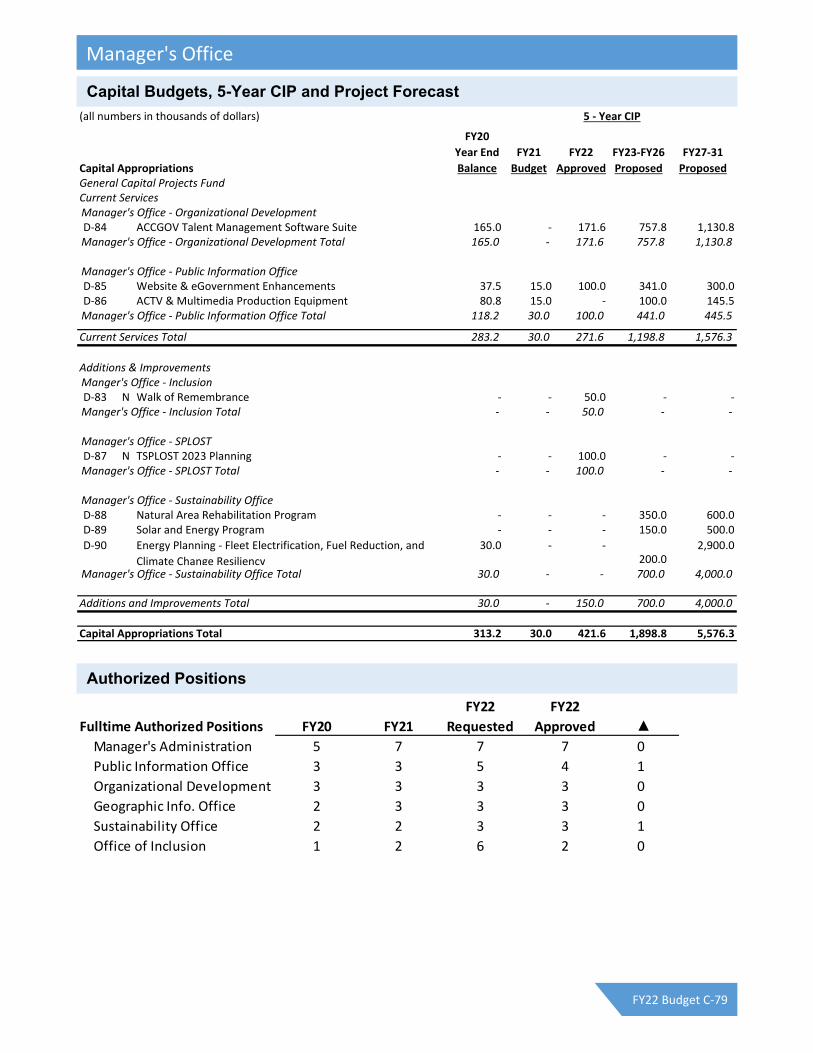
FY22 FY22
Fulltime Authorized Positions FY20 FY21 Requested Approved ▲Manager's Administration 5 7 7 7 0
Public Information Office 3 3 5 4 1
Organizational Development 3 3 3 3 0
Geographic Info. Office 2 3 3 3 0
Sustainability Office 2 2 3 3 1
Office of Inclusion 1 2 6 2 0
(all numbers in thousands of dollars) 5 ‐ Year CIP
Capital Appropriations
FY20
Year End
Balance
FY21
Budget
FY22
Approved
FY23‐FY26
Proposed
FY27‐31
ProposedGeneral Capital Projects FundCurrent ServicesManager's Office ‐ Organizational DevelopmentD‐84 ACCGOV Talent Management Software Suite 165.0 ‐ 171.6 757.8 1,130.8Manager's Office ‐ Organizational Development Total 165.0 ‐ 171.6 757.8 1,130.8
Manager's Office ‐ Public Information OfficeD‐85 Website & eGovernment Enhancements 37.5 15.0 100.0 341.0 300.0D‐86 ACTV & Multimedia Production Equipment 80.8 15.0 ‐ 100.0 145.5Manager's Office ‐ Public Information Office Total 118.2 30.0 100.0 441.0 445.5
Current Services Total 283.2 30.0 271.6 1,198.8 1,576.3
Additions & ImprovementsManger's Office ‐ InclusionD‐83 N Walk of Remembrance ‐ ‐ 50.0 ‐ ‐Manger's Office ‐ Inclusion Total ‐ ‐ 50.0 ‐ ‐
Manager's Office ‐ SPLOSTD‐87 N TSPLOST 2023 Planning ‐ ‐ 100.0 ‐ ‐Manager's Office ‐ SPLOST Total ‐ ‐ 100.0 ‐ ‐
Manager's Office ‐ Sustainability OfficeD‐88 Natural Area Rehabilitation Program ‐ ‐ ‐ 350.0 600.0D‐89 Solar and Energy Program ‐ ‐ ‐ 150.0 500.0
D‐90 Energy Planning ‐ Fleet Electrification, Fuel Reduction, and
Climate Change Resiliency
30.0 ‐ ‐200.0
2,900.0
Manager's Office ‐ Sustainability Office Total 30.0 ‐ ‐ 700.0 4,000.0
Additions and Improvements Total 30.0 ‐ 150.0 700.0 4,000.0
Capital Appropriations Total 313.2 30.0 421.6 1,898.8 5,576.3
Capital Budgets, 5-Year CIP and Project Forecast
Authorized Positions
Manager's Office
FY22 Budget C-79

The Mayor and Commission serve as the governing authority of the Unified Government of Athens‐Clarke
County with powers and jurisdiction throughout the territorial limits of Athens‐Clarke County. The Mayor and
Commission are elected to establish policy through the adoption of Ordinances and Resolutions, and are
responsible for placing in effect the powers conferred by the Charter, which created the Unified Government
of Athens‐Clarke County; and for the promotion and protection of the safety, health, peace, security, and
general welfare through ordinances, resolutions, rules, and regulations. The Mayor and Commission have the
power to set tax rates and adopt a budget. It is the responsibility of the Mayor and Commission to assure the
cost efficient and effective delivery of quality services to every citizen and entity in a fair and equitable
manner, and to act as liaison and advocate for citizens experiencing problems with, or needing information
from government services.
Clerk of Commission
The Clerk of the Commission directs the activities necessary to prepare for Commission meetings and
dispenses information regarding the decisions and actions of the Commission.
Forecast
FY19 FY20 FY21 FY22
Provide support for Mayor and Commission Meetings
Regular 12 12 12 12
Agenda 12 12 12 12
Special 17 20 24 24
Agenda items processed for Mayor and Commission staff and posting to
website for public
245 225 313 350
Open records requests processed 250 250 329 350
Contracts processed for the Mayor's signature 290 250 334 340
Work requests processed 313 235 151 180
Boards, authorities and commissions applications 120 150 83 100
Mission
Performance Measures
Mayor & Commission
FY22 Budget C-80

The Approved Budget for the Mayor and Commission includes no significant changes.
Salary and benefit changes are due to performance management pay and/or reallocation of benefits applied
by Human Resources
(All figures in $1,000s) FY20 FY21 FY22 FY22
Appropriations by Type Actual Budget Requested Approved $▲ %▲Salary & Benefits $586.0 $621.8 $629.6 $629.6 $7.8 1.3%
Operating $22.8 $47.6 $47.6 $47.6 $0.0 0.0%
Total $608.8 $669.4 $677.2 $677.2 $7.8 1.2%
FY20 FY21 FY22 FY22
Appropriations by Division Actual Budget Requested Approved $▲ %▲Mayor's Office $151.2 $161.4 $163.9 $163.9 $2.5 1.5%
Commission's Office $279.7 $296.8 $301.2 $301.2 $4.4 1.5%
Clerk of Commission $177.9 $211.2 $212.1 $212.1 $0.9 0.4%
Total $608.8 $669.4 $677.2 $677.2 $7.8 1.2%
FY22 FY22
FY20 FY21 Requested Approved ▲Fulltime Authorized Positions
Mayor's Office 1 1 1 1 0
Clerk of Commission 2 2 2 2 0
Budget Highlights
Appropriation Summary
Authorized Positions
Mayor & Commission
FY22 Budget C-81

The mission of the Municipal Court is to fairly, efficiently and accurately adjudicate state misdemeanor and
traffic cases; county ordinance cases; and county administrative cases in accordance with the laws of the
United States; the State of Georgia; and the Charter and Municipal Code of the Unified Government.
The Municipal Court’s goals are to:
Treat all who have business before the Court with courtesy and respect.
Apply the law fairly, impartially, and efficiently.
Deter criminal behavior and reduce recidivism through the imposition of prompt and appropriate sentences and sanctions, designed to address the individual circumstances of each case.
Manage dockets, calendars, and processes to guarantee the timely and accurate disposition of court cases.
Protect the integrity of the Court’s proceedings and processes.
Collect and manage public funds accurately and securely.
Through all of these goals, to engender public confidence in the Municipal Court; for the Unified Government of Athens‐Clarke County; and for the judicial system as a whole.
To expand the use of technology to increase access to Municipal Court, dispose of cases more efficiently
and elevate customer satisfaction
To continue scanning old paper files with the goal of reducing or eliminating off‐site storage costs
To partner with other departments (Athens‐Clarke County Police Department, Athens‐Clarke County Probation, Athens Clarke County Clerk of Court for State and Superior Court) in linking our computer databases to allow for the free flow of information thereby increasing the accuracy of information
Actual Forecast
FY18 FY19 FY20 FY21 FY22
Criminal/Traffic 16,463 18,687 11,362 13,237 16,463
Ordinance 348 396 264 290 330
Red Light Camera 9303 3,414(1) 0 6,100(2) 6,900(2)
School Bus Camera 586 329(3) 369 550(2) 575(2)
Administrative Hearings 15 16 8 15 20
Parking 3,022 3,308 2,156 2,900 3,200
Total Cases 29,737 26,150 14,159 23,092 27,488
(1) GDOT did not approve the Red Light Camera on U.S. Highway 29 and Georgia Highway 72 because of lack of vehicular accident
data. Also, there were permitting issues with the current Red Light Cameras that required the cameras to be disabled from
February, 2019 – June, 2020. (2) A new system, “School Zone Cameras” will be operational by spring of 2021. These cameras are moveable and will rotate
weekly between different school zones. This new system, along with the Barnett Shoals and Alps Road cameras, could increase
the number of citations greatly. These current calculations are only based on the projected number of Red Light and School Bus
Camera cases.
Mission
Goals
Objectives
Performance Measures
Municipal Court
FY22 Budget C-82
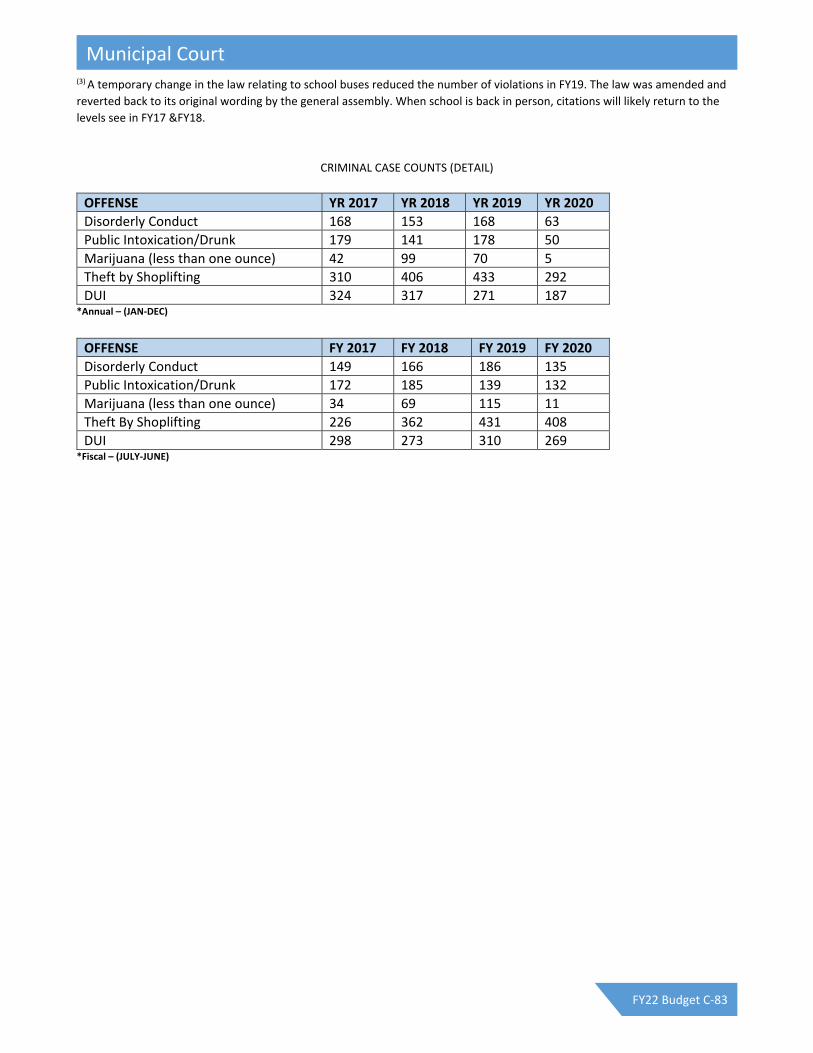
(3) A temporary change in the law relating to school buses reduced the number of violations in FY19. The law was amended and
reverted back to its original wording by the general assembly. When school is back in person, citations will likely return to the
levels see in FY17 &FY18.
CRIMINAL CASE COUNTS (DETAIL)
OFFENSE YR 2017 YR 2018 YR 2019 YR 2020
Disorderly Conduct 168 153 168 63
Public Intoxication/Drunk 179 141 178 50
Marijuana (less than one ounce) 42 99 70 5
Theft by Shoplifting 310 406 433 292
DUI 324 317 271 187 *Annual – (JAN‐DEC)
OFFENSE FY 2017 FY 2018 FY 2019 FY 2020
Disorderly Conduct 149 166 186 135
Public Intoxication/Drunk 172 185 139 132
Marijuana (less than one ounce) 34 69 115 11
Theft By Shoplifting 226 362 431 408
DUI 298 273 310 269 *Fiscal – (JULY‐JUNE)
Municipal Court
FY22 Budget C-83

There are no significant changes for the FY22 Budget for Municipal Court.
Salary and Benefit changes are due to personnel turnover and/or reallocation of benefits applied by
Human Resources.
(All figures in $1,000s) FY20 FY21 FY22 FY22
Appropriations by Type Actual Budget Requested Approved $▲ %▲Salary & Benefits $608.3 $628.9 $643.7 $641.2 $12.3 2.0%
Operating $48.0 $73.4 $73.4 $73.4 $0.0 0.0%
Total $656.3 $702.3 $717.1 $714.6 $12.3 1.8%
FY20 FY21 FY22 FY22
Appropriations by Division Actual Budget Requested Approved $▲ %▲Court Operations $466.7 $505.7 $516.3 $513.8 $8.1 1.6%
Judge's Office $189.7 $196.6 $200.8 $200.8 $4.2 2.1%
Total $656.4 $702.3 $717.1 $714.6 $12.3 1.8%
FY22 FY22
FY20 FY21 Requested Approved ▲Fulltime Authorized Positions 10 10 10 10 0
Budget Highlights
Appropriation Summary
Authorized Positions
Municipal Court
FY22 Budget C-84

The Office of Operational Analysis was created by the Charter of the Unified Government of Athens‐Clarke
County to conduct a continuing internal audit of the fiscal affairs and operations of every department, office,
and agency of the Unified Government. The Office of Operational Analysis's mission is to promote
transparency and accountability and to make recommendations that improve operations and strengthen
internal controls of all departments and agencies of the Unified Government of Athens‐Clarke County.
The objective of the Office of Operational Analysis is to provide independent analyses, appraisals, and recommendations for the following activities:
1. Providing risk‐based and objective insight into all departments and agencies' risk management level to facilitate the development of the audit work plan;
2. Reviewing and appraising the operations of departments and agencies; 3. Determining whether financial controls are in place to minimize losses; 4. Recommending operational improvements; 5. Determining whether a department or agency is achieving its mission, goals, and objectives; 6. Assessing compliance with established policies and procedures.
Actual Forecast
FY18 FY19 FY20 FY21 FY22
Number of Audit Assignments/year. 3 1 2 3 3
Mission
Objectives
Performance Measures
Operational Analysis
FY22 Budget C-85

$3,600 is included for Audit Software licensing fees to cover the total cost of previously approved
software.
Salary and benefit changes are due to personnel turnover and/or reallocation of benefits applied by
Human Resources.
(All figures in $1,000s) FY20 FY21 FY22 FY22
Appropriations by Type Actual Budget Requested Approved $▲ %▲
Salary & Benefits $235.5 $274.5 $257.4 $249.4 ($25.1) ‐9.1%
Operating $48.1 $49.4 $53.0 $53.6 $4.2 8.5%
Total $283.6 $323.9 $310.4 $303.0 ($20.9) ‐6.5%
FY22 FY22
FY20 FY21 Requested Approved ▲Fulltime Authorized Positions 3 3 3 3 0
Budget Highlights
Appropriation Summary
Authorized Positions
Operational Analysis
FY22 Budget C-86

Other Financing Uses Budget includes transfers from one fund to another. Transfers from the General Fund to
other funds are principally to provide additional financial support for the operations and programs within
those funds or to meet legal requirements. Transfers between other funds are typically the reimbursement of
the cost for support provided by another fund or to meet legal requirements.
A $3.1 million increase is included for Transfers from the General Fund to the General Capital Projects
Fund intended to extend the life of existing assets and program areas. This is particularly focused on
lifecycle maintenance for our existing parks and facilities.
$400,000 is budgeted for a transfer from the General Fund to the Special Programs Fund for the cost of a
Disparity Study.
There are no other significant changes budgeted for FY22.
For more information on interfund transfers see the E‐Section of the budget.
(All figures in $1,000s) FY20 FY21 FY22 FY22
Appropriations by Fund Actual Budget Requested Approved $▲ %▲General Fund $6,204.9 $4,088.1 $48,156.1 $7,728.3 $3,640.2 89.0%
Hotel/Motel Fund $190.0 $160.5 $123.7 $90.3 ($70.2) ‐43.7%
Sheriff Inmate Fund $9.8 $35.0 $35.0 $35.0 $0.0 0.0%
General Capital Project Fd $1.3 $0.0 $0.0 $0.0 $0.0 ‐‐
Airport Fund $74.6 $69.4 $66.7 $66.7 ($2.7) ‐3.9%
Landfill Fund $331.3 $312.1 $324.3 $324.3 $12.2 3.9%
Transit System Fund $676.1 $706.0 $699.8 $699.8 ($6.2) ‐0.9%
Water & Sewer Fund $1,733.6 $1,813.4 $1,787.1 $1,787.1 ($26.3) ‐1.5%
Solid Waste Fund $268.5 $276.8 $280.0 $280.0 $3.2 1.2%
Storm Water Utility Fund $379.6 $399.5 $371.9 $371.9 ($27.6) ‐6.9%
Water/Sewer Construc. Fd $123.0 $100.0 $98.1 $98.1 ($1.9) ‐1.9%
Internal Support Fund $41.5 $43.8 $42.2 $42.2 ($1.6) ‐3.7%
Fleet Management Fund $104.0 $103.8 $102.4 $102.4 ($1.4) ‐1.3%
Insurance & Claims Fund $338.0 $45.4 $43.8 $43.8 ($1.6) ‐3.5%
Health Insurance Fund $30.4 $32.7 $38.5 $38.5 $5.8 17.7%
Total $10,506.6 $8,186.5 $52,169.6 $11,708.4 $3,521.9 43.0%
Mission
Budget Highlights
Appropriation Summary
Other Financing Uses
FY22 Budget C-87

Other General Administration includes responsibilities and expenses not related to any one department,
general governmental costs, expenditures budgeted for but not yet allocated to a specific department or
project, and the government's operating contingency. The Finance Director develops the Budget for Other
General Administration.
The FY21 Budget for Other General Administration for all funds includes the following as well as other costs:
Funding for health insurance for retirees (or Other Post‐Employment Benefits – OPEB) is $6.4 million. $6.1
million of this amount is budgeted in the General Fund and covers OPEB costs for the General Fund,
enterprise funds, and internal service funds. The budget for OPEB in other funds totals $286,400.
$1.9 million ($1.3 in the General Fund) is budgeted for the Self‐ Funded General Liability program.
This budget includes $1.1 million ($627,000 in the General Fund) to fund the government's Employee
Performance Management Program. The Performance Management Program is designed to reward and
retain current employees who meet the highest levels of performance. The Mayor and Commission have
authorized the Manager to transfer these funds to department budgets for implementation.
General Fund
The General Fund Other General Administration includes the following:
$2.2 million for Pension funding for enterprise funds and internal service funds
$1.9 million for the FY22 portion of a revised pay plan for public safety employees, which was
implemented in FY21 (The Mayor and Commission have authorized the Manager to transfer these funds to
department budgets for implementation)
$750,000 to establish a minimum wage of $15 per hour for all county employees (The Mayor and
Commission have authorized the Manager to transfer these funds to department budgets for
implementation)
$170,000 as part of the Commission initiative for Public Safety and Community Building
$128,000 for the Government’s participation in the Northeast Georgia Regional Commission
$125,000 to budget for Leave for Compensated Absences
$110,000 for auditing and accounting fees
$100,000 to provide support for emergency medical services through a contract with Athens Regional
Medical Center
An Operating Contingency of $1,200,000, which is the same as the FY21 Budget
$31,000 for the employee/retiree Holiday Luncheon and $21,000 for an employee Spring event.
The FY22 budget for Other General Administration also includes the Government’s dues and memberships
to the organizations listed below.
Georgia Municipal Association 26,500 Association of County Commissioners of Georgia 14,400 National League of Cities 9,000 Alliance for Innovation 7,650 Athens Area Chamber of Commerce 3,900 Georgia Forestry Commission 3,000 National Association of Counties 2,500 Other 1,800
Total $59,750
Mission
Budget Highlights
Other General Administration
FY22 Budget C-88
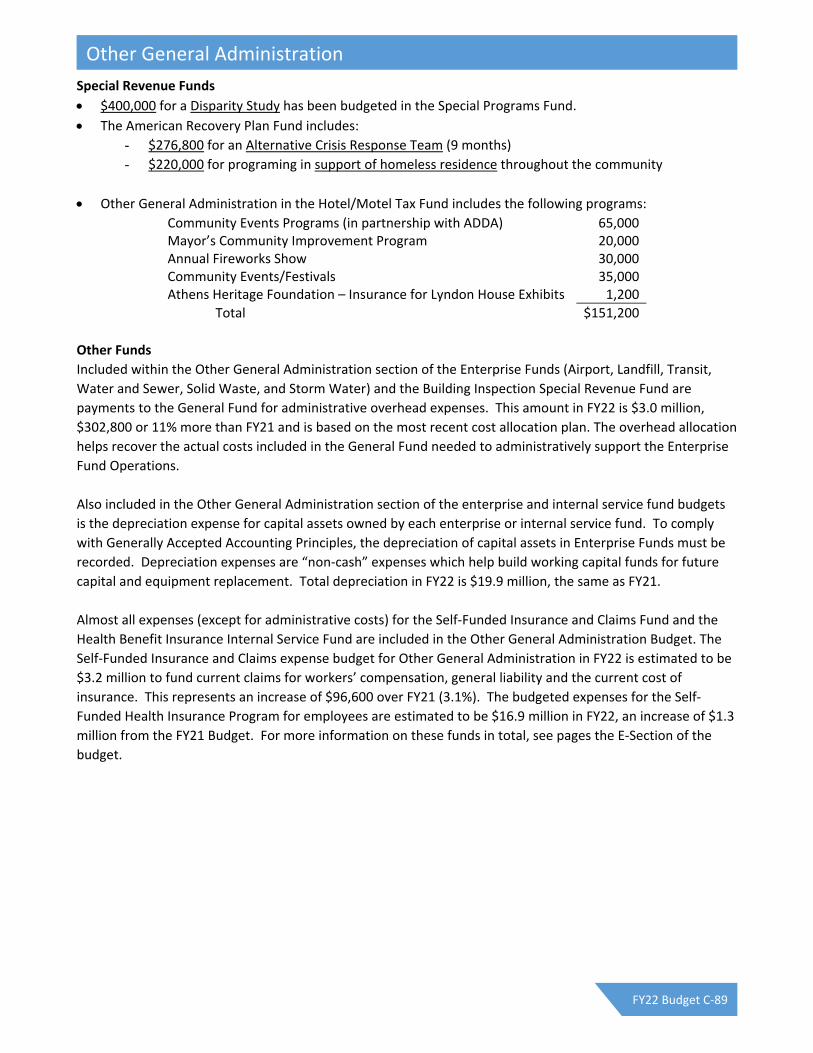
Special Revenue Funds
$400,000 for a Disparity Study has been budgeted in the Special Programs Fund.
The American Recovery Plan Fund includes:
- $276,800 for an Alternative Crisis Response Team (9 months)
- $220,000 for programing in support of homeless residence throughout the community
Other General Administration in the Hotel/Motel Tax Fund includes the following programs:
Community Events Programs (in partnership with ADDA) 65,000 Mayor’s Community Improvement Program 20,000 Annual Fireworks Show 30,000 Community Events/Festivals 35,000 Athens Heritage Foundation – Insurance for Lyndon House Exhibits 1,200
Total $151,200
Other Funds
Included within the Other General Administration section of the Enterprise Funds (Airport, Landfill, Transit,
Water and Sewer, Solid Waste, and Storm Water) and the Building Inspection Special Revenue Fund are
payments to the General Fund for administrative overhead expenses. This amount in FY22 is $3.0 million,
$302,800 or 11% more than FY21 and is based on the most recent cost allocation plan. The overhead allocation
helps recover the actual costs included in the General Fund needed to administratively support the Enterprise
Fund Operations.
Also included in the Other General Administration section of the enterprise and internal service fund budgets
is the depreciation expense for capital assets owned by each enterprise or internal service fund. To comply
with Generally Accepted Accounting Principles, the depreciation of capital assets in Enterprise Funds must be
recorded. Depreciation expenses are “non‐cash” expenses which help build working capital funds for future
capital and equipment replacement. Total depreciation in FY22 is $19.9 million, the same as FY21.
Almost all expenses (except for administrative costs) for the Self‐Funded Insurance and Claims Fund and the
Health Benefit Insurance Internal Service Fund are included in the Other General Administration Budget. The
Self‐Funded Insurance and Claims expense budget for Other General Administration in FY22 is estimated to be
$3.2 million to fund current claims for workers’ compensation, general liability and the current cost of
insurance. This represents an increase of $96,600 over FY21 (3.1%). The budgeted expenses for the Self‐
Funded Health Insurance Program for employees are estimated to be $16.9 million in FY22, an increase of $1.3
million from the FY21 Budget. For more information on these funds in total, see pages the E‐Section of the
budget.
Other General Administration
FY22 Budget C-89

(All figures in $1,000s) FY20 FY21 FY22 FY22
Appropriations by Fund Actual Budget Requested Approved $▲ %▲General Fund $10,167.6 $13,885.8 $14,592.3 $15,176.3 $1,290.5 9.3%
Hotel/Motel Fund $114.8 $166.5 $166.5 $151.2 ($15.3) ‐9.2%
CDBG Fund $5.5 $9.9 $5.5 $5.5 ($4.4) ‐44.4%
Emergency Telephone Fund $171.9 $195.4 $198.9 $198.9 $3.5 1.8%
HOME Fund $0.0 $0.0 $0.0 $0.0 $0.0 ‐‐
Grants Fund $97.9 $27.1 $27.1 $27.1 $0.0 0.0%
Alt. Dispute Resolution Fund $17.5 $15.7 $16.0 $16.0 $0.3 1.9%
Affordable Housing Fund $5.2 $105.2 $116.7 $35.2 ($70.0) ‐66.5%
Special Programs Fund $84.2 $103.7 $93.7 $493.7 $390.0 376.1%
Building Inspection Fund $224.1 $244.8 $258.1 $258.1 $13.3 5.4%
ARP Fund $0.0 $0.0 $0.0 $496.8 $496.8 ‐‐
Tax Allocation Districts $0.0 $0.0 $389.0 $389.0 $389.0 ‐‐
Airport Fund $480.3 $484.3 $503.6 $503.6 $19.3 4.0%
Landfill Fund $988.2 $1,063.1 $1,142.8 $1,142.8 $79.7 7.5%
Transit System Fund $3,735.9 $4,868.1 $4,971.4 $4,971.4 $103.3 2.1%
Water & Sewer Fund $15,580.6 $15,331.3 $15,524.8 $15,524.8 $193.5 1.3%
Solid Waste Fund $726.5 $705.6 $718.0 $718.0 $12.4 1.8%
Stormwater Fund $1,489.4 $1,486.8 $1,508.9 $1,508.9 $22.1 1.5%
Internal Support Fund $87.5 $52.3 $53.4 $53.4 $1.1 2.1%
Fleet Management Fund $28.1 $35.7 $35.1 $35.1 ($0.6) ‐1.7%
Fleet Replacement Fund $90.0 $90.0 $90.0 $90.0 $0.0 0.0%
Insurance & Claims Fund $2,354.8 $3,094.6 $3,191.2 $3,191.2 $96.6 3.1%
Health Insurance Fund $14,464.5 $15,583.4 $16,912.8 $16,912.8 $1,329.4 8.5%
Total $50,914.5 $57,549.3 $60,515.8 $61,899.8 $4,350.5 7.6%
Appropriation Summary
Other General Administration
FY22 Budget C-90
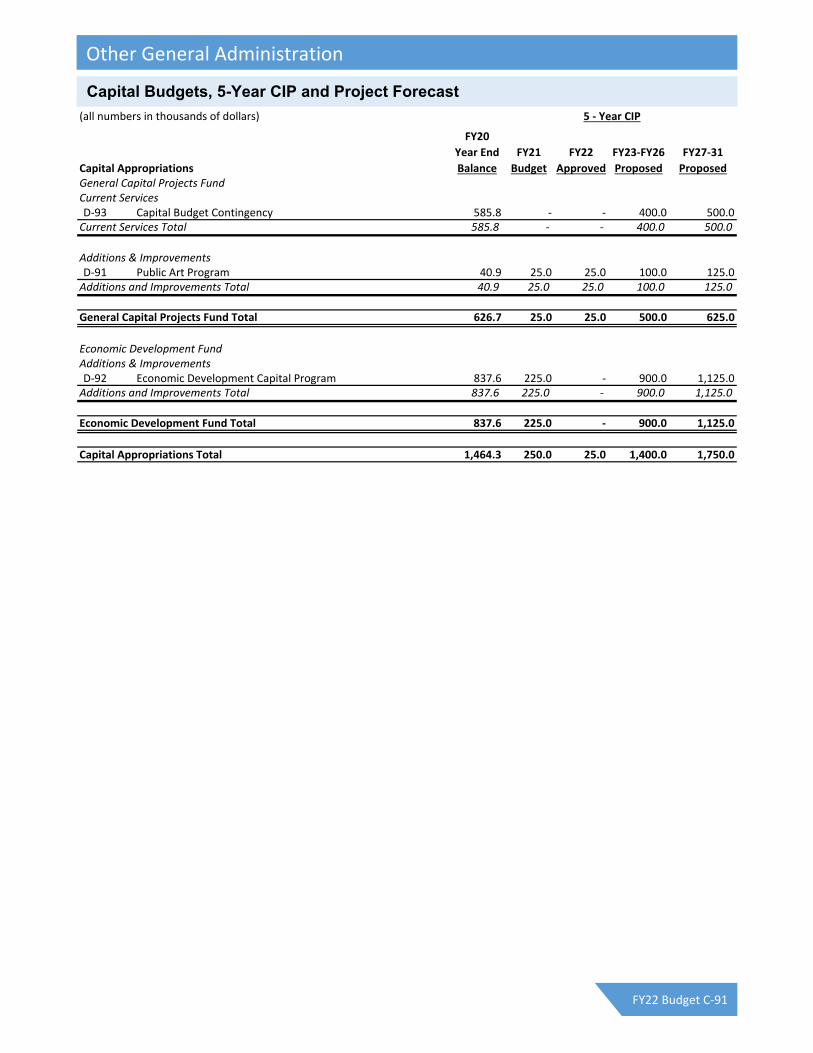
(all numbers in thousands of dollars) 5 ‐ Year CIP
Capital Appropriations
FY20
Year End
Balance
FY21
Budget
FY22
Approved
FY23‐FY26
Proposed
FY27‐31
ProposedGeneral Capital Projects FundCurrent ServicesD‐93 Capital Budget Contingency 585.8 ‐ ‐ 400.0 500.0Current Services Total 585.8 ‐ ‐ 400.0 500.0
Additions & ImprovementsD‐91 Public Art Program 40.9 25.0 25.0 100.0 125.0Additions and Improvements Total 40.9 25.0 25.0 100.0 125.0
General Capital Projects Fund Total 626.7 25.0 25.0 500.0 625.0
Economic Development FundAdditions & ImprovementsD‐92 Economic Development Capital Program 837.6 225.0 ‐ 900.0 1,125.0Additions and Improvements Total 837.6 225.0 ‐ 900.0 1,125.0
Economic Development Fund Total 837.6 225.0 ‐ 900.0 1,125.0
Capital Appropriations Total 1,464.3 250.0 25.0 1,400.0 1,750.0
Capital Budgets, 5-Year CIP and Project Forecast
Other General Administration
FY22 Budget C-91

To effectively manage community change in both the short and long term with regard to land use,
transportation, historic preservation, urban design and overall community development in order to ensure
that the natural and built environment of Athens‐Clarke County are of the highest quality.
Maintain a high level of accuracy and efficiency in the administration of construction plans review,
processing of zoning decisions, and certificates of appropriateness so that 95% of all application reviews are completed within established timeframes.
Promote a long‐range view of community planning that assists the Mayor and Commission and the Planning Commission in focusing on more than zoning decisions through incorporation of Comprehensive Plan initiatives and projects within the Community Work Program.
Improve coordination with other Athens‐Clarke County departments and governmental agencies in identifying and looking at the long‐term infrastructure impacts associated with new development and development‐related policies. This will be accomplished through a predictable presence at related board/committee meetings, and in conformance with the adopted Service Delivery Strategy.
Expand and routinely maintain the associated departmental GIS system, and promote the integration of GIS technology into appropriate governmental functions through upgrades in system software/hardware in coordination with the Geographic Information Office.
Continue to identify, recommend, and support potential solutions and alternatives to regional planning issues through coordination and participation in MPO functions and by responding to all applicable Developments of Regional Impact.
Continue to enhance the community planning and development service capabilities of the Unified Government by providing additional equipment and training to Planning Department staff as well as the members of the appointed boards staffed by the Planning Department.
Afford all customers prompt, courteous, and impartial service that maintains established schedules and
review times, while clearly articulating process instructions or review comments.
Provide the general public with reasonable access to all public information managed and retained by the Planning Department by consistently updating the departmental webpage.
Review all staff‐administered (over the counter) applications within 48 hours of a complete submittal.
Strive for all staff reports to be entirely accurate, concise, and error‐free.
Hold quarterly long‐range planning sessions with the Planning Commission.
Offer Planning staff and newly appointed board members at least one (1) significant training opportunity annually. This is subject to the availability of financial resources.
Mission
Goals
Objectives
Planning & Zoning
FY22 Budget C-92

PLANNING DEPARTMENT PERFORMANCE MEASURES
To effectively manage community change in both the short and long term with regard to land use, transportation, historic preservation, urban design and overall community
development in order to ensure that the natural and built environment of Athens-Clarke County are of the highest quality.
Performance Measure Goal FY17 FY18 FY19 FY20 FY21 FY22
Zoning Actions and Special Use permits
Data Only
21 38 26 24 28 30
Variance requests Data Only
21 16 22 14 20 17
% of Board and Commission applications processed and recommendations forwarded on time
95% 100% 100% 100% 99% 100% 100%
Site and/or building plans submitted through Plans Review
Data Only
254 254 242 240 234 240
New Plan Reviews submittals processed within designated time
95% -- -- -- 96.0% 97% 98%
Zoning permits issued Data Only
921 936 1089 1091 986 1041
Preliminary subdivision plats Data Only
4 4 4 9 6 5
Final subdivision plats Data Only
78 69 82 77 72 75
Sign permits issued Data Only
182 175 152 111 125 140
Home Occupation permits issued
Data Only
200 202 138 165 128 147
Demolition reviews Data Only
129 111 105 79 76 80
Environmental Areas permits Data Only
105 101 110 84 79 87
Customer service hours (phone / walk-ins)
Data Only
3700 3900 3950 4990 3550 4900
Zoning verifications Data Only
387 393 422 462 276 304
Historic Preservation requests - staff & HPC review
Data Only
134 136 162 131 154 158
% of COAs processed at staff level as a % of total
50% 50% 50% 54% 62% 68% 55%
Number of Open Records Requests responded to with 3 business days
100% 90% 90% 100% 100% 100% 100%
Alcohol licenses Data Only
-- -- 51 39 34 40
Performance Measures
Planning & Zoning
FY22 Budget C-93

There are no significant changes in the FY22 Budget for the Planning Department.
$2,100 is included for vehicle replacement charges. General Fund vehicle replacement charges were
removed from the FY21 Budget by the Mayor and Commission and have been reinstated for FY22.
In addition to funding from the General Fund, the Panning Department uses funding for one Senior Planner
position and a Planner II position from the Building Inspection Special Revenue Fund totaling $142,900.
The Planning Department also receives a Transportation Planning grant ($238,300) that is 80% federally
funded.
Salary and benefit changes not included in the items above are due to performance management pay,
personnel turnover, changes in the vacancy factor, and/or reallocation of benefits applied by Human
Resources.
For information on individual fees, see the Schedule of Fees and Charges beginning on page G‐15.
(All figures in $1,000s) FY20 FY21 FY22 FY22
Appropriations by Type Actual Budget Requested Approved $▲ %▲Salary & Benefits $1,328.2 $1,406.8 $1,417.3 $1,412.3 $5.5 0.4%
Operating $96.5 $159.7 $164.3 $153.7 ($6.0) ‐3.8%
Total $1,424.7 $1,566.5 $1,581.6 $1,566.0 ($0.5) 0.0%
FY20 FY21 FY22 FY22
Appropriations by Fund Actual Budget Requested Approved $▲ %▲General Fund $1,067.2 $1,172.9 $1,200.4 $1,184.8 $11.9 1.0%
Building Inspection Fund $151.3 $151.5 $142.9 $142.9 ($8.6) ‐5.7%
Grants Fund $206.2 $242.1 $238.3 $238.3 ($3.8) ‐1.6%
Total $1,424.7 $1,566.5 $1,581.6 $1,566.0 ($0.5) 0.0%
Billboards Data Only -- -- 5 7 9 8
Concept review Data Only -- -- 2 6 8 10
Engineering Plans Review Data Only -- -- 9 3 8 6
Historic Tax Exemption Data Only -- -- 13 15 12 16
Special Event Permit Data Only -- -- 0 3 3 3
Timber Harvest Data Only -- -- 18 17 13 15
Tree Management Plan Data Only -- -- 74 50 88 90
Budget Highlights
Appropriation Summary
Planning & Zoning
FY22 Budget C-94

FY22 FY22
FY20 FY21 Requested Approved ▲Fulltime Authorized Positions 18 18 18 18 0
(all numbers in thousands of dollars) 5 ‐ Year CIP
Capital Appropriations
FY20
Year End
Balance
FY21
Budget
FY22
Approved
FY23‐FY26
Proposed
FY27‐31
ProposedGeneral Capital Projects FundCurrent ServicesD‐96 N Replace Large Format Printer (KIP) ‐ ‐ ‐ 30.0 ‐Current Services Total ‐ ‐ ‐ 30.0 ‐
Additions & ImprovementsD‐94 N Permitting Software Equipment ‐ ‐ ‐ 50.0 ‐D‐95 Comprehensive Plan Five/Ten Year Update ‐ ‐ ‐ 50.0 300.0Additions and Improvements Total ‐ ‐ ‐ 100.0 300.0
Capital Appropriations Total ‐ ‐ ‐ 130.0 300.0
Capital Budgets, 5-Year CIP and Project Forecast
Authorized Positions
Planning & Zoning
FY22 Budget C-95
To support and defend the U.S. Constitution, protect and safeguard all life, and ensure the equal
protection of rights for all as we work to reduce both crime and the fear of crime.
To build the highest levels of trust and confidence within the community through fair and impartial
policing.
To embrace and practice community‐oriented, problem‐oriented, and constitutional policing philosophies.
Educating the public, mentoring the youth, and involving community stakeholders are the foundations of
our service delivery and crime prevention strategies. By acting with integrity and transparency, we are
committed to enhancing community partnerships and building trust and confidence in all that we do.
The Athens‐Clarke County Police Department has adopted community‐oriented policing, the SARA model of problem‐solving, and problem‐orienting policing approaches as our key management tools and operational philosophies. Community‐oriented policing is law enforcement's mirroring of changes ongoing throughout the country. Community‐oriented policing embodies law enforcement's response to the growing concern of citizens that government play a more responsive role in addressing the quality of life issues affecting our communities. Community‐oriented policing is a management and operational philosophy of full‐service, personalized policing where the same officer patrols and works in the same area on a permanent basis, from a decentralized place, working in a proactive partnership with citizens to identify and solve problems.
1. Primary Goal: Relationships with the Public As Sir Robert Peel stated in 1829: "The police are the public and the public are the police. The police are only members of the public that are paid to give full‐time attention to duties that are incumbent upon every citizen in the interest of community welfare and existence." The Constitution of the State of Georgia states public safety is the paramount duty of government. Thus, the primary goal of this department is to form partnerships with the citizenry that prevent crime while enhancing the community's safety and improving the quality of life. The department and citizens accomplish their primary goal in a distinct, two‐fold mode:
o When they serve the public by saving lives, aiding the injured, locating the lost, keeping the peace, and providing assistance and advice that prevents crime and/or improves the quality of life.
o When they enforce the laws and ordinances of the jurisdiction efficiently, effectively, and equitably in all neighborhoods.
The department must perform its mission within the Constitution and with respect for law. All departments are bound and obligated to recognize and adhere both to the statutory as well as the judicial limitations of police authority. It is not the role of police to legislate, to render legal judgments, or to punish. It is the role of police in partnership with the public to problem‐solve.
Mission Statement & Vision
Community-Oriented Policing
Goals & Objectives
Police Services
FY22 Budget C-96

a) Enhance trust and legitimacy between the police department and community.
o Assist with the development and sustainment of the Law Enforcement Advisory Panel to
advise the Chief of Police in matters of community issues, review potential policies and
procedures, and provide guidance to the chief on service and police related issues.
o Expand the types of information and documentation available through the Transparency in
Policing link on the ACCPD Website to include current departmental policies and procedures,
and information concerning departmental demographics, complaints, and use of force.
o Increase transparency with the community through increased use of social media posts,
inclusive of Public Service Announcements.
o Host community meetings at various locations within the county.
o Host virtual community meetings.
o Administer a community‐wide survey to gauge overall satisfaction with police services.
o Sustain and enhance community outreach initiatives and programs.
b) Transform the ACCPD into a premier law enforcement agency
o Implement relevant recommendations from the President’s Task Force on 21st Century
Policing, as funded by the FY22 budget.
o Develop and implement all new departmental policies and procedures grounded in
community‐oriented, problem‐oriented, and constitutional policing philosophies.
o Provide the best response and safety equipment to ensure employees have the equipment
necessary to do their jobs and ensure their safety.
o Sustain recruitment efforts to seek full staffing of the department.
2. Prevention of Crime The primary responsibility for upholding the law lies not with the police but with the people. Since crime is a social problem, crime prevention is the concern of every person living in society. Society employs full‐time professional police to assist in preventing crime and to deter it, and when that fails, to apprehend those who violate the law. Crime is a symptom of the ills in society which are not the sole responsibility of the police to cure. The police are responsible for interacting with the community to generate a mutual understanding so that there may be public support for crime prevention. Community involvement is essential to facilitate a free flow of information between the public and the police; to assist in the identification of problem areas and to inform the public of crime trends and statistics. Additionally, knowledge of the community is essential so that each officer and employee may be instilled with a sense of concern for crime problems and law enforcement needs.
a) Create a safer Athens‐Clarke County.
o Reduce violent crime in calendar year 2021 to levels at, or below, the mean for violent crimes over
the last five (5) years.
o Develop a system to identify prolific violent offenders in order to work with the District Attorney’s
Office to keep the identified violent prolific offenders in custody.
3. Deterrence of Crime & Offender Apprehension: Deterrence of Crime Street crime is curbed by the potential criminal's fear of immediate apprehension or by the increased likelihood of detection. Deterrence of crime requires the investigation of behavior which reasonably appears
Police Services
FY22 Budget C-97

criminal in nature. In deploying patrol forces to inspire public confidence in the police's ability to ensure a peaceful environment, a balance must be struck between the deterrent effect of visible patrol and the undesirable appearance of oppression. Apprehension of Offenders The administration of justice consists of the identification, arrest, prosecution, and punishment of the violator, the objective of which is voluntary compliance with the law. Once a crime has been committed, the duty of the police is to initiate the criminal justice system process by identifying and arresting the perpetrator, to obtain necessary evidence, and to cooperate in the prosecution of the case. As the certainty of swift and sure punishment serves as an effective deterrent to crime, so must the police strive to solve all crimes and bring perpetrators to justice.
a) Create a safer Athens‐Clarke County.
o Identify the top crime areas within Athens‐Clarke County and develop appropriate strategies to
reduce crime in each identified area.
o Reduce the threat to public safety presented by gang‐related criminal activities by prioritizing
community outreach efforts, prevention, participation in the Youth Development Task Force, and
through zero‐tolerance enforcement for all gang related crimes.
b) Stabilize and sustain current service delivery strategy through appropriate allocation of personnel.
o Review and strengthen the assigned zone officer program.
o Develop and implement a departmental performance measures system that allows the ACCPD to
demonstrate the totality of its work and allow for the reporting of traditional measures (e.g.,
incident reports, citations, arrests) while also focusing on non‐traditional performance measures
of building trust and confidence within the community (e.g., problem oriented policing projects,
community outreach meetings, etc.).
4. Recovery & Return of Stolen Property: The actual costs of crime are difficult to measure; a dollar value cannot be placed on broken bodies, ruined lives, and human misery. However, it is possible to observe the mounting costs of lost and stolen property. This loss, as well as other costs of crime, must ultimately be borne by the victims. To minimize the losses of crime, the police will make every reasonable effort to recover lost and stolen property, to identify the owner, and ensure its prompt return. 5. Safe Movement of Traffic: To facilitate the safe and expeditious movement of vehicular and pedestrian traffic, the police must exercise the responsibility for traffic law enforcement. To enforce compliance with traffic laws and to develop driver awareness of the causes of traffic accidents, the police will appropriately warn, cite, or arrest traffic law violators. Traffic accidents are investigated to protect the rights of the injured parties, to care for those injured, and to determine the cause of the accidents so that methods of prevention may be developed and implemented.
a) Create a safer Athens‐Clarke County.
o Reduce levels of serious injury by vehicle and fatality crashes in calendar year 2021 to levels at, or
below, the mean for serious injury vehicle and fatality crashes over the last five (5) years.
Police Services
FY22 Budget C-98

6. Public Service Often, because there are no other private agencies available, the public relies upon the police for assistance and advice in the many routine and emergency situations that occur in their lives. Saving lives, aiding the injured, locating lost persons, keeping the peace, and providing for the many other miscellaneous needs are basic services provided by the department.
a) Create a safer Athens‐Clarke County.
o Achieve compliance with the Association of Public Safety Communications standard for answering
90% of all 911 calls within 10 seconds.
b) Enhance the department’s response to mental health crisis incidents.
o Provide the Crisis Intervention Unit the necessary resources to meet increasing demands for
service in response to mental health consumers.
o Meet or exceed the necessary grant requirements to demonstrate full support in the efforts of the
Mental Health Collaborative Grant Initiative.
o Identify the appropriate final recommendations from the Mental Health Collaborative Grant
Initiative for inclusion into departmental policies, procedures, and operations.
o With the sustainment of the mental health collaborative and refinement of data sharing, the
continued diversion of persons in mental health crisis to supportive programs rather than entering
the criminal justice system.
c) Maintain Accreditation and Certification.
o Maintain accreditation through The Commission on Accreditation for Law Enforcement Agencies
(CALEA).
o Maintain certification through the Georgia Association of Chiefs of Police (GACP) Law Enforcement
Certification Program.
Police Services
FY22 Budget C-99

Performance Measures
Police Services
FY22 Budget C-100

General Fund
The General Fund represents the largest portion of the Police Department’s budget and supports most of the
operations for the Department. The Approved Budget for the Police Department includes budgeted funding
from the General fund for;
$335,576 to expand the Mental Health Co‐Responder Program from 3 teams to 7 teams by the end of
2021.
$67,699 for the Mental Health Co‐Responder Teams to fully fund the 3 current teams in FY22.
$400,737 for vehicle replacement charges to begin funding a portion of the vehicle replacement
contributions for public safety vehicles. This funding was shifted entirely to the SPLOST 2020 program
for FY20 and FY21.
E‐911 Fund
The Central Communications Division operates within the Emergency Telephone System Special Revenue Fund,
E‐911, primarily funded through 911 fees and General Fund support. The Approved Budget for the Police
Department includes budgeted funding from the E911 fund for;
$25,000 for Central Communications training to establish a budget in the E911 fund for training of central
communication personnel.
Salary and benefit changes for the Police Department not included in the items above are due to performance
management pay, personnel turnover, changes in the vacancy factor, and/or reallocation of benefits applied
by Human Resources.
For more information on the Emergency Telephone Fund, see page E‐11.
Budget Highlights
Police Services
FY22 Budget C-101

(All figures in $1,000s) FY20 FY21 FY22 FY22
Appropriations by Type Actual Budget Requested Approved $▲ %▲Salary & Benefits $21,634.8 $22,425.6 $23,859.9 $22,552.5 $126.9 0.6%
Operating $3,571.4 $3,666.5 $4,812.5 $4,470.8 $804.3 21.9%
Total $25,206.2 $26,092.1 $28,672.4 $27,023.3 $931.2 3.6%
FY20 FY21 FY22 FY22
Appropriations by Division Actual Budget Requested Approved $▲ %▲Command $4,516.3 $1,544.8 $1,984.8 $1,610.4 $65.6 4.2%
Field Operations $9,664.9 $11,560.7 $12,773.4 $11,978.1 $417.4 3.6%
Crime Investigation $2,882.9 $3,880.6 $4,276.5 $4,122.1 $241.5 6.2%
Strategic & Professional Dev. $44.2 $65.3 $40.3 $40.3 ($25.0) ‐38.3%
Support Services $2,645.8 $2,756.2 $2,792.6 $2,683.2 ($73.0) ‐2.6%
Community Outreach $1,618.5 $2,014.5 $2,288.1 $2,117.8 $103.3 5.1%
Special Operations $1,238.6 $948.6 $990.4 $945.1 ($3.5) ‐0.4%
Central Communications $2,595.0 $3,321.4 $3,526.3 $3,526.3 $204.9 6.2%
Total $25,206.2 $26,092.1 $28,672.4 $27,023.3 $931.2 3.6%
FY20 FY21 FY22 FY22
Appropriations by Fund Actual Budget Requested Approved $▲ %▲General Fund $21,153.4 $22,513.3 $24,913.7 $23,264.6 $751.3 3.3%
Emergency Telephone Fund $2,595.0 $3,346.4 $3,526.3 $3,526.3 $179.9 5.4%
Special Programs Fund $465.3 $148.3 $148.3 $148.3 $0.0 0.0%
Grants Fund $992.5 $84.1 $84.1 $84.1 $0.0 0.0%
Total $25,206.2 $26,092.1 $28,672.4 $27,023.3 $931.2 3.6%
Appropriation Summary
Police Services
FY22 Budget C-102

FY22 FY22
FY20 FY21 Requested Approved ▲Fulltime Authorized Positions 320 331 338 331 0
(all numbers in thousands of dollars) 5 ‐ Year CIP
Capital Appropriations
FY20
Year End
Balance
FY21
Budget
FY22
Approved
FY23‐FY26
Proposed
FY27‐31
ProposedGeneral Capital Projects FundCurrent ServicesD‐97 On‐Officer Cameras and Data Storage 331.8 230.0 276.1 1,092.6 1,365.7D‐98 Replacement of Conducted Energy Device (CED) Units ‐ 228.2 276.1 1,092.6 1,365.7D‐101 Replace Investigative Operations Vehicles 0.1 ‐ ‐ 280.0 367.5D‐102 Motorcycle Replacement Program ‐ ‐ 60.0 240.0 315.0D‐103 Renovate Training/Firing Range ‐ ‐ ‐ 150.0 ‐D‐104 N Use of Force Simulator Replacement Plan ‐ ‐ ‐ 350.0 150.0D‐105 Mobile Computing Replacement Program 106.4 195.0 195.0 780.0 975.0D‐106 Police Radio Battery & Microphone Replacement Cycle ‐ ‐ ‐ 172.0 215.0D‐107 ACCPD Network Server Replacement Lifecycle 25.0 25.0 25.0 100.0 125.0D‐108 Maintenance of Downtown Safety Camera System 68.5 ‐ 60.0 120.0 300.0D‐110 N Replacement of Computer‐Aided Dispatch (CAD) Workstations ‐ ‐ ‐ 60.0 60.0D‐111 N Mobile Command Center Replacement ‐ ‐ ‐ 850.0 ‐D‐113 Ballistic Vest Replacement (Rifle Plates & Carriers) ‐ ‐ ‐ 50.0 ‐Current Services Total 531.8 678.2 892.1 5,337.1 5,238.9
Additions & ImprovementsD‐99 N 15 Additional Police Vehicles for Patrol Operations ‐ ‐ ‐ 456.0 715.0D‐100 N Additional Police Vehicles (25) ‐ ‐ ‐ 750.0 1,180.0D‐109 N Mental Health Co‐Responder Team Vehicle ‐ ‐ 43.0 ‐ 45.0D‐112 Emergency Medical Dispatch (EMD) Program ‐ ‐ ‐ 100.0 ‐Additions and Improvements Total ‐ ‐ 43.0 1,306.0 1,940.0
Capital Appropriations Total 531.8 678.2 935.1 6,643.1 7,178.9
Capital Budgets, 5-Year CIP and Project Forecast
Authorized Positions
Police Services
FY22 Budget C-103

The mission of the Probate Court is to serve the public, protect the incapacitated, and assist persons living with mental illness, dementia or other cognitive impairments, safeguarding the due process rights of all with efficiency and grace.
To implement a new case management software that will replace the current case management
software allowing for more efficient and streamline case processing.
To digitize and index records of court proceedings for the period 1976‐1997 which are currently not
publicly accessible in a format other than the original records, to bring us into compliance with the
law.
To improve and facilitate information retrieval while safe‐guarding historical documents.
To better monitor and audit annual return and inventory filings by conservators, administrators and
executors promptly, to recover all funds misappropriated by fiduciaries under the court’s jurisdiction,
and to remove malfeasors from office.
To protect incapacitated persons vulnerable to exploitation, neglect or abuse from harm, as well as
safeguarding public safety by being attentive to signs of possible harm and/or abuse.
To work closely with Pioneer, our newly contracted case management system provider, to streamline
court procedures by adapting the software to our court’s needs and by fully utilizing the features available to reduce case processing time by 20%, once we go live.
To ensure that reporting and accounting requirements are met by all guardians, conservators and personal representatives of estates by using our new time‐driven capability to trigger reminder letters, notices to appear and other applicable monitoring and enforcement mechanisms in 100% of new cases and in 50% of old ones per year over the next two years to begin upon the completion of software upgrade.
To continue partnership with the Treatment and Accountability Court, Advantage Behavioral Health Systems, the Department of Behavioral Health and Developmental Disabilities, law enforcement and other mental health stakeholders to improve access to treatment and supportive services for those with mental illness and/or addictive disease by providing judicial support, training and expertise as requested.
Actual Forecast FY17 FY18 FY19 FY20 FY21
Marriage License Applications 1,097 1,008 998 804 430
Firearms License Applications 1,254 1,162 1,113 883 1,532
Mental Health Applications 33 23 26 24 35
Inventory/Returns Filings 156 145 153 160 170
Estate/Docket Filings 520 539 581 475 308
TOTALS 3,035 2,877 2,871 2,346 2,475
Mission
Goals
Objectives
Performance Measures
Probate Court
FY22 Budget C-104

There are no significant changes in the FY22 Budget for Probate Court.
Salary and benefit changes are due to personnel turnover and/or reallocation of benefits applied by
Human Resources.
(All figures in $1,000s) FY20 FY21 FY22 FY22
Appropriations by Type Actual Budget Requested Approved $▲ %▲Salary & Benefits $485.7 $494.4 $441.4 $436.4 ($58.0) ‐11.7%
Operating $28.1 $35.1 $35.1 $35.1 $0.0 0.0%
Total $513.8 $529.5 $476.5 $471.5 ($58.0) ‐11.0%
FY22 FY22
FY20 FY21 Requested Approved ▲Fulltime Authorized Positions 6 6 6 6 0
Budget Highlights
Appropriation Summary
Authorized Positions
Probate Court
FY22 Budget C-105

Our staff is committed to provide an uninterrupted supply of safe drinking water for public health, fire
protection and economic productivity, and to safely convey and recycle wastewater in an environmentally
responsive way. We operate and manage an effective and reliable enterprise, and responsibly reinvest in
public health and environmental protection infrastructure at value to our ratepayers.
Maintain the economic value of the public’s water and sewer systems while improving its level of service
Provide suitable technology to educate Athens‐Clarke County citizens on environmental issues and to improve customer services
Provide quality drinking water to protect and enhance the well‐being of the citizens of Athens‐Clarke County
Maintain and improve the public water distribution and wastewater collection systems to meet the current and future needs of Athens‐Clarke County.
Adopt and /or expand new technology to provide efficient and improved operations, performance data and customer service
Continue to safely recycle clean water from wastewater system
Upgrade wastewater treatment to achieve better water quality and more beneficial reuse of residuals
Continue evaluation, replacement and/or rehabilitation of the public water transmission and distribution
lines in a priority order
Continue evaluation, replacement and rehabilitation of the public wastewater trunk and interceptor lines, in a priority order
Evaluate and modify as necessary the Water Conservation Program ensuring that environmental, economic and public outreach goals are achieved
Maintain water and sewer rates at affordable levels
Continue utilization of the Wastewater Flow Monitoring Program to prioritize infiltration / inflow reduction
Implement a non‐potable recycle system to improve water supply resilience and reliability
Implement water transmission line grid improvements to reduce impact of potential water service interruptions
Initiate a three‐year strategic plan to improve the department and the utility system’s performance and accountability
Install tertiary treatment at two of the Water Reclamation Facilities (WRF) and Class A biosolids Program at the North Oconee WRF
Mission
Goals
Objectives
Public Utilities
FY22 Budget C-106

Performance Measure Goal FY17 FY18 FY19 FY20 Notes Metric Definition/ Reference
Drinking water produced (mgd) NA 12.46 12.23 12.61 12.41 Report only 12‐month rolling average drinking water pumped into the distribution system
% SDWA compliance rate 100% 100% 100% 100% 100% Goal = AWWA/WEF Median % of previous 365 days in continuous compliance with Safe Drinking Water Act
Water main breaks / 100 miles < 7.9 5.5 5.7 3.5 5.1 Goal < AWWA/WEF Median # of water main breaks (excl leaks) prior 12 months per 100 miles of distribution system mains
ISO fire rating 1/1X 2/2X 2/2X 1/1X 1/1X ISO Public Protection Classific'n ISO Public Protection Classification
Reclaimed wastewater (mgd) NA 11.14 11.80 13.51 12.01 Report only 12‐month rolling average effluent from all three Water Reclamation Facilities
NOWRF peaking factor (annual) < 1.25 1.24 1.10 1.09 1.41 Goal < MNGWPD Average average of max month mgd divided by annual average mgd
MOWRF peaking factor (annual) < 1.25 1.30 1.24 1.53 1.90 Goal < MNGWPD Average average of max month mgd divided by annual average mgd
CCWRF peaking factor (annual) < 1.25 1.48 1.17 1.36 1.80 Goal < MNGWPD Average average of max month mgd divided by annual average mgd
% Sewer inspection > 7.8% 10.6% 18.9% 28.8% 57.0% Goal > AWWA/WEF Median % of miles of sanitary sewers camera inspected prior 12 months by PUD
SSOs / 100 miles of public sewer / yr < 18 3.9 2.5 4.3 5.1 Goal < AWWA/WEF Median # of sanitary sewer overflows into State waters per 100 miles of sewers prior 12 months
SSO volume as % of total flow < 0.005% 0.0009% 0.0021% 0.0164% 0.0675% Goal > 99,995 of every 100,000 gallons will be delivered to the cumulative 12‐month SSO volume divided by cumulative 12‐month effluent flow
Net kWh / million gallons JGB WTP 1796 2,199 2,237 2,199 2,134 Goal < AWWA/WEF Median net kWh used divided by total finished water prior 12 months
Net kWh / million gallons NOWRF 2380 4,519 4,237 3,644 4,086 Goal < AWWA/WEF Median net kWh used divided by total effluent flow prior 12 months
Net kWh / million gallons MOWRF 2380 4,171 3,659 3,187 3,336 Goal < AWWA/WEF Median net kWh used divided by total effluent flow prior 12 months
Net kWh / million gallons CCWRF 2380 3,997 3,759 3,439 3,425 Goal < AWWA/WEF Median net kWh used divided by total effluent flow prior 12 months
% CWA compliance rate 100% 100% 100% 100% 100% Goal = AWWA/WEF Median % of previous 365 days in continuous compliance with Clean Water Act at all 3 WRFs
% Apparent water loss (annual CY) * < 3.3 1.38 1.38 1.4 Goal < AWWA/WEF Median % apparent losses divided by total water supplied per year
% Real water loss (annual CY) * <10.3 7.94 8.41 5.1 Goal < AWWA/WEF Median % real losses divided by total water supplied per year
JGB WTP peaking factor (annual) < 1.6 1.2 1.2 1.1 Goal < MNGWPD Average http://northgeorgiawater.org/wp‐content/uploads/2018/03/Appendix_B_County‐Level‐Summaries‐AMENDED.pd
Debt coverage ratio (annual CAFR) > 2.34 2.46 2.54 2.75 Goal > AWWA/WEF Median net operating funds divided by debt obligations
Return on assets (annual CAFR) > 2.40% 4.55% 4.47% 4.52% Goal > AWWA/WEF Median net income divided by total assets
Operating ratio (annual CAFR) > 55% 74.11% 73.14% 72.52% Goal > AWWA/WEF Median
Debt ratio (annual CAFR) < 33% 45.52% 42.54% 40.05% Goal < AWWA/WEF Median total liabilities divided by total assets
Debt per capita (annual CAFR) < $1,700 1,806 1,733 1,663 from Fitch's report end‐of‐year outstanding notes and bonds divided by population estimate
Water and sewer bond rating (periodic) AA+ AA+ AA+ AA+ AA+ Goal > AWWA/WEF Median rating by Fitch's Rating Agency
% CIP R&R sanitary sewers (annual) > 1.5% 1.37% 2.19% 1.20% 2.29% Goal > AWWA/WEF Median % actual 12‐month R&R capex divided by 50‐year sewer R&R needs
% CIP R&R water lines (annual) > 1.5% 3.61% 4.26% 2.43% 1.63% Goal > AWWA/WEF Median % actual 12‐month R&R capex divided by 50‐year water distribution system R&R needs
% CIP R&R treatment plants (annual) > 2.3% 2.94% 1.40% 1.29% 3.32% Goal > AWWA/WEF Median % actual 12‐month R&R capex divided by 50‐year facility R&R needs
Water affordability index < 0.90% 1.00% 1.02% 1.05% 0.86% Goal <= AWWA/WEF Median average annual water bill / median household income
Wastewater affordability index < 0.96% 1.07% 1.11% 1.16% 0.97% Goal <= AWWA/WEF Median annual average wastewater bill / median household income
% Electronic and credit card payments > 40% new new 41% 45% tbd ACH plus EFT plus credit card payments divided by total payments
Average call wait time ** < 1:30 new 1:14 1:25 1:19 Goal < AWWA/WEF Median
Average call duration ** < 3:30 new 2:28 2:30 2:52 Goal < AWWA/WEF Median
Calls per customer service rep annual * > 3,681 new 4,985 5,071 5335 Goal > AWWA/WEF Median Based on 9 FTE customer service reps
Distribution O&M $ / 100 miles water < $546,503 $198,401 $189,390 $136,056 $162,063 Goal < AWWA/WEF Median
Collection O&M $ / 100 miles sewer < $654,229 $439,369 $486,783 $429,194 $583,209 Goal < AWWA/WEF Median
NOWRF O&M $ / mgal effluent $1,495 $1,175 $1,320 $1,339 $1,675 Goal < AWWA/WEF 25th percentile
MOWRF O&M $ / mgal effluent $1,495 $1,417 $1,396 $1,326 $1,395 Goal < AWWA/WEF 25th percentile
CCWRF O&M $ / mgal effluent $1,495 $1,448 $1,817 $1,601 $1,691 Goal < AWWA/WEF 25th percentile
JGBWTP O&M $ / mgal production $803 $686 $966 $724 $734 Goal < AWWA/WEF 25th percentile Includes BCR
*Water Loss Data is provided in March for each calendar year
Glossary
AWWA means American Water Works Association MHI means median household income
Capex means historical capital expenditure Median means 50th percentile of performance by other utilities
CWA means federal Clean Water Act R&R means capital rehabilitation and replacement
ISO means Insurance Service Office SDWA means federal Safe Drinking Water Act
JGBWTP means the J.G. Beacham Water Treatment Plant SSO means sanitary sewer overflows that reach waters of the State
kWh means kilowat hours WEF means Water Environment Federation
mgal means million gallons WRF means water reclamation facility
mgd means million gallons per day
at value to our ratepayers.
Our staff is committed to provide safe drinking water for public health, fire protection and economic productivity,
and safely convey and reclaim wastewater
in an environmentally responsive way.
We run an effective and reliable enterprise
responsibly reinvesting in public health and environmental protection infrastructure
Performance Measures
Public Utilities
FY22 Budget C-107

Water and Sewer Fund revenues for FY22 are projected to be $57 million, an increase of $3.4 million over
the FY21 Budget. FY22 revenues are based on current rates and fees.
For FY22 the projected revenue is sufficient to fund projected operating expenses (including all debt payments) in the Water & Sewer Fund (not including depreciation).
The FY22 Budget includes the following New Initiatives: o $35,000 for a Facilities Locator. This position will help fill the larger demand for the State of
Georgia 811 system. o $30,000 for Two Interns in the Water Treatment Plant. o $14,500 for a Lab Tech Intern in Water Resources. o $50,000 for a Maintenance Mechanic. This position will be used to service valves, pipeline and
pump issues pertaining to the ACCGov Water System.
Salary and benefit changes are due to personnel turnover and/or reallocation of benefits applied by Human Resources.
For more information on the Water & Sewer Fund, see page E‐35.
(All figures in $1,000s) FY20 FY21 FY22 FY22
Appropriations by Type Actual Budget Requested Approved $▲ %▲Salary & Benefits $9,731.4 $10,430.7 $10,582.8 $10,584.3 $153.6 1.5%
Operating $8,595.6 $11,052.9 $11,214.8 $11,213.3 $160.4 1.5%
Total $18,327.0 $21,483.6 $21,797.6 $21,797.6 $314.0 1.5%
FY20 FY21 FY22 FY22
Appropriations by Division Actual Budget Requested Approved $▲ %▲Administration $1,152.3 $1,263.1 $1,239.7 $1,238.2 ($24.9) ‐2.0%
Constr & Proj Managemnt $6,069.2 $7,031.2 $7,178.9 $7,178.9 $147.7 2.1%
Plant Operations $10,629.7 $12,612.3 $12,797.9 $12,799.4 $187.1 1.5%
Engineering Management $475.8 $577.0 $581.0 $581.0 $4.0 0.7%
Total $18,327.0 $21,483.6 $21,797.5 $21,797.5 $313.9 1.5%
Budget Highlights
Appropriation Summary
Public Utilities
FY22 Budget C-108
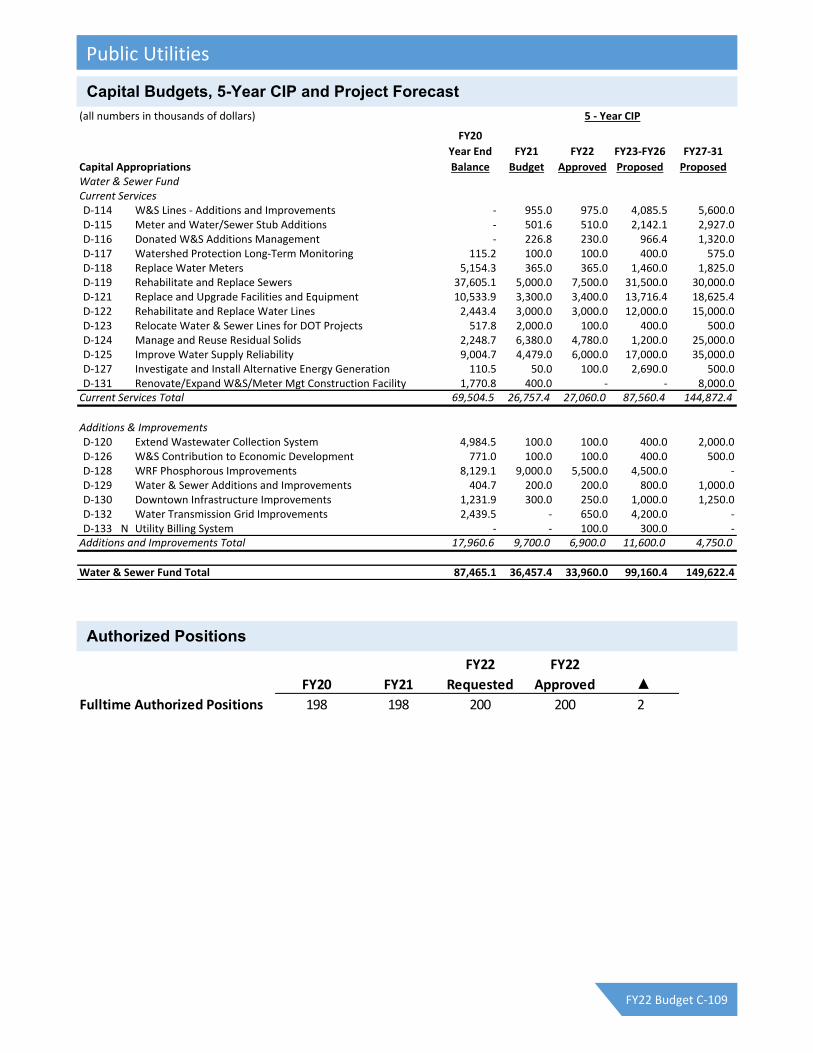
FY22 FY22
FY20 FY21 Requested Approved ▲Fulltime Authorized Positions 198 198 200 200 2
(all numbers in thousands of dollars) 5 ‐ Year CIP
Capital Appropriations
FY20
Year End
Balance
FY21
Budget
FY22
Approved
FY23‐FY26
Proposed
FY27‐31
ProposedWater & Sewer FundCurrent ServicesD‐114 W&S Lines ‐ Additions and Improvements ‐ 955.0 975.0 4,085.5 5,600.0D‐115 Meter and Water/Sewer Stub Additions ‐ 501.6 510.0 2,142.1 2,927.0D‐116 Donated W&S Additions Management ‐ 226.8 230.0 966.4 1,320.0D‐117 Watershed Protection Long‐Term Monitoring 115.2 100.0 100.0 400.0 575.0D‐118 Replace Water Meters 5,154.3 365.0 365.0 1,460.0 1,825.0D‐119 Rehabilitate and Replace Sewers 37,605.1 5,000.0 7,500.0 31,500.0 30,000.0D‐121 Replace and Upgrade Facilities and Equipment 10,533.9 3,300.0 3,400.0 13,716.4 18,625.4D‐122 Rehabilitate and Replace Water Lines 2,443.4 3,000.0 3,000.0 12,000.0 15,000.0D‐123 Relocate Water & Sewer Lines for DOT Projects 517.8 2,000.0 100.0 400.0 500.0D‐124 Manage and Reuse Residual Solids 2,248.7 6,380.0 4,780.0 1,200.0 25,000.0D‐125 Improve Water Supply Reliability 9,004.7 4,479.0 6,000.0 17,000.0 35,000.0D‐127 Investigate and Install Alternative Energy Generation 110.5 50.0 100.0 2,690.0 500.0D‐131 Renovate/Expand W&S/Meter Mgt Construction Facility 1,770.8 400.0 ‐ ‐ 8,000.0Current Services Total 69,504.5 26,757.4 27,060.0 87,560.4 144,872.4
Additions & ImprovementsD‐120 Extend Wastewater Collection System 4,984.5 100.0 100.0 400.0 2,000.0D‐126 W&S Contribution to Economic Development 771.0 100.0 100.0 400.0 500.0D‐128 WRF Phosphorous Improvements 8,129.1 9,000.0 5,500.0 4,500.0 ‐D‐129 Water & Sewer Additions and Improvements 404.7 200.0 200.0 800.0 1,000.0D‐130 Downtown Infrastructure Improvements 1,231.9 300.0 250.0 1,000.0 1,250.0D‐132 Water Transmission Grid Improvements 2,439.5 ‐ 650.0 4,200.0 ‐D‐133 N Utility Billing System ‐ ‐ 100.0 300.0 ‐Additions and Improvements Total 17,960.6 9,700.0 6,900.0 11,600.0 4,750.0
Water & Sewer Fund Total 87,465.1 36,457.4 33,960.0 99,160.4 149,622.4
Capital Budgets, 5-Year CIP and Project Forecast
Authorized Positions
Public Utilities
FY22 Budget C-109

The mission of the Clarke County Sheriff’s Office is to serve our community through intentional engagement, access and transparency. We are dedicated to conducting ourselves in a manner respectful of the trust that has been placed upon us. We will perform the constitutional and statutory mandates of the Office of Sheriff with the highest degree of competence, skill and professionalism. We strive to actively enforce the laws of our state and to safely operate our detention facilities through progressive, innovative and humane practices aimed towards rehabilitating those in custody through non‐conventional methods and returning citizens back into our community with hope and a chance for a successful future.93 We are dedicated to this mission and to the people we serve to ensure that Clarke County is a safe place to live, work and visit.
Our vision is to be a nationally recognized public safety organization dedicated to deliberate service to our community. We will achieve excellence through education, training and empowering our employees to provide the highest professional services to the citizens of Clarke County. We are determined to provide a Sheriff’s Office that is progressive, service oriented and purpose driven to influence and embrace change
We, the men and women of the Clarke County Sheriff's Office, pledge to infuse our core values in every aspect of our service to our community. Our four core values are:
Service ‐ We pledge to maintain a servant mind state with a community oriented approach. Dignity‐ We strive to engage with our community in such a manner that each person is left with their
dignity intact. Respect‐ We will be respectful in all interactions with our community members. Professionalism ‐ We are skilled in the performance of our duties and governed by the code of ethics
that demands integrity by word or by act publicly and privately, the allegiance to our oath of office and the laws that govern our nation.
* Service * Dignity * Respect *Professionalism*
Diversity, Equity and Inclusion Commitment Statement
The Clarke County Sheriff’s Office is committed to building a culture that promotes and supports a diverse and inclusive workforce. A diverse and inclusive workforce ensures that the Sheriff’s Office benefits from the backgrounds, perspectives, and experiences of its employees. Diversity, equity, and inclusion are essential to law enforcement operations and to the critical mission of the Clarke County Sheriff’s Office.
Reduce the number of warrants on file through innovative special operations and administrative warrant reduction efforts in cooperation with the courts and prosecutors. o Review the current warrants for validity and work with the Judiciary, District Attorney, and Solicitor
General to review old warrants determined to be un‐servable and create a review system to dismiss these warrants.
Provide prompt service of Temporary Protective Orders and Involuntary Committal Orders, provide timely service of civil and landlord and tenant processes, and provide timely presentation of prisoners before the courts.
Mission
Vision
Goal
Objectives
Sheriff
FY22 Budget C-110

Prevent or quickly resolve any incident or breach of security in courtrooms, the courthouse, or the surrounding grounds.
Pick up or deliver prisoners as needed, without harm, or undue delay as required by court orders or process of law.
To provide all personnel with training opportunities in order to reduce liability.
Continue procedural operation of the jail reducing errors in judicial processing, incidents of workplace injury, incidents of inmate violence, and public grievances. This goal applies to each year. This goal shall be assessed by tracking performance indicators in the above categories.
Accomplish completion of all phases, opening, and transition to new jail and training facility. This goal shall be assessed by documentation of progress which shall be presented to Sheriff Edwards on a monthly basis.
Continue to manage a growing jail population by efficient management of the inmate population and increasing, on an annual basis, the number of rehabilitative programs offered and the number of inmates participating in these programs. This goal applies to each year. Projections of future jail population growth are attached. This goal shall be assessed by analysis of statistical reports of the Inmate Programs Office.
To pursue NCCHC (National Commission on Correctional Health Care) accreditation for the jail. This goal applies to years 2019 and 2020. During 2018, initiate the NCCHC accreditation application process. Seek accreditation during 2019 and 2020.
To pursue ACA (American Correctional Association) accreditation for the jail. This goal applies to years 2019 and 2020. During 2018, initiate the American Correctional Association accreditation application process. Seek accreditation during 2019 and 2020.
To continue to recruit qualified applicants for the position of Deputy Sheriff and Detention Officer by developing diverse community organizational relationships and the continued execution of the recruiting list plan as approved. o Review the recruiting list plan on an annual basis to update and improve recruiting ideas.
To achieve CALEA Advanced Accreditation. We believe through Advanced Accreditation, our agency will continue enhancements in the following areas: o Assures agency members that our policies and procedures are in written form and available to all
personnel. o Assures that our personnel system is in accord with professional standards and is both fair and
equitable. o Provides neutral guidelines for developing strong budget justifications, especially for personnel and
their allocation across functions and activities o Reduces the likelihood of vicarious liability suits against the agency. o Assures county officials and the general public that the Sheriff's Office is delivering a high level of
service. o Demonstrates our commitment to providing high quality services with effective and responsive
policies and procedures that are also fair and equitable.
To continue to enhance the CALEA and State Certification proof compliance process.
Sheriff
FY22 Budget C-111

Actual Forecast
FY18 FY19 FY20 FY21 FY22
Sheriff / Administration Section
# Training Hours reported to Training Unit 12,135 11,531 8,959 16,122 16,130
Background Checks through GCIC 1,980 1,555 1,251 1,000 1,200
Fingerprints‐firearms lic., bondsmen, adoption, USDA, Bar Admission, RESA, other 1,439 998 1,076 1,544 1,500
# Complaints 111 61 75 80 80
Public Complaints / Grievances (founded) 15 9 3 6 6
New Deputy & Detention Hires 18 11 25 20 30
Deputy & Detention Separations 20 21 19 6 10
Total Sworn Staff 158 115 119 114 120
Total Staff 173 144 152 145 150
Use of Force Incidents 106 29 29 53 50
Sheriff / Field Section
New Warrants X* 7,924 6,232 10,688 10,000
Warrants Served/Processed X* 5,927 5,619 5,344 6,000
Total Arrest X* 3,263 3,030 4,768 5,000
Civil Papers Received 9,863 9,877 5,742 8,260 8,300
Civil Papers Served / Processed 7,209 7,234 4,379 6,708 6,725
Evictions Received 713 614 288 308 350
Evictions Served / Processed 558 492 279 296 350
Sheriff/Jail
Average Daily Inmate Population 425 378 343 295 370
Average Number of Inmates Housed Daily in Other Facilities at a cost to ACC 1 0 0 1 1
Number of Inmates Processed 8,000 7,759 5,869 4,590 5,000
Number of Inmates Released 7,700 7,759 6,152 4,446 4,500
Number of Inmates Released to State System 375 400 208 100 100
Number of Inmates Classified 5,200 4,931 3,570 3,276 3,300
Number of Inmate Medical Transports 276 209 210 231 260
Inmate Participation in Rehabilitation /Education 3,850 5,891 2,252 304 300
Inmate on Deputy/Staff Violence 21 19 17 14 15
Inmate on Inmate Violence 87 53 82 88 80
*Due to a transition in our record management system, previous data has not been fully merged into the new system. Therefore, FY18 totals cannot be determined at this time. We are hopeful that this data will be available soon.
Performance Measures
Sheriff
FY22 Budget C-112

The FY22 Budget of $18.1 million for the Sheriff’s Office reflects no significant changes to services or programs.
$58,582 is included for vehicle replacement charges to begin funding a portion of the vehicle replacement contributions for public safety vehicles. This funding was shifted entirely to the SPLOST 2020 program for FY20 and FY21.
The Sheriff’s Office requested the following which were not recommended nor approved:
o Inmate Medical cost increase $ 927,372 o Overtime increase $ 249,176 o Inmate transport for treatment/evaluation increase $ 30,000
Salary and benefit changes are due to personnel turnover, changes in the vacancy factor, and/or reallocation of benefits applied by Human Resources.
(All figures in $1,000s) FY20 FY21 FY22 FY22
Appropriations by Type Actual Budget Requested Approved $▲ %▲Salary & Benefits $12,675.5 $13,074.1 $13,580.0 $13,320.8 $246.7 1.9%
Operating $4,802.7 $4,723.5 $5,739.5 $4,782.1 $58.6 1.2%
Total $17,478.2 $17,797.6 $19,319.5 $18,102.9 $305.3 1.7%
FY20 FY21 FY22 FY22
Appropriations by Division Actual Budget Requested Approved $▲ %▲Administration $1,398.2 $1,387.6 $1,576.3 $1,572.3 $184.7 13.3%
Jail $12,450.8 $12,155.5 $13,344.9 $12,185.5 $30.0 0.2%
Field $3,629.2 $4,254.5 $4,398.3 $4,345.1 $90.6 2.1%
Total $17,478.2 $17,797.6 $19,319.5 $18,102.9 $305.3 1.7%
FY20 FY21 FY22 FY22
Appropriations by Fund Actual Budget Requested Approved $▲ %▲General Fund $17,355.8 $17,762.6 $19,284.5 $18,067.9 $305.3 1.7%
Sheriff Inmate Fund $48.8 $35.0 $35.0 $35.0 $0.0 0.0%
Other Funds $73.6 $0.0 $0.0 $0.0 $0.0 ‐‐
Total $17,478.2 $17,797.6 $19,319.5 $18,102.9 $305.3 1.7%
Budget Highlights
Appropriation Summary
Sheriff
FY22 Budget C-113

FY22 FY22
FY20 FY21 Requested Approved ▲Fulltime Authorized Positions 194 194 194 194 0
(all numbers in thousands of dollars) 5 ‐ Year CIP
Capital Appropriations
FY20
Year End
Balance
FY21
Budget
FY22
Approved
FY23‐FY26
Proposed
FY27‐31
ProposedGeneral Capital Projects FundCurrent ServicesD‐134 Public Safety Initiative ‐Equip Tech 27.5 30.0 ‐ 120.0 150.0D‐135 Replace Mobile Data Computers ‐ ‐ 76.0 ‐ 76.0D‐137 Purchase Body Worn Cameras ‐ ‐ ‐ 350.0 350.0D‐138 Purchase Tasers and Related Equipment ‐ ‐ ‐ 103.0 103.0D‐139 Replace Courthouse Security Equipment ‐ ‐ ‐ ‐ 75.0D‐140 Replace Prisoner Transport Bus ‐ ‐ ‐ ‐ 250.0Current Services Total 27.5 30.0 76.0 573.0 1,004.0
Additions & ImprovementsD‐136 N Purchase Body Security Scanning System ‐ ‐ ‐ ‐ 138.0Additions and Improvements Total ‐ ‐ ‐ ‐ 138.0
Capital Appropriations Total 27.5 30.0 76.0 573.0 1,142.0
Capital Budgets, 5-Year CIP and Project Forecast
Authorized Positions
Sheriff
FY22 Budget C-114

The mission of the Office of the Solicitor‐General is to seek justice through the appropriate prosecution of
misdemeanor criminal offenses under Georgia state law and criminal violations of local ordinances in the State
Court of Clarke County, the Municipal Court of Athens‐Clarke County, the Municipal Court of the City of
Winterville, and the Magistrate Court of Clarke County. Seeking justice requires us to investigate cases in
order to gather the necessary information upon which to base prosecutorial decisions. Through the exercise of
prosecutorial discretion, we seek to allocate the resources of the office in the most efficient manner in order
to secure justice by maximizing the rate of successful resolution of cases, through trial, plea, or dismissal
(when appropriate), while minimizing the length of time required for final disposition.
An important part of seeking justice for society is seeking justice for the individual victims of crimes.
Accordingly, it is also the mission of the Office of the Solicitor‐General to ensure that victims are given a voice
in criminal proceedings by giving them a meaningful opportunity to express themselves through the judicial
process. In order to achieve this mission, victims are provided with information about court dates and case
status, education about victim compensation and restitution, and referrals to appropriate social service
agencies. Additionally, we provide support for victims who face the emotionally difficult task of appearing and
testifying in court.
While seeking justice is a key mission, the Office of the Solicitor‐General also recognizes the need to educate
the public as a way to reduce criminal behavior and increase the safety of our citizens. As a result, the Office
of the Solicitor‐General also sees as our mission informing the public about issues of domestic violence and
alcohol related offenses, including DUI and Underage Possession of Alcohol, through various programs in an
effort to prevent criminal cases before the need to prosecute arises.
Like many agencies, we have had to formulate new approaches and guidelines in light of the pandemic. Our
primary aim was to reduce the number of people, including police officers, that must come into the
courthouse once cases are again called for court. The fact that we were unable to safely conduct jury trials
after March made this all the more difficult. Had we not acted to reduce the number of open cases, there
would have been an enormous backlog of cases and exceptionally crowded trial calendars when trials resume.
Balancing the public safety risk of assembling large groups in the courthouse with the risk posed by each
defendant has been difficult, and has required frequent adjustments in light of changing circumstances.
The pandemic limited our ability to host record restriction events. Unlike free legal clinics, which can offer legal
advice to anyone without the need to identify them, the record restriction process requires verification of a
person’s identity before you can provide the confidential arrest information and counseling we offer. The only
event we were able to conduct started before the pandemic. We are currently working to develop an online
version of these events that would satisfy the legal requirements involved.
It appears as though the pre‐arrest diversion program has also been affected by the pandemic. The community
board, which advises the agencies conducting the program, voted unanimously in January of 2020 to begin the
program in March of 2020. The police department has since completed PAD training of its officers. However,
we have yet to receive our first pre‐arrest diversion case. Certainly, the pandemic would have impacted the
roll‐out of a new program. That begin said, at a time when reducing the jail population should be a priority,
pre‐arrest diversion could be a useful tool in achieving that goal. We hope that the delay is temporary and that
the police department recognizes the value of the program.
Mission & Goals
Solicitor General
FY22 Budget C-115

Manage a complex and growing caseload in a fair and equitable manner, with the aim of creating a safer
community through positive outcomes, both for the victims and for the accused.
Reduce time between receipt of case and arraignments by continuing to Fast Track high‐risk multi‐offender
DUI and domestic violence cases.
Reduce time between arraignment and final disposition.
Continue providing services and support to the victims of crimes.
Continue to devote two prosecutors through a government‐funded grant to handle family violence cases
and two county‐funded prosecutors to handle DUI cases so that these complex cases can be
prosecuted efficiently and effectively.
Reduce recidivism among DUI and substance abuse offenders through rehabilitation by strict supervision
and mandatory treatment in the DUI/Drug Court Program.
Continue providing effective domestic violence intervention and DUI enforcement training to new police
recruits through the New Officer Basic Course and to experienced police officers through in‐service
training.
Review all outstanding bench warrant cases in order to determine whether prosecution of the cases is
consistent with the interest of justice.
Continue providing free educational programs and record restriction events designed to reduce criminal
behavior, promote safety, and improve the quality of life for those in our community.
Continue to participate as team members of the DUI/Drug Court, Treatment and Accountability Court, and
Veterans’ Court in an effort to seek alternative sanctions that reduce recidivism and the jail
population.
OBJECTIVE PERFORMANCE MEASURE
2019 2020
Offender Accountability
Percentage of convictions
55% Guilty pleas or convictions
27% Guilty pleas or convictions
Percentage of dismissals
21 % dismissals 69% dismissals
Treatment Courts and creative treatment centered sentencing
options
DUI Court: 57 new participants from our cases, total participation averages
70 participants Veterans Court: 5 new
participants from our cases, 10 total participants
Treatment & Accountability Court: 9 new participants from our cases, 25 total
participants Community Accountability Protocol (DV cases): 29 New
participants
DUI Court: 18 new participants from our cases,
53 total participants Veterans Court: 1 new
participant from our cases, 10 total participants
Treatment & Accountability Court: 5 new participants from our cases, 18 total
participants Community Accountability Protocol (DV cases): 21 New
participants
Reformative Justice
Pre‐Trial Diversion 324 Pretrial Participants 150 Pretrial Participants
Objectives
Performance Measures
Solicitor General
FY22 Budget C-116

Restriction Events 3 events, 161 applications, 63 participants counseled, 231
arrest cycles restricted
1 event, 64 applications, 33 arrest cycles restricted, 54
court files sealed
Pre‐arrest Diversion Coming soon! Ready to start. Waiting for the first case from the PD.
Victim Services Delivery
Performing statutory and constitutional
notification of rights, court dates, and
criminal justice system explanation
17,272 services performed by Victim Witness Program to
2,942 victims
18,469 services performed by the Victim Witness
Program for 2,825 victims
Early notification efforts
*Working with our case management system to calculate these activities
*Working with our case management system to calculate these activities
Face to face meetings with prosecutors and/or victim advocates
*Working with our case management system to calculate these activities
*Working with our case management system to calculate these activities
Referrals to social services
*Working with our case management system to calculate these activities
*Working with our case management system to calculate these activities
Special Bond Hearing appearances
61 Special Bond Hearings in Magistrate Court attended by
prosecutor
35 Special Bond Hearings in Magistrate Court attended
by prosecutor
Victim knowledge and satisfaction
See summary and graphics. See summary and graphics.
Timely and efficient
administration of justice
Time to disposition for accelerated programs
DV Fast Track cases disposed an average of 33 days earlier than non‐accelerated cases. DUI Fast Track cases disposed an average of 60 days earlier than non‐accelerated cases.
*This is a difficult calculation due to pandemic. Court appearances were less consistent and cases were continued instead of disposed.
Opportunities to adjudicate
Average of 19 court dates per month, not including motion times and specially scheduled
pleas
Average of 18 court dates per month, not including motion times and specially
scheduled pleas
Maintaining low backlog
Opened 2164 misdemeanor cases and closed 2127
misdemeanor cases in State Court
Opened 3103 misdemeanor cases and closed 3479
misdemeanor cases in State & Municipal Court
Solicitor General
FY22 Budget C-117
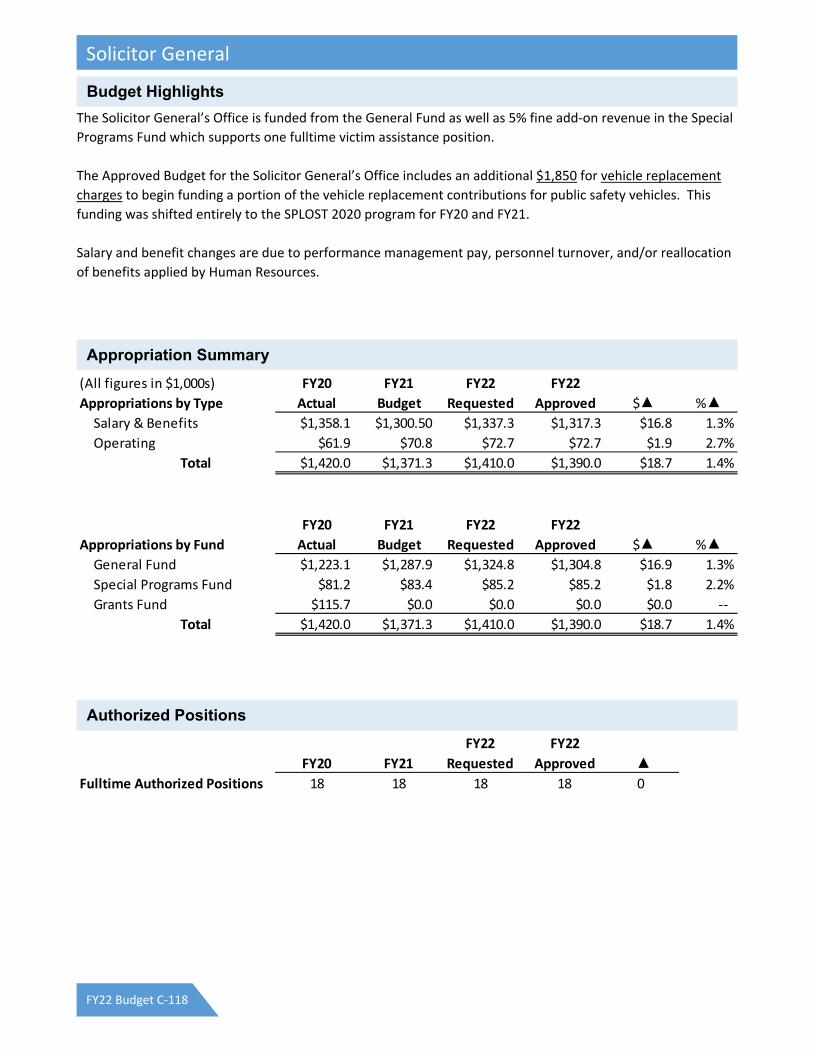
The Solicitor General’s Office is funded from the General Fund as well as 5% fine add‐on revenue in the Special
Programs Fund which supports one fulltime victim assistance position.
The Approved Budget for the Solicitor General’s Office includes an additional $1,850 for vehicle replacement
charges to begin funding a portion of the vehicle replacement contributions for public safety vehicles. This
funding was shifted entirely to the SPLOST 2020 program for FY20 and FY21.
Salary and benefit changes are due to performance management pay, personnel turnover, and/or reallocation
of benefits applied by Human Resources.
(All figures in $1,000s) FY20 FY21 FY22 FY22
Appropriations by Type Actual Budget Requested Approved $▲ %▲Salary & Benefits $1,358.1 $1,300.50 $1,337.3 $1,317.3 $16.8 1.3%
Operating $61.9 $70.8 $72.7 $72.7 $1.9 2.7%
Total $1,420.0 $1,371.3 $1,410.0 $1,390.0 $18.7 1.4%
FY20 FY21 FY22 FY22
Appropriations by Fund Actual Budget Requested Approved $▲ %▲General Fund $1,223.1 $1,287.9 $1,324.8 $1,304.8 $16.9 1.3%
Special Programs Fund $81.2 $83.4 $85.2 $85.2 $1.8 2.2%
Grants Fund $115.7 $0.0 $0.0 $0.0 $0.0 ‐‐
Total $1,420.0 $1,371.3 $1,410.0 $1,390.0 $18.7 1.4%
FY22 FY22
FY20 FY21 Requested Approved ▲Fulltime Authorized Positions 18 18 18 18 0
Budget Highlights
Appropriation Summary
Authorized Positions
Solicitor General
FY22 Budget C-118

Athens‐Clarke County Approach to Solid Waste Management Solid Waste Department Vision Statement: To be a leader in sustainable material management by creating a culture of zero waste. Solid Waste Department Mission Statement: To efficiently deliver integrated material management through comprehensive and innovative collection, disposal, waste reduction and education services. Core Values: Integrity, Accountability, Efficiency, Innovation, Teamwork and Stewardship Approach: The Solid Waste Department (SWD) provides collection and disposal services that meet or exceed state standards and are responsive to the health and sanitary needs of our community. The department accomplishes this while maintaining a competitive cost of services for our customers and the community as a whole. The SWD is comprised of four Divisions. The Collections Division (CD) functions as an enterprise fund that provides waste and recycling collection services to the Central Business District (CBD), Urban Service District (residential ~ 10,000 customers), commercial curbside, dumpster and roll‐off customers. The Collections Division manages two general fund services the residential leaf and limb collection program and CBD litter control. The Landfill Division (LD) functions as an enterprise fund that provides waste disposal services to customers from Athens‐Clarke County and Oglethorpe County. The landfill offers recycling opportunities to customers, and is home to the Classic City Compost Facility, a commercial composting facility that manufactures a soil amendment from leaf and limb debris, bio‐solids and/or food scraps. The Recycling Division (RD) relies on funding from the Landfill Enterprise Fund and the Waste Minimization Fee to support staff, events and programs. Additionally, the RD includes the public‐private partnership Recovered Material Processing Facility (RMPF), Center for Hard to Recycle Materials (CHaRM) and Teacher Reuse Store. The Keep Athens‐Clarke County Beautiful Division (KACCB) relies on funding from the general fund and functions as a Division of the ACC Solid Waste Department and a 501 C3 organization that is an affiliate of the state Keep Georgia Beautiful program national Keep America Beautiful program. KACCB provides education and outreach for 22 civic programs related to litter prevention, waste reduction, and beautification.
FY20 Overview: Accomplishments
CD received 2020 Top Fleet Award from Samsara: Excellence in Public Fleet Management.
CD featured on Good Morning America in November 2020.
LD updated Design and Operations (D&O) plan.
RD received grant from the Foodservice Packaging Alliance for $9,200 for promotion to increase recycling and combat contamination.
RD grew Glass Bottle Reduction Program, tripling the number of local businesses qualifying for a tax break.
Vision, Mission & Goals
Solid Waste
FY22 Budget C-119

KACCB received the 2019 Keep America Beautiful Affiliate Award of Excellence, the 2019 Keep Georgia Beautiful Affiliate of the Year Award, the 2019 GA Rivers Alive KGBF Government agency of the year award, and the 2019 Governor’s Circle Award.
KACCB completed the 7th installment of the Loop 10 Daffodil and Tree project raising funds to plant 25,000 daffodils and 25 trees.
KACCB completed the collection, assessment, and evaluation of the ACC Litter Survey and presented the “State of Litter” PowerPoint for M&C.
KACCB began long‐term goal of creating all outreach content in Spanish to serve a more diverse population in ACC.
Challenges
Covid‐19 challenges with staffing including decrease in incoming recycling tonnage by 20% and municipal solid waste by 5%
New high moisture content requirement from EPD (could impact leachate management) for LD
Private hauler service challenges in the GSD (continued).
Increased litter, illegal dumping and human waste issues related to Covid‐19 and homeless population.
Recycling Markets continue to struggle; RD paid nearly $221,000 in processing fees in FY20 over revenues.
CBD collection method needs overhauled along with new pedestrian trash and recycling containers (continued).
FY21 Outlook and Opportunities:
Revise and update Solid Waste Ordinances and Policies specifically for Franchised Haulers
Revise and update Waste Reduction Goals along with Envision Athens Goal and SW Management Plan
Increase Commercial Compost Collection program customers
RD tackle contamination in recycling stream
RD promote use of Center for Hard to Recycle Materials to all ACC residents and businesses
RD to contract with new operator of the Recovered Materials Processing Facility
Significant equipment improvements at RMPF should reduce outbound residuals
KACCB to create safety and training module for homeless volunteer program
ACC Solid Waste Department, 725 Hancock Industrial Way, www.accgov.com/solidwaste (706) 613‐3501
Performance Measure Goal FY16 FY17 FY18 FY19 FY20 FY20 Notes Comments Reference
Average residential trash and recycling collection cost
≤ $7.50
$7.88 $8.11 $8.11 $7.73 $7.97
FY20 Residential Customer Average 10,189
This service is our residential curbside service for waste and recycling in the USD. Cost/Month.
Average residential trash collection cost Data Only $6.27 $5.87 $5.73Average residential recycling collection cost Data Only $1.84 $1.86 $2.24
Average curbside collection cost per staff hour < $16.00
$22.85 $31.28 $29.04 $24.94 $19.00*
* Removed OT
Add hourly rate for each CC staff member and divide the total hourly compensation by the total number of hourly employees (FT and PT).
Average commercial dumpster cost per tip < $7.00
$10.21* $9.01* $10.03* $7.84* $8.37*
806 dumpsters tipped per week (both trucks)
*Includes landfill disposal costs
This service is our commercial waste and recycling dumpster bundled service.
Average CBD litter collection cost per hour ≤ $25.00$20.16 $20.32 $22.60 $23.67 $23.43
Total cost divided by total hours. Three FT employees and Three PT employees.
Leaf and Limb on time scheduled collections 98% 100% 100% 50%* 100% 98%Had to revise once in May
2020* Hurricane Irma clean-up
Maintain scheduled leaf and limb service to all areas with a 98% or better on schedule rate.
Solid Waste DepartmentVision: To be the leader in sustainable material management by creating a culture of zero waste.
Mission Statement: To efficiently deliver integrated material management through comprehensive and innovative collection, disposal, waste reduction and education services.
Co
llect
ion
s
Performance Measures
Solid Waste
FY22 Budget C-120

Performance Measure Goal FY16 FY17 FY18 FY19 FY20 FY20 Notes Comments Reference
Disposal (landfill)
Cost per ton of waste processed at the landfill ≤$15.00 $14.93 $17.25 $17.37 $14.99 $18.00Cost per ton is the net cost divided by the tons of waste managed.
Landfill Tons RecycledIncrease
FPY19,828.82 12,996.82 12,095.14 12,501.47 15,890.32
Compost Produced and Sold (cubic yards)Increase
FPY3,436.00 3,565.00 3,670.00 4,777.00 2,525.00* * Screen fire and COVID19 Bio-solid and Food Scrap Compost
Electricity Produced from Landfill Gas (MMBtu) Producing 77,002.08 74,418.71 80,141.93 74,991.11 55,262.30
% Comprehensive Compliance InspectionRemain in
Compliance95% 95% 92.5% 92.5% N/A*
* EPD is behind on inspections; no inspections in FY20
% score on the MSW Evaluation Report Completed by On-Site Inspection by EPD
Performance Measure Goal FY16 FY17 FY18 FY 19 FY20 FY20 Notes Comments Reference
Waste Reduction
Average monthly recycling tonnage 2,500 1,548 1,627 1,643 1,484 1,122*Total annual tonnage is 13,468 tons
*COVID19 tonnage decrease
Incoming tonnage received at the RMPF.
% Residual Rate < 10% 12% 10% 25% 21% 20%Residual is material sent to the landfill but delivered to the RMPF.
% Waste Diversion RateIncrease
Rate38.0% 27.0% 27.0% 27.0% 28.0%
M&C Waste Diversion Goal set in 2010; 40% by 2015; 60% by 2018; 75% by 2020; Calculation: Total Recycled + Composted/Total MSW (Recycled + Composted + Landfilled)
Number of CHaRM CustomersIncrease
FPY2,371 4,415 4,810 5,347 6,299
CHaRM Customer RevenueIncrease
FPY$10,720 $13,107 $16,001 $22,321 $47,967
Fees charged to CHaRM customers -user fees & material specific.
Material Revenue from CHaRM itemsIncrease
FPY$5,459 $20,158 $17,862 $9,475 $13,877
Revenue made from sale of CHaRM recyclables.
Tonnage Processed at the CHaRMIncrease
FPY108.20 148 254 237 265
Compliance with Commercial Recycling Ordinance
Increase FPY
806 896 1,007 1,100 1,182Total number/percentage of businesses compliant with Commercial Recycling Ordinance
Performance Measure Goal FY16 FY17 FY18 FY19 FY20 FY20 Notes Comments Reference
Education Services (Recycling Division)
Total Number of Tour Participants 2,159 5,351 3,259**Tours suspended due to COVID from March - June
Tours of the RMPF, Landfill, CHaRM and Compost Facility performed by the Recycling Division.
Total Number of Outreach Participants 4,839 5,628* 4,141
*FY19, Recycling Division began counting tour participants for all individual facility tours they participated in
Classroom visits, School assemblies, and Tabling events
TOTALS: 1,620 2,062 6,998 10,979 7,400
RMPF Tours Data Only 50 71 80 91 81
CHaRM Tours Data Only 7 3 6
Landfill Tours Data Only 15 23 29 46 25
Compost Facility Tours Data Only 15 23 29 46 28
Comments
Number of Annual Community Events(projects supported)
Increase FPY 82 103 401* 477 372
* Added all projects internal and external. Only external
Number of Volunteers at Community EventsIncrease
FPY 7,485 8,494 8,223 7,348 7,144
Total Number of Volunteer HoursIncrease
FPY 18,361 23,458 19,115 19,667 20,258
Number of Litter Clean-UpsIncrease
FPY266 310
264 238 271
Return on InvestmentIncrease
FPY$19.38 $18.93 $35.30 $38.03 $14.85
For every $1 invested in KACCB, FY amount on left is returned in community benefit.
Total Number of Community InteractionsIncrease
FPY 14,457This number includes all community interactions.
GlossaryCBD - Central Business DistrictCHaRM - Center for Hard to Recycle MaterialsEPD - Environmental Protection Division FPY - From Previous YearKAB - Keep America Beautiful RMPF - Recovered Material Processing Facility
Lan
dfi
ll
Was
te R
edu
ctio
nE
du
cati
on
Ser
vice
s
Keep Athens-Clarke County Beautiful Mission Statement: to educate and empower citizens and businesses with the resources to take action as environmental stewards of litter prevention, waste reduction, and beautification.
These numbers are prepared as required for the KAB annual report.
Solid Waste
FY22 Budget C-121
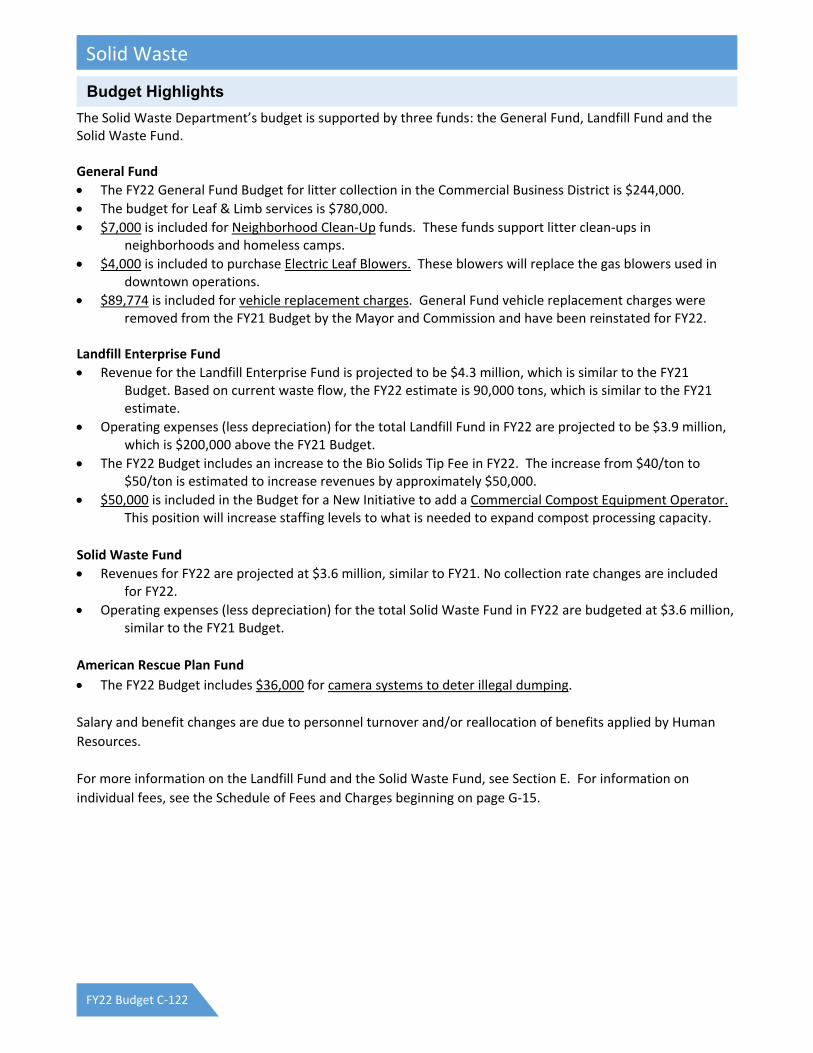
The Solid Waste Department’s budget is supported by three funds: the General Fund, Landfill Fund and the Solid Waste Fund. General Fund
The FY22 General Fund Budget for litter collection in the Commercial Business District is $244,000.
The budget for Leaf & Limb services is $780,000.
$7,000 is included for Neighborhood Clean‐Up funds. These funds support litter clean‐ups in neighborhoods and homeless camps.
$4,000 is included to purchase Electric Leaf Blowers. These blowers will replace the gas blowers used in downtown operations.
$89,774 is included for vehicle replacement charges. General Fund vehicle replacement charges were removed from the FY21 Budget by the Mayor and Commission and have been reinstated for FY22.
Landfill Enterprise Fund
Revenue for the Landfill Enterprise Fund is projected to be $4.3 million, which is similar to the FY21 Budget. Based on current waste flow, the FY22 estimate is 90,000 tons, which is similar to the FY21 estimate.
Operating expenses (less depreciation) for the total Landfill Fund in FY22 are projected to be $3.9 million, which is $200,000 above the FY21 Budget.
The FY22 Budget includes an increase to the Bio Solids Tip Fee in FY22. The increase from $40/ton to $50/ton is estimated to increase revenues by approximately $50,000.
$50,000 is included in the Budget for a New Initiative to add a Commercial Compost Equipment Operator. This position will increase staffing levels to what is needed to expand compost processing capacity.
Solid Waste Fund
Revenues for FY22 are projected at $3.6 million, similar to FY21. No collection rate changes are included for FY22.
Operating expenses (less depreciation) for the total Solid Waste Fund in FY22 are budgeted at $3.6 million, similar to the FY21 Budget.
American Rescue Plan Fund
The FY22 Budget includes $36,000 for camera systems to deter illegal dumping.
Salary and benefit changes are due to personnel turnover and/or reallocation of benefits applied by Human
Resources.
For more information on the Landfill Fund and the Solid Waste Fund, see Section E. For information on
individual fees, see the Schedule of Fees and Charges beginning on page G‐15.
Budget Highlights
Solid Waste
FY22 Budget C-122

(All figures in $1,000s) FY20 FY21 FY22 FY22
Appropriations by Type Actual Budget Requested Approved $▲ %▲Salary & Benefits $3,569.2 $3,799.6 $3,790.3 $3,934.2 $134.6 3.5%
Operating $3,005.3 $3,042.4 $3,321.6 $3,208.7 $166.3 5.5%
Total $6,574.5 $6,842.0 $7,111.9 $7,142.9 $300.9 4.4%
FY20 FY21 FY22 FY22
Appropriations by Division Actual Budget Requested Approved $▲ %▲Administration $1,545.8 $1,750.2 $1,793.0 $1,829.0 $78.8 4.5%
Landfill $1,724.6 $1,720.5 $1,809.0 $1,809.0 $88.5 5.1%
Collections $3,304.1 $3,371.3 $3,509.9 $3,504.9 $133.6 4.0%
Total $6,574.5 $6,842.0 $7,111.9 $7,142.9 $300.9 4.4%
FY20 FY21 FY22 FY22
Appropriations by Fund Actual Budget Requested Approved $▲ %▲General Fund $895.6 $1,206.7 $1,623.8 $1,319.9 $113.2 9.4%
Landfill Fund $2,886.3 $2,790.9 $2,602.6 $2,901.5 $110.6 4.0%
Solid Waste Collection Fund $2,792.6 $2,844.4 $2,885.5 $2,885.5 $41.1 1.4%
ARP Fund $0.0 $0.0 $0.0 $36.0 $36.0 ‐‐
Total $6,574.5 $6,842.0 $7,111.9 $7,142.9 $300.9 4.4%
FY22 FY22
FY20 FY21 Requested Approved ▲Fulltime Authorized Positions 62 63 64 64 1
Appropriation Summary
Authorized Positions
Solid Waste
FY22 Budget C-123

(all numbers in thousands of dollars) 5 ‐ Year CIP
Capital Appropriations
FY20
Year End
Balance
FY21
Budget
FY22
Approved
FY23‐FY26
Proposed
FY27‐31
ProposedGeneral Capital Projects FundCurrent ServicesD‐163 N Purchase One Leaf Vacuum ‐ ‐ 75.0 ‐ ‐Current Services Total ‐ ‐ 75.0 ‐ ‐
Additions & ImprovementsD‐164 N Dunlap & Pittard Environmental Study ‐ ‐ 50.0 ‐ ‐Additions and Improvements Total ‐ ‐ 50.0 ‐ ‐
General Capital Projects Fund Total ‐ ‐ 125.0 ‐ ‐
Landfill FundCurrent ServicesD‐141 Replace Trash Compactor ‐ ‐ 450.0 1,350.0 1,800.0D‐142 Belt Replacements for RMPF 6.9 67.0 67.0 ‐ ‐D‐143 Replacement Roll‐Off Container Truck 184.4 70.0 70.0 70.0 210.0D‐144 Replace Track Excavator ‐ 90.0 90.0 90.0 ‐D‐145 Replace Bulldozer ‐ 140.0 140.0 560.0 280.0D‐146 N Replace Loaders (Compost Operations) ‐ ‐ 75.0 150.0 ‐D‐147 Replace Glass Crusher in RMPF ‐ 100.0 120.0 ‐ ‐D‐148 N Purchase Replacement Road Tractor ‐ ‐ 67.0 134.0 ‐D‐149 Replace Track Loader ‐ ‐ 167.0 334.0 ‐D‐150 Replace OCC Decks ‐ ‐ 60.0 60.0 ‐D‐151 N Replace Two Kubota Tractors ‐ ‐ 34.0 170.0 ‐D‐152 N Replace Walking Floor Trailer (1986) ‐ ‐ 33.0 66.0 ‐D‐153 N Replace RMPF Tip Floors ‐ ‐ 65.0 65.0 ‐D‐154 N Landfill Well Construction ‐ ‐ 100.0 300.0 ‐D‐155 Replace Dump Truck (25 yard articulating) (1.8) 134.0 ‐ 134.0 400.0D‐156 Closure of Landfill‐ Phase 1 & 2 Areas ‐ ‐ ‐ ‐ 2,500.0D‐157 Replace Windrow Turner in Compost Operations ‐ ‐ ‐ 150.0 ‐D‐158 Replace Trommel Screen in Compost Operations ‐ 67.0 ‐ ‐ 200.0D‐159 Purchase Skid Steer (Compost Loading) ‐ 60.0 ‐ ‐ 60.0Current Services Total 189.5 728.0 1,538.0 3,633.0 5,450.0
Landfill Fund Total 189.5 728.0 1,538.0 3,633.0 5,450.0
Solid Waste FundCurrent ServicesD‐160 Replace Commercial Dumpster Collection Front‐end Loader (5.3) 90.0 90.0 366.0 276.0D‐161 Replace Mini‐Packer Trucks (76.1) 135.0 135.0 440.0 442.0D‐162 Replace Automated Refuse/Recycling Truck 1,280.0 310.0 310.0 1,240.0 620.0Current Services Total 1,198.6 535.0 535.0 2,046.0 1,338.0
Solid Waste Fund Total 1,198.6 535.0 535.0 2,046.0 1,338.0
Capital Appropriations Total 1,388.1 1,263.0 2,198.0 5,679.0 6,788.0
Capital Budgets, 5-Year CIP and Project Forecast
Solid Waste
FY22 Budget C-124

The Mission of the State Court is to preside over civil and criminal cases in a manner consistent with the law and interests of justice. The Court seeks to handle all cases in a timely, efficient, and cost‐effective manner and to treat all persons who appear in Court with dignity, courtesy, and respect. A significant part of the operation of the Court is the DUI/Drug Court program, the goal of which is to provide the opportunity for repeat DUI and substance‐abuse offenders to achieve sobriety and become productive members of our community through a unique program of intensive supervision, treatment and accountability.
The State Court seeks to provide diligent, effective, efficient and fair administration of justice in all civil and criminal cases. The DUI/Drug Court seeks to reduce recidivism rates for high‐risk offenders by holding offenders accountable and therefore increasing public safety.
Actual
FY18 FY19 FY20
Criminal Cases Filed 3,804 3,352 2,438
Criminal Cases Disposed 3,834 3,334 2,227
Civil Cases Filed 676 702 776
Civil Cases Disposed 582 550 561
Jury Trials Conducted 27 19 1
With the onset of Covid‐19 restrictions beginning in March 2020, the manner in which we have conducted
business in State Court has changed dramatically. Performance measures in past years have focused on the
number of cases filed and the number of cases resolved, with our goal being to balance those numbers. The
pandemic has affected our ability to balance those numbers. We look forward to FY22 with the goal of
eliminating the current back‐log of cases and balancing performance measures.
Mission and Goals
Objectives
Performance Measures
State Court
FY22 Budget C-125

$50,000 is included for General Fund Transfer to the Special Programs Fund to support the DUI‐Drug Court.
This support is necessary due to shortfalls in participant fees and the decline of DATE Fund revenues. The court requested to move the entirety of the DUI‐Drug Court to the General Fund which would have resulted in a net increase to the General Fund of $98,000. This request was not recommended or approved.
The FY22 Budget for the DUI‐Drug Court includes estimated participant revenues of $65,000, anticipated
grant funding of $82,000, use of program balance of $22,000, $50,000 of General Fund support and
anticipated use of DATE Funds of $25,000 for a total of $244,000.
(All figures in $1,000s) FY20 FY21 FY22 FY22
Appropriations by Type Actual Budget Requested Approved $▲ %▲Salary & Benefits $686.4 $691.3 $946.3 $702.0 $10.7 1.5%
Operating $362.6 $389.8 $136.2 $380.5 ($9.3) ‐2.4%
Total $1,049.0 $1,081.1 $1,082.5 $1,082.5 $1.4 0.1%
FY20 FY21 FY22 FY22
Appropriations by Division Actual Budget Requested Approved $▲ %▲State Court $655.4 $691.5 $698.5 $698.5 $7.0 1.0%
DUI/Drug Court $393.6 $389.6 $384.0 $384.0 ($5.6) ‐1.4%
Total $1,049.0 $1,081.1 $1,082.5 $1,082.5 $1.4 0.1%
FY20 FY21 FY22 FY22
Appropriations by Fund Actual Budget Requested Approved $▲ %▲General Fund $787.5 $827.3 $1,082.3 $838.0 $10.7 1.3%
Special Programs Fund $166.9 $253.8 $0.2 $244.5 ($9.3) ‐3.7%
Grants Fund $94.6 $0.0 $0.0 $0.0 $0.0 ‐‐
Total $1,049.0 $1,081.1 $1,082.5 $1,082.5 $1.4 0.1%
FY22 FY22
FY20 FY21 Requested Approved ▲Fulltime Authorized Positions 7 7 7 7 0
Budget Highlights
Appropriation Summary
Authorized Positions
State Court
FY22 Budget C-126

Superior Courts
The mission of the Superior Courts is to provide for the timely, effective and legally correct resolution of civil
disputes, criminal prosecutions, appellate and equity matters in the furtherance of justice and in compliance
with the Constitution and the laws of the State of Georgia. The Superior Courts also supports and oversees the
operation of programs and functions within the Superior Courts’ authority.
Probation Services
The mission of Probation Services is to be a leader in community corrections, working with the judiciary and
the community to create a safer society. Probation Services is committed to providing the courts with quality
information while offering viable, cost‐effective sentencing and pretrial options. Through a balance of
compliance enforcement and treatment strategies, offenders are held accountable and afforded opportunities
to become productive, law‐abiding citizens. Probation Services provides offender management for Felony
Drug Court, Treatment and Accountability Court, Veterans Court, DUI/Drug Court, and the Solicitor’s Pretrial
Intervention Program. Probation Services also provides enhanced supervision of Domestic Violence cases
under a Violence Against Women (VAWA) grant and operates the full‐service Athens Drug Lab.
Felony Drug Court
The mission of the Western Judicial Circuit Felony Drug Court is to provide an alternative means for addressing
substance abuse offenses through a judicially supervised regimen of treatment for chemically dependent
offenders with the goal of yielding sober, law‐abiding citizenry, thereby reducing the cost and negative effect
on the community while resolving public safety issues.
Mental Health Treatment and Accountability Court
The mission of the Treatment and Accountability Court is to increase public safety and make more effective
use of resources, in cooperation with local mental health providers, by providing judicial supervision to
offenders with mental illness, thereby reducing criminal behavior, reducing arrests and jail time; effectively
treating and monitoring individuals with mental illness and improving the quality of life for individuals and
their families.
Veterans Treatment Court
The mission of the Western Judicial Circuit Veterans Treatment Court is to provide support and accountability
that empowers Veterans to regain and maintain productive, responsible lives.
Alternative Dispute Resolution
The mission of the Alternative Dispute Resolution Program for the Tenth Judicial District is to provide an
alternative method of resolving disputes in cases filed in Superior, State, Magistrate and Probate Courts of
Athens‐Clarke, Oconee, Madison, Hart, Elbert, Franklin, Walton, Newton, and Oglethorpe counties. Judges in
these counties assign appropriate cases for mediation in conformity with state law and local rules established
by the Board of Directors for the ADR program. The ADR Program staff also coordinates the Divorcing Parents
Programs in Athens‐Clarke and Oconee counties for spouses filing for divorce who have children under 18
years of age.
Law Library
The mission of the Athens‐Clarke County Law Library is to provide free use of legal research materials including
statutes, digests and case law in an effort to promote equal access to court services. The Law Library’s primary
Mission
Superior Court
FY22 Budget C-127

purpose is for legal research, but it also has facilities for meetings and serves as the center for self‐represented
litigants.
To maintain or increase current disposition rates for Superior Court civil and criminal cases.
To increase response times, participation, rehabilitative services and compliance through alternative programs such as Alternative Dispute Resolution, Felony Drug Court, Mental Health Treatment and Accountability Court, Veterans Court and Probation Services.
Increase positive community relations and the professional knowledge of court staff and participants while ensuring equal access to court services.
Increase program participation for qualified participants in the Felony Drug Court, Mental Health Treatment and Veterans Court and increase the direct contact and supervision provided to participants of these programs and Probation Services to ensure program conformity and fidelity.
To establish a Steering Committee to build community support and awareness to all of the Accountability Courts.
Formation of a Judicial Council to hold regular meetings to address Criminal Justice Reform.
Estimates Forecast
CY18 CY19 CY20 CY21 CY22
Criminal Cases Filed 2,500 2,504 1839
Civil Cases Filed 2,400 2,165 1369
Actual Forecast
CY18 CY19 CY20 CY21 CY22
Number of New Accountability Court Participants 124 143 68 130 130
Number of Accountability Court Graduates 50 50 34 45 45
Cumulative Number of Accountability Court Treatment Hours
8793 10,000 10,000
Number of Kids Served by Program (FTC) 98 130 130
Number of kids reunified (FTC) 18 22 22
Number of Drug Free Babies Born (FTC/FDC) 7
Average Number of Misdemeanor Probation Cases and Active Warrants
2500 3000 1741/384 2000/200 2000/200
Average Number of Pre‐trial Cases 350 343 384 425 425
Objectives
Performance Measures
Superior Court
FY22 Budget C-128
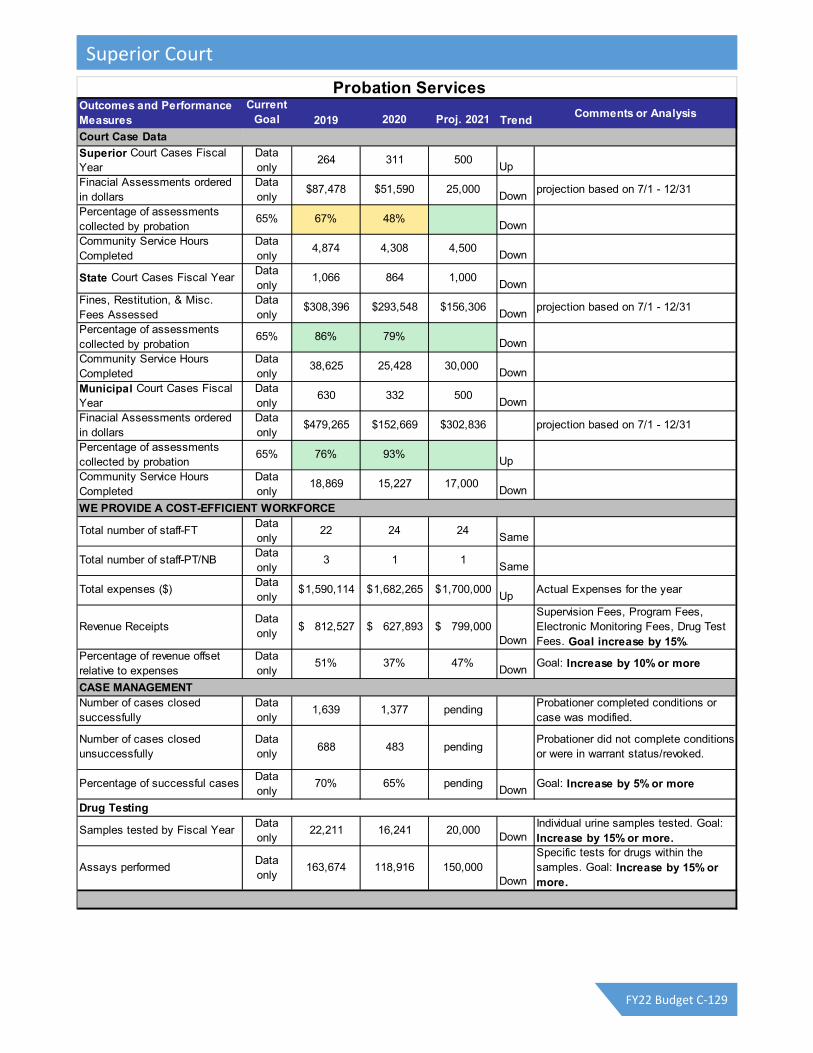
Outcomes and Performance Measures
Current Goal 2019 2020 Proj. 2021 Trend
Comments or Analysis
Court Case Data
Superior Court Cases Fiscal Year
Data only
264 311 500Up
Finacial Assessments ordered in dollars
Data only
$87,478 $51,590 25,000Down
projection based on 7/1 - 12/31
Percentage of assessments collected by probation
65% 67% 48%Down
Community Service Hours Completed
Data only
4,874 4,308 4,500Down
State Court Cases Fiscal YearData only
1,066 864 1,000Down
Fines, Restitution, & Misc. Fees Assessed
Data only
$308,396 $293,548 $156,306Down
projection based on 7/1 - 12/31
Percentage of assessments collected by probation
65% 86% 79%Down
Community Service Hours Completed
Data only
38,625 25,428 30,000Down
Municipal Court Cases Fiscal Year
Data only
630 332 500Down
Finacial Assessments ordered in dollars
Data only
$479,265 $152,669 $302,836
projection based on 7/1 - 12/31
Percentage of assessments collected by probation
65% 76% 93%Up
Community Service Hours Completed
Data only
18,869 15,227 17,000Down
Total number of staff-FTData only
22 24 24Same
Total number of staff-PT/NBData only
3 1 1Same
Total expenses ($)Data only
1,590,114$ 1,682,265$ 1,700,000$ Up
Actual Expenses for the year
Revenue ReceiptsData only
812,527$ 627,893$ 799,000$ Down
Supervision Fees, Program Fees, Electronic Monitoring Fees, Drug Test Fees. Goal increase by 15%.
Percentage of revenue offset relative to expenses
Data only
51% 37% 47%Down
Goal: Increase by 10% or more
Number of cases closed successfully
Data only
1,639 1,377 pendingProbationer completed conditions or case was modified.
Number of cases closed unsuccessfully
Data only
688 483 pendingProbationer did not complete conditions or were in warrant status/revoked.
Percentage of successful casesData only
70% 65% pendingDown
Goal: Increase by 5% or more
Samples tested by Fiscal YearData only
22,211 16,241 20,000Down
Individual urine samples tested. Goal: Increase by 15% or more.
Assays performedData only
163,674 118,916 150,000Down
Specific tests for drugs within the samples. Goal: Increase by 15% or more.
Probation Services
WE PROVIDE A COST-EFFICIENT WORKFORCE
CASE MANAGEMENT
Drug Testing
Superior Court
FY22 Budget C-129

The FY22 Budget for Superior Court includes operations in the General Fund, the Alternative Dispute Resolution (ADR) Fund, and the Special Programs Fund (Law Library). General Fund
The Budget for the Superior Court includes budgeted funding for;
$26,000 for Electronic Monitoring in Probation. This would allow for additional capacity for Probation and
pre‐trial monitoring.
$1,300 is included for vehicle replacement charges. General Fund vehicle replacement charges were
removed from the FY21 Budget by the Mayor and Commission and have been reinstated for FY22.
The Superior Court also requested $78,300 to move the Veteran’s Court Coordinator from the Grants Fund
to the General Fund, and $77,600 for a Judicial Media Specialist. These requests were not
recommended or approved.
ADR Fund
This program operates in a separate fund and all costs are recovered by revenues from fees charged to
participating judicial circuits, which currently include the Alcovy, Northern and Western judicial
circuits.
The FY22 Budget for the ADR Program reflects no significant changes.
Special Programs Fund
The Superior Court budget in the Special Programs Fund includes the Law Library.
There are no significant changes in FY22 for the Law Library.
Salary and benefit changes for Superior Court are due to personnel turnover, a full year of salary and benefits
for the Counselor in Probation, and/or reallocation of benefits applied by Human Resources.
Budget Highlights
Superior Court
FY22 Budget C-130

(All figures in $1,000s) FY20 FY21 FY22 FY22
Appropriations by Type Actual Budget Requested Approved $▲ %▲Salary & Benefits $2,553.5 $2,584.6 $2,879.5 $2,723.6 $139.0 5.4%
Operating $925.8 $1,062.6 $1,098.8 $1,088.8 $26.2 2.5%
Total $3,479.3 $3,647.2 $3,978.3 $3,812.4 $165.2 4.5%
FY20 FY21 FY22 FY22
Appropriations by Division Actual Budget Requested Approved $▲ %▲Administration $3,011.00 $3,105.0 $3,436.0 $3,270.2 $165.2 5.3%
Superior Court One $102.1 $127.9 $127.9 $127.9 $0.0 0.0%
Superior Court Two $180.3 $139.6 $139.6 $139.6 $0.0 0.0%
Superior Court Three $107.3 $166.5 $166.5 $166.5 $0.0 0.0%
Superior Court Four $78.6 $108.2 $108.2 $108.2 $0.0 0.0%
Total $3,479.3 $3,647.2 $3,978.2 $3,812.4 $165.2 4.5%
FY20 FY21 FY22 FY22
Appropriations by Fund Actual Budget Requested Approved $▲ %▲General Fund $2,857.1 $3,324.3 $3,652.8 $3,486.9 $162.6 4.9%
Alternative Dispute Res. Fd. $155.0 $199.5 $201.2 $201.2 $1.7 0.9%
Special Programs Fund $85.2 $123.4 $124.3 $124.3 $0.9 0.7%
Grants Fund $382.0 $0.0 $0.0 $0.0 $0.0 ‐‐
Total $3,479.3 $3,647.2 $3,978.3 $3,812.4 $165.2 4.5%
FY22 FY22
FY20 FY21 Requested Approved ▲Fulltime Authorized Positions 35 38 39 38 0
Appropriation Summary
Authorized Positions
Superior Court
FY22 Budget C-131
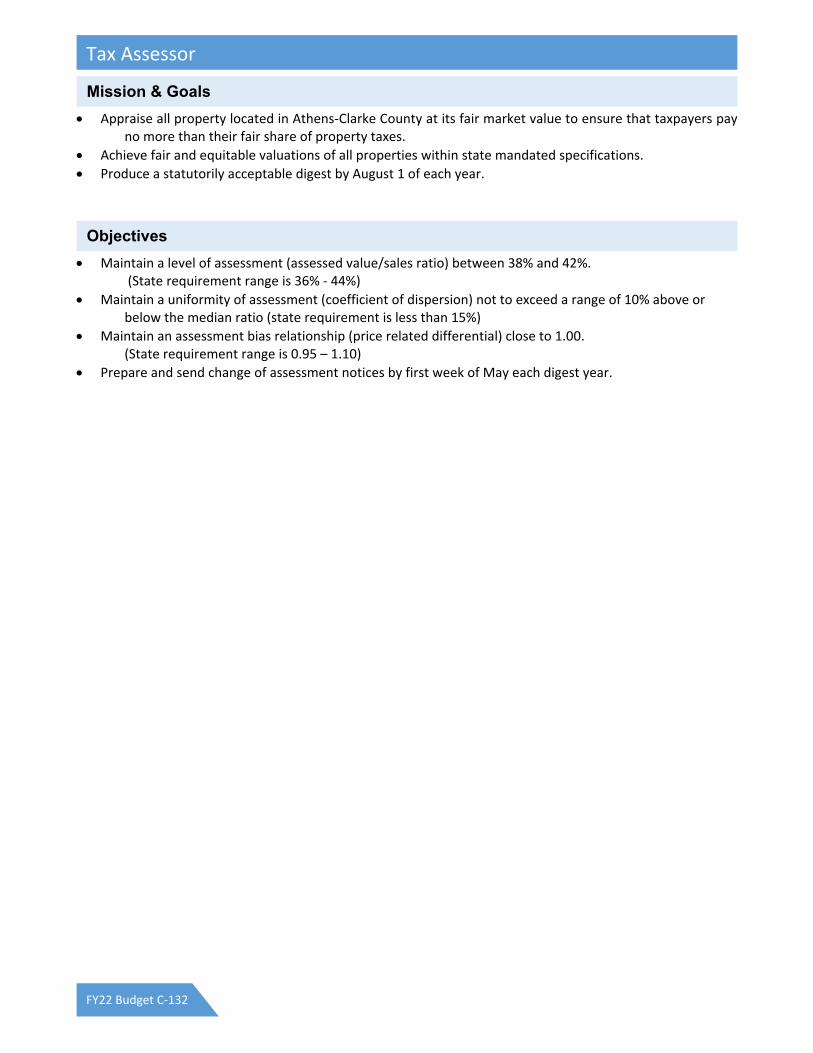
Appraise all property located in Athens‐Clarke County at its fair market value to ensure that taxpayers pay
no more than their fair share of property taxes.
Achieve fair and equitable valuations of all properties within state mandated specifications.
Produce a statutorily acceptable digest by August 1 of each year.
Maintain a level of assessment (assessed value/sales ratio) between 38% and 42%.
(State requirement range is 36% ‐ 44%)
Maintain a uniformity of assessment (coefficient of dispersion) not to exceed a range of 10% above or below the median ratio (state requirement is less than 15%)
Maintain an assessment bias relationship (price related differential) close to 1.00. (State requirement range is 0.95 – 1.10)
Prepare and send change of assessment notices by first week of May each digest year.
Mission & Goals
Objectives
Tax Assessor
FY22 Budget C-132

Outcomes and Performance Measures Goal DY13 DY14 DY15 DY16 DY17 DY18 DY19 DY20
Comments or Analysis
Number of Real Parcels Data Only 41,802 41,871 41,861 41,805 41,828 41,775 41,913 42,218 Annual digest countNumber of Personal Property Accounts Data Only 5,169 5,209 5,216 5,277 5,415 5,451 5,579 5,595 Annual digest countNumber of Mobile Homes Data Only 2,517 2,516 2,514 2,496 2,497 2,498 2,498 2,491 Annual digest count
Maintain Level of Assessment (FMV) 38%-42% 39.53 39.96 40.58 39.39 39.29 38.73 38.46 Mandated by State of GeorgiaMaintain Level of Uniformity < 15% 10.21 3.20 8.81 8.90 8.54 8.32 9.12 Mandated by State of GeorgiaMaintain Level of Assessment Bias 95 - 110 102.26 100.61 101.24 101.58 100.66 100.55 99.80 Mandated by State of GeorgiaGeorgia Department of Audit Ratio Study
Pass, no findings
Pass, no findings
Pass, no findings
Pass, no findings
Pass, no findings
Pass, no findings
Pass, no findings
Pass, no findings Mandated by State of Georgia
Complete fieldwork reviews by February 1 each year > 95% 97% 97% 97% 98% 98% 98% 98% 98%
Necessary deadline in producing of tax digest each year
Complete deed transactions reviews by Feb 1 each year > 95% 95% 95% 96% 97% 98% 99% 99% 99%
Necessary deadline in producing of tax digest each year
Complete mapping updates by Feb 1 each year > 95% 97% 97% 96% 97% 98% 98% 98% 97%
Necessary deadline in producing of tax digest each year
Complete Personal Property accounts to send notices by first week of May each year > 95% 100% 99% 99% 99% 96% 99% 99% *90%
Necessary deadline in producing of tax digest each year
Complete ratio analysis to send notices by first week of May each year > 98% 100% 100% 100% 100% 100% 100% 100% *92%
Necessary deadline in producing of tax digest each year
Process appeals within 180 days of receipt < 180 100% 100% 100% 100% 100% 100% 100% 100%
State requirement for processing appeals in timely manner
Produce timely and acceptable tax digest
August 1 each year Met Met Met Met Met Met Met Met
State requirement for tax digest submission is September 1 each year
Tax Assessor
Appraise all property located in Athens-Clarke County
Achieve fair and equitable valuations of all properties according to state mandated specifications
Produce a statutorily acceptable digest each year so tax bills can be mailed in a timely manner
Performance Measures
Tax Assessor
FY22 Budget C-133

The FY22 Budget of $1.1 million for the Tax Assessor’s office reflects no significant changes to services or
programs.
$8,745 is included for vehicle replacement charges. General Fund vehicle replacement charges were removed from the FY21 Budget by the Mayor and Commission and have been reinstated for FY22.
Salary and benefit changes are due to personnel turnover and/or reallocation of benefits applied by Human Resources.
(All figures in $1,000s) FY20 FY21 FY22 FY22
Appropriations by Type Actual Budget Requested Approved $▲ %▲Salary & Benefits $966.2 $989.0 $1,060.7 $993.4 $4.4 0.4%
Operating $130.9 $122.6 $135.8 $131.3 $8.7 7.1%
Total $1,097.1 $1,111.6 $1,196.5 $1,124.7 $13.1 1.2%
FY22 FY22
FY20 FY21 Requested Approved ▲Fulltime Authorized Positions 13 13 14 13 0
Budget Highlights
Appropriation Summary
Authorized Positions
Tax Assessor
FY22 Budget C-134

The overall goal of the Office of the Tax Commissioner is to provide effective service and accountable tax administration to the citizens of Athens‐Clarke County in a fair and courteous manner. The Property Tax Division is involved in the preparation of the digest, collection of ad valorem tax on real and personal property, disbursements of these collections to the levying authorities, and final audit of these transactions. The Delinquent Tax Division’s mission is to maximize collection of ad valorem tax by working with taxpayers in financial difficulty and maintaining an ongoing levy program. We use all legal measures to collect delinquent tax from those who willfully refuse to pay. The Motor Vehicle Division ‐ Services provided by this division are: (1) registration and titling of vehicles, collection, and disbursements of related taxes and fees; and (2) advising taxpayers of legal means of transferring vehicle ownership and proper registration and titling procedures.
Prepare digest and obtain DOR approval in July to send out Property Tax bills for real and personal
property on or before August 20th for an October 20th due date.
Disburse property tax payments received within one week in off peak season and within two weeks in the peak season as required by O.C.G.A.
Collect, process and disburse 91% of property taxes billed within 30 days of due date and 98.5% by end of fiscal year
Process property tax payments within 24 hours of receipt during off peak season and within 7 business days during peak season.
Maintain Homestead applications
Issue Fifa’s for delinquent taxes
Process and mail out MH bills by February 1st
Process walk in motor vehicle transactions within 15 minutes and mail in within 24 hours of receipt
Disburse weekly to the levying authorities all collections for Motor Vehicle Division
Mission
Objectives
Tax Commissioner
FY22 Budget C-135

Actual Forecast
FY18 FY19 FY20 FY21 FY22
Property Tax Bills ‐ Real/Personal sent out by August 20th 45,866 46,003 46588 46,600 46,600
Disburse Payments per O.C.G.A. 100% 100% 100% 100% 100%
Collect, process and disburse 91% of payments with 30 days of due date and 98.5% by end of fiscal year 100% 100% 100% 100%
100%
Process Property tax payments within 24 hours of receipt during off peak season and within 7 business days during peak season 100% 100% 100% 100% 100%
Homestead Applications Maintained 15,739 15,736 15,669 16,000 16,000
Tax Sale Operations/ Fi‐Fa. Issued 848 711 822 1,900 1,900
Mobile Homes Billed by February 1st 1,801 1,814 1,822 1,791 1,791
Process walk in motor vehicle transactions within 15 minutes and mail in within 25 hours of receipt 99% 99% 99% 100% 100%
Disburse weekly to levying authorities all collections for Motor Vehicle Division 100% 100% 100% 100% 100%
Vehicle Registration Services 106,904 108,342 91,994 100,000 100,000
Vehicle Miscellaneous Services 5,757 5,757 16,952 17,000 17,000
Vehicle Title Services 22,080 22,080 11,746 12,000 12,000
Performance Measures
Tax Commissioner
FY22 Budget C-136

The FY22 Budget of $1.5 million for the Tax Commissioner’s office reflects no significant changes to services or
programs.
Salary and benefit changes are due to personnel turnover, changes in the vacancy factor, and/or reallocation
of benefits applied by Human Resources.
(All figures in $1,000s) FY20 FY21 FY22 FY22
Appropriations by Type Actual Budget Requested Approved $▲ %▲Salary & Benefits $1,320.6 $1,315.0 $1,323.9 $1,321.9 $6.9 0.5%
Operating $182.9 $210.7 $210.7 $210.7 $0.0 0.0%
Total $1,503.5 $1,525.7 $1,534.6 $1,532.6 $6.9 0.5%
FY20 FY21 FY22 FY22
Appropriations by Division Actual Budget Requested Approved $▲ %▲Administration $199.0 $204.7 $216.9 $216.9 $12.2 6.0%
Property Tax $418.7 $433.6 $430.7 $429.7 ($3.9) ‐0.9%
Motor Vehicle $729.1 $716.4 $727.2 $726.2 $9.8 1.4%
Delinquent Tax $156.7 $171.0 $159.8 $159.8 ($11.2) ‐6.5%
Total $1,503.5 $1,525.7 $1,534.6 $1,532.6 $6.9 0.5%
FY22 FY22
FY20 FY21 Requested Approved ▲Fulltime Authorized Positions 19 19 19 19 0
Budget Highlights
Appropriation Summary
Authorized Positions
Tax Commissioner
FY22 Budget C-137

The mission of the Transit Department is to provide safe, courteous, cost effective efficient public transportation services to the citizens of Athens‐Clarke County.
Transit is to provide transportation to employment, educational, medical, shopping, cultural, and other
resource centers for community members, with special attention to those who do not have access to other modes of transportation. a) To identify areas with transit dependent block groups that have an above average propensity to use
transit by assessing census data. b) Recommend change on a system wide basis to better address the needs of citizens. c) Emphasize regional connections for all ground transportation. d) Position Athens Transit as a strong alternative to automobiles by providing more frequency of service,
longer hours of service, multiple transfer options, and more direct routes with shorter travel times.
Transit provides solutions to help improve citizen mobility within Athens‐Clarke County. a) Identify neighborhoods that are underserved and develop service plans. b) Attempt to improve air quality by reducing traffic congestion along specific corridors.
ATS operates in such a manner that is cost effective.
a) Continue to pursue dedicated funding sources for transit services. (Examples; local option sales tax, gasoline tax, etc.)
b) Develop alternative revenue sources that have the least impact on local community tax payers. c) Create a fare structure that is economically feasible for people with low incomes. d) Utilize SPLOST and TSPLOST funding to supplement capital expenses. e) Thoroughly investigate, acquire and implement new technology to achieve operating cost savings.
Continue to foster the ATS and UGA transit services interface in order to achieve community goals. a) Continue to coordinate with Campus Transit to avoid duplication of transit services. b) Develop specific services in conjunction with Campus Transit, tailored to meet the needs of UGA
affiliated passengers. Reduce the need for parking facilities within the CBD and UGA campus therefore allowing maximum
utilization of land for more productive purposes. a) Educate employers, the business community and citizens about the economic benefits of Athens
Transit. b) Encourage more partnerships with employers and business communities. c) Develop park‐n‐ride sites with direct service to the CBD and UGA campus.
SERVICE GOALS
Fixed Route Service – “The Bus” Provide safe, timely transit services to our community and a safe service environment for customers and
employees. Ensure that safe, clean, well‐maintained vehicles are available to operate all trips as scheduled. Achieve a high level of rider satisfaction and an on‐time performance rate that exceeds 95%. Maximize fare revenue, while providing economical services. Limit the cost of providing service by generating more revenue. Increase community awareness and encourage use of available transit service.
Mission
Goals & Objectives
Transit
FY22 Budget C-138

Implement innovative route and scheduling methods to reduce cost and promote increased ridership. Paratransit Demand Response – “The Lift” Limit the increasing cost of providing service by ensuring only qualified individuals are permitted to use the
service. Achieve a high level of rider satisfaction and an on‐time performance rate that exceeds 95%. Optimize scheduling to effectively utilize resources. Implement innovative route and scheduling methods to reduce cost and promote increased ridership.
Note: Because of COVID‐19 Reduced Ridership all Performance Measures have been reduced by 65%
Performance Measures
Transit
FY22 Budget C-139

The FY22 Budget for the Transit Enterprise Fund includes:
Revenue
Federal funding, estimated to be almost $3.9 million in FY22, based on the current grant contract and
funding from the CARES Act
Note: Additional federal funding through the American Rescue Plan Act is anticipated for ACCGov Transit in FY22. This increased funding is not included in the Approved Budget as it is pending official
notification from the Federal Transit Administration (FTA)
There will be no General Fund contribution to the Transit Enterprise Fund, same as FY21 Budget, due to
increased federal funding allocations expected in FY22 from the FTA through the American Rescue Plan
Act
• Transit is approved to remain fare‐free for FY22, so no farebox revenue nor contributions from the
University of Georgia (UGA) for student ridership are projected
Expenses
Total expenses (less depreciation of $4.4 million) are projected at $7.3 million, same as FY21 Budget
(calculated as total expenses less depreciation of $4.4 million)
$2,689 of FY22 cost savings is included for the conversion of two part‐time positions to one fulltime
Administrative Assistant position
$6,976 of FY22 cost savings is included for the conversion of two part‐time positions to one fulltime Route
Supervisor position
Full funding is included for two fulltime Transit Maintenance Worker positions, which were added for thelast six months of FY21
$100,841 is included for the Transit Planning Grant, similar to FY21, which funds a Planner II position
Salary and benefit changes are due to personnel turnover and/or reallocation of benefits applied by Human Resources.
For more information on the Transit Fund, see page E‐34.
Budget Highlights
Transit
FY22 Budget C-140
thurml
Sticky Note
Marked set by thurml

(All figures in $1,000s) FY20 FY21 FY22 FY22
Appropriations by Type Actual Budget Requested Approved $▲ %▲Salary & Benefits $4,460.7 $4,845.5 $4,824.4 $4,824.4 ($21.1) ‐0.4%
Operating $1,083.5 $1,415.5 $1,285.5 $1,285.5 ($130.0) ‐9.2%
Total $5,544.2 $6,261.0 $6,109.9 $6,109.9 ($151.1) ‐2.4%
FY20 FY21 FY22 FY22
Appropriations by Division Actual Budget Requested Approved $▲ %▲Administration $565.2 $679.00 $717.80 $717.80 $38.8 5.7%
Operations $3,752.6 $4,164.6 $3,989.4 $3,989.4 ($175.2) ‐4.2%
Demand Response $258.6 $355.4 $316.5 $316.5 ($38.9) ‐10.9%
Maintenance $967.8 $1,062.0 $1,086.2 $1,086.2 $24.2 2.3%
Total $5,544.2 $6,261.0 $6,109.9 $6,109.9 ($151.1) ‐2.4%
FY20 FY21 FY22 FY22
Appropriations by Fund Actual Budget Requested Approved $▲ %▲Transit Fund $5,472.2 $6,166.4 $6,009.0 $6,009.1 ($157.3) ‐2.6%
Grants Fund $72.0 $94.6 $100.8 $100.8 $6.2 6.6%
Total $5,544.2 $6,261.0 $6,109.8 $6,109.9 ($151.1) ‐2.4%
FY22 FY22
FY20 FY21 Requested Approved ▲Fulltime Authorized Positions 77 79 81 81 2
(all numbers in thousands of dollars) 5 ‐ Year CIP
Capital Appropriations
FY20
Year End
Balance
FY21
Budget
FY22
Approved
FY23‐FY26
Proposed
FY27‐31
ProposedGeneral Capital Projects FundCurrent ServicesD‐165 Matching Funds for Transit Capital Improvement Grants 94.7 ‐ 50.0 320.0 400.0Current Services Total 94.7 ‐ 50.0 320.0 400.0
Additions & ImprovementsD‐166 Update Transit Plans and Transit Studies ‐ ‐ 30.0 ‐ 150.0Additions and Improvements Total ‐ ‐ 30.0 ‐ 150.0
Capital Appropriations Total 94.7 ‐ 80.0 320.0 550.0
Appropriation Summary
Capital Budgets, 5-Year CIP and Project Forecast
Authorized Positions
Transit
FY22 Budget C-141

Transportation & Public Works is committed to the responsible planning, construction, maintenance, and
operation of a transportation network that is effective and safe for people using all modes of transportation.
Further, Transportation & Public Works is dedicated to a stormwater management program that improves both
the conveyance of stormwater and the quality of our streams and rivers while running an effective and
responsive utility.
The Department strives to provide an effective and safe transportation network for people using all modes
through the following:
Provide a proactive asset management program to key transportation infrastructure including pavement, bridges, traffic signals, pavement markings, and signs
Provide safe and efficient roadways Provide effective and connected bicycle and pedestrian networks that are comfortable and safe for all
users Provide safe, clear, efficient, and effective traffic control and guidance systems Provide proactive and responsive maintenance to transportation systems Promote high quality, safe, effective and environmentally sensitive development in the community Oversee the effective and cost efficient construction of transportation improvements Provide prompt emergency response that serves the needs of Athens‐Clarke County
The Department strives to provide an effective stormwater program through the following:
Provide a proactive asset management program to key stormwater infrastructure including dams, detention facilities, culverts, and stormwater collection systems
Provide safe and efficient public storm water collection and conveyance systems Operate a utility that is cost efficient, effective, and responsive Identify safety and operational deficiencies in drainage systems and deliver corrective solutions in a
timely manner
Transportation:
Provide major roadway maintenance (resurfacing) to at least 5.8% (70 lane‐miles) of ACC lane miles to provide a sustainable life cycle program (10 years for arterials, 15 years for collectors, and 20 years for local roadways)
Replace approximately one bridge every 1.5 years to provide sufficient structures Rebuild approximately 8% (7) traffic signals annually to provide a reliable and effective signal system Upgrade 8%, approximately 2,750, of all road signs on an annual basis to ensure proper reflectivity
standards of all signs Complete plans review for new development within fourteen (14) days of submittal Complete 95% of street work requests within thirty (30) days of receiving the request
Stormwater:
Develop and implement an asset management program for piped stormwater systems Continue implementation of Stormwater Master Plan Maintain stormwater utility bill collection to average at least 92% yearly
Mission
Goals
Objectives
Transportation & Public Works
FY22 Budget C-142

Provide a cost effective stormwater utility that maximizes public investment Complete 95% of stormwater requests within thirty (30) days of receiving the request
Performance Measure Goal FY17 FY18 FY19 FY20 FY21* Comments
Lane-miles receiving major roadway maintenance as % of all lane-miles (resurfacing, full-depth reconstruction, etc.)
> 5.8% 1.7% 2.0% 5.5% 3.4% 3.3%FY20-21 decrease due to COVID. FY21-22 anticipated to increase significantly
Lane-miles in good or excellent condition as % of all lane-miles
> 70% 44% 46% 45% 66% 66%Updated in Spring '20 with newly collected IMS results
Average bridge sufficiency rating > 80 78.2 78.2 78.2 79.6 79.6Current score from 2019 GDOT report.
Number of traffic signal rebuilds as % of all ACC traffic signals
> 8% 1.2% 3.3% 3.4% 3.2% 1.0%10 traffic signals rebuilt in FY20
Average traffic signal age Data Only 23 24 24 24 24One third of ACC signals exceed age of 39-years
Cabinet equipment preventative maintenance inspections % of all signals
100% 100% 90% 78% 84% 36%
Preventative maintenance inspections of field equipment as % of all traffic signals
> 50% 30% 85% 42% 28% 28%
Traffic Signal Maintenance Devices Per Technician
≤ 40 61 62 65 68 70Device numbers continue to increase as staffing levels remain constant
Centerline miles of roadway striping installed as % of centerline miles
> 12% 4.3% 6.0% 1.7% 6.4% 18.4%An aggressive Off-System Safety program attributes to FY21 spike in striping.
Number of signs replaced as percentage of all signs
> 8% 5.0% 5.2% 4.6% 5.5% 4.4%Many signs are older and noncompliant with MUTCD retro-reflectivity standards.
Average response time (days) for all roadway work requests
< 72 hours 24.0 26.0 58.0 38.0 26.0871 roadway work requests resolved in FY20
% dead animals removed within 24-hours of notice
>97% 100% 100% 100% 100% 100%All 355 dead animals removed in FY20 within 24-hour notice
Number of all roadway work requests completed in 30 days as % of all requests
> 95% 91.1% 93.2% 91.0% 96.0% 98.0%Increase due to better tracking through Cityworks
Site Plans Reviews completed within allocated review times (7 or 14 days depending) as % of all Site Reviews.
> 95% 83.0% 90.0%
This includes initial and resubmittals review time for 14 and 7 days target turnaround.
New for FY19
Our staff is committed to the responsible planning, construction, and maintenance of a transportation network
FY21 projected decrease due to signal tech vacancies and COVID restrictions, as well as an increase small cell project demands on staff time
TRANSPORTATIO
N
Performance Measures
Transportation & Public Works
FY22 Budget C-143

Overall arterial level of service (LOS) C Developing work flow
Million vehicle miles traveled Data Only 1105 1149 1213 1303 1226FY21 decrease most likely due to COVID
Total pedestrian network mileage as percent of overall roadway network
Data Only 32.3% 32.4% 32.4% 32.5% 32.6%.7 miles of sidewalk anticipated in FY21
Total bicycle network mileage as percent of overall roadway network
> 51% 12.8% 12.8% 12.8% 13.0% 13.0%Additional multi-use facilities anticipated in FY21-22
Crashes / 100 million vehicle miles traveled
Decrease FPY
494 603 389 325 227
Fatalities (sum of reported vehicular, bicycle, and pedestrian)
Decrease FPY
11 8 11 19 16
Serious Injuries (sum of reported vehicular, bicycle, and pedestrian)
Decrease FPY
71 80
Number of pedestrian-related crashesDecrease
FPY57 75 63 44 28
Number of bicycle-related crashesDecrease
FPY26 33 23 18 4
*FY21 numbers projected based on data collected from Q1
that is effective
and safe for all modes of transportation.
FY19 and FY20 crash numbers appear much lower than previous years. Possibly due to combination of distracted driving law and regression to the mean. FY21 decrease most likely a side effect of reduced driving during Pandemic
New For FY20
TRANSPORTATIO
N
Performance Measure Goal FY17 FY18 FY19 FY20 FY21* Comments
Stormwater Pipe in Good or Excellent Condition as % of pipe
Developing work flow
Total number of stormwater pipes in failed condition (condition score above 4)
Data Only 15 24 23
Live Stream Pipes are failing at a rate of 2-3 per year. Current funding will not keep up with this.
Number of linear feet of stormwater pipe rehabilitated/replaced
Data OnlyNew for
FY18462 1426 1721 240
FY21 Decrease due to limited funding and reduced in-house projects due to COVID
% inspection of stormwater drains in public right of way
100% 100% 86% 90% 10% 24%
Lower numbers due to unforseen staff reduction and restrictions on inmate usage due to COVID
Number of flooding-related work requests
Data Only 12 0 0Now tracking through Cityworks
Average response time (days) for all stormwater work requests
< 72 hours 15 19 58 47 48
Number of stormwater work requests completed in 30 days as % of all requests
> 90% 97% 94% 95.0% 95.0% 96.0%
Number of sampling locations within Georgia EPD thresholds as % of all sampling locations
Developing work flow
Number of Illicit Discharge Complaints Data Only 43 66 19 10 8
% of Illicit Discharge Complaints responded to in 48 hours
100% 100% 100% 100% 100% 100%
Cubic yards of waste removed from stormwater system
Data Only 9134 5236 8724Better tracking through Cityworks
Further, we are dedicated to a stormwater management program that improves both the conveyance of stormwater
and the quality of our streams and rivers.
980 stormwater work requests resolved in FY20
As required by NPDES Phase II Permit
New in FY22
New for FY18
New in FY22
New for FY19
ST
OR
MW
AT
ER
Transportation & Public Works
FY22 Budget C-144

Transportation and Public Works is funded through two funds: the General Fund and the Stormwater Fund.
The General Fund supports Administration, Traffic & Operations, Engineering, and Streets & Drainage. The
Stormwater Fund supports Engineering, Streets & Drainage, and Stormwater Management for stormwater
projects.
The Approved Budget for Transportation and Public Works includes budgeted funding from the General fund
for;
$226,658 for vehicle replacement charges. General Fund vehicle replacement charges were removed from
the FY21 Budget by the Mayor and Commission and have been reinstated for FY22.
$6,000 for the Quiet Zone Application to begin to determine the eligibility for redevelopment of railway
crossings to reduce noise.
Salary and benefit changes are due to performance management pay, personnel turnover, changes in the
vacancy factor, and/or reallocation of benefits applied by Human Resources.
For more information on the Stormwater Fund, see page E‐38. For information on individual fees, see the
Schedule of Fees and Charges beginning on page G‐15.
Utility bill collection rate > 95% 91% 93% 90% 99% 88%Projection pending final collections
% credit card payments > 4.6% 2.8% 6.4% 7.4% 18.0% 22.0%Increase due to ClickToGov rollout
Monthly stormwater rate per 1,000 square feet
< $1.91 $1.34 $1.34 $1.34 $1.34 $1.34 Utility Fee Review ongoing
Number of impervious surface appeals reviewed
Data Only 286 51 13 112 12Peak reviews from impervious surface audit
Number of new credit applications approved
Data Only 1 0 2 4 0Utility Fee Review looking for ways to increase
*FY20 numbers projected based on data collected from Q1
while running an effective and responsive utility.S
TO
RM
WA
TE
R
Budget Highlights
Transportation & Public Works
FY22 Budget C-145

(All figures in $1,000s) FY20 FY21 FY22 FY22
Appropriations by Type Actual Budget Requested Approved $▲ %▲Salary & Benefits $4,842.7 $5,486.7 $5,395.2 $5,284.1 ($202.6) ‐3.7%
Operating $2,412.3 $2,648.5 $2,977.1 $2,907.7 $259.2 9.8%
Total $7,255.0 $8,135.2 $8,372.3 $8,191.8 $56.6 0.7%
FY20 FY21 FY22 FY22
Appropriations by Division Actual Budget Requested Approved $▲ %▲Administration $238.5 $387.1 $469.3 $460.7 $73.6 19.0%
Traffic & Operations $2,328.8 $2,331.3 $2,558.0 $2,396.0 $64.7 2.8%
Engineering $985.5 $1,115.7 $798.4 $790.1 ($325.6) ‐29.2%
Streets & Drainage $2,601.0 $2,986.2 $2,831.2 $2,829.6 ($156.6) ‐5.2%
Storm Water Management $1,101.2 $1,314.9 $1,715.4 $1,715.4 $400.5 30.5%
Total $7,255.0 $8,135.2 $8,372.3 $8,191.8 $56.6 0.7%
FY20 FY21 FY22 FY22
Appropriations by Fund Actual Budget Requested Approved $▲ %▲General Fund $4,309.9 $4,547.8 $4,974.9 $4,794.4 $246.6 5.4%
Stormwater Fund $2,945.1 $3,587.4 $3,397.4 $3,397.4 ($190.0) ‐5.3%
Total $7,255.0 $8,135.2 $8,372.3 $8,191.8 $56.6 0.7%
Appropriation Summary
Transportation & Public Works
FY22 Budget C-146

FY22 FY22
FY20 FY21 Requested Approved ▲Fulltime Authorized Positions 89 90 92 90 0
(all numbers in thousands of dollars) 5 ‐ Year CIP
Capital Appropriations
FY20
Year End
Balance
FY21
Budget
FY22
Approved
FY23‐FY26
Proposed
FY27‐31
ProposedGeneral Capital Projects FundCurrent ServicesD‐167 Signal Replacement 153.5 200.0 75.0 3,565.0 5,287.5D‐171 Roadway Safety Devices Life Cycle Replacement 85.5 130.0 150.0 1,678.0 2,900.0D‐172 Upgrade Overhead Street Name Signs 25.4 150.0 75.0 2,006.0 3,300.0D‐174 Pavement Maintenance Program 198.4 ‐ 700.0 12,513.0 41,347.0D‐175 Bridge Improvement & Replacement Program 329.1 50.0 50.0 200.0 250.0Current Services Total 791.8 530.0 1,050.0 19,962.0 53,084.5
Additions & ImprovementsD‐168 Expand Fiber Optic Cable Communications System 40.3 ‐ ‐ 140.0 200.0D‐169 Traffic Data Collection 16.4 30.0 ‐ 120.0 150.0D‐170 Sidewalk and Other Improvements 52.1 ‐ ‐ 160.0 200.0D‐173 Local Road Improvement Projects 177.3 ‐ ‐ 480.0 650.0D‐177 Pedestrian Safety and Traffic Calming Improvements 114.6 ‐ ‐ 40.0 200.0D‐178 Bicycle Transportation Improvements ‐ ‐ ‐ ‐ 1,000.0D‐179 N Streetlight Capital ‐ ‐ 19.0 ‐ ‐D‐180 N Neighborhood Traffic ‐ ‐ 20.0 ‐ ‐Additions and Improvements Total 400.8 30.0 39.0 940.0 2,400.0
General Capital Projects Fund Total 1,192.6 560.0 1,089.0 20,902.0 55,484.5
Stormwater FundCurrent ServicesD‐176 Stormwater Improvement Prog / Areawide 1,891.4 600.0 200.0 800.0 1,000.0Current Services Total 1,891.4 600.0 200.0 800.0 1,000.0
Stormwater Fund Total 1,891.4 600.0 200.0 800.0 1,000.0
Capital Appropriations Total 3,084.0 1,160.0 1,289.0 21,702.0 56,484.5
Capital Budgets, 5-Year CIP and Project Forecast
Authorized Positions
Transportation & Public Works
FY22 Budget C-147

The Capital Improvement Plan (CIP) is a multi-year planning instrument used by Athens-Clarke County to identify capital projects and to coordinate the financing of these projects. Capital projects are undertaken to:
a) Maintain infrastructure and public facilities,b) Promote economic development and enhance the quality of life,c) Enhance the delivery of services,d) Preserve community and historical assets ande) Improve economically depressed areas and / or those areas with low and moderate income households.
For budgeting and accounting, a capital project is defined as an individual asset or project expenditure of at least $30,000 which has an expected useful life of three years or longer. It includes any vehicle requests that may increase the size of the fleet beyond its current authorized level. The Mayor and Commission must approve all capital projects and additions to the fleet.
The first year of the Capital Improvement Plan is the Capital Budget. When adopted by the Mayor and Commission, the Capital Budget formally authorizes the expenditure of funds for FY22 capital projects. Projects outlined in the remaining four years (FY23 – FY26) are for planning purposes only and are not authorized until included in an adopted Capital Budget. Furthermore, projects identified in years FY27–FY31 are listed to show a budget estimate for the next five years of future capital planning.
In accordance with the Government’s fiscal policies, once approved, the appropriation balance carries forward until the project is completed or funds have been expended.
Capital requests are classified in either of two project categories:
a) Capital for Current Services (CS) andb) Capital for Additional or Improved Services (A&I).
CS projects are designed to maintain the current capital base or the existing service level. A&I projects are intended to improve service levels or add to the capital base.
Expenditures (uses) proposed for the FY22 Capital Budget total $45.8 million (page D-2). General Capital Fund projects (page D-3) total $5.7 million. The remaining capital projects in the Enterprise, Internal Service and Special Revenue Funds total $40.2 million.
The FY22 Capital Budget and the Five-Year Capital Improvement Plan are summarized on pages D-3 to D-19. Detailed data sheets for individual projects begin on page D-20.
FY22 Capital Budget and Capital Improvement Plan
FY22 Budget D-1

Capital Projects for Current Services
General Capital Projects Fund Landfill Enterprise Fund
CS Facilities Life Cycle Maintenance Program 1,262,756$ SW Replace Trash Compactor 450,000$
IT Information Technology Equipment Replacement Program 400,000$ Other Landfill Ent Fund 1,088,000$
PD On‐Officer Cameras and Data Storage 276,072$ Subtotal 1,538,000$
PD Replacement of Conducted Energy Device (CED) Units 276,072$
Other General Capital Projects Fund 3,039,100$ All Other CS Projects 97,000$
Subtotal 5,254,000$
Current Services ‐ All Funds 38,537,000$
Fleet Replacement Fund
CS Fleet Replacement Program 3,853,000$ Capital Projects for Additions & Improvements
General Capital Projects Fund
Storm Water Management Enterprise Fund MGR TSPLOST 2023 Planning 100,000$
TPW Stormwater Improvement Prog / Areawide 200,000$ Other General Capital Projects Fund 297,000$
Subtotal 397,000$
Water & Sewer Enterprise Fund
PU Rehabilitate and Replace Sewers 7,500,000$ Water & Sewer Enterprise Fund
PU Improve Water Supply Reliability 6,000,000$ PU WRF Phosphorous Improvements 5,500,000$
PU Manage and Reuse Residual Solids 4,780,000$ PU Water Transmission Grid Improvements 650,000$
PU Replace and Upgrade Facilities and Equipment 3,400,000$ Other Water & Sewer Ent Fund 750,000$
PU Rehabilitate and Replace Water Lines 3,000,000$ Subtotal 6,900,000$
PU W&S Lines ‐ Additions and Improvements 975,000$
PU Meter and Water/Sewer Stub Additions 510,000$ Additions & Improvements ‐ All Funds 7,297,000$
PU Replace Water Meters 365,000$
PU Donated W&S Additions Management 230,000$
Other Water & Sewer Ent Fund 300,000$
Subtotal 27,060,000$
Solid Waste Enterprise Fund
SW Replace Automated Refuse/Recycling Truck 310,000$
Other Solid Waste Enterprise Fund 225,000$
Subtotal 535,000$ Total FY22 Capital Budget 45,834,000$
Major Projects Capital Summary FY22 Budget D-2
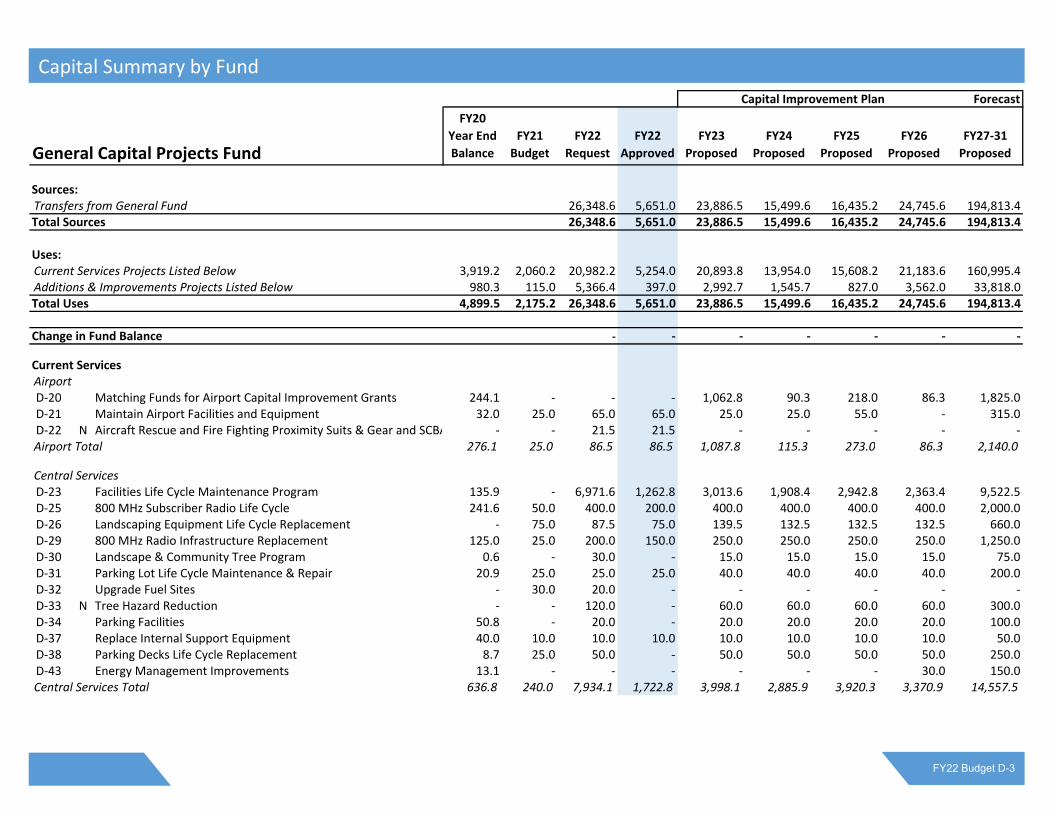
Capital Improvement Plan Forecast
General Capital Projects Fund
FY20
Year End
Balance
FY21
Budget
FY22
Request
FY22
Approved
FY23
Proposed
FY24
Proposed
FY25
Proposed
FY26
Proposed
FY27‐31
Proposed
Sources:Transfers from General Fund 26,348.6 5,651.0 23,886.5 15,499.6 16,435.2 24,745.6 194,813.4Total Sources 26,348.6 5,651.0 23,886.5 15,499.6 16,435.2 24,745.6 194,813.4
Uses:Current Services Projects Listed Below 3,919.2 2,060.2 20,982.2 5,254.0 20,893.8 13,954.0 15,608.2 21,183.6 160,995.4Additions & Improvements Projects Listed Below 980.3 115.0 5,366.4 397.0 2,992.7 1,545.7 827.0 3,562.0 33,818.0Total Uses 4,899.5 2,175.2 26,348.6 5,651.0 23,886.5 15,499.6 16,435.2 24,745.6 194,813.4
Change in Fund Balance ‐ ‐ ‐ ‐ ‐ ‐ ‐
Current ServicesAirportD‐20 Matching Funds for Airport Capital Improvement Grants 244.1 ‐ ‐ ‐ 1,062.8 90.3 218.0 86.3 1,825.0D‐21 Maintain Airport Facilities and Equipment 32.0 25.0 65.0 65.0 25.0 25.0 55.0 ‐ 315.0D‐22 N Aircraft Rescue and Fire Fighting Proximity Suits & Gear and SCBA ‐ ‐ 21.5 21.5 ‐ ‐ ‐ ‐ ‐Airport Total 276.1 25.0 86.5 86.5 1,087.8 115.3 273.0 86.3 2,140.0
Central ServicesD‐23 Facilities Life Cycle Maintenance Program 135.9 ‐ 6,971.6 1,262.8 3,013.6 1,908.4 2,942.8 2,363.4 9,522.5D‐25 800 MHz Subscriber Radio Life Cycle 241.6 50.0 400.0 200.0 400.0 400.0 400.0 400.0 2,000.0D‐26 Landscaping Equipment Life Cycle Replacement ‐ 75.0 87.5 75.0 139.5 132.5 132.5 132.5 660.0D‐29 800 MHz Radio Infrastructure Replacement 125.0 25.0 200.0 150.0 250.0 250.0 250.0 250.0 1,250.0D‐30 Landscape & Community Tree Program 0.6 ‐ 30.0 ‐ 15.0 15.0 15.0 15.0 75.0D‐31 Parking Lot Life Cycle Maintenance & Repair 20.9 25.0 25.0 25.0 40.0 40.0 40.0 40.0 200.0D‐32 Upgrade Fuel Sites ‐ 30.0 20.0 ‐ ‐ ‐ ‐ ‐ ‐D‐33 N Tree Hazard Reduction ‐ ‐ 120.0 ‐ 60.0 60.0 60.0 60.0 300.0D‐34 Parking Facilities 50.8 ‐ 20.0 ‐ 20.0 20.0 20.0 20.0 100.0D‐37 Replace Internal Support Equipment 40.0 10.0 10.0 10.0 10.0 10.0 10.0 10.0 50.0D‐38 Parking Decks Life Cycle Replacement 8.7 25.0 50.0 ‐ 50.0 50.0 50.0 50.0 250.0D‐43 Energy Management Improvements 13.1 ‐ ‐ ‐ ‐ ‐ ‐ 30.0 150.0Central Services Total 636.8 240.0 7,934.1 1,722.8 3,998.1 2,885.9 3,920.3 3,370.9 14,557.5
Capital Summary by Fund
FY22 Budget D-3

Capital Improvement Plan Forecast
General Capital Projects Fund
FY20
Year End
Balance
FY21
Budget
FY22
Request
FY22
Approved
FY23
Proposed
FY24
Proposed
FY25
Proposed
FY26
Proposed
FY27‐31
Proposed
CorrectionsD‐45 Food Service Equipment Life Cycle Replacement 30.2 20.0 20.0 20.0 20.0 20.0 20.0 20.0 30.0D‐46 N Officer Portable Radio and Charging Station Purchase ‐ ‐ 60.0 10.0 10.0 10.0 10.0 10.0 10.0D‐47 N Corrections Institution Building Renovation and Life Safety Equip ‐ ‐ 570.2 ‐ 598.7 628.6 ‐ ‐ ‐Corrections Total 30.2 20.0 650.2 30.0 628.7 658.6 30.0 30.0 40.0
Fire & Emergency ServicesD‐48 N Fire Apparatus Replacement ‐ Rescue Unit ‐ ‐ 99.0 ‐ 99.0 99.0 99.0 99.0 ‐D‐49 N Fire Apparatus Replacement ‐ Ladder 7 ‐ ‐ 183.0 ‐ 183.0 183.0 183.0 183.0 915.0D‐50 Replace Mobile Data Terminals 154.3 50.0 50.0 50.0 50.0 50.0 50.0 50.0 250.0D‐54 N Hose & Appliances ‐ ‐ 317.2 25.0 ‐ ‐ ‐ ‐ ‐Fire & Emergency Services Total 154.3 50.0 649.2 75.0 332.0 332.0 332.0 332.0 1,165.0
Information TechnologyD‐55 Information Technology Equipment Replacement Program 431.9 350.0 415.0 400.0 500.0 415.0 350.0 415.0 1,750.0Information Technology Total 431.9 350.0 415.0 400.0 500.0 415.0 350.0 415.0 1,750.0
Leisure ServicesD‐56 Parks ‐ R&M Existing Facilities ‐ 57.0 4,258.5 200.0 1,212.1 477.0 2,252.3 1,035.9 3,040.9D‐57 Pool Repairs and Renovations 37.8 50.0 163.6 150.0 330.3 142.1 238.9 14.1 350.3D‐58 Bridge and Boardwalk Inspection and Replacement 27.7 ‐ 730.1 ‐ 454.5 492.0 454.5 528.5 845.3D‐59 Pavement Repair and Maintenance 6.6 ‐ 370.5 ‐ 102.6 885.0 239.2 439.2 536.1D‐60 Park Equipment ‐ Replacement / Life Cycle 2.9 ‐ 647.6 75.0 433.1 237.2 575.7 223.9 1,150.6D‐61 N Cook's Trail Improvements ‐ ‐ 1,062.2 ‐ 6,524.8 ‐ ‐ ‐ ‐D‐62 Improve Bear Hollow Zoo Exhibits & Visitor Amenities ‐ ‐ ‐ ‐ ‐ ‐ ‐ ‐ 8,364.0D‐63 Ben Burton Park Repairs and Renovations ‐ ‐ ‐ ‐ ‐ ‐ ‐ 2,223.8 ‐D‐64 Create a Property Boundary Program ‐ ‐ ‐ ‐ ‐ 50.0 50.0 50.0 100.0D‐65 Memorial Park Renovations ‐ ‐ ‐ ‐ ‐ ‐ ‐ 1,519.0 9,331.0D‐66 Bishop Park Renovations ‐ ‐ ‐ ‐ ‐ ‐ ‐ ‐ 20,500.0D‐67 Dudley Park Improvements ‐ ‐ ‐ ‐ ‐ ‐ ‐ ‐ 5,164.0D‐68 N Sandy Creek Park Improvements ‐ ‐ ‐ ‐ ‐ ‐ ‐ ‐ 6,703.0D‐69 N Satterfield Park Improvements ‐ ‐ ‐ ‐ ‐ ‐ ‐ ‐ 4,697.0D‐70 N Southeast Clarke Park Improvements ‐ ‐ ‐ ‐ ‐ ‐ ‐ 2,330.0 14,317.0D‐71 N Virginia Callaway‐Cofer Walker Park Improvements ‐ ‐ ‐ ‐ ‐ ‐ ‐ ‐ 4,440.0D‐72 Morton Theatre Fork Lift Replacement ‐ ‐ ‐ ‐ ‐ ‐ ‐ 35.0 ‐
Capital Summary by Fund FY22 Budget D-4
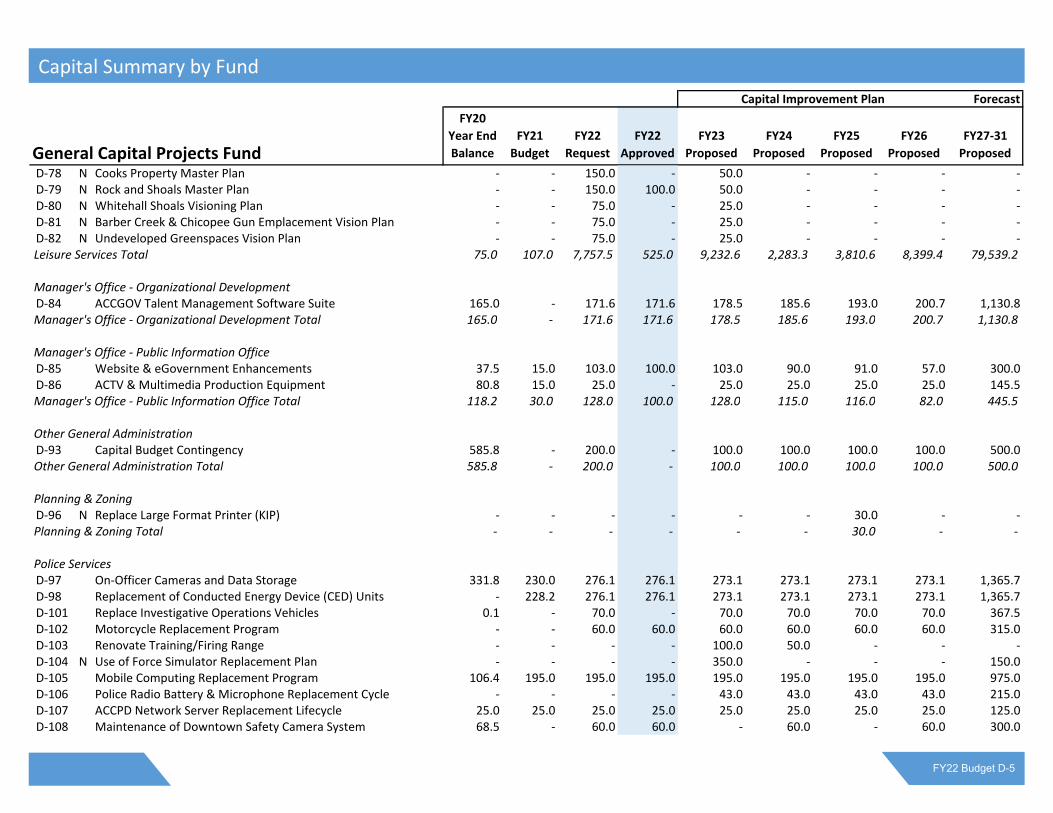
Capital Improvement Plan Forecast
General Capital Projects Fund
FY20
Year End
Balance
FY21
Budget
FY22
Request
FY22
Approved
FY23
Proposed
FY24
Proposed
FY25
Proposed
FY26
Proposed
FY27‐31
Proposed
D‐78 N Cooks Property Master Plan ‐ ‐ 150.0 ‐ 50.0 ‐ ‐ ‐ ‐D‐79 N Rock and Shoals Master Plan ‐ ‐ 150.0 100.0 50.0 ‐ ‐ ‐ ‐D‐80 N Whitehall Shoals Visioning Plan ‐ ‐ 75.0 ‐ 25.0 ‐ ‐ ‐ ‐D‐81 N Barber Creek & Chicopee Gun Emplacement Vision Plan ‐ ‐ 75.0 ‐ 25.0 ‐ ‐ ‐ ‐D‐82 N Undeveloped Greenspaces Vision Plan ‐ ‐ 75.0 ‐ 25.0 ‐ ‐ ‐ ‐Leisure Services Total 75.0 107.0 7,757.5 525.0 9,232.6 2,283.3 3,810.6 8,399.4 79,539.2
Manager's Office ‐ Organizational DevelopmentD‐84 ACCGOV Talent Management Software Suite 165.0 ‐ 171.6 171.6 178.5 185.6 193.0 200.7 1,130.8Manager's Office ‐ Organizational Development Total 165.0 ‐ 171.6 171.6 178.5 185.6 193.0 200.7 1,130.8
Manager's Office ‐ Public Information OfficeD‐85 Website & eGovernment Enhancements 37.5 15.0 103.0 100.0 103.0 90.0 91.0 57.0 300.0D‐86 ACTV & Multimedia Production Equipment 80.8 15.0 25.0 ‐ 25.0 25.0 25.0 25.0 145.5Manager's Office ‐ Public Information Office Total 118.2 30.0 128.0 100.0 128.0 115.0 116.0 82.0 445.5
Other General AdministrationD‐93 Capital Budget Contingency 585.8 ‐ 200.0 ‐ 100.0 100.0 100.0 100.0 500.0Other General Administration Total 585.8 ‐ 200.0 ‐ 100.0 100.0 100.0 100.0 500.0
Planning & ZoningD‐96 N Replace Large Format Printer (KIP) ‐ ‐ ‐ ‐ ‐ ‐ 30.0 ‐ ‐Planning & Zoning Total ‐ ‐ ‐ ‐ ‐ ‐ 30.0 ‐ ‐
Police ServicesD‐97 On‐Officer Cameras and Data Storage 331.8 230.0 276.1 276.1 273.1 273.1 273.1 273.1 1,365.7D‐98 Replacement of Conducted Energy Device (CED) Units ‐ 228.2 276.1 276.1 273.1 273.1 273.1 273.1 1,365.7D‐101 Replace Investigative Operations Vehicles 0.1 ‐ 70.0 ‐ 70.0 70.0 70.0 70.0 367.5D‐102 Motorcycle Replacement Program ‐ ‐ 60.0 60.0 60.0 60.0 60.0 60.0 315.0D‐103 Renovate Training/Firing Range ‐ ‐ ‐ ‐ 100.0 50.0 ‐ ‐ ‐D‐104 N Use of Force Simulator Replacement Plan ‐ ‐ ‐ ‐ 350.0 ‐ ‐ ‐ 150.0D‐105 Mobile Computing Replacement Program 106.4 195.0 195.0 195.0 195.0 195.0 195.0 195.0 975.0D‐106 Police Radio Battery & Microphone Replacement Cycle ‐ ‐ ‐ ‐ 43.0 43.0 43.0 43.0 215.0D‐107 ACCPD Network Server Replacement Lifecycle 25.0 25.0 25.0 25.0 25.0 25.0 25.0 25.0 125.0D‐108 Maintenance of Downtown Safety Camera System 68.5 ‐ 60.0 60.0 ‐ 60.0 ‐ 60.0 300.0
Capital Summary by Fund
FY22 Budget D-5

Capital Improvement Plan Forecast
General Capital Projects Fund
FY20
Year End
Balance
FY21
Budget
FY22
Request
FY22
Approved
FY23
Proposed
FY24
Proposed
FY25
Proposed
FY26
Proposed
FY27‐31
Proposed
D‐110 N Replacement of Computer‐Aided Dispatch (CAD) Workstations ‐ ‐ ‐ ‐ 60.0 ‐ ‐ ‐ 60.0D‐111 N Mobile Command Center Replacement ‐ ‐ ‐ ‐ ‐ 850.0 ‐ ‐ ‐D‐113 Ballistic Vest Replacement (Rifle Plates & Carriers) ‐ ‐ ‐ ‐ ‐ 50.0 ‐ ‐ ‐Police Total 531.8 678.2 962.1 892.1 1,449.3 1,949.3 939.3 999.3 5,238.9
SheriffD‐134 Public Safety Initiative ‐Equip Tech 27.5 30.0 30.0 ‐ 30.0 30.0 30.0 30.0 150.0D‐135 Replace Mobile Data Computers ‐ ‐ 76.0 76.0 ‐ ‐ ‐ ‐ 76.0D‐137 Purchase Body Worn Cameras ‐ ‐ ‐ ‐ 300.0 ‐ 50.0 ‐ 350.0D‐138 Purchase Tasers and Related Equipment ‐ ‐ ‐ ‐ 103.0 ‐ ‐ ‐ 103.0D‐139 Replace Courthouse Security Equipment ‐ ‐ ‐ ‐ ‐ ‐ ‐ ‐ 75.0D‐140 Replace Prisoner Transport Bus ‐ ‐ ‐ ‐ ‐ ‐ ‐ ‐ 250.0Sheriff Total 27.5 30.0 106.0 76.0 433.0 30.0 80.0 30.0 1,004.0
Solid WasteD‐163 N Purchase One Leaf Vacuum ‐ ‐ 150.0 75.0 ‐ ‐ ‐ ‐ ‐Solid Waste Total ‐ ‐ 150.0 75.0 ‐ ‐ ‐ ‐ ‐
TransitD‐165 Matching Funds for Transit Capital Improvement Grants 94.7 ‐ 50.0 50.0 80.0 80.0 80.0 80.0 400.0Transit Total 94.7 ‐ 50.0 50.0 80.0 80.0 80.0 80.0 400.0
Transportation & Public WorksD‐167 Signal Replacement 153.5 200.0 460.0 75.0 620.0 829.0 1,058.0 1,058.0 5,287.5D‐171 Roadway Safety Devices Life Cycle Replacement 85.5 130.0 200.0 150.0 270.0 340.0 488.0 580.0 2,900.0D‐172 Upgrade Overhead Street Name Signs 25.4 150.0 312.0 75.0 406.0 500.0 550.0 550.0 3,300.0D‐174 Pavement Maintenance Program 198.4 ‐ 700.0 700.0 1,400.0 3,085.0 3,208.0 4,820.0 41,347.0D‐175 Bridge Improvement & Replacement Program 329.1 50.0 50.0 50.0 50.0 50.0 50.0 50.0 250.0Transportation & Public Works Total 791.8 530.0 1,722.0 1,050.0 2,746.0 4,804.0 5,354.0 7,058.0 53,084.5
Current Services Total 3,919.2 2,060.2 20,982.2 5,254.0 20,893.8 13,954.0 15,608.2 21,183.6 160,995.4
Capital Summary by Fund FY22 Budget D-6

Capital Improvement Plan Forecast
General Capital Projects Fund
FY20
Year End
Balance
FY21
Budget
FY22
Request
FY22
Approved
FY23
Proposed
FY24
Proposed
FY25
Proposed
FY26
Proposed
FY27‐31
Proposed
Additions & ImprovementsCentral ServicesD‐35 Renovations/Space Allocation Plan 393.8 ‐ 60.0 ‐ 30.0 30.0 30.0 30.0 150.0D‐36 N Urban Forestry Crew ‐ ‐ ‐ ‐ ‐ 110.0 110.0 115.0 115.0D‐40 Downtown Enhancement Project 114.8 60.0 60.0 60.0 60.0 60.0 60.0 60.0 300.0D‐41 N Additional Rural Roadside Mowing Crew ‐ ‐ ‐ ‐ 70.0 70.0 80.0 80.0 ‐Central Services Total 508.5 60.0 120.0 60.0 160.0 270.0 280.0 285.0 565.0
Clerk of CourtsD‐44 N Deed Indexing (years 1970‐1983) ‐ ‐ 346.5 ‐ ‐ ‐ ‐ ‐ ‐Clerk of Courts Total ‐ ‐ 346.5 ‐ ‐ ‐ ‐ ‐ ‐
Fire & Emergency ServicesD‐51 N Renovate and Expand Fire Training Center ‐ ‐ 2,724.0 ‐ 1,391.0 ‐ ‐ ‐ ‐D‐52 N Diversity and Workforce Development Project ‐ ‐ 103.4 ‐ 58.4 58.4 12.0 12.0 110.0D‐53 N Construct Emergency Operations Center ‐ ‐ 710.5 ‐ 355.3 364.3 ‐ ‐ ‐Fire & Emergency Services Total ‐ ‐ 3,537.9 ‐ 1,804.7 422.7 12.0 12.0 110.0
Leisure ServicesD‐73 Trails & Open Spaces Compact Track Loader Equipment ‐ ‐ ‐ ‐ ‐ ‐ ‐ 35.0 ‐D‐74 N New Athens Creative Theatre Facility ‐ ‐ ‐ ‐ ‐ ‐ ‐ 2,500.0 10,055.0D‐75 Portable Soccer Pitch System ‐ ‐ ‐ ‐ ‐ ‐ ‐ ‐ 35.0D‐76 N East Athens Community Center‐Space Modernization ‐ ‐ ‐ ‐ ‐ ‐ ‐ ‐ 7,000.0D‐77 N Lay Park Community Center‐Space Modernization ‐ ‐ ‐ ‐ ‐ ‐ ‐ ‐ 7,000.0Leisure Services Total ‐ ‐ ‐ ‐ ‐ ‐ ‐ 2,535.0 24,090.0
Manger's Office ‐ InclusionD‐83 N Walk of Remembrance ‐ ‐ ‐ 50.0 ‐ ‐ ‐ ‐ ‐Manger's Office ‐ Inclusion Total ‐ ‐ ‐ 50.0 ‐ ‐ ‐ ‐ ‐
Manager's Office ‐ SPLOSTD‐87 N TSPLOST 2023 Planning ‐ ‐ 175.0 100.0 ‐ ‐ ‐ ‐ ‐Manager's Office ‐ SPLOST Total ‐ ‐ 175.0 100.0 ‐ ‐ ‐ ‐ ‐
Capital Summary by Fund
FY22 Budget D-7

Capital Improvement Plan Forecast
General Capital Projects Fund
FY20
Year End
Balance
FY21
Budget
FY22
Request
FY22
Approved
FY23
Proposed
FY24
Proposed
FY25
Proposed
FY26
Proposed
FY27‐31
Proposed
Manager's Office ‐ Sustainability OfficeD‐88 Natural Area Rehabilitation Program ‐ ‐ ‐ ‐ ‐ ‐ 175.0 175.0 600.0D‐89 Solar and Energy Program ‐ ‐ ‐ ‐ ‐ ‐ ‐ 150.0 500.0D‐90 Energy Planning ‐ Fleet Electrification, Fuel Reduction, and Climat 30.0 ‐ ‐ ‐ ‐ ‐ 100.0 100.0 2,900.0Manager's Office ‐ Sustainability Office Total 30.0 ‐ ‐ ‐ ‐ ‐ 275.0 425.0 4,000.0
Other General AdministrationD‐91 Public Art Program 40.9 25.0 25.0 25.0 25.0 25.0 25.0 25.0 125.0Other General Administration Total 40.9 25.0 25.0 25.0 25.0 25.0 25.0 25.0 125.0
Planning & ZoningD‐94 N Permitting Software Equipment ‐ ‐ ‐ ‐ 50.0 ‐ ‐ ‐ ‐D‐95 Comprehensive Plan Five/Ten Year Update ‐ ‐ ‐ ‐ 50.0 ‐ ‐ ‐ 300.0Planning & Zoning Total ‐ ‐ ‐ ‐ 100.0 ‐ ‐ ‐ 300.0
Police ServicesD‐99 N 15 Additional Police Vehicles for Patrol Operations ‐ ‐ 228.0 ‐ 228.0 228.0 ‐ ‐ 715.0D‐100 N Additional Police Vehicles (25) ‐ ‐ 375.0 ‐ 375.0 375.0 ‐ ‐ 1,180.0D‐109 N Mental Health Co‐Responder Team Vehicle ‐ ‐ 43.0 43.0 ‐ ‐ ‐ ‐ 45.0D‐112 Emergency Medical Dispatch (EMD) Program ‐ ‐ ‐ ‐ 100.0 ‐ ‐ ‐ ‐Police Total ‐ ‐ 646.0 43.0 703.0 603.0 ‐ ‐ 1,940.0
SheriffD‐136 N Purchase Body Security Scanning System ‐ ‐ 138.0 ‐ ‐ ‐ ‐ ‐ 138.0Sheriff Total ‐ ‐ 138.0 ‐ ‐ ‐ ‐ ‐ 138.0
Solid WasteD‐164 N Dunlap & Pittard Environmental Study ‐ ‐ ‐ 50.0 ‐ ‐ ‐ ‐ ‐Solid Waste Total ‐ ‐ ‐ 50.0 ‐ ‐ ‐ ‐ ‐
TransitD‐166 Update Transit Plans and Transit Studies ‐ ‐ 30.0 30.0 ‐ ‐ ‐ ‐ 150.0Transit Total ‐ ‐ 30.0 30.0 ‐ ‐ ‐ ‐ 150.0
Capital Summary by Fund FY22 Budget D-8

Capital Improvement Plan Forecast
General Capital Projects Fund
FY20
Year End
Balance
FY21
Budget
FY22
Request
FY22
Approved
FY23
Proposed
FY24
Proposed
FY25
Proposed
FY26
Proposed
FY27‐31
Proposed
Transportation & Public WorksD‐168 Expand Fiber Optic Cable Communications System 40.3 ‐ 60.0 ‐ 30.0 30.0 40.0 40.0 200.0D‐169 Traffic Data Collection 16.4 30.0 30.0 ‐ 30.0 30.0 30.0 30.0 150.0D‐170 Sidewalk and Other Improvements 52.1 ‐ 80.0 ‐ 40.0 40.0 40.0 40.0 200.0D‐173 Local Road Improvement Projects 177.3 ‐ 178.0 ‐ 100.0 125.0 125.0 130.0 650.0D‐177 Pedestrian Safety and Traffic Calming Improvements 114.6 ‐ ‐ ‐ ‐ ‐ ‐ 40.0 200.0D‐178 Bicycle Transportation Improvements ‐ ‐ ‐ ‐ ‐ ‐ ‐ ‐ 1,000.0D‐179 Streetlight Capital ‐ ‐ ‐ 19.0 ‐ ‐ ‐ ‐ ‐D‐180 Neighborhood Traffic ‐ ‐ ‐ 20.0 ‐ ‐ ‐ ‐ ‐Transportation & Public Works Total 400.8 30.0 348.0 39.0 200.0 225.0 235.0 280.0 2,400.0
Additions and Improvements Total 980.3 115.0 5,366.4 397.0 2,992.7 1,545.7 827.0 3,562.0 33,818.0
General Capital Projects Fund Total 4,899.5 2,175.2 26,348.6 5,651.0 23,886.5 15,499.6 16,435.2 24,745.6 194,813.4
Capital Summary by Fund
FY22 Budget D-9

Capital Improvement Plan Forecast
Economic Development Fund
FY20
Year End
Balance
FY21
Budget
FY22
Request
FY22
Approved
FY23
Proposed
FY24
Proposed
FY25
Proposed
FY26
Proposed
FY27‐31
Proposed
Sources:Beginning Fund Balance 49.3 49.3 49.3 49.3 49.3 49.3 49.3Transfers from General Fund 225.0 ‐ 225.0 225.0 225.0 225.0 1,125.0Total Sources 274.3 49.3 274.3 274.3 274.3 274.3 1,174.3
Uses:Current Services Projects Listed Below ‐ ‐ ‐ ‐ ‐ ‐ ‐ ‐ ‐Additions & Improvements Projects Listed Below 837.6 225.0 225.0 ‐ 225.0 225.0 225.0 225.0 1,125.0Total Uses 837.6 225.0 225.0 ‐ 225.0 225.0 225.0 225.0 1,125.0
Year End Economic Development Fund Reserve 49.3 49.3 49.3 49.3 49.3 49.3 49.3
Additions & ImprovementsOther General AdministrationD‐92 Economic Development Capital Program 837.6 225.0 225.0 ‐ 225.0 225.0 225.0 225.0 1,125.0Other General Administration Total 837.6 225.0 225.0 ‐ 225.0 225.0 225.0 225.0 1,125.0
Additions and Improvements Total 837.6 225.0 225.0 ‐ 225.0 225.0 225.0 225.0 1,125.0
Economic Development Fund Total 837.6 225.0 225.0 ‐ 225.0 225.0 225.0 225.0 1,125.0
Capital Summary by Fund FY22 Budget D-10

Capital Improvement Plan Forecast
Fleet Management Fund
FY20
Year End
Balance
FY21
Budget
FY22
Request
FY22
Approved
FY23
Proposed
FY24
Proposed
FY25
Proposed
FY26
Proposed
FY27‐31
Proposed
Sources:Beginning Unrestricted Net Position (Estimate) 76.7 76.7 81.7 66.7 51.7 36.7 21.7Current Year Operating Revenues 15.0 15.0 15.0 15.0 15.0 15.0 75.0Total Sources 91.7 91.7 96.7 81.7 66.7 51.7 96.7
Uses:Current Services Projects Listed Below 10.7 10.0 10.0 10.0 30.0 30.0 30.0 30.0 150.0Additions & Improvements Projects Listed Below ‐ ‐ ‐ ‐ ‐ ‐ ‐ ‐ ‐Total Uses 10.7 10.0 10.0 10.0 30.0 30.0 30.0 30.0 150.0
Year End Fleet Management Fund Unrestricted Net Position 81.7 81.7 66.7 51.7 36.7 21.7 (53.3)
Current ServicesCentral ServicesD‐28 Fleet Management Shop Equipment Life Cycle Replacement 10.0 10.0 10.0 10.0 10.0 10.0 10.0 10.0 50.0D‐32 Upgrade Fuel Sites 0.7 ‐ ‐ ‐ 20.0 20.0 20.0 20.0 100.0
Current Services Total 10.7 10.0 10.0 10.0 30.0 30.0 30.0 30.0 150.0
Fleet Management Fund Total 10.7 10.0 10.0 10.0 30.0 30.0 30.0 30.0 150.0
Capital Summary by Fund
FY22 Budget D-11
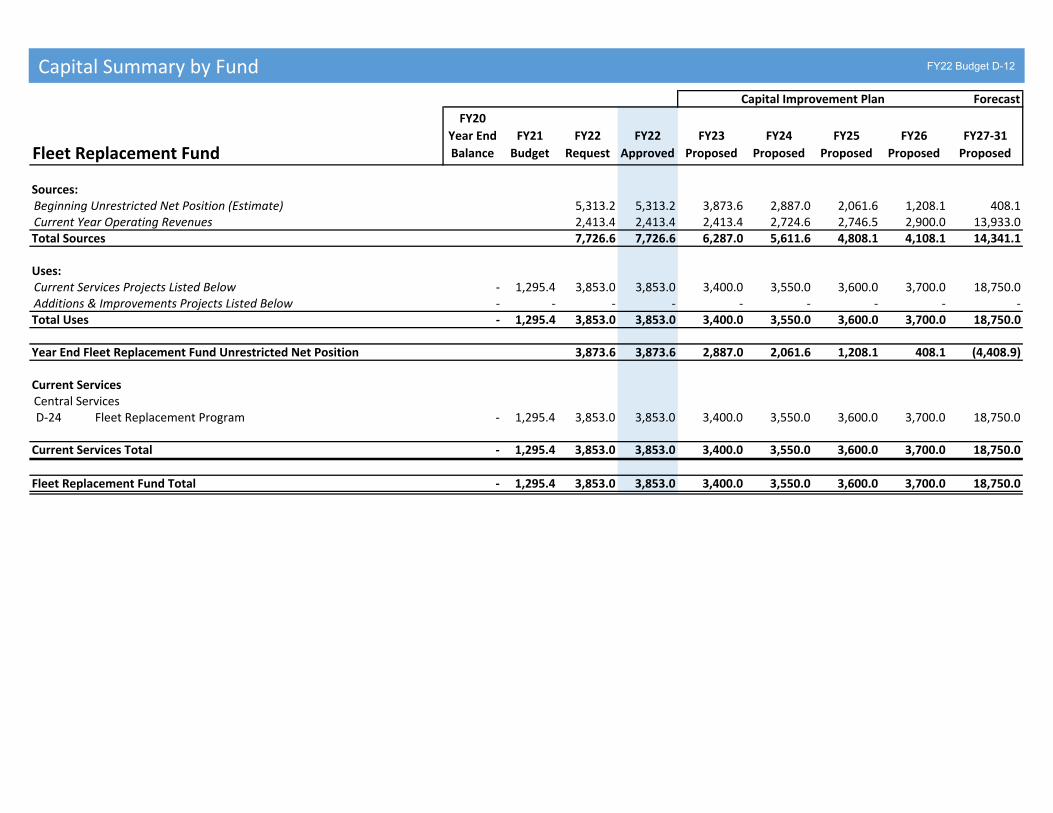
Capital Improvement Plan Forecast
Fleet Replacement Fund
FY20
Year End
Balance
FY21
Budget
FY22
Request
FY22
Approved
FY23
Proposed
FY24
Proposed
FY25
Proposed
FY26
Proposed
FY27‐31
Proposed
Sources:Beginning Unrestricted Net Position (Estimate) 5,313.2 5,313.2 3,873.6 2,887.0 2,061.6 1,208.1 408.1Current Year Operating Revenues 2,413.4 2,413.4 2,413.4 2,724.6 2,746.5 2,900.0 13,933.0Total Sources 7,726.6 7,726.6 6,287.0 5,611.6 4,808.1 4,108.1 14,341.1
Uses:Current Services Projects Listed Below ‐ 1,295.4 3,853.0 3,853.0 3,400.0 3,550.0 3,600.0 3,700.0 18,750.0Additions & Improvements Projects Listed Below ‐ ‐ ‐ ‐ ‐ ‐ ‐ ‐ ‐Total Uses ‐ 1,295.4 3,853.0 3,853.0 3,400.0 3,550.0 3,600.0 3,700.0 18,750.0
Year End Fleet Replacement Fund Unrestricted Net Position 3,873.6 3,873.6 2,887.0 2,061.6 1,208.1 408.1 (4,408.9)
Current ServicesCentral ServicesD‐24 Fleet Replacement Program ‐ 1,295.4 3,853.0 3,853.0 3,400.0 3,550.0 3,600.0 3,700.0 18,750.0
Current Services Total ‐ 1,295.4 3,853.0 3,853.0 3,400.0 3,550.0 3,600.0 3,700.0 18,750.0
Fleet Replacement Fund Total ‐ 1,295.4 3,853.0 3,853.0 3,400.0 3,550.0 3,600.0 3,700.0 18,750.0
Capital Summary by Fund FY22 Budget D-12

Capital Improvement Plan Forecast
Hotel/Motel Fund
FY20
Year End
Balance
FY21
Budget
FY22
Request
FY22
Approved
FY23
Proposed
FY24
Proposed
FY25
Proposed
FY26
Proposed
FY27‐31
Proposed
Sources:Beginning Fund Balance 382.8 382.8 392.8 377.8 362.8 347.8 332.8Current Year Operating Revenue 40.0 40.0 40.0 40.0 40.0 40.0 200.0Total Sources 422.8 422.8 432.8 417.8 402.8 387.8 532.8
Uses:Current Services Projects Listed Below 14.5 40.0 55.0 30.0 55.0 55.0 55.0 55.0 275.0Additions & Improvements Projects Listed Below ‐ ‐ ‐ ‐ ‐ ‐ ‐ ‐ ‐Total Uses 14.5 40.0 55.0 30.0 55.0 55.0 55.0 55.0 275.0
Year End Hotel/Motel Fund Ending Balance 367.8 392.8 377.8 362.8 347.8 332.8 257.8
Current ServicesCentral ServicesD‐30 Landscape & Community Tree Program ‐ ‐ 15.0 ‐ 15.0 15.0 15.0 15.0 75.0D‐39 Community Events Program 14.5 40.0 40.0 30.0 40.0 40.0 40.0 40.0 200.0
Current Services Total 14.5 40.0 55.0 30.0 55.0 55.0 55.0 55.0 275.0
Hotel/Motel Fund Total 14.5 40.0 55.0 30.0 55.0 55.0 55.0 55.0 275.0
Capital Summary by Fund
FY22 Budget D-13

Capital Improvement Plan Forecast
Internal Support Fund
FY20
Year End
Balance
FY21
Budget
FY22
Request
FY22
Approved
FY23
Proposed
FY24
Proposed
FY25
Proposed
FY26
Proposed
FY27‐31
Proposed
Sources:Beginning Unrestricted Net Position (Estimate) 451.0 451.0 434.0 417.0 400.0 393.0 386.0Current Year Operating Revenues 40.0 40.0 40.0 40.0 50.0 50.0 250.0Total Sources 491.0 491.0 474.0 457.0 450.0 443.0 636.0
Uses:Current Services Projects Listed Below 139.7 57.0 57.0 57.0 57.0 57.0 57.0 57.0 237.4Additions & Improvements Projects Listed Below ‐ ‐ ‐ ‐ ‐ ‐ ‐ ‐ ‐Total Uses 139.7 57.0 57.0 57.0 57.0 57.0 57.0 57.0 237.4
Year End Internal Support Fund Unrestricted Net Position 434.0 434.0 417.0 400.0 393.0 386.0 398.6
Current ServicesCentral ServicesD‐27 Mobile Communications Van Equipment Replacement ‐ 17.0 17.0 17.0 17.0 17.0 17.0 17.0 37.4D‐37 Replace Internal Support Equipment 84.4 15.0 15.0 15.0 15.0 15.0 15.0 15.0 75.0D‐42 Telephone System Life Cycle Replacement 55.3 25.0 25.0 25.0 25.0 25.0 25.0 25.0 125.0
Current Services Total 139.7 57.0 57.0 57.0 57.0 57.0 57.0 57.0 237.4
Internal Support Fund Total 139.7 57.0 57.0 57.0 57.0 57.0 57.0 57.0 237.4
Capital Summary by Fund FY22 Budget D-14

Capital Improvement Plan Forecast
Landfill Fund
FY20
Year End
Balance
FY21
Budget
FY22
Request
FY22
Approved
FY23
Proposed
FY24
Proposed
FY25
Proposed
FY26
Proposed
FY27‐31
Proposed
Sources:Beginning Unrestricted Net Position (Estimate) 2,005.4 2,005.4 917.4 (17.6) (717.6) (1,041.6) (915.6)Current Year Operating Revenues 450.0 450.0 450.0 450.0 450.0 450.0 2,250.0Landfill Closure Revenue ‐ ‐ ‐ ‐ ‐ ‐ 2,500.0Total Sources 2,455.4 2,455.4 1,367.4 432.4 (267.6) (591.6) 3,834.4
Uses:Current Services Projects Listed Below 189.5 728.0 1,538.0 1,538.0 1,385.0 1,150.0 774.0 324.0 5,450.0Additions & Improvements Projects Listed Below ‐ ‐ ‐ ‐ ‐ ‐ ‐ ‐ ‐Total Uses 189.5 728.0 1,538.0 1,538.0 1,385.0 1,150.0 774.0 324.0 5,450.0
Year End Landfill Fund Unrestricted Net Position 917.4 917.4 (17.6) (717.6) (1,041.6) (915.6) (1,615.6)
Current ServicesSolid WasteD‐141 Replace Trash Compactor ‐ ‐ 450.0 450.0 450.0 450.0 450.0 ‐ 1,800.0D‐142 Belt Replacements for RMPF 6.9 67.0 67.0 67.0 ‐ ‐ ‐ ‐ ‐D‐143 Replacement Roll‐Off Container Truck 184.4 70.0 70.0 70.0 70.0 ‐ ‐ ‐ 210.0D‐144 Replace Track Excavator ‐ 90.0 90.0 90.0 90.0 ‐ ‐ ‐ ‐D‐145 Replace Bulldozer ‐ 140.0 140.0 140.0 140.0 140.0 140.0 140.0 280.0D‐146 N Replace Loaders (Compost Operations) ‐ ‐ 75.0 75.0 75.0 75.0 ‐ ‐ ‐D‐147 Replace Glass Crusher in RMPF ‐ 100.0 120.0 120.0 ‐ ‐ ‐ ‐ ‐D‐148 N Purchase Replacement Road Tractor ‐ ‐ 67.0 67.0 67.0 67.0 ‐ ‐ ‐D‐149 Replace Track Loader ‐ ‐ 167.0 167.0 167.0 167.0 ‐ ‐ ‐D‐150 Replace OCC Decks ‐ ‐ 60.0 60.0 60.0 ‐ ‐ ‐ ‐D‐151 N Replace Two Kubota Tractors ‐ ‐ 34.0 34.0 68.0 68.0 34.0 ‐ ‐D‐152 N Replace Walking Floor Trailer (1986) ‐ ‐ 33.0 33.0 33.0 33.0 ‐ ‐ ‐D‐153 N Replace RMPF Tip Floors ‐ ‐ 65.0 65.0 65.0 ‐ ‐ ‐ ‐D‐154 N Landfill Well Construction ‐ ‐ 100.0 100.0 100.0 100.0 100.0 ‐ ‐D‐155 Replace Dump Truck (25 yard articulating) (1.8) 134.0 ‐ ‐ ‐ ‐ ‐ 134.0 400.0D‐156 Closure of Landfill‐ Phase 1 & 2 Areas ‐ ‐ ‐ ‐ ‐ ‐ ‐ ‐ 2,500.0D‐157 Replace Windrow Turner in Compost Operations ‐ ‐ ‐ ‐ ‐ 50.0 50.0 50.0 ‐D‐158 Replace Trommel Screen in Compost Operations ‐ 67.0 ‐ ‐ ‐ ‐ ‐ ‐ 200.0D‐159 Purchase Skid Steer (Compost Loading) ‐ 60.0 ‐ ‐ ‐ ‐ ‐ ‐ 60.0
Current Services Total 189.5 728.0 1,538.0 1,538.0 1,385.0 1,150.0 774.0 324.0 5,450.0
Landfill Fund Total 189.5 728.0 1,538.0 1,538.0 1,385.0 1,150.0 774.0 324.0 5,450.0
Capital Summary by Fund
FY22 Budget D-15

Capital Improvement Plan Forecast
Solid Waste Fund
FY20
Year End
Balance
FY21
Budget
FY22
Request
FY22
Approved
FY23
Proposed
FY24
Proposed
FY25
Proposed
FY26
Proposed
FY27‐31
Proposed
Sources:Beginning Unrestricted Net Position (Estimate) 750.0 750.0 615.0 530.0 443.0 356.0 369.0Current Year Operating Revenues 400.0 400.0 450.0 450.0 450.0 450.0 2,250.0Total Sources 1,150.0 1,150.0 1,065.0 980.0 893.0 806.0 2,619.0
Uses:Current Services Projects Listed Below 535.0 535.0 535.0 537.0 537.0 437.0 1,338.0Additions & Improvements Projects Listed Below ‐ ‐ ‐ ‐ ‐ ‐ ‐Total Uses 535.0 535.0 535.0 537.0 537.0 437.0 1,338.0
Year End Solid Waste Fund Unrestricted Net Position 615.0 615.0 530.0 443.0 356.0 369.0 1,281.0
Current ServicesSolid WasteD‐160 Replace Commercial Dumpster Collection Front‐end Loader (5.3) 90.0 90.0 90.0 90.0 92.0 92.0 92.0 276.0D‐161 Replace Mini‐Packer Trucks (76.1) 135.0 135.0 135.0 135.0 135.0 135.0 35.0 442.0D‐162 Replace Automated Refuse/Recycling Truck 1,280.0 310.0 310.0 310.0 310.0 310.0 310.0 310.0 620.0
Current Services Total 1,198.6 535.0 535.0 535.0 535.0 537.0 537.0 437.0 1,338.0
Solid Waste Fund Total 1,198.6 535.0 535.0 535.0 535.0 537.0 537.0 437.0 1,338.0
Capital Summary by Fund FY22 Budget D-16
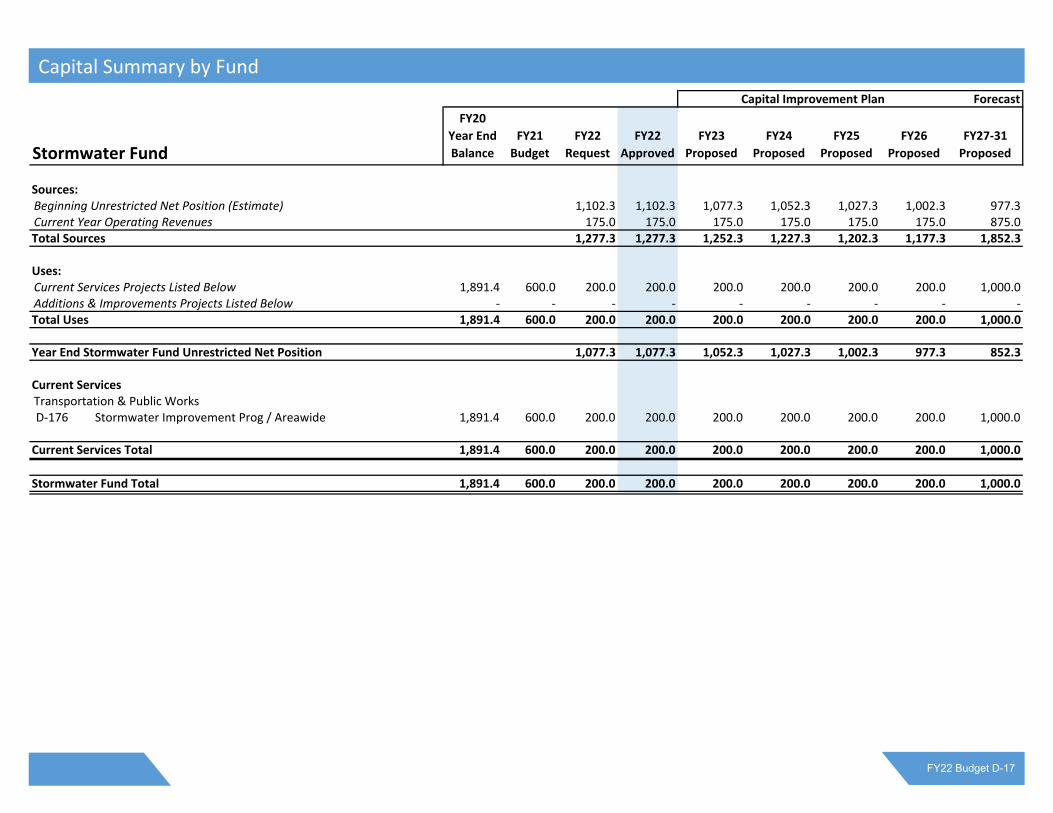
Capital Improvement Plan Forecast
Stormwater Fund
FY20
Year End
Balance
FY21
Budget
FY22
Request
FY22
Approved
FY23
Proposed
FY24
Proposed
FY25
Proposed
FY26
Proposed
FY27‐31
Proposed
Sources:Beginning Unrestricted Net Position (Estimate) 1,102.3 1,102.3 1,077.3 1,052.3 1,027.3 1,002.3 977.3Current Year Operating Revenues 175.0 175.0 175.0 175.0 175.0 175.0 875.0Total Sources 1,277.3 1,277.3 1,252.3 1,227.3 1,202.3 1,177.3 1,852.3
Uses:Current Services Projects Listed Below 1,891.4 600.0 200.0 200.0 200.0 200.0 200.0 200.0 1,000.0Additions & Improvements Projects Listed Below ‐ ‐ ‐ ‐ ‐ ‐ ‐ ‐ ‐Total Uses 1,891.4 600.0 200.0 200.0 200.0 200.0 200.0 200.0 1,000.0
Year End Stormwater Fund Unrestricted Net Position 1,077.3 1,077.3 1,052.3 1,027.3 1,002.3 977.3 852.3
Current ServicesTransportation & Public WorksD‐176 Stormwater Improvement Prog / Areawide 1,891.4 600.0 200.0 200.0 200.0 200.0 200.0 200.0 1,000.0
Current Services Total 1,891.4 600.0 200.0 200.0 200.0 200.0 200.0 200.0 1,000.0
Stormwater Fund Total 1,891.4 600.0 200.0 200.0 200.0 200.0 200.0 200.0 1,000.0
Capital Summary by Fund
FY22 Budget D-17

Capital Improvement Plan Forecast
Water & Sewer Fund
FY20
Year End
Balance
FY21
Budget
FY22
Request
FY22
Approved
FY23
Proposed
FY24
Proposed
FY25
Proposed
FY26
Proposed
FY27‐31
Proposed
Sources:Beginning Unrestricted Net Position (Estimate) 34,968.2 34,968.2 18,008.2 12,394.1 1,510.1 730.5 (3,152.2)Current Year Operating Revenues 17,000.0 17,000.0 18,000.0 19,000.0 20,000.0 21,000.0 120,000.0Total Sources 51,968.2 51,968.2 36,008.2 31,394.1 21,510.1 21,730.5 116,847.8
Uses:Current Services Projects Listed Below 27,060.0 27,060.0 18,564.1 25,134.0 19,629.6 24,232.7 144,872.4Additions & Improvements Projects Listed Below 6,900.0 6,900.0 5,050.0 4,750.0 1,150.0 650.0 4,750.0Total Uses 33,960.0 33,960.0 23,614.1 29,884.0 20,779.6 24,882.7 149,622.4
Year End Water & Sewer Fund Unrestricted Net Position 18,008.2 18,008.2 12,394.1 1,510.1 730.5 (3,152.2) (32,774.6)
Current ServicesPublic UtilitiesD‐114 W&S Lines ‐ Additions and Improvements ‐ 955.0 975.0 975.0 994.5 1,010.0 1,030.2 1,050.8 5,600.0D‐115 Meter and Water/Sewer Stub Additions ‐ 501.6 510.0 510.0 520.0 530.0 540.6 551.5 2,927.0D‐116 Donated W&S Additions Management ‐ 226.8 230.0 230.0 234.6 239.0 243.8 249.0 1,320.0D‐117 Watershed Protection Long‐Term Monitoring 115.2 100.0 100.0 100.0 100.0 100.0 100.0 100.0 575.0D‐118 Replace Water Meters 5,154.3 365.0 365.0 365.0 365.0 365.0 365.0 365.0 1,825.0D‐119 Rehabilitate and Replace Sewers 37,605.1 5,000.0 7,500.0 7,500.0 7,500.0 10,500.0 7,500.0 6,000.0 30,000.0D‐121 Replace and Upgrade Facilities and Equipment 10,533.9 3,300.0 3,400.0 3,400.0 3,450.0 3,300.0 3,450.0 3,516.4 18,625.4D‐122 Rehabilitate and Replace Water Lines 2,443.4 3,000.0 3,000.0 3,000.0 3,000.0 3,000.0 3,000.0 3,000.0 15,000.0D‐123 Relocate Water & Sewer Lines for DOT Projects 517.8 2,000.0 100.0 100.0 100.0 100.0 100.0 100.0 500.0D‐124 Manage and Reuse Residual Solids 2,248.7 6,380.0 4,780.0 4,780.0 300.0 300.0 300.0 300.0 25,000.0D‐125 Improve Water Supply Reliability 9,004.7 4,479.0 6,000.0 6,000.0 2,000.0 3,000.0 3,000.0 9,000.0 35,000.0D‐127 Investigate and Install Alternative Energy Generation 110.5 50.0 100.0 100.0 ‐ 2,690.0 ‐ ‐ 500.0D‐131 Renovate/Expand W&S/Meter Mgt Construction Facility 1,770.8 400.0 ‐ ‐ ‐ ‐ ‐ ‐ 8,000.0
Current Services Total 69,504.5 26,757.4 27,060.0 27,060.0 18,564.1 25,134.0 19,629.6 24,232.7 144,872.4
Capital Summary by Fund FY22 Budget D-18

Capital Improvement Plan Forecast
Water & Sewer Fund
FY20
Year End
Balance
FY21
Budget
FY22
Request
FY22
Approved
FY23
Proposed
FY24
Proposed
FY25
Proposed
FY26
Proposed
FY27‐31
Proposed
Additions & ImprovementsPublic UtilitiesD‐120 Extend Wastewater Collection System 4,984.5 100.0 100.0 100.0 100.0 100.0 100.0 100.0 2,000.0D‐126 W&S Contribution to Economic Development 771.0 100.0 100.0 100.0 100.0 100.0 100.0 100.0 500.0D‐128 WRF Phosphorous Improvements 8,129.1 9,000.0 5,500.0 5,500.0 2,000.0 2,000.0 500.0 ‐ ‐D‐129 Water & Sewer Additions and Improvements 404.7 200.0 200.0 200.0 200.0 200.0 200.0 200.0 1,000.0D‐130 Downtown Infrastructure Improvements 1,231.9 300.0 250.0 250.0 250.0 250.0 250.0 250.0 1,250.0D‐132 Water Transmission Grid Improvements 2,439.5 ‐ 650.0 650.0 2,100.0 2,100.0 ‐ ‐ ‐D‐133 N Utility Billing System ‐ ‐ 100.0 100.0 300.0 ‐ ‐ ‐ ‐
Additions and Improvements Total 17,960.6 9,700.0 6,900.0 6,900.0 5,050.0 4,750.0 1,150.0 650.0 4,750.0
Water & Sewer Fund Total 87,465.1 36,457.4 33,960.0 33,960.0 23,614.1 29,884.0 20,779.6 24,882.7 149,622.4
Capital Summary by Fund
FY22 Budget D-19

Airport Department Priority
Matching Funds for Airport Capital Improvement Grants 1 of 3CS, Transportation Project Timeline: Ongoing
Project Description
Project Justification
Impact on Annual Operating Expenses FY22 FY23 FY24 FY25 FY26 FY27‐31 Annual
‐ ‐ ‐ ‐ ‐ ‐ ‐
Financial Plan Project ID: c0334
FY20 FY21 FY22 FY23 FY24 FY25 FY26 FY27‐31 Total
End Bal. Budget Approved Proposed Proposed Proposed Proposed Proposed Proposed
SOURCES
General Capital Fund 244,123 ‐ ‐ 1,062,750 90,250 218,000 86,250 1,825,000 3,282,250
TOTAL SOURCES 244,123 ‐ ‐ 1,062,750 90,250 218,000 86,250 1,825,000 3,282,250
USES
Capital ‐ Const. 244,123 ‐ ‐ 1,062,750 90,250 218,000 86,250 1,825,000 3,282,250
TOTAL USES 244,123 ‐ ‐ 1,062,750 90,250 218,000 86,250 1,825,000 3,282,250
This project provides matching funds for approved Airport Improvement Projects (AIP) and other grants funded by the Federal Aviation Administration (FAA) and/or
the Georgia Department of Transportation (GDOT).
This project is in keeping with the airport's FAA capital improvement program and Airport Master Plan. Funding for Airport projects is contingent upon the FAA and
GDOT approving discretionary funding. Federally funded projects are awarded at a percentage of 90% Federal, 5% State and 5% Local matches. State funded
projects are awarded at a percentage of 75% State and 25% Local match.
No Impact.
Capital Detail by Department FY22 Budget D-20

Airport Department Priority
Maintain Airport Facilities and Equipment 2 of 3CS, Facilities Project Timeline: Ongoing
Project Description
Project Justification
Impact on Annual Operating Expenses FY22 FY23 FY24 FY25 FY26 FY27‐31 Annual
‐ ‐ ‐ ‐ ‐ ‐ ‐
Financial Plan Project ID: c0570
FY20 FY21 FY22 FY23 FY24 FY25 FY26 FY27‐31 Total
End Bal. Budget Approved Proposed Proposed Proposed Proposed Proposed Proposed
SOURCES
General Capital Fund 32,009 25,000 65,000 25,000 25,000 55,000 ‐ 315,000 485,000
Airport Ent Fund 6,575 ‐ ‐ ‐ ‐ ‐ ‐ ‐
TOTAL SOURCES 38,584 25,000 65,000 25,000 25,000 55,000 ‐ 315,000 485,000
USES
Capital ‐ Const. 38,584 25,000 65,000 25,000 25,000 55,000 ‐ 315,000 485,000
TOTAL USES 38,584 25,000 65,000 25,000 25,000 55,000 ‐ 315,000 485,000
Maintain airport facilities and repair and/or replace equipment.
Provide funding to maintain airport facilities such as painting hangars, replacement of furniture, replacement of roofs, replacement of flooring, and HVAC systems.
Replacement and repair of flightline equipment. This does not include any funding for buildings that may be maintained by the Facilities Management Division of the
Central Services Department.
No Impact.
Capital Detail by Department
FY22 Budget D-21

Airport Department Priority
Aircraft Rescue and Fire Fighting Proximity Suits & Gear and SCBA Tank and Breathing Apparatus 3 of 3CS, Equipment Project Timeline: FY22 to FY22
Project Description
Project Justification
Impact on Annual Operating Expenses FY22 FY23 FY24 FY25 FY26 FY27‐31 Annual
‐ ‐ ‐ ‐ ‐ ‐ ‐
New
Financial Plan Project ID: c0814
FY20 FY21 FY22 FY23 FY24 FY25 FY26 FY27‐31 Total
End Bal. Budget Approved Proposed Proposed Proposed Proposed Proposed Proposed
SOURCES
General Cap Proj Fund ‐ ‐ 21,500 ‐ ‐ ‐ ‐ ‐ 21,500
TOTAL SOURCES ‐ ‐ 21,500 ‐ ‐ ‐ ‐ ‐ 21,500
USES
Capital ‐ Machinery & Equip ‐ ‐ 21,500 ‐ ‐ ‐ ‐ ‐ 21,500
TOTAL USES ‐ ‐ 21,500 ‐ ‐ ‐ ‐ ‐ 21,500
This request is for the purchase of 5 Firefighting Helmets, 4 proximity ARFF jackets, 1 proximity ARFF pants, 3 pairs of gloves, 3 nomex hoods and 4 pairs of boots.
This request also includes 1 SCBA Tank and Breathing Apparatus. These items need to be replaced every 10 years are past the life cycle.
This equipment is mandated by the FAA and NFPA for use in an Aircraft Rescue & Fire Fighting operation. Fire support is an FAA Part 139 requirment for scheduled
service and certain charter operations on the airport.
No impact.
Capital Detail by Department FY22 Budget D-22

Central Services Department Priority
Facilities Life Cycle Maintenance Program 1 of 22CS, Facilities Project Timeline: Ongoing
Project Description
Project Justification
Impact on Annual Operating Expenses FY22 FY23 FY24 FY25 FY26 FY27‐31 Annual
(697,160) (301,359) (190,842) (294,275) (236,342) (952,252) (267,223)
Financial Plan Project ID: c0188
FY20 FY21 FY22 FY23 FY24 FY25 FY26 FY27‐31 Total
End Bal. Budget Approved Proposed Proposed Proposed Proposed Proposed Proposed
SOURCES
General Capital Fund 135,893 ‐ 1,262,756 3,013,590 1,908,423 2,942,755 2,363,413 9,522,523 21,013,460
TOTAL SOURCES 135,893 ‐ 1,262,756 3,013,590 1,908,423 2,942,755 2,363,413 9,522,523 21,013,460
USES
Capital ‐ Const. 135,893 ‐ 1,262,756 3,013,590 1,908,423 2,942,755 2,363,413 9,522,523 21,013,460
TOTAL USES 135,893 ‐ 1,262,756 3,013,590 1,908,423 2,942,755 2,363,413 9,522,523 21,013,460
The Facility Component Life Cycle Maintenance program is an annual plan to replace key facility components on buildings maintained by the Central Services
Department. The goal is to replace the items at or near the end of their normal life expectancy to minimize operating budget impacts caused by unexpected failures
of older equipment. The major components included in this program are roofs, HVAC equipment, exterior and interior painting, carpets and emergency generators.
A 3% inflation factor has been applied to out‐years. This program has not been funded since FY19.
This program is required to ensure that adequate funds are available to maintain facilities owned by ACCGov. Replacements covered under this program are
necessary to protect ACCGov's financial investment in their public facilities. Timely replacement of aging components extends the life expectancy of facilities and
creates safer, more productive work environments. Cost estimates were obtained from Facilities Management staff and through professional services. NOTE:
Funding requested in each year is based on projected needs of the life cycle program. Inadequate funding will result in emergency funding requests for equipment
that fails due to over‐extended lifetimes. With Mayor & Commission approval a portion of these funds is eilgible to be supplemented from SPLOST 2020.
Because funding has not been provided since FY19 we are
already incurring higher operating expenses and having to
divert facility maintenanct money into reinvestment.
Capital Detail by Department
FY22 Budget D-23

Central Services Department Priority
Fleet Replacement Program 2 of 22CS, Equipment Project Timeline: Ongoing
Project Description
Project Justification
Impact on Annual Operating Expenses FY22 FY23 FY24 FY25 FY26 FY27‐31 Annual
(50,000) (100,000) (200,000) (400,000) (800,000) (4,000,000) (555,000)
Financial Plan Project ID: N/A
FY20 FY21 FY22 FY23 FY24 FY25 FY26 FY27‐31 Total
End Bal. Budget Approved Proposed Proposed Proposed Proposed Proposed Proposed
SOURCES
Fleet Replacement Fund ‐ 1,295,400 3,853,000 3,400,000 3,550,000 3,600,000 3,700,000 18,750,000 36,853,000
TOTAL SOURCES ‐ 1,295,400 3,853,000 3,400,000 3,550,000 3,600,000 3,700,000 18,750,000 36,853,000
USES
Capital ‐ Vehicles ‐ 1,295,400 3,853,000 3,400,000 3,550,000 3,600,000 3,700,000 18,750,000 36,853,000
TOTAL USES ‐ 1,295,400 3,853,000 3,400,000 3,550,000 3,600,000 3,700,000 18,750,000 36,853,000
The Internal Service Fund Fleet Replacement Program is funded from the user departmental contributions. These expenditures are for the authorized replacement
of vehicles and equipment that have reached the end of their useful life. There are 764 vehicles and pieces of equipment in the Fleet Replacement Program. Specific
vehicle replacements are approved each year by the Manager.
Replacement of vehicles and equipment on a planned schedule reduces repair costs, downtime and provides for a constant funding strategy to meet the vehicle
needs of the user departments. This project is severly underfunded. Previous underfunding and the deferral of approximately $2.8 million dollars in FY20 and FY21
have resulted in a backlog of approximately $9 million dollars of vehicles eligible for replacement. With Mayor & Commission approval a portion of these funds is
eilgible to be supplemented from SPLOST 2020.
Repair expenses increase dramatically as these vehicles
exceed their target life. We have reached a point where some
vehicle repair costs exceed the value of the vehicle itsself.
Capital Detail by Department FY22 Budget D-24

Central Services Department Priority
800 MHz Subscriber Radio Life Cycle 3 of 22CS, Equipment Project Timeline: Ongoing
Project Description
Project Justification
Impact on Annual Operating Expenses FY22 FY23 FY24 FY25 FY26 FY27‐31 Annual
‐ ‐ ‐ ‐ (200,000) (1,000,000) (120,000)
Financial Plan Project ID: c0384
FY20 FY21 FY22 FY23 FY24 FY25 FY26 FY27‐31 Total
End Bal. Budget Approved Proposed Proposed Proposed Proposed Proposed Proposed
SOURCES
General Capital Fund 241,606 50,000 200,000 400,000 400,000 400,000 400,000 2,000,000 3,800,000
Internal Support Fund ‐ 50,000 ‐ ‐ ‐ ‐ ‐ ‐ ‐
TOTAL SOURCES 241,606 100,000 200,000 400,000 400,000 400,000 400,000 2,000,000 3,800,000
USES
Capital ‐ Machinery & Equip 241,606 100,000 200,000 400,000 400,000 400,000 400,000 2,000,000 3,800,000
TOTAL USES 241,606 100,000 200,000 400,000 400,000 400,000 400,000 2,000,000 3,800,000
This project accumulates funds for a life cycle replacement program for the 800 MHz subscriber (portable and mobile) radios purchased with SPLOST 2011 funds.
Over 1,000 radios were purchased through SPLOST 2011. The manufacturer indicates that these radios have a life expectancy of 5‐10 years. This proposal sets aside
funds for the subscriber radios and continues the life cycle process begun with the older radios. The average current replacement cost is approximately $4,000 per
radio. These funds may also be used to replace radios that are damaged or lost during use and the radios that are used to activate the tornado sirens, Greenway Call
Boxes, Fire Station Alerting, and other critical items.
As these subscriber radios age, they become both unreliable and expensive to repair. Staff believes that with good maintenance, a 12‐year life expectancy is
feasible. No inflation figures are applied in the belief that improved technology and competition will offset any inflationary increase. Funding will provide for the
replacement of the radios that fail due to age, cost of repairs, or other reasons.
Planned capital investment now will ensure that we avoid
increased operating costs as this equipment exceeds its
lifecycle.
Capital Detail by Department
FY22 Budget D-25

Central Services Department Priority
Landscaping Equipment Life Cycle Replacement 4 of 22CS, Equipment Project Timeline: Ongoing
Project Description
Project Justification
Impact on Annual Operating Expenses FY22 FY23 FY24 FY25 FY26 FY27‐31 Annual
‐ ‐ ‐ ‐ ‐ ‐ ‐
Financial Plan Project ID: c0090
FY20 FY21 FY22 FY23 FY24 FY25 FY26 FY27‐31 Total
End Bal. Budget Approved Proposed Proposed Proposed Proposed Proposed Proposed
SOURCES
General Capital Fund ‐ 75,000 75,000 139,500 132,500 132,500 132,500 660,000 1,272,000
TOTAL SOURCES ‐ 75,000 75,000 139,500 132,500 132,500 132,500 660,000 1,272,000
USES
Capital ‐ Machinery & Equip ‐ 75,000 75,000 139,500 132,500 132,500 132,500 660,000 1,272,000
TOTAL USES ‐ 75,000 75,000 139,500 132,500 132,500 132,500 660,000 1,272,000
Purchase replacement landscape maintenance equipment (mowers, chainsaws, ball field implements, etc.) used by the Landscape Management Division (LMD). This
capital project uses equipment expected useful life cycles as a basis for projecting annual replacement costs. Equipment is used for landscape services to Athens‐
Clarke County parks, public buildings, and rights‐of‐way. Replacement costs are based upon current government pricing.
The efficiency of landscape services is dependent upon functioning, reliable equipment. Budget projections established 5 years ago are now obsolete, equipment
pricing has increased as technology advances, and material costs have increased. Examples: gang mower used on ballfields budgeted at $13,000 for replacement now
cost $25,000; zero‐turn mowers budgeted at $8,000 for replacement now cost $11,000. The proposed change in FY23 accounts for the replacement of equipment
that was deployed to manage Greenway trails and restores equipment to life cycle planning that was removed during the last recession.
No Impact.
Capital Detail by Department FY22 Budget D-26

Central Services Department Priority
Mobile Communications Van Equipment Replacement 5 of 22CS, Equipment Project Timeline: FY21 to FY26
Project Description
Project Justification
Impact on Annual Operating Expenses FY22 FY23 FY24 FY25 FY26 FY27‐31 Annual
‐ ‐ ‐ ‐ ‐ ‐ ‐
Financial Plan Project ID: c0802
FY20 FY21 FY22 FY23 FY24 FY25 FY26 FY27‐31 Total
End. Bal. Budget Approved Proposed Proposed Proposed Proposed Proposed Proposed
SOURCES
Internal Support Fund ‐ 17,000 17,000 17,000 17,000 17,000 17,000 37,400 122,400
TOTAL SOURCES ‐ 17,000 17,000 17,000 17,000 17,000 17,000 37,400 122,400
USES
Capital ‐ Machinery & Equip ‐ 17,000 17,000 17,000 17,000 17,000 17,000 37,400 122,400
TOTAL USES ‐ 17,000 17,000 17,000 17,000 17,000 17,000 37,400 122,400
This project is to replace the Mobile Communications Vehicle (MCV) equipment and configure a new MCV. The MCV provides critical connectivity for Public Safety
during the University of Georgia football games affecting approximately 92,000 people. The project makes citizens safer by providing public safety connectivity in
times of crisis, search and rescue efforts, and other events where the safety of the public is paramount.
Safe and Prepared Community ‐ The Mobile Communications Vehicle (MCV) provides essential communications services. The ability to provide those services is vital
to continued interoperability operations and field support of public safety and government personnel. The MCV has become a critical first response unit for search
and rescue operations. When citizens go missing, the MCV is a first responder vehicle. The MCV is needed to continue what is a basic service for public safety. This is
a replacement project for the equipment and initial configuration. Fleet Management will purchase the base vehicle. Under the existing agreements, the University
of Georgia will offset approximately 30% of this cost through monthly radio user fees.
No impact on annual operating expenses are anticipated as
this is a replacement project.
Capital Detail by Department
FY22 Budget D-27

Central Services Department Priority
Fleet Management Shop Equipment Life Cycle Replacement 6 of 22CS, Equipment Project Timeline: Ongoing
Project Description
Project Justification
Impact on Annual Operating Expenses FY22 FY23 FY24 FY25 FY26 FY27‐31 Annual
‐ ‐ ‐ ‐ ‐ ‐ ‐
Financial Plan Project ID: c0790
FY20 FY21 FY22 FY23 FY24 FY25 FY26 FY27‐31 Total
End Bal. Budget Approved Proposed Proposed Proposed Proposed Proposed Proposed
SOURCES
Fleet Management Fund 10,000 10,000 10,000 10,000 10,000 10,000 10,000 50,000 100,000
TOTAL SOURCES 10,000 10,000 10,000 10,000 10,000 10,000 10,000 50,000 100,000
USES
Capital ‐ Machinery & Equip 10,000 10,000 10,000 10,000 10,000 10,000 10,000 50,000 100,000
TOTAL USES 10,000 10,000 10,000 10,000 10,000 10,000 10,000 50,000 100,000
This project will provide life cycle replacement funds for worn or obsolete equipment used in the two shop areas at Fleet Management's maintenance facility
(Vehicle Servicing & Repair, and Vehicle Replacement). This equipment is used for the outfitting, maintenance, and repair of all vehicles and equipment in the
ACCGov fleet that serves all ACCGov departments. Specifically, Fleet Management plans on purchasing a new, much needed forklift and rebuilding one of our brake
This project is needed to ensure that the equipment used by Fleet Management in support of the ACCGov fleet is functional and up‐to‐date. Otherwise, worn and
obsolete shop equipment will impact Fleet Managements service delivery requiring some vehicle and equipment repairs to be outsourced at a higher cost to the user
department.
No impact.
Capital Detail by Department FY22 Budget D-28

Central Services Department Priority
800 MHz Radio Infrastructure Replacement 7 of 22CS, Equipment Project Timeline: Ongoing
Project Description
Project Justification
Impact on Annual Operating Expenses FY22 FY23 FY24 FY25 FY26 FY27‐31 Annual
‐ ‐ ‐ ‐ ‐ ‐ ‐
Financial Plan Project ID: c0726
FY20 FY21 FY22 FY23 FY24 FY25 FY26 FY27‐31 Total
End Bal. Budget Approved Proposed Proposed Proposed Proposed Proposed Proposed
SOURCES
General Capital Fund 125,000 25,000 150,000 250,000 250,000 250,000 250,000 1,250,000 2,400,000
TOTAL SOURCES 125,000 25,000 150,000 250,000 250,000 250,000 250,000 1,250,000 2,400,000
USES
Capital ‐ Machinery & Equip 125,000 25,000 150,000 250,000 250,000 250,000 250,000 1,250,000 2,400,000
TOTAL USES 125,000 25,000 150,000 250,000 250,000 250,000 250,000 1,250,000 2,400,000
This project will establish a life cycle replacement program for the 800 MHz radio infrastructure and towers. According to radio vendors, the infrastructure of a radio
system has a life expectancy of 10‐20 years; this project assumes a 20‐year life span. This project sets aside money for the three towers and supporting equipment
to be replaced.
Radio vendors estimate their systems have a life expectancy of 20 years. This project creates an accumulating fund, beginning in FY17, to replace the towers and
future infrastructure on a 20‐year cycle. Based on the previous radio system, staff feels 20 years is the correct estimate through diligent maintenance, if parts remain
available. Estimated replacement costs total $6.2 million (Whitehall $3M; Vaughn Road $2M; Police $1M; American Tower $100k; UGA Tower $100k).
No Impact.
Capital Detail by Department
FY22 Budget D-29

Central Services Department Priority
Landscape & Community Tree Program 8 of 22CS, Facilities Project Timeline: Ongoing
Project Description
Project Justification
Impact on Annual Operating Expenses FY22 FY23 FY24 FY25 FY26 FY27‐31 Annual
‐ ‐ ‐ ‐ ‐ ‐ ‐
Financial Plan Project ID: c0182
FY20 FY21 FY22 FY23 FY24 FY25 FY26 FY27‐31 Total
End Bal. Budget Approved Proposed Proposed Proposed Proposed Proposed Proposed
SOURCES
General Capital Fund 626 ‐ ‐ 15,000 15,000 15,000 15,000 75,000 135,000
Hotel/Motel Spec Rev Fund ‐ ‐ ‐ 15,000 15,000 15,000 15,000 75,000 135,000
TOTAL SOURCES 626 ‐ ‐ 30,000 30,000 30,000 30,000 150,000 270,000
USES
Capital ‐ Const. 626 ‐ ‐ 30,000 30,000 30,000 30,000 150,000 270,000
TOTAL USES 626 ‐ ‐ 30,000 30,000 30,000 30,000 150,000 270,000
The purpose of this project is to provide or restore Athens‐Clarke County (ACCGov) landscape features that: (1) become unserviceable due to natural life‐span, (2)
are destroyed due to construction activities, (3) serve as enhancements to existing conditions, (4) provide a standard level of landscape quality to under‐funded
facility projects, or (5) serve as natural vegetative cover for undeveloped or passive public lands. Projects are located at ACCGov parks, rights‐of‐way,
buildings/facilities, and right‐of‐way stormwater bio‐retention facilities.
The Landscape Management Division annually renovates aging and over‐mature landscapes in order to reduce maintenance costs, maintain aesthetically pleasing
properties, and protect visitor health. This capital life cycle program stabilizes annual expenditures, preserves infrastructure assets, benefits citizens and staff and
improves asset life expectancy. Hotel/Motel funding will be used downtown and in areas focused on recreation & tourism.
No Impact.
Capital Detail by Department FY22 Budget D-30

Central Services Department Priority
Parking Lot Life Cycle Maintenance & Repair 9 of 22CS, Facilities Project Timeline: Ongoing
Project Description
Project Justification
Impact on Annual Operating Expenses FY22 FY23 FY24 FY25 FY26 FY27‐31 Annual
‐ ‐ ‐ ‐ ‐ ‐ ‐
Financial Plan Project ID: c0724
FY20 FY21 FY22 FY23 FY24 FY25 FY26 FY27‐31 Total
End Bal. Budget Approved Proposed Proposed Proposed Proposed Proposed Proposed
SOURCES
General Capital Fund 20,940 25,000 25,000 40,000 40,000 40,000 40,000 200,000 385,000
TOTAL SOURCES 20,940 25,000 25,000 40,000 40,000 40,000 40,000 200,000 385,000
USES
Capital ‐ Const. 20,940 25,000 25,000 40,000 40,000 40,000 40,000 200,000 385,000
TOTAL USES 20,940 25,000 25,000 40,000 40,000 40,000 40,000 200,000 385,000
The Parking Lot Life Cycle M&R Project will include maintenance and repairs to existing parking lots for ACCUG buildings. This may include installing new concrete,
asphalt, or seal coating. It will also include restriping parking lots as needed.
Work will need to be done in the near future at several parking lots due to the age of the material and the use of the parking lot. All ACCGov facilities should
properly represent the image of the Unified Government, especially the facilities that directly serve the public. A properly executed life cycle program will extend the
life of the existing parking lots, thereby minimizing future repair costs.
This project will reduce the dependence on operating budgets
to perform repairs due to the lack of maintenance.
Capital Detail by Department
FY22 Budget D-31

Central Services Department Priority
Upgrade Fuel Sites 10 of 22CS, Facilities Project Timeline: Ongoing
Project Description
Project Justification
Impact on Annual Operating Expenses FY22 FY23 FY24 FY25 FY26 FY27‐31 Annual
‐ ‐ ‐ ‐ ‐ ‐ ‐
Financial Plan Project ID: c0419
FY20 FY21 FY22 FY23 FY24 FY25 FY26 FY27‐31 Total
End Bal. Budget Approved Proposed Proposed Proposed Proposed Proposed Proposed
SOURCES
General Capital Fund ‐ 30,000 ‐ ‐ ‐ ‐ ‐ ‐ ‐
Fleet Management Fund 663 ‐ ‐ 20,000 20,000 20,000 20,000 100,000 180,000
TOTAL SOURCES 663 30,000 ‐ 20,000 20,000 20,000 20,000 100,000 260,000
USES
Capital ‐ Machinery & Equip 663 30,000 ‐ 20,000 20,000 20,000 20,000 100,000 260,000
TOTAL USES 663 30,000 ‐ 20,000 20,000 20,000 20,000 100,000 260,000
The following five (5) fuel sites are managed by the Fleet Management Division: (1) Public Safety Campus (Jail) (2) Fleet Management ‐ Newton Bridge Road, (3) Fire
Station #1, (4) Fire Station #2, and (5) East Side Fuel Center ‐ Spring Valley Road. This project provides routine upgrades to fuel sites (ie. dispenser repair &
replacement, fuel nozzles, hoses, filters, and site maintenance), responds to EPD requirements for fuel facilities, and updates to the computer operated fuel
dispensing system. Additional focus on underground storage tank repair and maintenance is expected to be addressed in future budget years.
For over twenty years, regular bi‐annual upgrades to Athens‐Clarke County’s fueling sites have ensured safe, compliant, efficient fueling operations that have served
customers year round. While this funding has allowed Fleet Management to enhance automated tank monitoring and site maintenance, fuel management software
and some hardware is outdated and has reached its limited storage capacity. This year’s funding request, coupled with previous year’s carry‐forward amount, will be
focused on a fuel management system upgrade. This request completes a 2 year allocation from the Fleet Management fund to the General Capital fund to help
rebuild the financial integrity of the Fleet Management fund.
No Impact.
Capital Detail by Department FY22 Budget D-32

Central Services Department Priority
Tree Hazard Reduction 11 of 22CS, Life Cycle Project Timeline: FY21 to Ongoing
Project Description
Project Justification
Impact on Annual Operating Expenses FY22 FY23 FY24 FY25 FY26 FY27‐31 Annual
(10,000) (10,000) (10,000) (10,000) (10,000) (50,000) (10,000)
New
Financial Plan Project ID: N/A
FY20 FY21 FY22 FY23 FY24 FY25 FY26 FY27‐31 Total
End Bal. Budget Approved Proposed Proposed Proposed Proposed Proposed Proposed
SOURCES
General Capital Fund ‐ ‐ ‐ 60,000 60,000 60,000 60,000 300,000 540,000
TOTAL SOURCES ‐ ‐ ‐ 60,000 60,000 60,000 60,000 300,000 540,000
USES
Capital ‐ Other ‐ ‐ ‐ 60,000 60,000 60,000 60,000 300,000 540,000
TOTAL USES ‐ ‐ ‐ 60,000 60,000 60,000 60,000 300,000 540,000
Selectively removing diseased, declining, invasive, hazardous, and other undesirable trees and shrubs will produce a healthier and more viable forestry system.
Various designated areas will be selected based on risk, health, and hazardous impacts. Contractors will be under the direction of the Community Forester. Chippings
and grinds will be recycled for landscape use throughout the county.
Reduction of hazardous trees reduces the risk of potential property damages and loss of lives. Additional benefits of a hazard reduction program are increased
property values, marketability of development, improved air quality, shading of buildings and structures, and creating aesthetically pleasing landscapes. Tree hazard
reduction also provides erosion control, long‐term stormwater benefits, and increased roadway stability by intercepting and absorbing rainfall.
Decreased operating expenses thru avoided insurance claims.
Capital Detail by Department
FY22 Budget D-33

Central Services Department Priority
Parking Facilities 13 of 22CS, Facilities Project Timeline: Ongoing
Project Description
Project Justification
Impact on Annual Operating Expenses FY22 FY23 FY24 FY25 FY26 FY27‐31 Annual
‐ ‐ ‐ ‐ ‐ ‐ ‐
Financial Plan Project ID: c0230
FY20 FY21 FY22 FY23 FY24 FY25 FY26 FY27‐31 Total
End Bal. Budget Approved Proposed Proposed Proposed Proposed Proposed Proposed
SOURCES
General Capital Fund 50,777 ‐ ‐ 20,000 20,000 20,000 20,000 100,000 180,000
TOTAL SOURCES 50,777 ‐ ‐ 20,000 20,000 20,000 20,000 100,000 180,000
USES
Capital ‐ Const. 50,777 ‐ ‐ 20,000 20,000 20,000 20,000 100,000 180,000
TOTAL USES 50,777 ‐ ‐ 20,000 20,000 20,000 20,000 100,000 180,000
Maintain downtown public parking facilities (excluding parking deck facilities life cycle) and repair and/or replace parking meters outside of downtown, as well as
maintain equipment and software for the ticket system.
Provide funding to maintain downtown and other on‐street public parking facilities and spaces such as, painting of the parking stripes, replacing damaged parking
meters, and repairing of surface parking facilities and equipment. This restores funding to this project.
No Impact.
Capital Detail by Department FY22 Budget D-34

Central Services Department Priority
Renovations/Space Allocation Plan 14 of 22AI, Facilities Project Timeline: Ongoing
Project Description
Project Justification
Impact on Annual Operating Expenses FY22 FY23 FY24 FY25 FY26 FY27‐31 Annual
‐ ‐ ‐ ‐ ‐ ‐ ‐
Financial Plan Project ID: c0074
FY20 FY21 FY22 FY23 FY24 FY25 FY26 FY27‐31 Total
End Bal. Budget Approved Proposed Proposed Proposed Proposed Proposed Proposed
SOURCES
General Capital Fund 393,780 ‐ ‐ 30,000 30,000 30,000 30,000 150,000 270,000
TOTAL SOURCES 393,780 ‐ ‐ 30,000 30,000 30,000 30,000 150,000 270,000
USES
Capital ‐ Const. 393,780 ‐ ‐ 30,000 30,000 30,000 30,000 150,000 270,000
TOTAL USES 393,780 ‐ ‐ 30,000 30,000 30,000 30,000 150,000 270,000
The Space Allocation Program sets aside funds to be used for the renovation, acquisition, or construction of facilities in response to ACCGov departments' space
needs. The FY21 request was to fund a small portion of recommendations coming from the 2010 and 2018 Space Allocation studies and other space
reconfiguration/renovation needs of ACCGov departments and possible relocation of ACCGov offices currently in leased office space. This project was last funded in
FY18.
Projects are determined based on the needs of other ACCGov departments as their service delivery needs evolve over time requiring renovation or reconfiguration of
office and other operational facility spaces. In FY20‐FY23, additional needs are anticipated as existing departments (not yet identified) are moved into the Costa
Building, which is being renovated as a SPLOST 2011 project, or some other location or new building. Spaces vacated by those departments moving will need
renovations to accommodate new functions. Restores funding to $30,000/year. Funding needed for small renovations not captured in SPLOST 2020.
No Impact.
Capital Detail by Department
FY22 Budget D-35

Central Services Department Priority
Urban Forestry Crew 15 of 22AI, Equipment Project Timeline: FY27 to Ongoing
Project Description
Project Justification
Impact on Annual Operating Expenses FY22 FY23 FY24 FY25 FY26 FY27‐31 Annual
‐ ‐ ‐ ‐ ‐ 1,050,000 105,000
New
Financial Plan Project ID: N/A
FY20 FY21 FY22 FY23 FY24 FY25 FY26 FY27‐31 Total
End Bal. Budget Approved Proposed Proposed Proposed Proposed Proposed Proposed
SOURCES
General Cap Proj Fund ‐ ‐ ‐ ‐ 110,000 110,000 115,000 115,000 450,000
TOTAL SOURCES ‐ ‐ ‐ ‐ 110,000 110,000 115,000 115,000 450,000
USES
Capital ‐ Vehicles ‐ ‐ ‐ ‐ ‐ ‐ ‐ ‐ ‐
Capital ‐ Machinery & Equip ‐ ‐ ‐ ‐ 110,000 110,000 115,000 115,000 450,000
TOTAL USES ‐ ‐ ‐ ‐ 110,000 110,000 115,000 115,000 450,000
Equipment to support a new urban forestry maintenance crew proposed in the FY27 budget. The project will purchase one bucket truck, one dump body truck, one
grapple truck, one wood chipper, and related small equipment (chainsaws, blower, ropes, etc.) to outfit a tree maintenance crew.
Healthy,Livable, Sustainable Athens‐Clarke County Currently, Landscape Management sub‐contracts the majority of tree work. Limited removals are addressed due
to budget restraints. With the Urban Forestry crew, Landscape Management would provide year‐round maintenance and hazard tree removal. Quicker response time
for emergency tree issues. Crews will proactively and routinely prune hazardous trees instead of reactive responses.
$1.3m in salary, operating, and replacement expenses
$250k in savings from reduced contracted tree work
Capital Detail by Department FY22 Budget D-36

Central Services Department Priority
Replace Internal Support Equipment 16 of 22CS, Equipment Project Timeline: Ongoing
Project Description
Project Justification
Impact on Annual Operating Expenses FY22 FY23 FY24 FY25 FY26 FY27‐31 Annual
‐ ‐ ‐ ‐ ‐ ‐ ‐
Financial Plan Project ID: c0347
FY20 FY21 FY22 FY23 FY24 FY25 FY26 FY27‐31 Total
End Bal. Budget Approved Proposed Proposed Proposed Proposed Proposed Proposed
SOURCES
General Capital Fund 40,036 10,000 10,000 10,000 10,000 10,000 10,000 50,000 100,000
Internal Support Fund 84,414 15,000 15,000 15,000 15,000 15,000 15,000 75,000 150,000
TOTAL SOURCES 124,450 25,000 25,000 25,000 25,000 25,000 25,000 125,000 250,000
USES
Capital ‐ Machinery & Equip 124,450 25,000 25,000 25,000 25,000 25,000 25,000 125,000 250,000
TOTAL USES 124,450 25,000 25,000 25,000 25,000 25,000 25,000 125,000 250,000
Purchase and replace outdated equipment in the Records Center and Print Shop in order to provide better service. This program provides for the programmed
replacement of record keeping and printing equipment as it approaches the end of its useful life.
Approximately 30% of all equipment covered by this replacement program is 12 to 17 years old. As equipment ages, it requires more frequent service calls and
replacement parts become more expensive. Equipment downtime creates the need for more expensive outsourcing. This scheduled replacement program will
reduce operating costs for maintenance and outsourcing. Funding will be split between the General Capital Projects Fund (310) and the Internal Support Fund (601).
No Impact.
Capital Detail by Department
FY22 Budget D-37
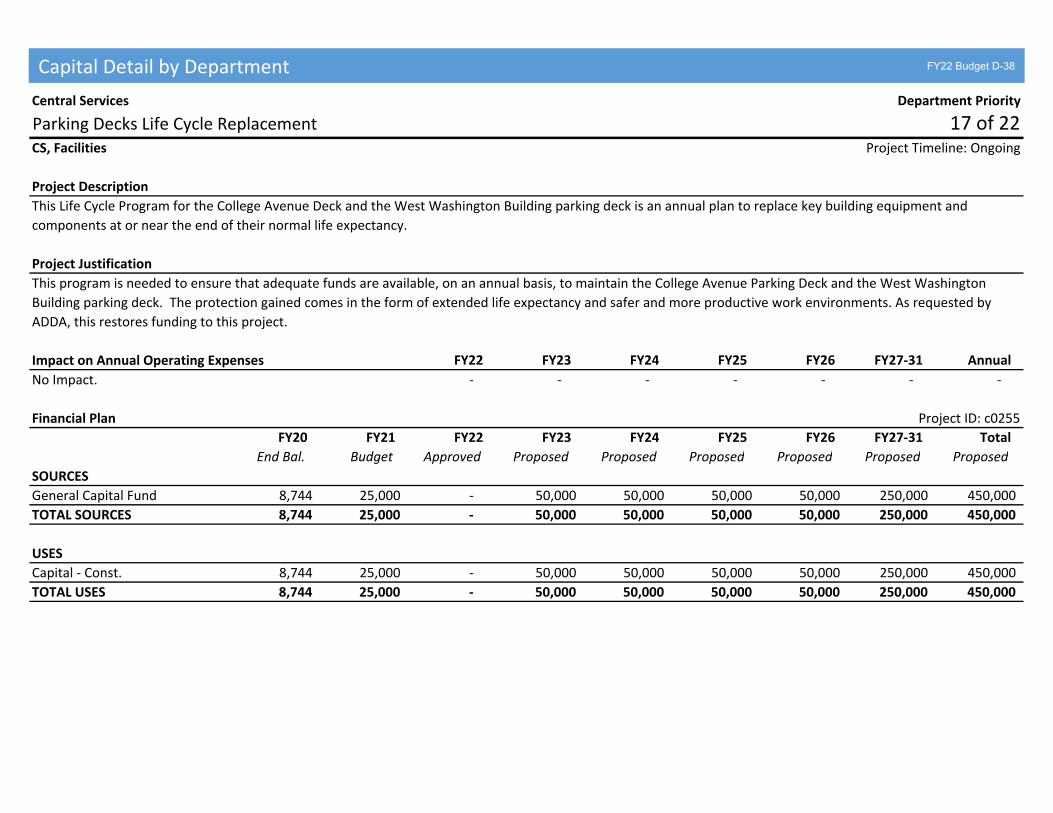
Central Services Department Priority
Parking Decks Life Cycle Replacement 17 of 22CS, Facilities Project Timeline: Ongoing
Project Description
Project Justification
Impact on Annual Operating Expenses FY22 FY23 FY24 FY25 FY26 FY27‐31 Annual
‐ ‐ ‐ ‐ ‐ ‐ ‐
Financial Plan Project ID: c0255
FY20 FY21 FY22 FY23 FY24 FY25 FY26 FY27‐31 Total
End Bal. Budget Approved Proposed Proposed Proposed Proposed Proposed Proposed
SOURCES
General Capital Fund 8,744 25,000 ‐ 50,000 50,000 50,000 50,000 250,000 450,000
TOTAL SOURCES 8,744 25,000 ‐ 50,000 50,000 50,000 50,000 250,000 450,000
USES
Capital ‐ Const. 8,744 25,000 ‐ 50,000 50,000 50,000 50,000 250,000 450,000
TOTAL USES 8,744 25,000 ‐ 50,000 50,000 50,000 50,000 250,000 450,000
This Life Cycle Program for the College Avenue Deck and the West Washington Building parking deck is an annual plan to replace key building equipment and
components at or near the end of their normal life expectancy.
This program is needed to ensure that adequate funds are available, on an annual basis, to maintain the College Avenue Parking Deck and the West Washington
Building parking deck. The protection gained comes in the form of extended life expectancy and safer and more productive work environments. As requested by
ADDA, this restores funding to this project.
No Impact.
Capital Detail by Department FY22 Budget D-38

Central Services Department Priority
Community Events Program 18 of 22CS, General Project Timeline: Ongoing
Project Description
Project Justification
Impact on Annual Operating Expenses FY22 FY23 FY24 FY25 FY26 FY27‐31 Annual
‐ ‐ ‐ ‐ ‐ ‐ ‐
Financial Plan Project ID: c0135
FY20 FY21 FY22 FY23 FY24 FY25 FY26 FY27‐31 Total
End Bal. Budget Approved Proposed Proposed Proposed Proposed Proposed Proposed
SOURCES
Hotel/Motel Spec Rev Fund 14,485 40,000 30,000 40,000 40,000 40,000 40,000 200,000 390,000
TOTAL SOURCES 14,485 40,000 30,000 40,000 40,000 40,000 40,000 200,000 390,000
USES
Capital ‐ Machinery & Equip 14,485 40,000 30,000 40,000 40,000 40,000 40,000 200,000 390,000
TOTAL USES 14,485 40,000 30,000 40,000 40,000 40,000 40,000 200,000 390,000
This program provides materials and services in support of the Athens Downtown Development Authority (ADDA) "Community Events Program" (CEP). This funding
allows Central Services to partner with Athens Downtown Development Authority (ADDA) to host a seasonal array of community events and utilize the Central
Business District as a "stage." Examples of materials requiring capital funding include seasonal lighting, garlands, electrical circuits, banner brackets, and protective
fencing and barricades. Cost estimates are from Central Services Department staff. NOTE: This project is not the CEP budget that is allocated to ADDA annually to
support downtown special events.
The Christmas Season and Athfest are examples of events that characterize Athens‐Clarke County (ACC) as a community interested in providing quality outdoor
entertainment and enhancements to citizens and visitors while additionally benefiting merchants within the Central Business District. This base level of support to
the streetscape infrastructure (the stage) by ACC will encourage seasonal events marketed by ADDA. Overall, funding for this project will promote economic
development and enhance the quality of life for merchants, community citizens, and community visitors.
No Impact.
Capital Detail by Department
FY22 Budget D-39

Central Services Department Priority
Downtown Enhancement Project 19 of 22AI, General Project Timeline: Ongoing
Project Description
Project Justification
Impact on Annual Operating Expenses FY22 FY23 FY24 FY25 FY26 FY27‐31 Annual
‐ ‐ ‐ ‐ ‐ ‐ ‐
Financial Plan Project ID: c0367
FY20 FY21 FY22 FY23 FY24 FY25 FY26 FY27‐31 Total
End Bal. Budget Approved Proposed Proposed Proposed Proposed Proposed Proposed
SOURCES
General Capital Fund 114,767 60,000 60,000 60,000 60,000 60,000 60,000 300,000 600,000
TOTAL SOURCES 114,767 60,000 60,000 60,000 60,000 60,000 60,000 300,000 600,000
USES
Capital ‐ Const. 114,767 60,000 60,000 60,000 60,000 60,000 60,000 300,000 600,000
TOTAL USES 114,767 60,000 60,000 60,000 60,000 60,000 60,000 300,000 600,000
The Downtown Enhancement Program (DEP) has been established to provide funding to the Athens Downtown Development Authority (ADDA) for capital and
operating expenses in support of downtown improvement activities. Funding for the DEP comes from downtown parking revenues. The ADDA will submit a plan for
approval by the Mayor and Commission prior to expending any funds from the DEP program.
The Downtown Enhancement Program was established in September 2002 as a part of the parking services contract between Athens‐Clarke County and the ADDA.
No Impact.
Capital Detail by Department FY22 Budget D-40

Central Services Department Priority
Additional Rural Roadside Mowing Crew 20 of 22AI, Equipment Project Timeline: FY26 to Ongoing
Project Description
Project Justification
Impact on Annual Operating Expenses FY22 FY23 FY24 FY25 FY26 FY27‐31 Annual
‐ ‐ ‐ ‐ 250,000 1,250,000 150,000
New
Financial Plan Project ID: N/A
FY20 FY21 FY22 FY23 FY24 FY25 FY26 FY27‐31 Total
End Bal. Budget Approved Proposed Proposed Proposed Proposed Proposed Proposed
SOURCES
General Cap Proj Fund ‐ ‐ ‐ 70,000 70,000 80,000 80,000 ‐ 300,000
TOTAL SOURCES ‐ ‐ ‐ 70,000 70,000 80,000 80,000 ‐ 300,000
USES
Capital ‐ Vehicles ‐ ‐ ‐ ‐ ‐ ‐ ‐ ‐ ‐
Capital ‐ Machinery & Equip ‐ ‐ ‐ 70,000 70,000 80,000 80,000 ‐ 300,000
TOTAL USES ‐ ‐ ‐ 70,000 70,000 80,000 80,000 ‐ 300,000
Equipment to support an additional rural roadside mowing crew which is proposed to be a new intitiave in FY26. The project will purchase one crew cab truck, two
tractors with bat‐wing mowers, one equipment trailer, two riding mowers, and related small landscape equipment (weedeaters, chainsaws, blowers) outfitting an
additional rural roadside mowing crew.
Healthy, Livable, Sustainable Athens‐Clarke County: One tractor crew currently provides mowing services to approximately 700 miles of rural roadways on an
average 11‐week cycle. The process will reduce to an average of 5 weeks, which is similar to the four‐week cycle length in all other county areas. It will improve rural
roads' appearances and safety and decrease the developing need for chemical control of invasive species grasses.
Salary, operating, and replacement expenses.
Capital Detail by Department
FY22 Budget D-41

Central Services Department Priority
Telephone System Life Cycle Replacement 21 of 22CS, Equipment Project Timeline: Ongoing
Project Description
Project Justification
Impact on Annual Operating Expenses FY22 FY23 FY24 FY25 FY26 FY27‐31 Annual
‐ ‐ ‐ ‐ ‐ ‐ ‐
Financial Plan Project ID: c0238
FY20 FY21 FY22 FY23 FY24 FY25 FY26 FY27‐31 Total
End Bal. Budget Approved Proposed Proposed Proposed Proposed Proposed Proposed
SOURCES
General Capital Fund 259,806 ‐ ‐ ‐ ‐ ‐ ‐ ‐ ‐
Internal Support Fund 55,308 25,000 25,000 25,000 25,000 25,000 25,000 125,000 250,000
TOTAL SOURCES 315,114 25,000 25,000 25,000 25,000 25,000 25,000 125,000 250,000
USES
Capital ‐ Machinery & Equip 315,114 25,000 25,000 25,000 25,000 25,000 25,000 125,000 250,000
TOTAL USES 315,114 25,000 25,000 25,000 25,000 25,000 25,000 125,000 250,000
Purchase and replace outdated telephone systems and equipment as existing hardware reaches the end of its useful life. This project will also transition the multiple
ACCUG phone systems to a new Voice‐over‐IP (VoIP) solution that will reduce future operating expenses.
Telephonic communications is critical to the functioning and service delivery of all departments of the Unified Government of Athens‐Clarke County. Equipment is
aging and mostly of analog technology. A transition to VoIP requires a significant capital investment.
VoIP should provide significant operating expense savings
throughout ACCUG departments by eliminating the
dependence on conventional phone systems.
Capital Detail by Department FY22 Budget D-42

Central Services Department Priority
Energy Management Improvements 22 of 22CS, General Project Timeline: Ongoing
Project Description
Project Justification
Impact on Annual Operating Expenses FY22 FY23 FY24 FY25 FY26 FY27‐31 Annual
‐ ‐ ‐ ‐ (3,000) (15,000) (1,800)
Financial Plan Project ID: c0487
FY20 FY21 FY22 FY23 FY24 FY25 FY26 FY27‐31 Total
End Bal. Budget Approved Proposed Proposed Proposed Proposed Proposed Proposed
SOURCES
General Capital Fund 13,131 ‐ ‐ ‐ ‐ ‐ 30,000 150,000 180,000
TOTAL SOURCES 13,131 ‐ ‐ ‐ ‐ ‐ 30,000 150,000 180,000
USES
Capital ‐ Const. 13,131 ‐ ‐ ‐ ‐ ‐ 30,000 150,000 180,000
TOTAL USES 13,131 ‐ ‐ ‐ ‐ ‐ 30,000 150,000 180,000
The purpose of the Energy Management Program is to reduce energy consumption & costs at ACCGov facilities. This project provides funding for the implementation
of proven energy savings measures & audits to identify those measures. Funds may be used as a one time life cycle augmentation where it can be demonstrated that
the early replacement or upgrading of equipment will result in energy savings.
The justification for this project is reduction in energy consumption and proven energy cost savings. Projects will increase savings to ACCGov and reduce our carbon
footprint. Further savings could be realized through a broader program application and additional annual funding.
Reduction in energy consumption costs.
Capital Detail by Department
FY22 Budget D-43

Clerk of Courts Department Priority
Deed Indexing (years 1970‐1983) 1 of 1AI, Software Project Timeline: FY22 to Ongoing
Project Description
Project Justification
Impact on Annual Operating Expenses FY22 FY23 FY24 FY25 FY26 FY27‐31 Annual
‐ ‐ ‐ ‐ ‐ ‐ ‐
New
Financial Plan Project ID: N/A
FY20 FY21 FY22 FY23 FY24 FY25 FY26 FY27‐31 Total
End Bal. Budget Approved Proposed Proposed Proposed Proposed Proposed Proposed
SOURCES
General Cap Proj Fund ‐ ‐ ‐ ‐ ‐ ‐ ‐ ‐ ‐
TOTAL SOURCES ‐ ‐ ‐ ‐ ‐ ‐ ‐ ‐ ‐
USES
Other ‐ ‐ ‐ ‐ ‐ ‐ ‐ ‐ ‐
TOTAL USES ‐ ‐ ‐ ‐ ‐ ‐ ‐ ‐ ‐
This project will provide certified digital real estate records by providing online access to approximately 154,000 documents for years 1970‐1983. These documents
will be indexed according to the statewide GSCCCA indexing standards.
It will allow researchers to perform a 50 year title search without having to physically appear in the office. The records can be accessed on the statewide index 24
hours a day, 7 days a week. This service will greatly reduce daily foot traffic into the real estate records room, which will aid in keeping our staff and public safe.
Indexing these records will assist in maintaining pertinent historical records and enhance the services already provided by our office.
No impact.
Capital Detail by Department FY22 Budget D-44

Corrections Department Priority
Food Service Equipment Life Cycle Replacement 1 of 3CS, Equipment Project Timeline: Ongoing
Project Description
Project Justification
Impact on Annual Operating Expenses FY22 FY23 FY24 FY25 FY26 FY27‐31 Annual
‐ ‐ ‐ ‐ ‐ ‐ ‐
Financial Plan Project ID: c0180
FY20 FY21 FY22 FY23 FY24 FY25 FY26 FY27‐31 Total
End Bal. Budget Approved Proposed Proposed Proposed Proposed Proposed Proposed
SOURCES
General Capital Fund 30,241 20,000 20,000 20,000 20,000 20,000 20,000 30,000 130,000
TOTAL SOURCES 30,241 20,000 20,000 20,000 20,000 20,000 20,000 30,000 130,000
USES
Capital ‐ Machinery & Equip 30,241 20,000 20,000 20,000 20,000 20,000 20,000 30,000 130,000
TOTAL USES 30,241 20,000 20,000 20,000 20,000 20,000 20,000 30,000 130,000
The Correctional Facility's food service kitchen supplies meals to the Prison (Correctional Institute), Diversion Center and the Jail. This request is to ensure that
kitchen equipment is safe, reliable and adequate for the volume of meals that need to be prepared.
Meals provided by the Corrections Food Service Facility are a necessary component of the Jail, Correctional Institution and Diversion Center. Failure to provide meals
in a timely manner can result in inmate unrest and lawsuits. The existing kitchen, installed in 1987, was designed for serving meals only at the prison. Today,
Corrections prepares an average of 1,800 meals a day for the prison, diversion center and the jail. In FY05, because of the increase in the jail population, a new
SPLOST funded food service facility was opened. However, the existing kitchen is still used as a servicing center; and the existing dishwasher, warming oven, steam
table and other serving equipment must be maintained. Also, the prison kitchen is used as a backup kitchen in the event the Food Service Facility is not operating.
No Impact.
Capital Detail by Department
FY22 Budget D-45

Corrections Department Priority
Officer Portable Radio and Charging Station Purchase 2 of 3CS, Equipment Project Timeline: FY22 to FY22
Project Description
Project Justification
Impact on Annual Operating Expenses FY22 FY23 FY24 FY25 FY26 FY27‐31 Annual
‐ ‐ ‐ ‐ ‐ ‐ ‐
New
Financial Plan Project ID: c0815
FY20 FY21 FY22 FY23 FY24 FY25 FY26 FY27‐31 Total
End Bal. Budget Approved Proposed Proposed Proposed Proposed Proposed Proposed
SOURCES
General Capital Fund ‐ ‐ 10,000 10,000 10,000 10,000 10,000 10,000 60,000
TOTAL SOURCES ‐ ‐ 10,000 10,000 10,000 10,000 10,000 10,000 60,000
USES
Capital ‐ Machinery & Equip ‐ ‐ 10,000 10,000 10,000 10,000 10,000 10,000 60,000
TOTAL USES ‐ ‐ 10,000 10,000 10,000 10,000 10,000 10,000 60,000
Additional staff have been approved for the Department to reduce the burden on existing staff and the overtime budget. A uniform requirement includes issuing
every certified officer with one mobile radio, shoulder mic, two batteries, and a charging station.
Every Georgia POST Certified position in the Department of Corrections is to be issued a mobile radio for their safety, as well as the safety of the returning citizens,
visitors, and volunteers under their supervision. Both the Corrections Institution and the Diversion Center have been approved for additional staff members, and one
administrative position (with a second pending) have been reallocated to security roles to expand our quality of services. In keeping with a safe and prepared
community, the ability to quickly communicate and respond to exigent circumstances is a necessary requirement of a Corrections Officer's role. Further, possessing a
mobile radio is a requirement under the policies of the Georgia Department of Corrections. This will allow new staff members access to these items and provide
funding to replace antiquated materials issued to existing staff.
No Impact.
Capital Detail by Department FY22 Budget D-46

Corrections Department Priority
Corrections Institution Building Renovation and Life Safety Equipment Installation 3 of 3CS, Construction Project Timeline: FY22 to FY24
Project Description
Project Justification
Impact on Annual Operating Expenses FY22 FY23 FY24 FY25 FY26 FY27‐31 Annual
‐
New
Financial Plan Project ID: N/A
FY20 FY21 FY22 FY23 FY24 FY25 FY26 FY27‐31 Total
End Bal. Budget Approved Proposed Proposed Proposed Proposed Proposed Proposed
SOURCES
General Capital Fund ‐ ‐ ‐ 598,668 628,602 ‐ ‐ ‐ 1,227,270
TOTAL SOURCES ‐ ‐ ‐ 598,668 628,602 ‐ ‐ ‐ 1,227,270
USES
Capital ‐ Machinery & Equip ‐ ‐ ‐ 598,668 628,602 ‐ ‐ ‐ 1,227,270
TOTAL USES ‐ ‐ ‐ 598,668 628,602 ‐ ‐ ‐ 1,227,270
Conduct a series of upgrades, repairs, and replacements to the Corrections Institution housing 120 Georgia Department of Corrections returning citizens to include
modern fire and life safety equipment.
The Corrections Institution contains one building encompassing the administrative offices, returning citizen dormitories, chow hall, kitchen, and storage areas, as well
as a separate building called the Chapel used for programs and visitation. These building were completed in stages between the 1970's and by 1985 and have been in
non‐stop use 24‐hours per day, every day since. Currently, the building is without sprinkler and other fire suppression equipment or carbon dioxide detectors. The
introduction of new technologies, such as internet access for web‐based programs is cost prohibitive. This reduces the ability to deliver rehabilitative services,
especially in a pandemic, as well as provide modern supervision techniques to ensure safe housing of the returning citizens. Renovations will provide a safer, more
cost effective operation.
No Impact
Capital Detail by Department
FY22 Budget D-47

Fire & Emergency Services Department Priority
Fire Apparatus Replacement ‐ Rescue Unit 1 of 10CS, Equipment Project Timeline: FY22 to FY26
Project Description
Project Justification
Impact on Annual Operating Expenses FY22 FY23 FY24 FY25 FY26 FY27‐31 Annual
‐ ‐ ‐ ‐ ‐ ‐ ‐
New
Financial Plan Project ID: N/A
FY20 FY21 FY22 FY23 FY24 FY25 FY26 FY27‐31 Total
End Bal. Budget Approved Proposed Proposed Proposed Proposed Proposed Proposed
SOURCES
General Cap Proj Fund ‐ ‐ ‐ 99,000 99,000 99,000 99,000 ‐ 396,000
TOTAL SOURCES ‐ ‐ ‐ 99,000 99,000 99,000 99,000 ‐ 396,000
USES
Capital ‐ Vehicles ‐ ‐ ‐ 99,000 99,000 99,000 99,000 ‐ 396,000
TOTAL USES ‐ ‐ ‐ 99,000 99,000 99,000 99,000 ‐ 396,000
This project will replace a 2006 model Rescue truck which is a mission‐critical apparatus for emergencies within Athens‐Clarke County. The purchase price of the
vehicle is $450,000 and we are proposing two options for purchase: 1.) outright purchase in FY22 or 2.) lease option over 5 years (FY22‐FY26) at ~3%. Following the
lease terms, ACCGov would own the vehicle and use if for the duration of its expected life which is estimated at 10 years.
The Rescue Unit is a mission‐critical apparatus and will be the sole unit housing specialized equipment for advanced rescue operations. The specialized rescue
equipment allows our department to handle emergencies such as water rescue, high‐angle rope rescue, trench rescue, and vehicle extrication. This project supports
the Mayor and Commissions goal of a Safe and Prepared Community by ensuring our Department has the resources needed to address rescue emergencies with
equipment not housed on any other fire apparatus. The Rescue Unit responds to all structure fires and rescue incidents within Athens‐Clarke County and helps us
retain our I.S.O Class 1 Rating.
No impact.
Capital Detail by Department FY22 Budget D-48
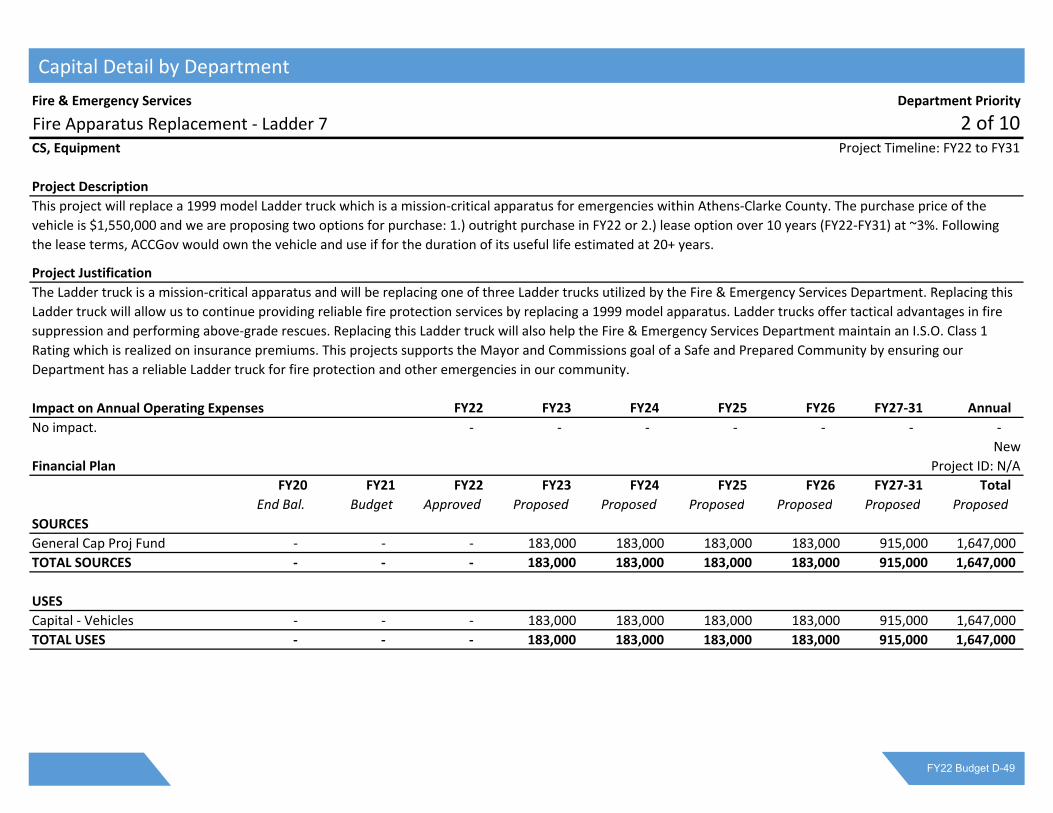
Fire & Emergency Services Department Priority
Fire Apparatus Replacement ‐ Ladder 7 2 of 10CS, Equipment Project Timeline: FY22 to FY31
Project Description
Project Justification
Impact on Annual Operating Expenses FY22 FY23 FY24 FY25 FY26 FY27‐31 Annual
‐ ‐ ‐ ‐ ‐ ‐ ‐
New
Financial Plan Project ID: N/A
FY20 FY21 FY22 FY23 FY24 FY25 FY26 FY27‐31 Total
End Bal. Budget Approved Proposed Proposed Proposed Proposed Proposed Proposed
SOURCES
General Cap Proj Fund ‐ ‐ ‐ 183,000 183,000 183,000 183,000 915,000 1,647,000
TOTAL SOURCES ‐ ‐ ‐ 183,000 183,000 183,000 183,000 915,000 1,647,000
USES
Capital ‐ Vehicles ‐ ‐ ‐ 183,000 183,000 183,000 183,000 915,000 1,647,000
TOTAL USES ‐ ‐ ‐ 183,000 183,000 183,000 183,000 915,000 1,647,000
This project will replace a 1999 model Ladder truck which is a mission‐critical apparatus for emergencies within Athens‐Clarke County. The purchase price of the
vehicle is $1,550,000 and we are proposing two options for purchase: 1.) outright purchase in FY22 or 2.) lease option over 10 years (FY22‐FY31) at ~3%. Following
the lease terms, ACCGov would own the vehicle and use if for the duration of its useful life estimated at 20+ years.
The Ladder truck is a mission‐critical apparatus and will be replacing one of three Ladder trucks utilized by the Fire & Emergency Services Department. Replacing this
Ladder truck will allow us to continue providing reliable fire protection services by replacing a 1999 model apparatus. Ladder trucks offer tactical advantages in fire
suppression and performing above‐grade rescues. Replacing this Ladder truck will also help the Fire & Emergency Services Department maintain an I.S.O. Class 1
Rating which is realized on insurance premiums. This projects supports the Mayor and Commissions goal of a Safe and Prepared Community by ensuring our
Department has a reliable Ladder truck for fire protection and other emergencies in our community.
No impact.
Capital Detail by Department
FY22 Budget D-49

Fire & Emergency Services Department Priority
Replace Mobile Data Terminals 3 of 10CS, Equipment Project Timeline: FY13 to Ongoing
Project Description
Project Justification
Impact on Annual Operating Expenses FY22 FY23 FY24 FY25 FY26 FY27‐31 Annual
‐ ‐ ‐ ‐ ‐ ‐ ‐
Financial Plan Project ID: c0659
FY20 FY21 FY22 FY23 FY24 FY25 FY26 FY27‐31 Total
End Bal. Budget Approved Proposed Proposed Proposed Proposed Proposed Proposed
SOURCES
General Capital Fund 154,332 50,000 50,000 50,000 50,000 50,000 50,000 250,000 500,000
TOTAL SOURCES 154,332 50,000 50,000 50,000 50,000 50,000 50,000 250,000 500,000
USES
Capital ‐ Machinery & Equip 154,332 50,000 50,000 50,000 50,000 50,000 50,000 250,000 500,000
TOTAL USES 154,332 50,000 50,000 50,000 50,000 50,000 50,000 250,000 500,000
Timely replacement of 28 MDT's currently installed in Fire Department vehicles and apparatus.
Information Technology Services recommended a 5 year replacement program for these devices, at which time the useful life expectancy will be reached.
Technology changes and maintenance costs will make replacement a more fiscally responsible alternative. New projected cost of replacement in FY23 is $250,000.
The request is $50,000 per year contribution continuing through FY23.
No Impact.
Capital Detail by Department FY22 Budget D-50

Fire & Emergency Services Department Priority
Renovate and Expand Fire Training Center 4 of 10AI, Construction Project Timeline: FY21 to FY23
Project Description
Project Justification
Impact on Annual Operating Expenses FY22 FY23 FY24 FY25 FY26 FY27‐31 Annual
41,400 41,400 41,400 41,400 41,400 207,000 41,400
New
Financial Plan Project ID: N/A
FY20 FY21 FY22 FY23 FY24 FY25 FY26 FY27‐31 Total
End. Bal. Budget Approved Proposed Proposed Proposed Proposed Proposed Proposed
SOURCES
General Capital Fund ‐ ‐ ‐ 1,391,000 ‐ ‐ ‐ ‐ 1,391,000
TOTAL SOURCES ‐ ‐ ‐ 1,391,000 ‐ ‐ ‐ ‐ 1,391,000
USES
Capital ‐ Machinery & Equip ‐ ‐ ‐ 33,000 ‐ ‐ ‐ ‐ 33,000
Capital ‐ Const. ‐ ‐ ‐ 1,328,000 ‐ ‐ ‐ ‐ 1,328,000
Capital ‐ Other ‐ ‐ ‐ 30,000 ‐ ‐ ‐ ‐ 30,000
TOTAL USES ‐ ‐ ‐ 1,391,000 ‐ ‐ ‐ ‐ 1,391,000
Renovate and add to the Fire Department’s existing Training Center facilities by creating additional 8,000 square feet to include additional classroom space, a
National Incident Management (incident command) training lab, additional bay space for apparatus and equipment, additional bathrooms, additional
breakroom/kitchen space, conference room, three additional offices & storage space, car fire simulator, forcible entry simulator, propane tank simulator, Hazmat
Leaks prop, and additional parking.
(Safe and Prepared Community: Preserve infrastructure, Improve service delivery, Preserve community assets) The current building is too small for the needs of our
department. We have simply outgrown it. Expansion is the most fiscally responsible option. The current facility is 20 years old. While originally built for the needs at
the time, our department has grown in numbers as did the numbers of citizens and visitors we serve. Our firefighters are required to have a minimum of 240 hours
training for our ISO 1 rating. Much of the required training is multi‐company at the Training Center. Our recruit class of new firefighters has grown to over twelve
men and women at a time that spend many months at the Training Center. Current capacity is aproximately six firefighters comfortably. No land acquisition is
needed for the project.
Estimated annual operating costs.
Capital Detail by Department
FY22 Budget D-51

Fire & Emergency Services Department Priority
Diversity and Workforce Development Project 5 of 10AI, Recruitment/Hiring Project Timeline: FY22 to Ongoing
Project Description
Project Justification
Impact on Annual Operating Expenses FY22 FY23 FY24 FY25 FY26 FY27‐31 Annual
90,788 82,288 124,038 163,138 168,138 840,690 146,908
New
Financial Plan Project ID: N/A
FY20 FY21 FY22 FY23 FY24 FY25 FY26 FY27‐31 Total
End Bal. Budget Approved Proposed Proposed Proposed Proposed Proposed Proposed
SOURCES
General Cap Proj Fund ‐ ‐ ‐ 58,400 58,400 12,000 12,000 110,000 250,800
TOTAL SOURCES ‐ ‐ ‐ 58,400 58,400 12,000 12,000 110,000 250,800
USES
Capital ‐ Infrastructure ‐ ‐ ‐ 32,000 32,000 ‐ ‐ ‐ 64,000
Capital ‐ Vehicles ‐ ‐ ‐ ‐ ‐ ‐ ‐ 50,000 50,000
Capital ‐ Machinery & Equip ‐ ‐ ‐ 26,400 26,400 12,000 12,000 60,000 136,800
TOTAL USES ‐ ‐ ‐ 58,400 58,400 12,000 12,000 110,000 250,800
ACCFES is working with Clayton County Fire & Emergency Services to replicate their program of recruiting high school students. The concept is to provide Firefighter
and EMT training to high school students and then make conditional job offers to students when they graduate. The Fire & Emergency Services Department
anticipates costs associated with staffing, physical space, equipment, gear, and educational resources to continue pursuing this project with the Clarke County School
District.
Nationwide, the fire service struggles with diversity amongst the ranks and we are not immune in Athens‐Clarke County. Despite efforts to increase diversity, we are
not reflective of our community. This project will help introduce youth at an early age to the profession and provide an excellent recruiting mechanism for persons
who might otherwise never consider a job as a Firefighter. This project supports the Mayor and Commissions goals of a Safe and Prepared Community and Healthy,
Livable, Sustainable Athens‐Clarke County. The overall goal of this project is to increase the number of females and people of color within the Fire & Emergency
Services Department over the next 5 years
Personal Services Expenses
Capital Detail by Department FY22 Budget D-52
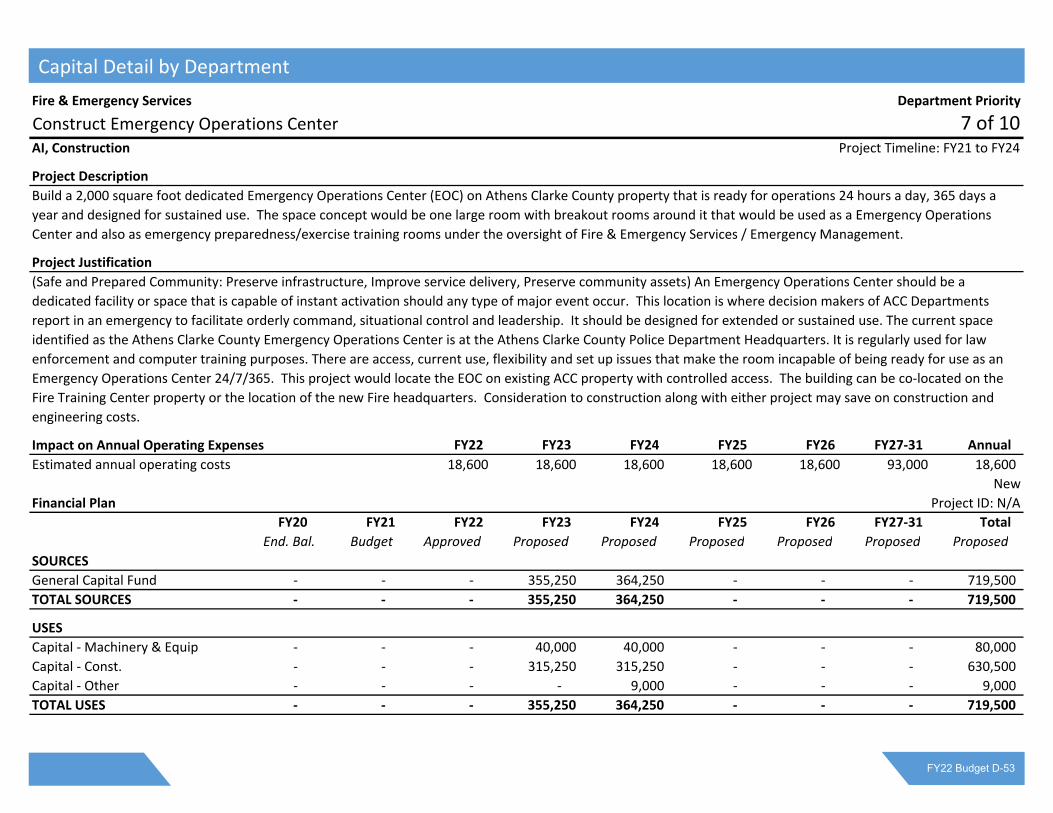
Fire & Emergency Services Department Priority
Construct Emergency Operations Center 7 of 10AI, Construction Project Timeline: FY21 to FY24
Project Description
Project Justification
Impact on Annual Operating Expenses FY22 FY23 FY24 FY25 FY26 FY27‐31 Annual
18,600 18,600 18,600 18,600 18,600 93,000 18,600
New
Financial Plan Project ID: N/A
FY20 FY21 FY22 FY23 FY24 FY25 FY26 FY27‐31 Total
End. Bal. Budget Approved Proposed Proposed Proposed Proposed Proposed Proposed
SOURCES
General Capital Fund ‐ ‐ ‐ 355,250 364,250 ‐ ‐ ‐ 719,500
TOTAL SOURCES ‐ ‐ ‐ 355,250 364,250 ‐ ‐ ‐ 719,500
USES
Capital ‐ Machinery & Equip ‐ ‐ ‐ 40,000 40,000 ‐ ‐ ‐ 80,000
Capital ‐ Const. ‐ ‐ ‐ 315,250 315,250 ‐ ‐ ‐ 630,500
Capital ‐ Other ‐ ‐ ‐ ‐ 9,000 ‐ ‐ ‐ 9,000
TOTAL USES ‐ ‐ ‐ 355,250 364,250 ‐ ‐ ‐ 719,500
Build a 2,000 square foot dedicated Emergency Operations Center (EOC) on Athens Clarke County property that is ready for operations 24 hours a day, 365 days a
year and designed for sustained use. The space concept would be one large room with breakout rooms around it that would be used as a Emergency Operations
Center and also as emergency preparedness/exercise training rooms under the oversight of Fire & Emergency Services / Emergency Management.
(Safe and Prepared Community: Preserve infrastructure, Improve service delivery, Preserve community assets) An Emergency Operations Center should be a
dedicated facility or space that is capable of instant activation should any type of major event occur. This location is where decision makers of ACC Departments
report in an emergency to facilitate orderly command, situational control and leadership. It should be designed for extended or sustained use. The current space
identified as the Athens Clarke County Emergency Operations Center is at the Athens Clarke County Police Department Headquarters. It is regularly used for law
enforcement and computer training purposes. There are access, current use, flexibility and set up issues that make the room incapable of being ready for use as an
Emergency Operations Center 24/7/365. This project would locate the EOC on existing ACC property with controlled access. The building can be co‐located on the
Fire Training Center property or the location of the new Fire headquarters. Consideration to construction along with either project may save on construction and
engineering costs.
Estimated annual operating costs
Capital Detail by Department
FY22 Budget D-53

Fire & Emergency Services Department Priority
Hose & Appliances 9 of 10CS, Equipment Project Timeline: FY22 to FY22
Project Description
Project Justification
Impact on Annual Operating Expenses FY22 FY23 FY24 FY25 FY26 FY27‐31 Annual
15,861 15,861 15,861 15,861 15,861 79,305 15,861
New
Financial Plan Project ID: c0816
FY20 FY21 FY22 FY23 FY24 FY25 FY26 FY27‐31 Total
End Bal. Budget Approved Proposed Proposed Proposed Proposed Proposed Proposed
SOURCES
General Cap Proj Fund ‐ ‐ 25,000 ‐ ‐ ‐ ‐ ‐ 25,000
TOTAL SOURCES ‐ ‐ 25,000 ‐ ‐ ‐ ‐ ‐ 25,000
USES
Capital ‐ Machinery & Equip ‐ ‐ 25,000 ‐ ‐ ‐ ‐ ‐ 25,000
TOTAL USES ‐ ‐ 25,000 ‐ ‐ ‐ ‐ ‐ 25,000
The Hose and Appliance Project for the Fire & Emergency Services Department will replace about 20,000 feet of old fire hose and water delivery appliances, many
are which are at the end of life. The hose lines replaced will be larger diameter to align with newer technology and industry standards associated with delivering
greater quantities of water at structure fires. This will allow the Department to standardize equipment on all fire apparatus at each of the nine fire stations in Athens‐
Clarke County.
Building contents and construction have changed over the past 30 years requiring greater volumes of water to effectively control fires due to fuel loads. Industry
standards and technology have advanced since much of the Departments hose and appliances were originally purchased. We have 20‐30 year old hose on some fire
apparatus that is at the end of its life. This project aligns with the Mayor and Commissions initiative of a Safe and Prepared Community as it will improve firefighting
effectiveness and safety by increasing the amount of water capable of being delivered. It is imperative we convert hose line and appliances simultaneously to the
newer technology for inoperability of crews and trucks operating at the same scene and for employee familiarity.
Replacement Costs
Capital Detail by Department FY22 Budget D-54

Information Technology Department Priority
Information Technology Equipment Replacement Program 1 of 1CS, Equipment Project Timeline: Ongoing
Project Description
Project Justification
Impact on Annual Operating Expenses FY22 FY23 FY24 FY25 FY26 FY27‐31 Annual
‐ ‐ ‐ ‐ ‐ ‐ ‐
Financial Plan Project ID: c0095
FY20 FY21 FY22 FY23 FY24 FY25 FY26 FY27‐31 Total
End Bal. Budget Approved Proposed Proposed Proposed Proposed Proposed Proposed
SOURCES
General Capital Fund 431,927 350,000 400,000 500,000 415,000 350,000 415,000 1,750,000 4,180,000
TOTAL SOURCES 431,927 350,000 400,000 500,000 415,000 350,000 415,000 1,750,000 4,180,000
USES
Capital ‐ Machinery & Equip 431,927 350,000 400,000 500,000 415,000 350,000 415,000 1,750,000 4,180,000
TOTAL USES 431,927 350,000 400,000 500,000 415,000 350,000 415,000 1,750,000 4,180,000
This project will replace PCs and Printers in all departments that are six years old or older and are of such a configuration that they are no longer suitable for client
server applications. Locations are in all the departments and work units in Athens‐Clarke County. In addition, this project will replace, upgrade, and expand network
equipment and software required to support IT operations within the government.
This project is made up of various components that are required to maintain and keep ACC's IT infrastructure operational. Components include networking
equipment, software upgrades, main system replacement(s), wiring improvements, and various other necessary components.
Replacing some infrastructure gear will result in increased
maintenance agreements and new purchases to expand some
services will also bring about new maintenance contracts.
Capital Detail by Department
FY22 Budget D-55
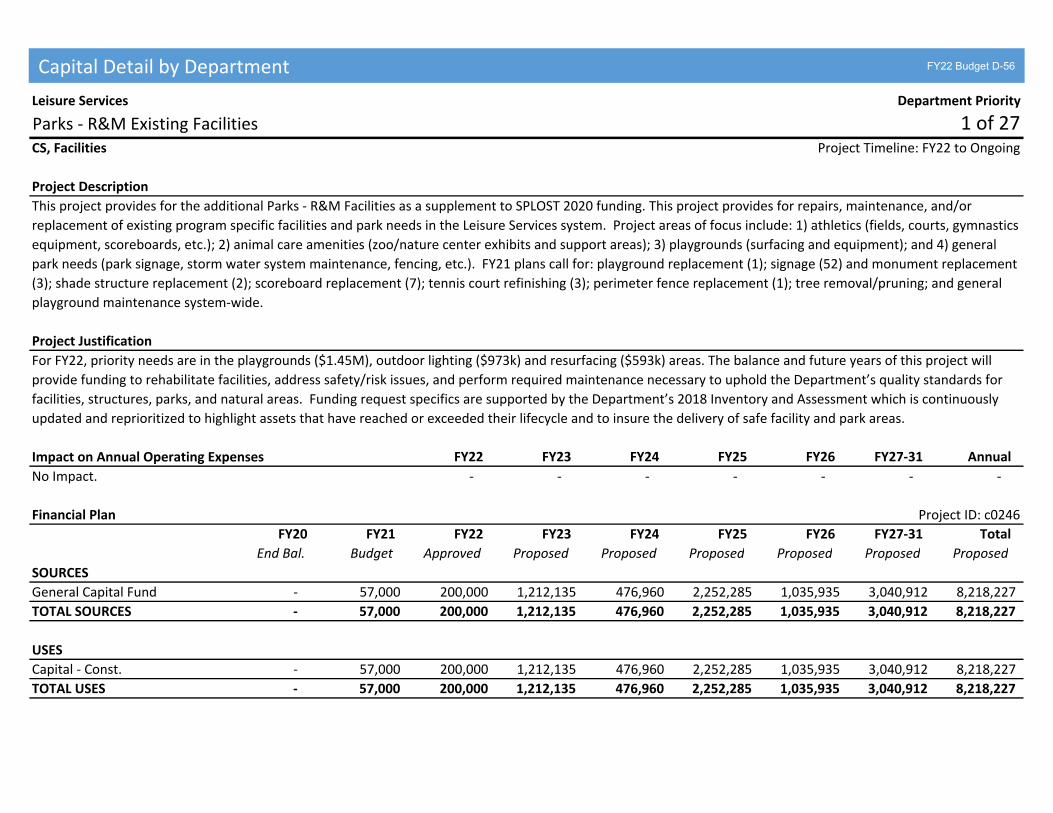
Leisure Services Department Priority
Parks ‐ R&M Existing Facilities 1 of 27CS, Facilities Project Timeline: FY22 to Ongoing
Project Description
Project Justification
Impact on Annual Operating Expenses FY22 FY23 FY24 FY25 FY26 FY27‐31 Annual
‐ ‐ ‐ ‐ ‐ ‐ ‐
Financial Plan Project ID: c0246
FY20 FY21 FY22 FY23 FY24 FY25 FY26 FY27‐31 Total
End Bal. Budget Approved Proposed Proposed Proposed Proposed Proposed Proposed
SOURCES
General Capital Fund ‐ 57,000 200,000 1,212,135 476,960 2,252,285 1,035,935 3,040,912 8,218,227
TOTAL SOURCES ‐ 57,000 200,000 1,212,135 476,960 2,252,285 1,035,935 3,040,912 8,218,227
USES
Capital ‐ Const. ‐ 57,000 200,000 1,212,135 476,960 2,252,285 1,035,935 3,040,912 8,218,227
TOTAL USES ‐ 57,000 200,000 1,212,135 476,960 2,252,285 1,035,935 3,040,912 8,218,227
This project provides for the additional Parks ‐ R&M Facilities as a supplement to SPLOST 2020 funding. This project provides for repairs, maintenance, and/or
replacement of existing program specific facilities and park needs in the Leisure Services system. Project areas of focus include: 1) athletics (fields, courts, gymnastics
equipment, scoreboards, etc.); 2) animal care amenities (zoo/nature center exhibits and support areas); 3) playgrounds (surfacing and equipment); and 4) general
park needs (park signage, storm water system maintenance, fencing, etc.). FY21 plans call for: playground replacement (1); signage (52) and monument replacement
(3); shade structure replacement (2); scoreboard replacement (7); tennis court refinishing (3); perimeter fence replacement (1); tree removal/pruning; and general
playground maintenance system‐wide.
For FY22, priority needs are in the playgrounds ($1.45M), outdoor lighting ($973k) and resurfacing ($593k) areas. The balance and future years of this project will
provide funding to rehabilitate facilities, address safety/risk issues, and perform required maintenance necessary to uphold the Department’s quality standards for
facilities, structures, parks, and natural areas. Funding request specifics are supported by the Department’s 2018 Inventory and Assessment which is continuously
updated and reprioritized to highlight assets that have reached or exceeded their lifecycle and to insure the delivery of safe facility and park areas.
No Impact.
Capital Detail by Department FY22 Budget D-56

Leisure Services Department Priority
Pool Repairs and Renovations 2 of 27CS, Facilities Project Timeline: FY22 to Ongoing
Project Description
Project Justification
Impact on Annual Operating Expenses FY22 FY23 FY24 FY25 FY26 FY27‐31 Annual
‐ ‐ ‐ ‐ ‐ ‐ ‐
Financial Plan Project ID: c0642
FY20 FY21 FY22 FY23 FY24 FY25 FY26 FY27‐31 Total
End Bal. Budget Approved Proposed Proposed Proposed Proposed Proposed Proposed
SOURCES
General Capital Fund 37,770 50,000 150,000 330,348 142,148 238,948 14,148 350,278 1,225,870
TOTAL SOURCES 37,770 50,000 150,000 330,348 142,148 238,948 14,148 350,278 1,225,870
USES
Capital ‐ Const. 37,770 50,000 150,000 330,348 142,148 238,948 14,148 350,278 1,225,870
TOTAL USES 37,770 50,000 150,000 330,348 142,148 238,948 14,148 350,278 1,225,870
This project provides for the additional Pool Repairs and Renovations as a supplement to SPLOST 2020 funding. This project provides for repairs, maintenance and
code upgrades for the one wading pool, five swimming pools, and two splash pads operated in the Leisure Services system. Projects supported by this program
include maintenance and replacement of filtration equipment, chemical controllers, splash pad features, and aquatics elements such as diving boards, pool decks,
and liners. FY20 plans call for the replacement of: filtration pumps (3); ADA lifts (6); lifeguard stands (17); and pool covers (2). The large increase in FY23 represents
the end‐of‐life replacement for equipment at Rocksprings, Bishop, and Virginia Cofer‐Callaway Walker parks (all of which came online with new equipment in 2013).
For FY22, priority needs are in the pool liner for the Memorial Park pool ($150k). The balance and future years of this project will provide funding to rehabilitate and
renovate facilities, address safety and risk issues, and perform required maintenance necessary to uphold the Department’s quality standards for aquatic facilities
and water features. Funding request specifics are supported by the Department’s 2018 Inventory and Assessment which is continuously updated and reprioritized to
highlight assets that have reached or exceeded their lifecycle and to insure the delivery of safe aquatic facility and water feature areas.
No Impact.
Capital Detail by Department
FY22 Budget D-57

Leisure Services Department Priority
Bridge and Boardwalk Inspection and Replacement 3 of 27CS, Facilities Project Timeline: FY22 to Ongoing
Project Description
Project Justification
Impact on Annual Operating Expenses FY22 FY23 FY24 FY25 FY26 FY27‐31 Annual
‐ ‐ ‐ ‐ ‐ ‐ ‐
Financial Plan Project ID: c0727
FY20 FY21 FY22 FY23 FY24 FY25 FY26 FY27‐31 Total
End Bal. Budget Approved Proposed Proposed Proposed Proposed Proposed Proposed
SOURCES
General Capital Fund 27,697 ‐ ‐ 454,478 491,978 454,478 528,478 845,282 2,774,694
TOTAL SOURCES 27,697 ‐ ‐ 454,478 491,978 454,478 528,478 845,282 2,774,694
USES
Capital ‐ Infrastructure 27,697 ‐ ‐ 454,478 491,978 454,478 528,478 845,282 2,774,694
TOTAL USES 27,697 ‐ ‐ 454,478 491,978 454,478 528,478 845,282 2,774,694
This project provides for the additional Bridge and Boardwalk inspection and replacement as a supplement to SPLOST 2020 funding. This project provides for
professional engineering inspections, major maintenance, and lifecycle replacement for all 109 bridges, boardwalks, and observation decks in the Leisure Services
system. FY21 plans call for replacing wooden bridges at Sandy Creek Nature Center, Memorial Park, and around Lakeside Trail at Sandy Creek Park which rated poorly
in our bridge and boardwalk inspections. FY22 plans also address improvements to emergency access bridges on remote trails at Sandy Creek Park and Sandy Creek
Nature Center.
For FY22, priority needs include over 22 bridges in either a state of fair, poor, unsafe or failed conditions. The balance and future years of this project totals more
than 1.9 miles, approximately half of the bridges, the majority of boardwalks and decks covered by this project are wood structures estimated to be 25 or more years
old, and do not meet modern building code or safety requirements. Funding request specifics are supported by the Department’s annual Inventory and Assessment
conducted annually since 2015. Cost estimates include escalations as required for what are primarily limited access and environmentally sensitive wetland
construction sites. Project funding is necessary to ensure public safety and to keep the trails that these structures support fully operational.
No Impact.
Capital Detail by Department FY22 Budget D-58
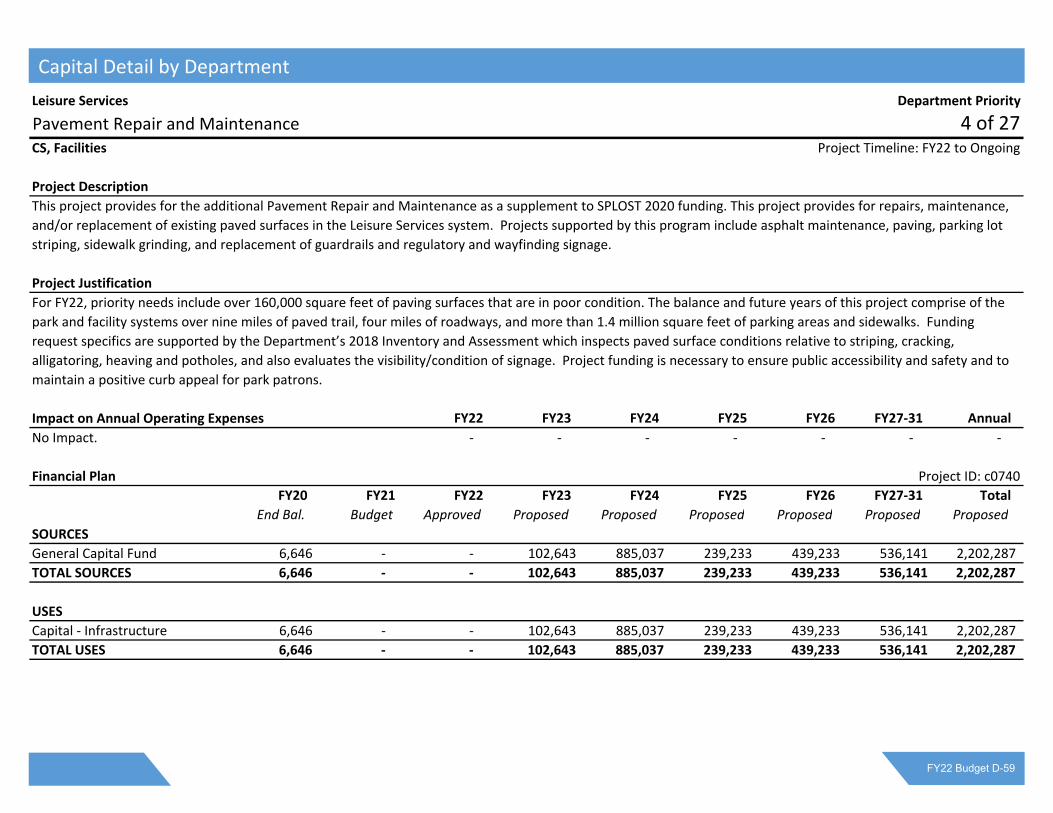
Leisure Services Department Priority
Pavement Repair and Maintenance 4 of 27CS, Facilities Project Timeline: FY22 to Ongoing
Project Description
Project Justification
Impact on Annual Operating Expenses FY22 FY23 FY24 FY25 FY26 FY27‐31 Annual
‐ ‐ ‐ ‐ ‐ ‐ ‐
Financial Plan Project ID: c0740
FY20 FY21 FY22 FY23 FY24 FY25 FY26 FY27‐31 Total
End Bal. Budget Approved Proposed Proposed Proposed Proposed Proposed Proposed
SOURCES
General Capital Fund 6,646 ‐ ‐ 102,643 885,037 239,233 439,233 536,141 2,202,287
TOTAL SOURCES 6,646 ‐ ‐ 102,643 885,037 239,233 439,233 536,141 2,202,287
USES
Capital ‐ Infrastructure 6,646 ‐ ‐ 102,643 885,037 239,233 439,233 536,141 2,202,287
TOTAL USES 6,646 ‐ ‐ 102,643 885,037 239,233 439,233 536,141 2,202,287
This project provides for the additional Pavement Repair and Maintenance as a supplement to SPLOST 2020 funding. This project provides for repairs, maintenance,
and/or replacement of existing paved surfaces in the Leisure Services system. Projects supported by this program include asphalt maintenance, paving, parking lot
striping, sidewalk grinding, and replacement of guardrails and regulatory and wayfinding signage.
For FY22, priority needs include over 160,000 square feet of paving surfaces that are in poor condition. The balance and future years of this project comprise of the
park and facility systems over nine miles of paved trail, four miles of roadways, and more than 1.4 million square feet of parking areas and sidewalks. Funding
request specifics are supported by the Department’s 2018 Inventory and Assessment which inspects paved surface conditions relative to striping, cracking,
alligatoring, heaving and potholes, and also evaluates the visibility/condition of signage. Project funding is necessary to ensure public accessibility and safety and to
maintain a positive curb appeal for park patrons.
No Impact.
Capital Detail by Department
FY22 Budget D-59

Leisure Services Department Priority
Park Equipment ‐ Replacement / Life Cycle 5 of 27CS, Equipment Project Timeline: FY22 to Ongoing
Project Description
Project Justification
Impact on Annual Operating Expenses FY22 FY23 FY24 FY25 FY26 FY27‐31 Annual
‐ ‐ ‐ ‐ ‐ ‐ ‐
Financial Plan Project ID: c0177
FY20 FY21 FY22 FY23 FY24 FY25 FY26 FY27‐31 Total
End Bal. Budget Approved Proposed Proposed Proposed Proposed Proposed Proposed
SOURCES
General Capital Fund 2,874 ‐ 75,000 433,130 237,190 575,657 223,853 1,150,597 2,695,427
TOTAL SOURCES 2,874 ‐ 75,000 433,130 237,190 575,657 223,853 1,150,597 2,695,427
USES
Capital ‐ Machinery & Equip 2,874 ‐ 75,000 433,130 237,190 575,657 223,853 1,150,597 2,695,427
TOTAL USES 2,874 ‐ 75,000 433,130 237,190 575,657 223,853 1,150,597 2,695,427
This project provides for replacement of park amenities and service equipment covering all 28 sites and 2,500 acres supported in the Leisure Services system. Park
amenities include items such as trash cans, picnic tables, benches, and barbeque grills while service equipment includes items such as fitness/computer lab
equipment, ice machines, catering kitchen appliances, and ATV's. Outdoor equipment is selected with a minimum 30 year service life.
For FY22, priority needs are in the replacement water fountains ($138k), trash cans ($96k), bleachers ($52k), audio/visual equipment ($50k), picnic tables ($45k),
appliances ($35k) and fitness equipment ($35k). The balance and future years of this project will provide funding to replace amenities and equipment supporting
service delivery which have reached the end of their serviceable life. Funding request specifics are supported by the Department’s 2018 Inventory and Assessment
which is continuously updated and reprioritized to highlight replacement needs based on equipment age, condition, and use. Support of this program allows Leisure
Services staff to replace deteriorated and broken amenities and service equipment without impact to the public.
No Impact.
Capital Detail by Department FY22 Budget D-60

Leisure Services Department Priority
Cook's Trail Improvements 6 of 27CS, Facilities Project Timeline: FY22 to FY23
Project Description
Project Justification
Impact on Annual Operating Expenses FY22 FY23 FY24 FY25 FY26 FY27‐31 Annual
3,000 3,000 3,000 3,000 3,000 15,000 3,000
New
Financial Plan Project ID: N/A
FY20 FY21 FY22 FY23 FY24 FY25 FY26 FY27‐31 Total
End. Bal. Budget Approved Proposed Proposed Proposed Proposed Proposed Proposed
SOURCES
General Capital Fund ‐ ‐ ‐ 6,524,820 ‐ ‐ ‐ 6,524,820
TOTAL SOURCES ‐ ‐ ‐ 6,524,820 ‐ ‐ ‐ ‐ 6,524,820
USES
Capital ‐ Const. ‐ ‐ ‐ 6,524,820 ‐ ‐ ‐ ‐ 6,524,820
TOTAL USES ‐ ‐ ‐ 6,524,820 ‐ ‐ ‐ ‐ 6,524,820
This project provides a long term solution to the ongoing issues relating the flooding and erosion of Cook's Trail. This project includes funding for a fully engineered
and permited reroute plan. Areas for new bridges and boardwalks will be detailed along with the development of construction and permitting packages.
Implementation of this project includes construction of new trail segements, new boardwalks, and new bridges as well as the possible retrofitting of existing trail
segments as interpretive areas for wildlife viewing. All new bridges and boardwalks will be barrier free and provide options for more inclusive transportation choices
in the future.
Cook's Trail is the oldest segment of Greenway trail on the system. It includes over 3/4 a mile of boardwalk that was constructed along Sandy Creek in the mid
1980's. The movement of Sandy Creek along with the limited life expectancy of the wooden boardwalks has created significant issues for maintenance and keeping
the trail open, especially post flood. $250,000 of SPLOST 2011 funds were spent on temporary measures to allow the trail to reopen after significant flooding. The
trail was closed again due to flooding in the winter of 2019. Additional SPLOST 2011 funds have been earmarked to provide temporary solutions that will allow the
trail to reopen until the long term reroute and reconstruction are completed. These measures and original segments of boardwalk typical fail after regular winter
and spring floods. A long term solution is necessary to keep Cook's Trail open long term.
Operating impacts.
Capital Detail by Department
FY22 Budget D-61

Leisure Services Department Priority
Improve Bear Hollow Zoo Exhibits & Visitor Amenities 7 of 27CS, Facilities Project Timeline: FY27 to FY31
Project Description
Project Justification
Impact on Annual Operating Expenses FY22 FY23 FY24 FY25 FY26 FY27‐31 Annual
‐ ‐ ‐ ‐ ‐ 89,000 89,000
Financial Plan Project ID: N/A
FY20 FY21 FY22 FY23 FY24 FY25 FY26 FY27‐31 Total
End Bal. Budget Approved Proposed Proposed Proposed Proposed Proposed Proposed
SOURCES
General Capital Fund ‐ ‐ ‐ ‐ ‐ ‐ 8,364,000 8,364,000
TOTAL SOURCES ‐ ‐ ‐ ‐ ‐ ‐ ‐ 8,364,000 8,364,000
USES
Capital ‐ Infrastructure ‐ ‐ ‐ ‐ ‐ ‐ 500,000 500,000
Capital ‐ Other ‐ ‐ ‐ ‐ ‐ ‐ 250,000 250,000
Capital ‐ Facilities ‐ ‐ ‐ ‐ ‐ ‐ 5,614,000 5,614,000
Capital ‐ Site Improvements ‐ ‐ ‐ ‐ ‐ ‐ 2,000,000 2,000,000
TOTAL USES ‐ ‐ ‐ ‐ ‐ ‐ ‐ 8,364,000 8,364,000
This project provides supplemental funding to the Bear Hollow Zoo Improvements project funded through SPLOST 2020. The SPLOST 2020 project provides basic
infrastructure and enclosure improvements that bring the zoo into compliance with AZA and USDA standards. This project supplements those funds so that further
improvements can be made to the zoo. This project includes back of house access and animal care improvements, a new entry/educational plaza and building that
provide office space, restrooms, and a gift shop. Improvements to interpretive materials and signage will increase the educational impact and improve visitor
experience.
Bear Hollow Zoo is a community fixture and is loved by people of all ages in our community. Over 5,000 children visit the zoo annually just from school visits alone.
Stronger educational and interpretive components for the zoo provides an enhanced user experience that provides lifelong learning opportunities for the whole
community. The SPLOST 2020 proposal represents only a fraction of the needed funding to bring the zoo up to modern standards and ensure long term sustainability
of infrastructure and exhibits. Without full funding of the Zoo Improvements project, the zoo stands to continue drain ongoing maintenance dollars as well as inhibit
access and intepretation for citizens of all ages and abilities.
Operating: $89.0K per year
Capital Detail by Department FY22 Budget D-62

Leisure Services Department Priority
Ben Burton Park Repairs and Renovations 8 of 27CS, Facilities Project Timeline: FY26 to FY26
Project Description
Project Justification
Impact on Annual Operating Expenses FY22 FY23 FY24 FY25 FY26 FY27‐31 Annual
22,000 110,000 22,000
Financial Plan Project ID: N/A
FY20 FY21 FY22 FY23 FY24 FY25 FY26 FY27‐31 Total
End Bal. Budget Approved Proposed Proposed Proposed Proposed Proposed Proposed
SOURCES
General Capital Fund ‐ ‐ ‐ ‐ ‐ ‐ 2,223,800 ‐ 2,223,800
TOTAL SOURCES ‐ ‐ ‐ ‐ ‐ ‐ 2,223,800 ‐ 2,223,800
USES
Capital ‐ Other ‐ ‐ ‐ ‐ ‐ ‐ 2,223,800 ‐ 2,223,800
TOTAL USES ‐ ‐ ‐ ‐ ‐ ‐ 2,223,800 ‐ 2,223,800
This project provides for execution of the Mayor and Commission approved master plan for Ben Burton Park located off of Mitchell Bridge Road within western
Clarke County. The project will involve development phases beginning in FY26 with a reconfiguration of the entrance and parking areas to provide enhanced safety
and visibility. The subsequent phases will include the installation of the following site amenities: picnic pavilion; playground; and dog park facilities.
Currently, Ben Burton Park is the sole operating park on the west side of Athens and has limited public utilization because it is highly undeveloped and lacks core
amenities. Implementation of the master plan will greatly enhance the limited recreational opportunities and services presently available to the citizens within
western Clarke County. Infrastructure improvements will also help generate revenue through rental, festival, and special event activities. In addition, the project will
rectify existing design deficiencies relative to traffic safety, ADA compliance, storm water runoff, and erosion.
Operating expenses: $26.0K per year
Estimated revenue of approximately $4.0K per year
Capital Detail by Department
FY22 Budget D-63

Leisure Services Department Priority
Create a Property Boundary Program 9 of 27CS, General Project Timeline: FY24 to FY28
Project Description
Project Justification
Impact on Annual Operating Expenses FY22 FY23 FY24 FY25 FY26 FY27‐31 Annual
‐ ‐ ‐ ‐ ‐ ‐ ‐
Financial Plan Project ID: c0741
FY20 FY21 FY22 FY23 FY24 FY25 FY26 FY27‐31 Total
End Bal. Budget Approved Proposed Proposed Proposed Proposed Proposed Proposed
SOURCES
General Capital Fund ‐ ‐ ‐ ‐ 50,000 50,000 50,000 100,000 250,000
TOTAL SOURCES ‐ ‐ ‐ ‐ 50,000 50,000 50,000 100,000 250,000
USES
Capital ‐ Other ‐ ‐ ‐ ‐ 50,000 50,000 50,000 100,000 250,000
TOTAL USES ‐ ‐ ‐ ‐ 50,000 50,000 50,000 100,000 250,000
This project provides for surveying/permanently marking all property and updating/consolidating deeds for all 2,500+ acres owned by ACCUG and managed by the
Leisure Services Department. Project completion will establish boundary lines for the integration of property restrictions into the GIS planning database and will
provide critical data for park planning and development. This project will be phased over multiple years by systematically addressing the property boundaries.
Properties comprising the Leisure Services system encompass more than 50 miles of boundaries. Development along park boundaries has created issues ranging
from direct property encroachment to the creation of unofficial or illegal access points. Unmarked property boundaries hamper assessment and response to
boundary related issues. Further complicating matters, ongoing incremental property acquisition as part of park and greenway expansion has led to some sites being
comprised of upwards of 20 parcels which need to be combined. This program will allow for better land management and provide accurate base data for park
planning and development.
No Impact.
Capital Detail by Department FY22 Budget D-64

Leisure Services Department Priority
Memorial Park Renovations 10 of 27CS, Facilities Project Timeline: FY27 to FY31
Project Description
Project Justification
Impact on Annual Operating Expenses FY22 FY23 FY24 FY25 FY26 FY27‐31 Annual
‐ ‐ ‐ ‐ 10,000 50,000 10,000
Financial Plan Project ID: N/A
FY20 FY21 FY22 FY23 FY24 FY25 FY26 FY27‐31 Total
End Bal. Budget Approved Proposed Proposed Proposed Proposed Proposed Proposed
SOURCES
General Capital Fund ‐ ‐ ‐ ‐ ‐ ‐ 1,519,000 9,331,000 10,850,000
TOTAL SOURCES ‐ ‐ ‐ ‐ ‐ 1,519,000 9,331,000 10,850,000
USES
Capital ‐ Infrastructure ‐ ‐ ‐ ‐ ‐ ‐ ‐ 500,000 500,000
Capital ‐ Other ‐ ‐ ‐ ‐ ‐ ‐ ‐ 350,000 350,000
Capital ‐ Site Improvements ‐ ‐ ‐ ‐ ‐ ‐ 1,519,000 8,481,000 10,000,000
TOTAL USES ‐ ‐ ‐ ‐ ‐ ‐ 1,519,000 9,331,000 10,850,000
This project funds Master Plan implementation for Phase I & II of the Memorial Park Project. It supplements SPLOST 2020 funds for Phase I of the project. This
project includes the following: Continued stormwater, water, and sewer installation and replacement; upgrades to picnic and restroom facilities in the park;
playground replacement; outdoor gathering spaces; improved pedestrian cirulation; renovation to the existing pool and pool house, improved vehicular circulation,
and additional parking that includes but is not limited to the construction of a parking deck.
Water line breaks, electrical failures, and clogged sewer lines have consistently had negative impacts on patron services such as restroom availability. The installation
of new sewer lines will eliminate flushing of the pool into stormwater infrastructure as well as eliminate sewer backups. The current playground is a conglomeration
of various play elements salvaged from other structures. The restrooms do not meet current codes and need updating. Parking at Memorial Park is inadequate,
frequently resulting in park patrons parking in undesignated areas and surrounding neighborhoods. This project will provide funding to improve patron accessibility
and safety, park sustainability, and maintenance efficiency by reducing current reactive emergency maintenance requirements.
Operating expenses
Capital Detail by Department
FY22 Budget D-65

Leisure Services Department Priority
Bishop Park Renovations 11 of 27CS, Facilities Project Timeline: FY27 to FY31
Project Description
Project Justification
Impact on Annual Operating Expenses FY22 FY23 FY24 FY25 FY26 FY27‐31 Annual
‐ ‐ ‐ ‐ ‐ 100,000 10,000
Financial Plan Project ID: N/A
FY20 FY21 FY22 FY23 FY24 FY25 FY26 FY27‐31 Total
End Bal. Budget Approved Proposed Proposed Proposed Proposed Proposed Proposed
SOURCES
General Capital Fund ‐ ‐ ‐ ‐ ‐ ‐ 20,500,000 20,500,000
TOTAL SOURCES ‐ ‐ ‐ ‐ ‐ ‐ ‐ 20,500,000 20,500,000
USES
Capital ‐ Const. ‐ ‐ ‐ ‐ ‐ ‐ 12,500,000 12,500,000
Capital ‐ Infrastructure ‐ ‐ ‐ ‐ ‐ ‐ 1,500,000 1,500,000
Capital ‐ Other ‐ ‐ ‐ ‐ ‐ ‐ 1,500,000 1,500,000
Capital ‐ Site Improvements ‐ ‐ ‐ ‐ ‐ ‐ 5,000,000 5,000,000
TOTAL USES ‐ ‐ ‐ ‐ ‐ ‐ ‐ 20,500,000 20,500,000
This project provides for implementation of the Bishop Park master plan as a supplement to SPLOST 2020 funding. The project will involve: conversion of the existing
covered tennis facility and adjacent grounds into an event space; improved pedestrian circulation, basic renovations to the gym facility, demolition of the derilict
picnic shelter; additional parking; safety enhancements along the Hawthorne Ave Corridor; and improvements to aged water, sewer, and storm water infrastructure.
The renovated facility will provide code compliant space for: gymnastics programming; administrative offices; and the provision of large scale events such as the
The majority of the buildings at Bishop Park date from the 1970’s and do not meet modern code requirements, programmatic use/space demands or ADA
compliance. The park's infrastructure is failing, creating flooding and safety issues for park patrons. SPLOST 2020 funds are addressing only a portion of this project.
This request represents the balance of master plan implementation. This park experiences the highest degree of patron utilization within the Leisure Services system
and is highly regarded and strongly enjoyed by the general public.
Operating expenses
Capital Detail by Department FY22 Budget D-66

Leisure Services Department Priority
Dudley Park Improvements 12 of 27CS, Facilities Project Timeline: FY27 to FY31
Project Description
Project Justification
Impact on Annual Operating Expenses FY22 FY23 FY24 FY25 FY26 FY27‐31 Annual
‐ ‐ ‐ ‐ ‐ 43,000 43,000
Financial Plan Project ID: c0621
FY20 FY21 FY22 FY23 FY24 FY25 FY26 FY27‐31 Total
End Bal. Budget Approved Proposed Proposed Proposed Proposed Proposed Proposed
SOURCES
General Capital Fund ‐ ‐ ‐ ‐ ‐ ‐ 5,164,000 5,164,000
TOTAL SOURCES ‐ ‐ ‐ ‐ ‐ ‐ ‐ 5,164,000 5,164,000
USES
Capital ‐ Site Improvements ‐ ‐ ‐ ‐ ‐ ‐ ‐ 5,164,000 5,164,000
TOTAL USES ‐ ‐ ‐ ‐ ‐ ‐ ‐ 5,164,000 5,164,000
This project provides for further implementation of the Dudley Park Master Plan. SPLOST 2011 funding will provide for a pavilion and restroom facilities. Limited
accessible parking, completion of the ampitheater bowl and access, and a concrete platform for a future stage area. This capital project will provide funding to
continue moving through the high priority projects on the Dudley Park project list. They include completion of construction of the stage enclosure and associated
amenities, lighting, concession area, multi‐generational playground, food truck area, stormwater mangement, additional pedestrian circulation, and development of
areas of the park along Mulberry and Peter Street.
Dudley Park’s proximity to downtown coupled with the beautiful, general park setting makes it a special draw to the many people who visit this part of the county.
While Dudley Park has served as a passive park with limited utilization for many years, implementation of the park improvement plan will maximize the significant
untapped potential and utilization of this park environment. Dudley Park is a part of the River District and with the development of the Firefly Bridge over Trail Creek
and final plan implementation, it will be a hub of activity for the community. This will create the potential for revenue generation through rental, festival, and special
event activities.
Operating: $63.0K per year
Estimated revenue of approximately $20.0K per year
Capital Detail by Department
FY22 Budget D-67

Leisure Services Department Priority
Sandy Creek Park Improvements 13 of 27CS, Facilities Project Timeline: FY27 to FY31
Project Description
Project Justification
Impact on Annual Operating Expenses FY22 FY23 FY24 FY25 FY26 FY27‐31 Annual
‐ ‐ ‐ ‐ ‐ 129,000 129,000
New
Financial Plan Project ID: N/A
FY20 FY21 FY22 FY23 FY24 FY25 FY26 FY27‐31 Total
End. Bal. Budget Approved Proposed Proposed Proposed Proposed Proposed Proposed
SOURCES
General Capital Fund ‐ ‐ ‐ ‐ ‐ ‐ 6,703,000 6,703,000
TOTAL SOURCES ‐ ‐ ‐ ‐ ‐ ‐ ‐ 6,703,000 6,703,000
USES
Capital ‐ Const. ‐ ‐ ‐ ‐ ‐ ‐ ‐ 6,703,000 6,703,000
TOTAL USES ‐ ‐ ‐ ‐ ‐ ‐ ‐ 6,703,000 6,703,000
This project is a continuation of the SPLOST 2011 project dedicated to Sandy Creek Park. The items listed are not a part of the regular Leisure Services R&M Capital
Project line item. The following elements are part of the phase two project: lakeside access and amenity improvements such as improved canoe and kayak rental
access as well as concessionaire space; playground replacements and upgrades; pavilion renovations, ADA compliance for restroom and shower facilities; beach
playground enhacement; campground renovation; ingress and egress improvments through construction of a secondary entry/exit road.
This project provides continuation in funding that addresses some of the Park's long standing issues while enhancing safety, user experience, and convenience. In
addition, it brings back the once popular camping area through renovations that will bring the campsites up to modern standards and provide a space for a
campground host to assist with operations. This project increases the Park's ability to generate revenue through concessionaires for equipment rentals, food, and
camping supplies. The addition of an additional entrance and exit will alleviate issues relating to visitor safety and experience for park users during large events
where the current single entry points create long waits and challenging traffic issues on Bob Holman road and highway 441. Sandy Creek Park is Leisure Service's
premier large event site, hosting department special events as well as those hosted by large groups such as the Cancer Foundation Triathalon. These events routinely
attract over 1,000 visitors to the park.
Operating expenses
Capital Detail by Department FY22 Budget D-68

Leisure Services Department Priority
Satterfield Park Improvements 14 of 27CS, Facilities Project Timeline: FY27 to FY31
Project Description
Project Justification
Impact on Annual Operating Expenses FY22 FY23 FY24 FY25 FY26 FY27‐31 Annual
‐ ‐ ‐ ‐ ‐ 60,000 60,000
New
Financial Plan Project ID: N/A
FY20 FY21 FY22 FY23 FY24 FY25 FY26 FY27‐31 Total
End. Bal. Budget Approved Proposed Proposed Proposed Proposed Proposed Proposed
SOURCES
General Capital Fund ‐ ‐ ‐ ‐ ‐ ‐ ‐ 4,697,000 4,697,000
TOTAL SOURCES ‐ ‐ ‐ ‐ ‐ ‐ ‐ 4,697,000 4,697,000
USES
Capital ‐ Const. ‐ ‐ ‐ ‐ ‐ ‐ ‐ 4,697,000 4,697,000
TOTAL USES ‐ ‐ ‐ ‐ ‐ ‐ ‐ 4,697,000 4,697,000
This project includes the following elements: reconfiguration of original restroom space to multi‐use space; field reconfiguration and renovations including
installation of irrigation and new field surfacing; drainage improvements; stormwater management; parking lot improvements; new lighting; PA system;
reconfiguration of original restrooms; and lightning detection system.
Satterfield Park was established in the 1960's and sustained expansions in 1983, 1992, and 2011. The most recent funding provided for construciton of a new
concession stand and restroom area along with improvements to dugouts, scoreboxes, backstops, and bleachers. SPLOST and capital funds provided for renovation
of fields 5 and 6 but the remaining fields were not renovated and are in poor condition. None of the fields are irrigated, providing significant challenges in keeping
the fields up to standard. In addition, drainage issues create flooding on the fields to the point that geese have established residency in the park. The parking area is
alligatoring and in need of milling and repaving.
Operating increase: $60.0 k per year
Capital Detail by Department
FY22 Budget D-69

Leisure Services Department Priority
Southeast Clarke Park Improvements 15 of 27CS, Facilities Project Timeline: FY26 to FY30
Project Description
Project Justification
Impact on Annual Operating Expenses FY22 FY23 FY24 FY25 FY26 FY27‐31 Annual
52,000 260,000 52,000
New
Financial Plan Project ID: N/A
FY20 FY21 FY22 FY23 FY24 FY25 FY26 FY27‐31 Total
End. Bal. Budget Approved Proposed Proposed Proposed Proposed Proposed Proposed
SOURCES
General Capital Fund ‐ ‐ ‐ ‐ ‐ ‐ 2,330,000 14,317,000 16,647,000
TOTAL SOURCES ‐ ‐ ‐ ‐ ‐ ‐ 2,330,000 14,317,000 16,647,000
USES
Capital ‐ Const. ‐ ‐ ‐ ‐ ‐ ‐ 2,330,000 14,317,000 16,647,000
TOTAL USES ‐ ‐ ‐ ‐ ‐ ‐ 2,330,000 14,317,000 16,647,000
This project reflects the implementation of the Southeast Clarke Park Master Plan. The project elements were carefully vetted through stakeholders and
representatives from athletic groups that are active in the park. This project would fund the construction of the following park elements: Reconfiguration of two
existing field platforms into one large multi‐use field platform; 400 meter all surface running track including facilites and equipment to accomodate standard running
and field events; 12 pickleball courts; 40,000 square foot street course addition to the existing skate park.
Recreational track and field is a growing activity in the Athens‐Clarke County community. There are no formal track facilities to house this activitiy. This project
would provide the facilities necessary to provide adequate and safe facilities for this sport to grow and continue serving the community. The existing small field
platforms are not utilized due to incompatabilty with programming needs, combining into one large field provides flexible options for programs and activities that are
currently suffer from a shortage of large multi‐use field platforms. Pickleball is a growing sport in the community that is actively increasing in numbers. Additional
pickleball courts will make Southeast Clarke Park the hub for the sport as well as providing opportunities for tournaments that attract players from around the
region. The Athens‐Skate Park has long been a draw for people of all ages, and the addition of a street course will help keep the relevancy of the park for the future.
Operating expenses
Capital Detail by Department FY22 Budget D-70

Leisure Services Department Priority
Virginia Callaway‐Cofer Walker Park Improvements 16 of 27CS, Facilities Project Timeline: FY27 to FY31
Project Description
Project Justification
Impact on Annual Operating Expenses FY22 FY23 FY24 FY25 FY26 FY27‐31 Annual
‐ ‐ ‐ ‐ ‐ 50,000 50,000
New
Financial Plan Project ID: N/A
FY20 FY21 FY22 FY23 FY24 FY25 FY26 FY27‐31 Total
End. Bal. Budget Approved Proposed Proposed Proposed Proposed Proposed Proposed
SOURCES
General Capital Fund ‐ ‐ ‐ ‐ ‐ ‐ ‐ 4,440,000 4,440,000
TOTAL SOURCES ‐ ‐ ‐ ‐ ‐ ‐ ‐ 4,440,000 4,440,000
USES
Capital ‐ Const. ‐ ‐ ‐ ‐ ‐ ‐ ‐ 4,440,000 4,440,000
TOTAL USES ‐ ‐ ‐ ‐ ‐ ‐ ‐ 4,440,000 4,440,000
This project provides further implementation of the park masterplan and includes the following elements: enhancements to the mountain bike pump track and
associated skills course; large pavilion with restrooms; lighted basketball court; playground with restrooms; additional parking spaces; stormwater management;
traffic calming devices.
The mountain bike pump track provides a skill course that allows beginner and experienced mountainbikers to hone their skills. The adjacent basketball court and
pavilion will promote crossover among park user groups and provide a positive activity outlet for area youth. These enhancements activate the lower area of the
park. The current parking facilities at the park are inadequate and park users frequently have no place to park when activities are scheduled at the park. Completing
the parking facilities shown on the master plan will alleviate this issue.
Operating expenses
Capital Detail by Department
FY22 Budget D-71
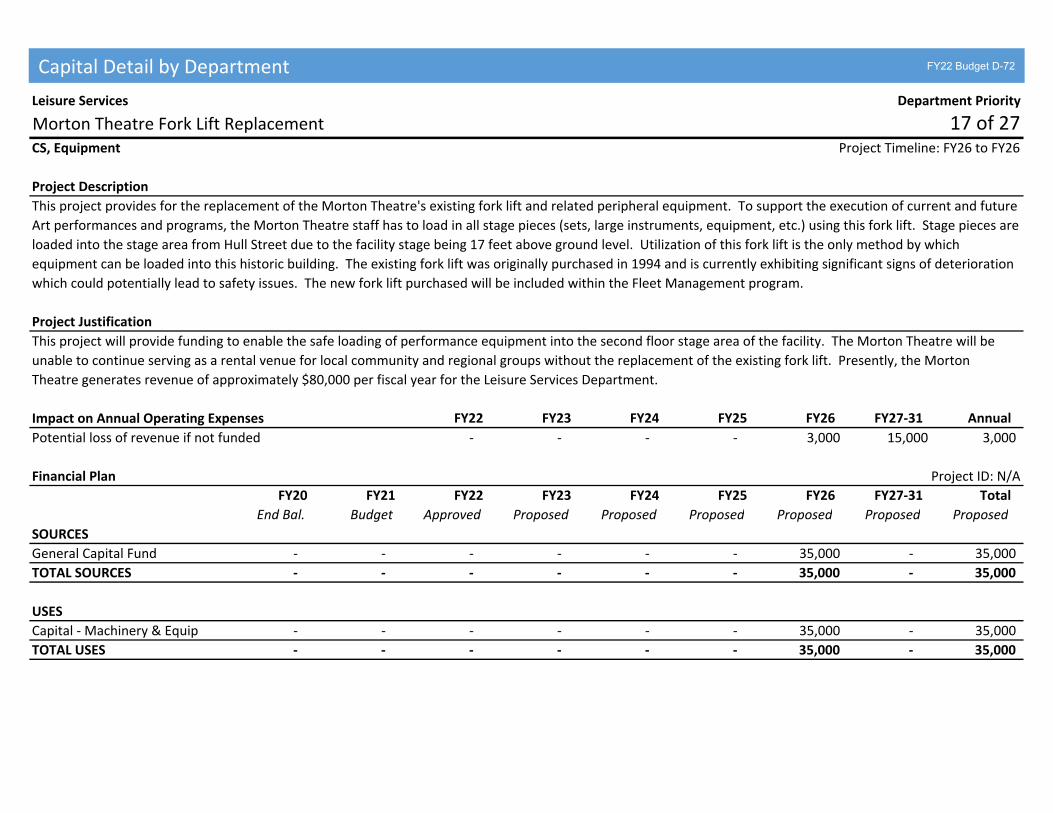
Leisure Services Department Priority
Morton Theatre Fork Lift Replacement 17 of 27CS, Equipment Project Timeline: FY26 to FY26
Project Description
Project Justification
Impact on Annual Operating Expenses FY22 FY23 FY24 FY25 FY26 FY27‐31 Annual
‐ ‐ ‐ ‐ 3,000 15,000 3,000
Financial Plan Project ID: N/A
FY20 FY21 FY22 FY23 FY24 FY25 FY26 FY27‐31 Total
End Bal. Budget Approved Proposed Proposed Proposed Proposed Proposed Proposed
SOURCES
General Capital Fund ‐ ‐ ‐ ‐ ‐ ‐ 35,000 ‐ 35,000
TOTAL SOURCES ‐ ‐ ‐ ‐ ‐ ‐ 35,000 ‐ 35,000
USES
Capital ‐ Machinery & Equip ‐ ‐ ‐ ‐ ‐ ‐ 35,000 ‐ 35,000
TOTAL USES ‐ ‐ ‐ ‐ ‐ ‐ 35,000 ‐ 35,000
This project provides for the replacement of the Morton Theatre's existing fork lift and related peripheral equipment. To support the execution of current and future
Art performances and programs, the Morton Theatre staff has to load in all stage pieces (sets, large instruments, equipment, etc.) using this fork lift. Stage pieces are
loaded into the stage area from Hull Street due to the facility stage being 17 feet above ground level. Utilization of this fork lift is the only method by which
equipment can be loaded into this historic building. The existing fork lift was originally purchased in 1994 and is currently exhibiting significant signs of deterioration
which could potentially lead to safety issues. The new fork lift purchased will be included within the Fleet Management program.
This project will provide funding to enable the safe loading of performance equipment into the second floor stage area of the facility. The Morton Theatre will be
unable to continue serving as a rental venue for local community and regional groups without the replacement of the existing fork lift. Presently, the Morton
Theatre generates revenue of approximately $80,000 per fiscal year for the Leisure Services Department.
Potential loss of revenue if not funded
Capital Detail by Department FY22 Budget D-72

Leisure Services Department Priority
Trails & Open Spaces Compact Track Loader Equipment 18 of 27AI, Equipment Project Timeline: FY26 to FY26
Project Description
Project Justification
Impact on Annual Operating Expenses FY22 FY23 FY24 FY25 FY26 FY27‐31 Annual
‐ ‐ ‐ ‐ 4,000 20,000 4,000
Financial Plan Project ID: N/A
FY20 FY21 FY22 FY23 FY24 FY25 FY26 FY27‐31 Total
End Bal. Budget Approved Proposed Proposed Proposed Proposed Proposed Proposed
SOURCES
General Capital Fund ‐ ‐ ‐ ‐ ‐ ‐ 35,000 ‐ 35,000
TOTAL SOURCES ‐ ‐ ‐ ‐ ‐ ‐ 35,000 ‐ 35,000
USES
Capital ‐ Machinery & Equip ‐ ‐ ‐ ‐ ‐ ‐ 35,000 ‐ 35,000
TOTAL USES ‐ ‐ ‐ ‐ ‐ ‐ 35,000 ‐ 35,000
This project provides for the purchase of a mini‐tracked excavator (similar to a Toro Dingo) to be utilized by the Trails & Open Spaces staff. This much needed
equipment will allow for significantly improved management and safety of existing and proposed greenways, trails, and open space areas throughout the community.
This piece of landscape management equipment is able to regrade trails washed out due to storms, remove fallen trees, and deliver soil stabilization material such as
riprap and gravel. The project also provides for the purchase of several attachments to include a bucket, a grabbing bucket, and an auger bit for the installation of
fence posts and sign posts.
This project will provide funding to: improve land management resources; enhance public safety within the trail system; increase staff efficiencies by reducing
maintenance activity time; and reduce the usage of subcontractors for maintenance work. The Trails & Open Spaces staff services the many miles of trails at all parks
and facilities throughout the Leisure Services Department. Staff performs regular maintenance on all greenway and Firefly trail segments, Dudley Park, Ben Burton
Park, Oconee Riverside Parks, Cook's Trail, Lakeside Trail, Trail Creek Trails, Sandy Creek Nature Center Trails, and the Birchmore Trail.
Indirect expenses
Capital Detail by Department
FY22 Budget D-73

Leisure Services Department Priority
New Athens Creative Theatre Facility 19 of 27AI, Facilities Project Timeline: FY26 to FY30
Project Description
Project Justification
Impact on Annual Operating Expenses FY22 FY23 FY24 FY25 FY26 FY27‐31 Annual
‐ ‐ ‐ ‐ 260,000 1,300,000 260,000
New
Financial Plan Project ID: N/A
FY20 FY21 FY22 FY23 FY24 FY25 FY26 FY27‐31 Total
End. Bal. Budget Approved Proposed Proposed Proposed Proposed Proposed Proposed
SOURCES
General Capital Fund ‐ ‐ ‐ ‐ ‐ ‐ 2,500,000 10,055,000 12,555,000
TOTAL SOURCES ‐ ‐ ‐ ‐ ‐ ‐ 2,500,000 10,055,000 12,555,000
USES
Capital ‐ Const. ‐ ‐ ‐ ‐ ‐ ‐ 2,500,000 10,055,000 12,555,000
TOTAL USES ‐ ‐ ‐ ‐ ‐ ‐ 2,500,000 10,055,000 12,555,000
This project involves moving the Athens Creative Theater (ACT) from Quinn Hall to a permanent facility elsewhere in Athens‐Clarke County. The new facility will
house a performance theatre space, administrative offices for ACT staff members, teaching and studio spaces, and a scene shop with prop storage space. This project
would require the purchase of an existing building to provide approximately 10‐12,000 square foot of space that accomodates seating for approximately 250 people.
ACT was founded in 1966 as a community theater program focused on providing theatre opportunities for youth, adults, and people with disabilities. ACT's current
home, Quinn Hall is located inside of the Memorial Park administrative building. The space and parking are inadequate for the program's needs and there are
conflicts between park and theater needs for space. The new facility will alleviate these issues and provide adequate support of ACT's productions and allow for
expansion and growth of the community theatre opportunities withing Athens‐Clarke County.
Operating expenses
Capital Detail by Department FY22 Budget D-74

Leisure Services Department Priority
Portable Soccer Pitch System 20 of 27AI, Equipment Project Timeline: FY27 to FY27
Project Description
Project Justification
Impact on Annual Operating Expenses FY22 FY23 FY24 FY25 FY26 FY27‐31 Annual
‐ ‐ ‐ ‐ ‐ 4,000 4,000
Financial Plan Project ID: N/A
FY20 FY21 FY22 FY23 FY24 FY25 FY26 FY27‐31 Total
End Bal. Budget Approved Proposed Proposed Proposed Proposed Proposed Proposed
SOURCES
General Capital Fund ‐ ‐ ‐ ‐ ‐ ‐ 35,000 35,000
TOTAL SOURCES ‐ ‐ ‐ ‐ ‐ ‐ ‐ 35,000 35,000
USES
Capital ‐ Machinery & Equip ‐ ‐ ‐ ‐ ‐ ‐ ‐ 35,000 35,000
TOTAL USES ‐ ‐ ‐ ‐ ‐ ‐ ‐ 35,000 35,000
This project provides for the purchase of a modular Soccer Field "Pitch" system (SFP) which can be assembled at any Leisure Service facility or remote location to
create an enclosed soccer field with 4 foot high walls. The walls allow the SFP to be assembled in a variety of locations such as parking lots or at the edges of
unusable spaces due to grading variances. This project is inspired by the documented success of similar SFP systems utilized within Atlanta, GA. which have engaged
the community and increased the levels of outdoor play. The project also provides for the purchase of a trailer for staff to store and transport the SFP system.
Modular SFP systems are becoming popular in urban areas where field space areas at park locations are limited. Atlanta United has been utilizing similar SFP systems
at bus stations and parking lots to realize increased levels of recreational activity accessibility and citizen outdoor play. The portable SFP system will enable the
Leisure Services Department to move the system around Athens to increase programming possibilities and to encourage play. The system could also provide
opportunities for rental activities similar to the Showmobile stage should a tournament or group have an interest in using the equipment.
Indirect expenses.
Capital Detail by Department
FY22 Budget D-75

Leisure Services Department Priority
East Athens Community Center‐Space Modernization 21 of 27AI, Facilities Project Timeline: FY27 to FY28
Project Description
Project Justification
Impact on Annual Operating Expenses FY22 FY23 FY24 FY25 FY26 FY27‐31 Annual
‐ ‐ ‐ ‐ ‐ ‐ ‐
New
Financial Plan Project ID: N/A
FY20 FY21 FY22 FY23 FY24 FY25 FY26 FY27‐31 Total
End Bal. Budget Approved Proposed Proposed Proposed Proposed Proposed Proposed
SOURCES
General Capital Fund ‐ ‐ ‐ ‐ ‐ ‐ ‐ 7,000,000 7,000,000
TOTAL SOURCES ‐ ‐ ‐ ‐ ‐ ‐ ‐ 7,000,000 7,000,000
USES
Capital ‐ Machinery & Equip ‐ ‐ ‐ ‐ ‐ ‐ ‐ 7,000,000 7,000,000
TOTAL USES ‐ ‐ ‐ ‐ ‐ ‐ ‐ 7,000,000 7,000,000
This project will address the need to renovate and update East Athens to a more modern space to better serve the community. Upgrading and modernizing each of
the 3 floors inside the community center to provide spaces that better fit current and future needs while allowing for innovative programming that engages more of
our community. Updates to the exterior of the building will create a welcoming and safe atmosphere while allowing for increased use of outdoor spaces for
programs and self‐directed activities.
East Athens Community Center is a fixture for not only East Athens, but also the entire community. The facility hosts programs that attract community members of
all ages from all geographical areas of Athens. This includes everyone from seniors, to children, to people with disabilities. The building opened in 1970 and was last
renovated as part of a SPLOST 2000 project. By providing a safe and welcoming space, the East Athens Community Center can continue to serve our population
effectively for many years to come.
No impact.
Capital Detail by Department FY22 Budget D-76

Leisure Services Department Priority
Lay Park Community Center‐Space Modernization 22 of 27AI, Facilities Project Timeline: FY27 to FY28
Project Description
Project Justification
Impact on Annual Operating Expenses FY22 FY23 FY24 FY25 FY26 FY27‐31 Annual
‐ ‐ ‐ ‐ ‐ ‐ ‐
New
Financial Plan Project ID: N/A
FY20 FY21 FY22 FY23 FY24 FY25 FY26 FY27‐31 Total
End Bal. Budget Approved Proposed Proposed Proposed Proposed Proposed Proposed
SOURCES
General Capital Fund ‐ ‐ ‐ ‐ ‐ ‐ ‐ 7,000,000 7,000,000
TOTAL SOURCES ‐ ‐ ‐ ‐ ‐ ‐ ‐ 7,000,000 7,000,000
USES
Capital ‐ Machinery & Equip ‐ ‐ ‐ ‐ ‐ ‐ ‐ 7,000,000 7,000,000
TOTAL USES ‐ ‐ ‐ ‐ ‐ ‐ ‐ 7,000,000 7,000,000
This project will address the need to renovate and update Lay Park to a more modern space to better serve the community. Upgrading and modernizing each of the 3
floors inside the community center to provide spaces that better fit current and future needs while allowing for innovative programming that engages more of our
community. Updates to the exterior of the building will create a welcoming and safe atmosphere while allowing for increased use of outdoor spaces for programs
and self‐directed activities.
Lay Park Community Center is a fixture for not only north and downtown Athens, but also the entire community. The facility hosts programs that attract community
members of all ages from all geographical areas of Athens. This includes everyone from seniors, to children, to people with disabilities. The building opened in 1970
and was last renovated as part of a SPLOST 2000 project. By providing a safe and welcoming space, the East Athens Community Center can continue to serve our
population effectively for many years to come.
No impact.
Capital Detail by Department
FY22 Budget D-77

Leisure Services Department Priority
Cooks Property Master Plan 23 of 27CS, Master Planning Project Timeline: FY22 to FY23
Project Description
Project Justification
Impact on Annual Operating Expenses FY22 FY23 FY24 FY25 FY26 FY27‐31 Annual
‐ ‐ ‐ ‐ ‐ ‐ ‐
New
Financial Plan Project ID: N/A
FY20 FY21 FY22 FY23 FY24 FY25 FY26 FY27‐31 Total
End Bal. Budget Approved Proposed Proposed Proposed Proposed Proposed Proposed
SOURCES
General Capital Fund ‐ ‐ ‐ 50,000 ‐ ‐ ‐ ‐ 50,000
TOTAL SOURCES ‐ ‐ ‐ 50,000 ‐ ‐ ‐ ‐ 50,000
USES
Capital ‐ Const. ‐ ‐ ‐ 50,000 ‐ ‐ ‐ ‐ 50,000
TOTAL USES ‐ ‐ ‐ 50,000 ‐ ‐ ‐ ‐ 50,000
Master plan development that would establish practical uses and identify amenities to be included that would allow this location to be open to the public for
enjoyment. The project area would cover the eastern portion of Sandy Creek Park and adjacent Cook's property, totaling over 80 acres, with the goal of enhacing the
park and availabliity of experiences and activities for park users. With no property development restrictions, this location allows Leisure Services to continue offering
a variety of ways to recreate and enjoy/explore nature. A developed Master Plan for this location will help us look at long term opportunities to enhance/expand our
services to the community.
This project helps meet public safety, facility, infrastructure, and quality of life needs for Athens‐Clarke County. Recreation opportunities at Sandy Creek Park can be
expanded and a second access point created off Nowhere Road for emergency purposes in the event of dam failure. Development of this location will also
compliment residents and businesses along the Nowhere Rd corridor. This project will enhance quality of life for all citizens.
No Impact.
Capital Detail by Department FY22 Budget D-78

Leisure Services Department Priority
Rock and Shoals Master Plan 24 of 27CS, Master Planning Project Timeline: FY22 to FY23
Project Description
Project Justification
Impact on Annual Operating Expenses FY22 FY23 FY24 FY25 FY26 FY27‐31 Annual
‐ ‐ ‐ ‐ ‐ ‐ ‐
New
Financial Plan Project ID: c0817
FY20 FY21 FY22 FY23 FY24 FY25 FY26 FY27‐31 Total
End Bal. Budget Approved Proposed Proposed Proposed Proposed Proposed Proposed
SOURCES
General Capital Fund ‐ ‐ 100,000 50,000 ‐ ‐ ‐ ‐ 150,000
TOTAL SOURCES ‐ ‐ 100,000 50,000 ‐ ‐ ‐ ‐ 150,000
USES
Capital ‐ Const. ‐ ‐ 100,000 50,000 ‐ ‐ ‐ ‐ 150,000
TOTAL USES ‐ ‐ 100,000 50,000 ‐ ‐ ‐ ‐ 150,000
Master plan development that would establish practical uses and identify amenities to be included that would allow this location to be open to the public for
enjoyment. The project area includes the entirety of the Rock and Shoals property (129 acres) and requires collaboration with Georgia Department of Natural
Resources and the ACCGov Office of Sustainability. This location allows Leisure Services to continue offering a variety of ways to responsibly conserve, enjoy, and
explore nature. A developed Master Plan for this location will help us look at opportunities to enhance/expand our services to the community, while preserving the
ecology that makes this location unique. This project would create a Master Plan to be used as the long‐term planning document.
This project helps meet public safety, facility, infrastructure, and quality of life needs for Athens‐Clarke County. It will identify and provide recreational opportunities
that are amenable to a conservation area, as well as establish a second access point from the Cedar Creek Reclamation facility. A second access point will also
eliminate a long standing issue with the use of a private residental street as a primary point of access.This location will compliment East Side residents and
businesses, as well as those along the Barnett Shoals corridor. This location will provide needed recreation services in an otherwise under‐served segment of our
community, as well as benefit all residents.
No Impact.
Capital Detail by Department
FY22 Budget D-79

Leisure Services Department Priority
Whitehall Shoals Visioning Plan 25 of 27CS, Master Planning Project Timeline: FY22 to FY23
Project Description
Project Justification
Impact on Annual Operating Expenses FY22 FY23 FY24 FY25 FY26 FY27‐31 Annual
‐ ‐ ‐ ‐ ‐ ‐ ‐
New
Financial Plan Project ID: N/A
FY20 FY21 FY22 FY23 FY24 FY25 FY26 FY27‐31 Total
End Bal. Budget Approved Proposed Proposed Proposed Proposed Proposed Proposed
SOURCES
General Capital Fund ‐ ‐ ‐ 25,000 ‐ ‐ ‐ ‐ 25,000
TOTAL SOURCES ‐ ‐ ‐ 25,000 ‐ ‐ ‐ ‐ 25,000
USES
Capital ‐ Const. ‐ ‐ ‐ 25,000 ‐ ‐ ‐ ‐ 25,000
TOTAL USES ‐ ‐ ‐ 25,000 ‐ ‐ ‐ ‐ 25,000
Vision Plan development that would establish high level inventory, assessment, and application of the practical uses and amenities appropriate for the Whitehall
property (31 acres). The vision document would serve as a guide for future development of the property and set clear expectations for future development. This
location allows Leisure Services to continue offering a variety of ways to enjoy and explore nature along the Oconee River corridor. A developed Vision Plan for this
location will help us look at opportunities to enhance/expand our services to the community.
This project helps meet public safety, facility, infrastructure, and quality of life needs for Athens‐Clarke County. This location is part of the Greenway Network Plan
future expansion and can serve both land and water trails in the county. This location will compliment East Side residents and businesses, as well as those along the
Whitehall Rd corridor and users of the North Oconee River.
No Impact.
Capital Detail by Department FY22 Budget D-80

Leisure Services Department Priority
Barber Creek & Chicopee Gun Emplacement Vision Plan 26 of 27CS, Master Planning Project Timeline: FY22 to FY23
Project Description
Project Justification
Impact on Annual Operating Expenses FY22 FY23 FY24 FY25 FY26 FY27‐31 Annual
‐ ‐ ‐ ‐ ‐ ‐ ‐
New
Financial Plan Project ID: N/A
FY20 FY21 FY22 FY23 FY24 FY25 FY26 FY27‐31 Total
End Bal. Budget Approved Proposed Proposed Proposed Proposed Proposed Proposed
SOURCES
General Capital Fund ‐ ‐ ‐ 25,000 ‐ ‐ ‐ ‐ 25,000
TOTAL SOURCES ‐ ‐ ‐ 25,000 ‐ ‐ ‐ ‐ 25,000
USES
Capital ‐ Const. ‐ ‐ ‐ 25,000 ‐ ‐ ‐ ‐ 25,000
TOTAL USES ‐ ‐ ‐ 25,000 ‐ ‐ ‐ ‐ 25,000
Vision Plan development that would establish high level inventory, assessment, and application of the practical uses and amenities appropriate for the Barber Creek
property (12 acres) and the Chicopee Gun Emplacement (6 acres). They are being approached as one project due to the sibling like nature of the history of these Civil
War era installations. The vision document would serve as a guide for appropriate use of the property and set clear expectations for future development. This
location allows Leisure Services to continue offering a variety of ways to enjoy and explore nature and interpret our history. A developed Vision Plan for this location
will help us look at opportunities to enhance/expand our services to the community.
This project helps meet public safety, facility, infrastructure, and quality of life needs for Athens‐Clarke County. These locations will benefit the entire community.
These locations will compliment residents and businesses along both the First St/MLK Pkwy corridor and the Macon Hwy/441 corridor.
No Impact.
Capital Detail by Department
FY22 Budget D-81
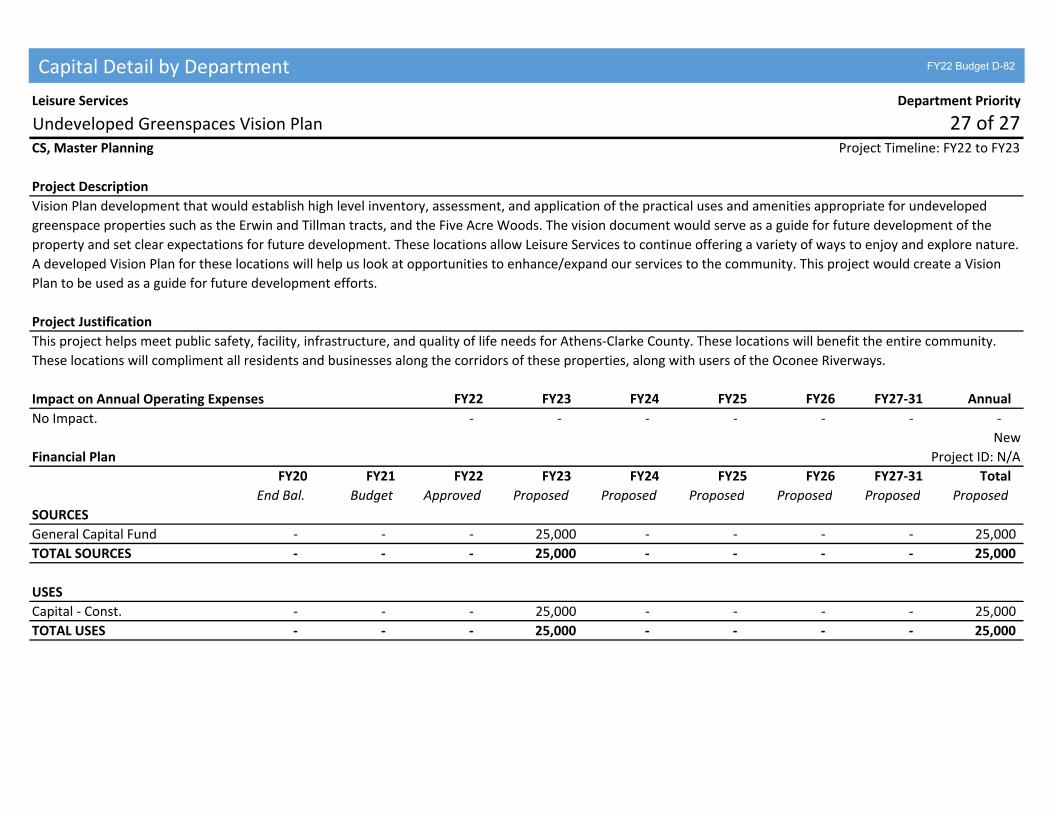
Leisure Services Department Priority
Undeveloped Greenspaces Vision Plan 27 of 27CS, Master Planning Project Timeline: FY22 to FY23
Project Description
Project Justification
Impact on Annual Operating Expenses FY22 FY23 FY24 FY25 FY26 FY27‐31 Annual
‐ ‐ ‐ ‐ ‐ ‐ ‐
New
Financial Plan Project ID: N/A
FY20 FY21 FY22 FY23 FY24 FY25 FY26 FY27‐31 Total
End Bal. Budget Approved Proposed Proposed Proposed Proposed Proposed Proposed
SOURCES
General Capital Fund ‐ ‐ ‐ 25,000 ‐ ‐ ‐ ‐ 25,000
TOTAL SOURCES ‐ ‐ ‐ 25,000 ‐ ‐ ‐ ‐ 25,000
USES
Capital ‐ Const. ‐ ‐ ‐ 25,000 ‐ ‐ ‐ ‐ 25,000
TOTAL USES ‐ ‐ ‐ 25,000 ‐ ‐ ‐ ‐ 25,000
Vision Plan development that would establish high level inventory, assessment, and application of the practical uses and amenities appropriate for undeveloped
greenspace properties such as the Erwin and Tillman tracts, and the Five Acre Woods. The vision document would serve as a guide for future development of the
property and set clear expectations for future development. These locations allow Leisure Services to continue offering a variety of ways to enjoy and explore nature.
A developed Vision Plan for these locations will help us look at opportunities to enhance/expand our services to the community. This project would create a Vision
Plan to be used as a guide for future development efforts.
This project helps meet public safety, facility, infrastructure, and quality of life needs for Athens‐Clarke County. These locations will benefit the entire community.
These locations will compliment all residents and businesses along the corridors of these properties, along with users of the Oconee Riverways.
No Impact.
Capital Detail by Department FY22 Budget D-82

Manger's Office ‐ Inclusion Department Priority
Walk of Remembrance 1 of 1AI, Infrastructure Project Timeline: FY22 to FY22
Project Description
Project Justification
Impact on Annual Operating Expenses FY22 FY23 FY24 FY25 FY26 FY27‐31 Annual
‐ ‐ ‐ ‐ ‐ ‐ ‐
New
Financial Plan Project ID: c0818
FY20 FY21 FY22 FY23 FY24 FY25 FY26 FY27‐31 Total
End Bal. Budget Approved Proposed Proposed Proposed Proposed Proposed Proposed
SOURCES
General Capital Fund ‐ ‐ 50,000 ‐ ‐ ‐ ‐ ‐ 50,000
TOTAL SOURCES ‐ ‐ 50,000 ‐ ‐ ‐ ‐ ‐ 50,000
USES
Capital ‐ Infrastructure ‐ ‐ 50,000 ‐ ‐ ‐ ‐ ‐ ‐
TOTAL USES ‐ ‐ 50,000 ‐ ‐ ‐ ‐ ‐ 50,000
The Walk of Remembrance (otherwise known as the Walk of Recognition) will consist of a series of installations designed to inform visitors about the Linnentown
community. The project will also include a community led visual art project consisting of a series of mosaics.
The purpose of this project is to support the Commission’s goals for Informed and Engaged residents by increasing awareness regarding the Linnentown community.
No Impact.
Capital Detail by Department
FY22 Budget D-83
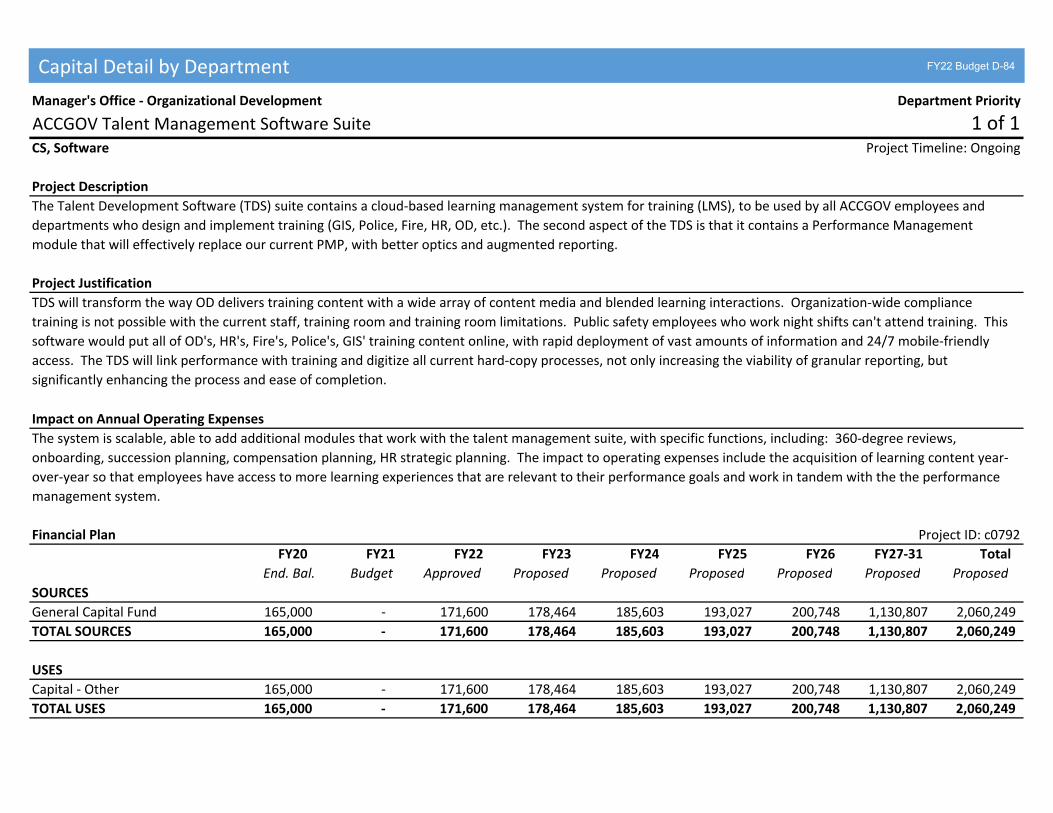
Manager's Office ‐ Organizational Development Department Priority
ACCGOV Talent Management Software Suite 1 of 1CS, Software Project Timeline: Ongoing
Project Description
Project Justification
Impact on Annual Operating Expenses
Financial Plan Project ID: c0792
FY20 FY21 FY22 FY23 FY24 FY25 FY26 FY27‐31 Total
End. Bal. Budget Approved Proposed Proposed Proposed Proposed Proposed Proposed
SOURCES
General Capital Fund 165,000 ‐ 171,600 178,464 185,603 193,027 200,748 1,130,807 2,060,249
TOTAL SOURCES 165,000 ‐ 171,600 178,464 185,603 193,027 200,748 1,130,807 2,060,249
USES
Capital ‐ Other 165,000 ‐ 171,600 178,464 185,603 193,027 200,748 1,130,807 2,060,249
TOTAL USES 165,000 ‐ 171,600 178,464 185,603 193,027 200,748 1,130,807 2,060,249
The Talent Development Software (TDS) suite contains a cloud‐based learning management system for training (LMS), to be used by all ACCGOV employees and
departments who design and implement training (GIS, Police, Fire, HR, OD, etc.). The second aspect of the TDS is that it contains a Performance Management
module that will effectively replace our current PMP, with better optics and augmented reporting.
TDS will transform the way OD delivers training content with a wide array of content media and blended learning interactions. Organization‐wide compliance
training is not possible with the current staff, training room and training room limitations. Public safety employees who work night shifts can't attend training. This
software would put all of OD's, HR's, Fire's, Police's, GIS' training content online, with rapid deployment of vast amounts of information and 24/7 mobile‐friendly
access. The TDS will link performance with training and digitize all current hard‐copy processes, not only increasing the viability of granular reporting, but
significantly enhancing the process and ease of completion.
The system is scalable, able to add additional modules that work with the talent management suite, with specific functions, including: 360‐degree reviews,
onboarding, succession planning, compensation planning, HR strategic planning. The impact to operating expenses include the acquisition of learning content year‐
over‐year so that employees have access to more learning experiences that are relevant to their performance goals and work in tandem with the the performance
management system.
Capital Detail by Department FY22 Budget D-84

Manager's Office ‐ Public Information Office Department Priority
Website & eGovernment Enhancements 1 of 3CS, Equipment Project Timeline: FY17 to Ongoing
Project Description
Project Justification
Impact on Annual Operating Expenses FY22 FY23 FY24 FY25 FY26 FY27‐31 Annual
‐ ‐ ‐ ‐ ‐ ‐ ‐
Financial Plan Project ID: c0707
FY20 FY21 FY22 FY23 FY24 FY25 FY26 FY27‐31 Total
End Bal. Budget Approved Proposed Proposed Proposed Proposed Proposed Proposed
SOURCES
General Capital Fund 37,464 15,000 100,000 103,000 90,000 91,000 57,000 300,000 741,000
TOTAL SOURCES 37,464 15,000 100,000 103,000 90,000 91,000 57,000 300,000 741,000
USES
Capital ‐ Machinery & Equip 37,464 15,000 100,000 103,000 90,000 91,000 57,000 300,000 741,000
TOTAL USES 37,464 15,000 100,000 103,000 90,000 91,000 57,000 300,000 741,000
This project maintains services and equipment and provide new services and equipment related to the Athens‐Clarke County website (accgov.com) and associated
eGovernment initiatives.
Informed & Engaged Community ‐ The Public Information Office manages the website and trains departmental staff on use of the site. Project funds support website
upgrades, training, support, and improvements, as well as social media support and archiving. The website is a key outlet for primary source information about
ACCGov. In FY20, accgov.com had 2.65 million visitors, 5 million page views, and 1.8 million downloads. The FY22 request includes 1/2 of a system upgrade and
design refresh spread over two fiscal years, funds to improve accessibility of documents, website hosting and support, social media archiving, a system‐wide
reporting and error detection system, a digital engagement platform, and surveying hardware.
No impact.
Capital Detail by Department
FY22 Budget D-85
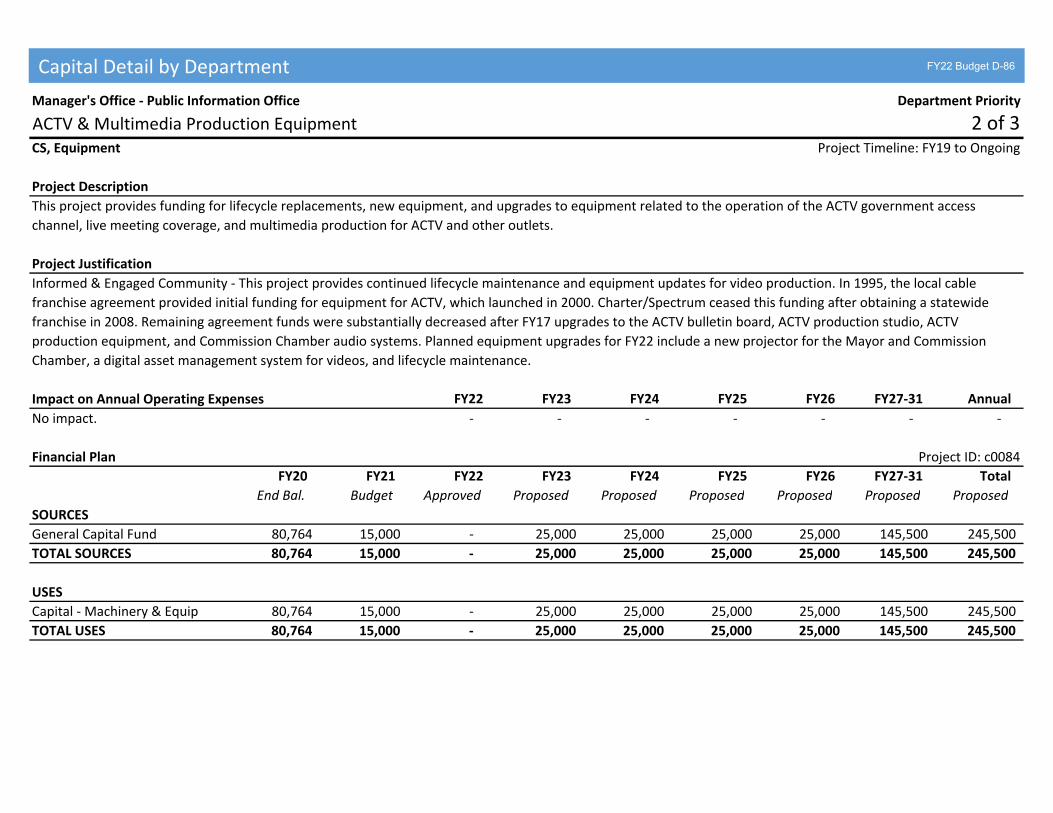
Manager's Office ‐ Public Information Office Department Priority
ACTV & Multimedia Production Equipment 2 of 3CS, Equipment Project Timeline: FY19 to Ongoing
Project Description
Project Justification
Impact on Annual Operating Expenses FY22 FY23 FY24 FY25 FY26 FY27‐31 Annual
‐ ‐ ‐ ‐ ‐ ‐ ‐
Financial Plan Project ID: c0084
FY20 FY21 FY22 FY23 FY24 FY25 FY26 FY27‐31 Total
End Bal. Budget Approved Proposed Proposed Proposed Proposed Proposed Proposed
SOURCES
General Capital Fund 80,764 15,000 ‐ 25,000 25,000 25,000 25,000 145,500 245,500
TOTAL SOURCES 80,764 15,000 ‐ 25,000 25,000 25,000 25,000 145,500 245,500
USES
Capital ‐ Machinery & Equip 80,764 15,000 ‐ 25,000 25,000 25,000 25,000 145,500 245,500
TOTAL USES 80,764 15,000 ‐ 25,000 25,000 25,000 25,000 145,500 245,500
This project provides funding for lifecycle replacements, new equipment, and upgrades to equipment related to the operation of the ACTV government access
channel, live meeting coverage, and multimedia production for ACTV and other outlets.
Informed & Engaged Community ‐ This project provides continued lifecycle maintenance and equipment updates for video production. In 1995, the local cable
franchise agreement provided initial funding for equipment for ACTV, which launched in 2000. Charter/Spectrum ceased this funding after obtaining a statewide
franchise in 2008. Remaining agreement funds were substantially decreased after FY17 upgrades to the ACTV bulletin board, ACTV production studio, ACTV
production equipment, and Commission Chamber audio systems. Planned equipment upgrades for FY22 include a new projector for the Mayor and Commission
Chamber, a digital asset management system for videos, and lifecycle maintenance.
No impact.
Capital Detail by Department FY22 Budget D-86
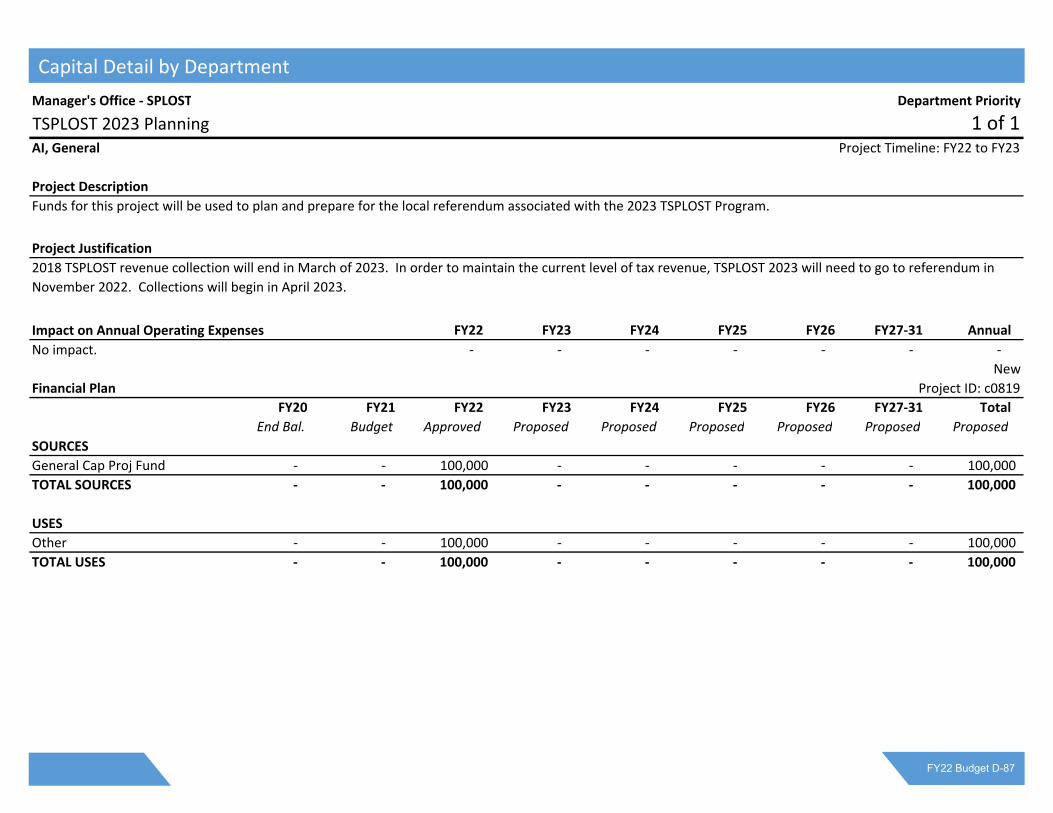
Manager's Office ‐ SPLOST Department Priority
TSPLOST 2023 Planning 1 of 1AI, General Project Timeline: FY22 to FY23
Project Description
Project Justification
Impact on Annual Operating Expenses FY22 FY23 FY24 FY25 FY26 FY27‐31 Annual
‐ ‐ ‐ ‐ ‐ ‐ ‐
New
Financial Plan Project ID: c0819
FY20 FY21 FY22 FY23 FY24 FY25 FY26 FY27‐31 Total
End Bal. Budget Approved Proposed Proposed Proposed Proposed Proposed Proposed
SOURCES
General Cap Proj Fund ‐ ‐ 100,000 ‐ ‐ ‐ ‐ ‐ 100,000
TOTAL SOURCES ‐ ‐ 100,000 ‐ ‐ ‐ ‐ ‐ 100,000
USES
Other ‐ ‐ 100,000 ‐ ‐ ‐ ‐ ‐ 100,000
TOTAL USES ‐ ‐ 100,000 ‐ ‐ ‐ ‐ ‐ 100,000
Funds for this project will be used to plan and prepare for the local referendum associated with the 2023 TSPLOST Program.
2018 TSPLOST revenue collection will end in March of 2023. In order to maintain the current level of tax revenue, TSPLOST 2023 will need to go to referendum in
November 2022. Collections will begin in April 2023.
No impact.
Capital Detail by Department
FY22 Budget D-87

Manager's Office ‐ Sustainability Office Department Priority
Natural Area Rehabilitation Program 1 of 3AI, Facilities Project Timeline: FY24 to Ongoing
Project Description
Project Justification
Impact on Annual Operating Expenses FY22 FY23 FY24 FY25 FY26 FY27‐31 Annual
‐ ‐ ‐ ‐ ‐ ‐ ‐
Financial Plan Project ID: N/A
FY20 FY21 FY22 FY23 FY24 FY25 FY26 FY27‐31 Total
End Bal. Budget Approved Proposed Proposed Proposed Proposed Proposed Proposed
SOURCES
General Capital Fund ‐ ‐ ‐ ‐ ‐ 175,000 175,000 600,000 950,000
TOTAL SOURCES ‐ ‐ ‐ ‐ ‐ 175,000 175,000 600,000 950,000
USES
Capital ‐ Const. ‐ ‐ ‐ ‐ ‐ 175,000 175,000 600,000 950,000
TOTAL USES ‐ ‐ ‐ ‐ ‐ 175,000 175,000 600,000 950,000
Implement natural area management activities with a goal of managing ACC's properties and restoring/maintaining high quality ecosystem services and habitat. Management plans
have been developed for the Restore our River project (Phase 1‐Dudley Park and Phase 2‐MLK), and Sandy Creek Nature Center. Plans are being developed for Rock and Shoals,
Tallassee, Beech Haven, and Matthew Motors with a long‐term goal of developing plans for all relevant ACC properties. This project includes the potential to identify and acquire
structures identified as being within the 100‐year flood zone, relocating households, and convert the property to greenspace.
ACC is the second largest landowner in the county and in has adopted and is implementing a comprehensive land management initiatives. This initiative utilizes land stewardship
practices and policies that conserve ecosystem services, enhance community esthetics and health, promotes biodiversity, and encourages public‐private projects. Further, these
practices result in substantial savings related to "gray" (i.e. built) infrastructure by reducing pipe‐destroying sediment, providing bio‐remediation of toxic pollutants, and reducing
runoff/enhancing stormwater percolation (higher summer stream flow) ‐ while simultaneously encouraging ecotourism and healthy outdoor‐focused lifestyles. CIP funding reduces
fluxuations in operating budgets as well as reduces the need for additional staffing by utilizing contract services to address issues in natural areas that are otherwise underserviced
with current budget allocations. Funding may also be used to acquire properties/structures located in flood prone areas for the purpose of transforming properties into greenspace to
prevent substantial property loss and/or potential injury or death. Georgia Emergency Management Agency is updating flood maps in Athens and there is a need to have funding
options to relocated vulnerable businesses and households. This project meets the "Healthy, Livable, Sustainable Athens‐Clarke County" and the "Safe and Prepared" Mayor and
Commission Strategic Goals.
Positive. By funding this as a capital project, ACC staff can contract
for services, which reduces the need for additional staffing and
operating expenses; Cost associated with GEMA project can be
determined as funding opportunities arise.
Capital Detail by Department FY22 Budget D-88

Manager's Office ‐ Sustainability Office Department Priority
Solar and Energy Program 2 of 3AI, Facilities Project Timeline: FY21 to Ongoing
Project Description
Project Justification
Impact on Annual Operating Expenses FY22 FY23 FY24 FY25 FY26 FY27‐31 Annual
‐ ‐ ‐ ‐ ‐ ‐ ‐
Financial Plan Project ID: N/A
FY20 FY21 FY22 FY23 FY24 FY25 FY26 FY27‐31 Total
End Bal. Budget Approved Proposed Proposed Proposed Proposed Proposed Proposed
SOURCES
General Capital Fund ‐ ‐ ‐ ‐ ‐ ‐ 150,000 500,000 650,000
TOTAL SOURCES ‐ ‐ ‐ ‐ ‐ ‐ 150,000 500,000 650,000
USES
Capital ‐ Const. ‐ ‐ ‐ ‐ ‐ ‐ 150,000 500,000 650,000
TOTAL USES ‐ ‐ ‐ ‐ ‐ ‐ 150,000 500,000 650,000
This project will install solar energy systems at Athens‐Clarke County (ACC) facilities in order to: (1) decrease the environmental impacts of the energy we use, (2) decrease the ongoing
costs associated with facility energy bills, and (3) provide opportunities for local jobs by supporting domestic energy production instead of using out‐of‐state fuel sources. This project
will support energy action planning efforts needed to meet the Mayor and Commission commitment to reach 100% renewable energy by 2035. Funding to be used to leverage grants,
SPLOST, donations and other opportunities to accelerate the transition to clean and renewable energy.
Over the last decade, facility energy price inflation has outpaced Athens‐Clarke County budget growth, and as a result, fewer dollars are available for public safety, infrastructure, and
economic development as we commit more funding to pay our utility bills. Athens‐Clarke County currently spends more than $7,350,000/year on 287 billion BTUs of energy to
support government operations. Preliminary analysis indicates the community may spend as much as $350 million/year on its energy use. Many policies, programs, and capital
equipment modifications will be needed to transition this energy use to renewable sources. An energy action plan is currently being created that will help guide and facilitate the
transition to clean and renewable energy. With the anticipated pivot by the federal government to focus on climate change and renewable energy, having funds available to use for
match will be essential, positioning ACCGov so as to accelerate and significantly extend funding opportunities that will: build community resilience; accelerate the transition to
renewable/clean energy; assist business, industry, and the public make the transition, and lower the community's overall energy burdens ‐ especially for economically
disadvantaged individuals and households. This project supports the Mayor and Commission 100 Percent Clean and Renewal Energy Resolution as well as the "Healthy, Livable,
Sustainable Athens‐Clarke County" and "Shared Prosperity" Strategic Goals.
At today's rates, each dollar spent on solar energy results in a
decrease of 5% annual savings on utility bills. This return continues
to improve as utility rates increase and solar energy system prices
decrease.
Capital Detail by Department
FY22 Budget D-89

Manager's Office ‐ Sustainability Office Department Priority
Energy Planning ‐ Fleet Electrification, Fuel Reduction, and Climate Change Resiliency 3 of 3AI, Planning Project Timeline: FY21 to Ongoing
Project Description
Project Justification
Impact on Annual Operating Expenses FY22 FY23 FY24 FY25 FY26 FY27‐31 Annual
‐ ‐ ‐ ‐ ‐ ‐ ‐
Financial Plan Project ID: c0794
FY20 FY21 FY22 FY23 FY24 FY25 FY26 FY27‐31 Total
End Bal. Budget Approved Proposed Proposed Proposed Proposed Proposed Proposed
SOURCES
General Capital Fund 30,000 ‐ ‐ ‐ ‐ 100,000 100,000 2,900,000 3,130,000
TOTAL SOURCES 30,000 ‐ ‐ ‐ ‐ 100,000 100,000 2,900,000 3,130,000
USES
Capital ‐ Const. 30,000 ‐ ‐ ‐ ‐ 100,000 100,000 2,900,000 3,130,000
TOTAL USES 30,000 ‐ ‐ ‐ ‐ 100,000 100,000 2,900,000 3,130,000
As part of Energy Planning, this project provides funding to convert ACCGov's fleet to fully electric with a focus on large diesel vehicles and, as an interim, to equip vehicles with idle
reduction technology in order to significantly reduce fuel consumption Project includes selectively deploying monitoring equipment and pilot project funding to help guide effective
use of funds during fleet conversion. Renewable energy by 2035. For FY21, a mix of capital and general operating budget funds will be used to complete the plan.
Guided by the Clean and Renewable Energy Plan, this project will help facilitate changes that need to be made to support the renewable energy revolution. Technology related to
heavy vehicles such as garbage trucks, dump trucks, buses, fire engines, and similar vehicles is changing rapidly, with fully electric models becoming more cost effective and viable.
The six ACCGov departments that use heavy vehicles will consume approximately 467,500 gallons of diesel fuel in FY21. If converted to fully electric vehicles, this would represent an
annual savings of $1M in fuel at current prices and eliminate almost 5,200 tons of greenhouse gases. As heavy vehicles are moved toward clean energy alternatives, funding idle
mitigation technology during the transition will have significant positive financial impacts. Tallahassee Fla equipped 2 ambulances with idle reduction technology and realized an
immediate annual savings of $10,685 along with a 4,018 gallon reduction in fuel use and the mitigation of 4,230 hours of idle time. CIP support begins transforming ACCGov' s heavy
equipment fleet, an essential component to moving the community to clean and renewable energy in accordance with the Mayor and Commission 100 Percent Clean and Renewable
Energy Resolution as well as the "Healthy, Livable, Sustainable Athens‐Clarke County" and "Transportation Mobility and Connectivity" Strategic Goals. There are similar savings
opportunities related to heavier‐duty pick‐up trucks that will achieve smaller but important results.
Positive. By funding this as a capital project ACCGOV staff utilize
funding to for grants, transportation projects, and related initaitves
that will decrease future operating budgets for ACCGOV. Actual
savings can more accurately be determined as the technology
evolves.
Capital Detail by Department FY22 Budget D-90

Other General Administration Department Priority
Public Art Program 1 of 1AI, Facilities Project Timeline: FY12 to Ongoing
Project Description
Project Justification
Impact on Annual Operating Expenses FY22 FY23 FY24 FY25 FY26 FY27‐31 Annual
‐ ‐ ‐ ‐ ‐ ‐ ‐
Financial Plan Project ID: c0625
FY20 FY21 FY22 FY23 FY24 FY25 FY26 FY27‐31 Total
End Bal. Budget Approved Proposed Proposed Proposed Proposed Proposed Proposed
SOURCES
General Capital Fund 40,918 25,000 25,000 25,000 25,000 25,000 25,000 125,000 250,000
TOTAL SOURCES 40,918 25,000 25,000 25,000 25,000 25,000 25,000 125,000 250,000
USES
Capital ‐ Art 40,918 25,000 25,000 25,000 25,000 25,000 25,000 125,000 250,000
TOTAL USES 40,918 25,000 25,000 25,000 25,000 25,000 25,000 125,000 250,000
Funds for this project will be used for the design, fabrication, installation, maintenance and implementation of community public art projects recommended by the
Athens Cultural Affairs Commission and Proposed by the Mayor and Commission purchase for placement in various locations around Athens‐Clarke County. The
project is funded through the allocation of the equivalent of one percent of General Fund funding for Proposed capital projects, excluding land and equipment
purchases.
This project is carried out in accordance with Chapter 1‐25, "Athens Cultural Affairs Commission", of the Athens‐Clarke County Code of Ordinances. Specific art
projects are chosen in conjunction with the Athens Cultural Affairs Commission.
No Impact.
Capital Detail by Department
FY22 Budget D-91

Other General Administration Department Priority
Economic Development Capital Program 1 of 1AI, General Project Timeline: Ongoing
Project Description
Project Justification
Impact on Annual Operating Expenses FY22 FY23 FY24 FY25 FY26 FY27‐31 Annual
‐ ‐ ‐ ‐ ‐ ‐ ‐
Financial Plan Project ID: c0078
FY20 FY21 FY22 FY23 FY24 FY25 FY26 FY27‐31 Total
End Bal. Budget Approved Proposed Proposed Proposed Proposed Proposed Proposed
SOURCES
Econ Dev Capital Fund 837,630 225,000 ‐ 225,000 225,000 225,000 225,000 1,125,000 2,025,000
TOTAL SOURCES 837,630 225,000 ‐ 225,000 225,000 225,000 225,000 1,125,000 2,025,000
USES
Capital ‐ Other 837,630 225,000 ‐ 225,000 225,000 225,000 225,000 1,125,000 2,025,000
TOTAL USES 837,630 225,000 ‐ 225,000 225,000 225,000 225,000 1,125,000 2,025,000
The purpose of this project is to provide a readily available funded program to pay for the site improvements and related expenditures for new industry location and
existing industry expansion in Athens‐Clarke County. Location is to be determined based upon industrial development opportunities.
This project will fund and assist with the implementation of an element of the government's economic development policy, as directed by the Mayor and
Commission.
No Impact.
Capital Detail by Department FY22 Budget D-92

Other General Administration Department Priority
Capital Budget Contingency 1 of 1CS, General Project Timeline: Ongoing
Project Description
Project Justification
Impact on Annual Operating Expenses FY22 FY23 FY24 FY25 FY26 FY27‐31 Annual
‐ ‐ ‐ ‐ ‐ ‐ ‐
Financial Plan Project ID: c0124
FY20 FY21 FY22 FY23 FY24 FY25 FY26 FY27‐31 Total
End Bal. Budget Approved Proposed Proposed Proposed Proposed Proposed Proposed
SOURCES
General Capital Fund 585,764 ‐ ‐ 100,000 100,000 100,000 100,000 500,000 900,000
TOTAL SOURCES 585,764 ‐ ‐ 100,000 100,000 100,000 100,000 500,000 900,000
USES
Capital ‐ Other 585,764 ‐ ‐ 100,000 100,000 100,000 100,000 500,000 900,000
TOTAL USES 585,764 ‐ ‐ 100,000 100,000 100,000 100,000 500,000 900,000
Capital Contingency is used to fund unanticipated capital expenses. Funds are transferred to other projects with the Manager and/or Mayor and Commission
approval. No expenses are charged directly to this project.
All requests are reviewed by the Manager and based on funding parameters are then forwarded to the Mayor and Commission for either their information or
approval.
No Impact.
Capital Detail by Department
FY22 Budget D-93

Planning & Zoning Department Priority
Permitting Software Equipment 1 of 3AI, General Project Timeline: FY23 to FY23
Project Description
Project Justification
Impact on Annual Operating Expenses FY23 FY24 FY25 FY26 FY27 FY28‐32 Annual
‐ 2,000 2,000 2,000 2,000 10,000 1,800
New
Financial Plan Project ID: N/A
FY20 FY21 FY22 FY23 FY24 FY25 FY26 FY27‐31 Total
End. Bal. Budget Approved Proposed Proposed Proposed Proposed Proposed Proposed
SOURCES
General Capital Fund ‐ ‐ ‐ 50,000 ‐ ‐ ‐ ‐ 50,000
TOTAL SOURCES ‐ ‐ ‐ 50,000 ‐ ‐ ‐ ‐ 50,000
USES
Capital ‐ Machinery & Equip ‐ ‐ ‐ 50,000 ‐ ‐ ‐ ‐ 50,000
TOTAL USES ‐ ‐ ‐ 50,000 ‐ ‐ ‐ ‐ 50,000
Acquisition of new equipment directly associated with a change in a permitting software program. The previous permitting software program was maintained over a
10‐year span (2010‐2021), and for the most part, could be utilized from existing technology. The proposed software upgrade is anticipated to require new digital
equipment capable of displaying and storing information in a manner consistent with the new software; however, the specific type and number of equipment is yet
to be determined until after inital onset of software and current technology compatibility.
The Planning Department is just one of multiple county departments that engage in the daily revew, permitting, and inspection of construction projects that will now
uniformly utilize a new software package. The Mayor and Commission have already authorized the contract for acquiring this software program and the services
provided by the vendor. Each department will incur initial startup cost directly related to equipment needed to operate the overall program; therefore, this request
is only intended to serve the direct needs of the Planning Department. Staff is continually striving to meet increasing demands linked to development throughout
the county. This equipment is vital to maintaining accurate, secure, and timely information for plan review, permitting, and inspection. It will also afford the
department/county more digital capability as we look to increased efficiency and innovation.
Maintenance and Warranty Fees
Capital Detail by Department FY22 Budget D-94

Planning & Zoning Department Priority
Comprehensive Plan Five/Ten Year Update 2 of 3AI, General Project Timeline: FY23 to Ongoing
Project Description
Project Justification
Impact on Annual Operating Expenses FY22 FY23 FY24 FY25 FY26 FY27‐31 Annual
‐ ‐ ‐ ‐ ‐ ‐ ‐
Financial Plan Project ID: c0529
FY20 FY21 FY22 FY23 FY24 FY25 FY26 FY27‐31 Total
End. Bal. Budget Approved Proposed Proposed Proposed Proposed Proposed Proposed
SOURCES
General Capital Fund ‐ ‐ ‐ 50,000 ‐ ‐ 300,000 350,000
TOTAL SOURCES ‐ ‐ ‐ 50,000 ‐ ‐ ‐ 300,000 350,000
USES
Capital ‐ Other ‐ ‐ ‐ 50,000 ‐ ‐ ‐ 300,000 350,000
TOTAL USES ‐ ‐ ‐ 50,000 ‐ ‐ ‐ 300,000 350,000
The current Comprehensive Plan was completed in June 2018. Monies associated with this project will fund work by staff to complete the required 5‐year short‐
term update due in 2023, in addition to another major amendment due in 2028.
Georgia State Law requires that Comprehensive Plans be updated every five years. The Planning Department completed a major update in June 2018. A state‐
mandated 5‐year minor update will need additional funding in FY23. Anticipating the future 10‐year major update, staff has indicated the possibility of a consultant‐
lead effort, which is noted in FY26‐30.
No Impact.
Capital Detail by Department
FY22 Budget D-95

Planning & Zoning Department Priority
Replace Large Format Printer (KIP) 3 of 3CS, General Project Timeline: FY25 to FY25
Project Description
Project Justification
Impact on Annual Operating Expenses FY22 FY23 FY24 FY25 FY26 FY27‐31 Annual
‐ ‐ ‐ ‐ ‐ ‐ ‐
New
Financial Plan Project ID: N/A
FY20 FY21 FY22 FY23 FY24 FY25 FY26 FY27‐31 Total
End. Bal. Budget Approved Proposed Proposed Proposed Proposed Proposed Proposed
SOURCES
General Capital Fund ‐ ‐ ‐ ‐ ‐ 30,000 ‐ 30,000
TOTAL SOURCES ‐ ‐ ‐ ‐ ‐ 30,000 ‐ ‐ 30,000
USES
Capital ‐ Other ‐ ‐ ‐ ‐ ‐ 30,000 ‐ ‐ 30,000
TOTAL USES ‐ ‐ ‐ ‐ ‐ 30,000 ‐ ‐ 30,000
Acquisition of new large format printer/copier for Athens‐Clarke County's Planning Dept.
The current printer (KIP) is nearing the end of its lifespan and will need replacing by FY25. Current maintenance is handled through a contract with Central Services
and can be covered out of departmental operating funds. The copier/printer is vital to our efforts in regards to Plans Review, Subdivision Review and Final Platting.
The department is striving to meet demands through digital opportunities, however some large format plans are still handled on paper, or required for recording
purposes and site inspections.
No Impact.
Capital Detail by Department FY22 Budget D-96

Police Department Priority
On‐Officer Cameras and Data Storage 1 of 17CS, Equipment Project Timeline: Ongoing
Project Description
Project Justification
Impact on Annual Operating Expenses FY22 FY23 FY24 FY25 FY26 FY27‐31 Annual
‐ ‐ ‐ ‐ ‐ ‐ ‐
Financial Plan Project ID: c0699
FY20 FY21 FY22 FY23 FY24 FY25 FY26 FY27‐31 Total
End Bal. Budget Approved Proposed Proposed Proposed Proposed Proposed Proposed
SOURCES
General Cap Proj Fund 331,822 230,000 276,072 273,139 273,139 273,139 273,139 1,365,695 2,734,323
TOTAL SOURCES 331,822 230,000 276,072 273,139 273,139 273,139 273,139 1,365,695 2,734,323
USES
Capital ‐ Machinery & Equip 331,822 230,000 276,072 273,139 273,139 273,139 273,139 1,365,695 2,734,323
TOTAL USES 331,822 230,000 276,072 273,139 273,139 273,139 273,139 1,365,695 2,734,323
Full deployment and maintenance of on‐officer camera systems to record interactions between officers and the public. This system automatically and seamlessly
downloads and stores digital video for use in court and supervisory reviews as mandated by national accreditation (CALEA) standards. Request is inclusive of
equipment purchases, maintenance, and data storage costs.
The Athens‐Clarke County Police Department has utilized video recordings for a number of years, to include in‐car video recordings and on‐officer camera systems. In
2014, a limited number of on‐officer cameras were issued to patrol operations, with expansion to all patrol officers over the following year. Video shall continue to
be transferred to a centralized database for use by criminal justice stakeholders. As the mandated retention cycle for such videos is now a minimum of 2.5 years,
data storage needs have stabilized. Costs represented within the model below account for a continuance of existing cloud storage practices and the supported
deployment of TASER Axon Camera Systems by 231 authorized sworn officers.
Not anticipated to affect annual operating expenses.
Capital Detail by Department
FY22 Budget D-97

Police Department Priority
Replacement of Conducted Energy Device (CED) Units 2 of 17CS, Equipment Project Timeline: FY21 to Ongoing
Project Description
Project Justification
Impact on Annual Operating Expenses FY22 FY23 FY24 FY25 FY26 FY27‐31 Annual
‐ ‐ ‐ ‐ ‐ ‐ ‐
Financial Plan Project ID: c0804
FY20 FY21 FY22 FY23 FY24 FY25 FY26 FY27‐31 Total
End Bal. Budget Approved Proposed Proposed Proposed Proposed Proposed Proposed
SOURCES
General Capital Fund ‐ 228,200 276,072 273,139 273,139 273,139 273,139 1,365,695 2,734,323
TOTAL SOURCES ‐ 228,200 276,072 273,139 273,139 273,139 273,139 1,365,695 2,734,323
USES
Capital ‐ Machinery & Equip ‐ 228,200 276,072 273,139 273,139 273,139 273,139 1,365,695 2,734,323
TOTAL USES ‐ 228,200 276,072 273,139 273,139 273,139 273,139 1,365,695 2,734,323
This request seeks to establish a five year replacement cycle for all 231 conducted energy devices (CEDs).
The use of conducted energy devices (CEDs), more commonly known as “TASERs,” is requisite in today's law enforcement environment. TASERs enhance the level of
safety experienced by officers and citizens alike as they allow for a less than lethal compliance tool. The ACCPD deployed its first CEDs in 2015 ‐ providing a TASER to
each patrol officer. All sworn officers now carry TASERs.
Officers are required to attend TASER recertification courses
each year in which live cartridges are used. Such costs are
already within the ACCPD's annual operating budget.
Capital Detail by Department FY22 Budget D-98
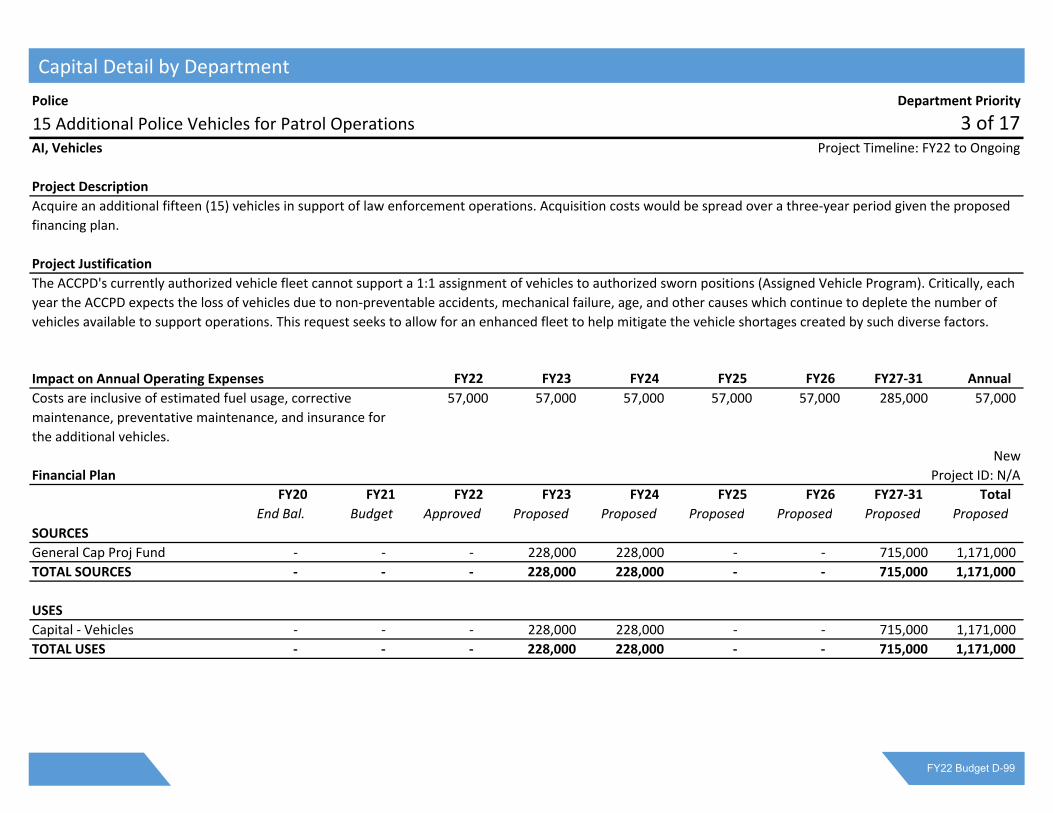
Police Department Priority
15 Additional Police Vehicles for Patrol Operations 3 of 17AI, Vehicles Project Timeline: FY22 to Ongoing
Project Description
Project Justification
Impact on Annual Operating Expenses FY22 FY23 FY24 FY25 FY26 FY27‐31 Annual
57,000 57,000 57,000 57,000 57,000 285,000 57,000
New
Financial Plan Project ID: N/A
FY20 FY21 FY22 FY23 FY24 FY25 FY26 FY27‐31 Total
End Bal. Budget Approved Proposed Proposed Proposed Proposed Proposed Proposed
SOURCES
General Cap Proj Fund ‐ ‐ ‐ 228,000 228,000 ‐ ‐ 715,000 1,171,000
TOTAL SOURCES ‐ ‐ ‐ 228,000 228,000 ‐ ‐ 715,000 1,171,000
USES
Capital ‐ Vehicles ‐ ‐ ‐ 228,000 228,000 ‐ ‐ 715,000 1,171,000
TOTAL USES ‐ ‐ ‐ 228,000 228,000 ‐ ‐ 715,000 1,171,000
Acquire an additional fifteen (15) vehicles in support of law enforcement operations. Acquisition costs would be spread over a three‐year period given the proposed
financing plan.
The ACCPD's currently authorized vehicle fleet cannot support a 1:1 assignment of vehicles to authorized sworn positions (Assigned Vehicle Program). Critically, each
year the ACCPD expects the loss of vehicles due to non‐preventable accidents, mechanical failure, age, and other causes which continue to deplete the number of
vehicles available to support operations. This request seeks to allow for an enhanced fleet to help mitigate the vehicle shortages created by such diverse factors.
Costs are inclusive of estimated fuel usage, corrective
maintenance, preventative maintenance, and insurance for
the additional vehicles.
Capital Detail by Department
FY22 Budget D-99

Police Department Priority
Additional Police Vehicles (25) 4 of 17AI, Vehicles Project Timeline: FY22 to Ongoing
Project Description
Project Justification
Impact on Annual Operating Expenses FY22 FY23 FY24 FY25 FY26 FY27‐31 Annual
95,000 95,000 95,000 95,000 95,000 475,000 95,000
New
Financial Plan Project ID: N/A
FY20 FY21 FY22 FY23 FY24 FY25 FY26 FY27‐31 Total
End Bal. Budget Approved Proposed Proposed Proposed Proposed Proposed Proposed
SOURCES
General Cap Proj Fund ‐ ‐ ‐ 375,000 375,000 ‐ ‐ 1,180,000 1,930,000
TOTAL SOURCES ‐ ‐ ‐ 375,000 375,000 ‐ ‐ 1,180,000 1,930,000
USES
Capital ‐ Vehicles ‐ ‐ ‐ 375,000 375,000 ‐ ‐ 1,180,000 1,930,000
TOTAL USES ‐ ‐ ‐ 375,000 375,000 ‐ ‐ 1,180,000 1,930,000
Acquire an additional twenty‐five (25) vehicles in support of law enforcement operations. Acquisition costs would be spread over a three‐year period given the
proposed financing plan.
Critically, with a greater need for available & reliable fleet vehicles, coupled with an aging fleet, the department requires vehicles in the near term. Recommended
vehicle replacement cycles are not consistently met, exposing the county to potential increased corrective maintenance costs and potential vehicle mechanical
failures. This is especially problematic as ACCPD vehicles are often driven in call‐response modes which place additional strain upon the vehicles not present in
standard vehicle operations. In addition, the ACCPD's currently authorized vehicle fleet cannot support a 1:1 assignment of vehicles to authorized sworn positions
(Assigned Vehicle Program) and the enhanced capacities such vehicle availability affords, should staffing return to full strength.
Costs are inclusive of estimated fuel usage, corrective
maintenance, preventative maintenance, and insurance for
the additional vehicles.
Capital Detail by Department FY22 Budget D-100

Police Department Priority
Replace Investigative Operations Vehicles 5 of 17CS, Vehicles Project Timeline: Ongoing
Project Description
Project Justification
Impact on Annual Operating Expenses FY22 FY23 FY24 FY25 FY26 FY27‐31 Annual
‐ ‐ ‐ ‐ ‐ ‐ ‐
Financial Plan Project ID: c0085
FY20 FY21 FY22 FY23 FY24 FY25 FY26 FY27‐31 Total
End Bal. Budget Approved Proposed Proposed Proposed Proposed Proposed Proposed
SOURCES
General Cap Proj Fund 79 ‐ ‐ 70,000 70,000 70,000 70,000 367,500 647,500
TOTAL SOURCES 79 ‐ ‐ 70,000 70,000 70,000 70,000 367,500 647,500
USES
Capital ‐ Vehicles 79 ‐ ‐ 70,000 70,000 70,000 70,000 367,500 647,500
TOTAL USES 79 ‐ ‐ 70,000 70,000 70,000 70,000 367,500 647,500
Replacement funds for up to four (4) undercover vehicles for use by investigative personnel.
Familiarity with undercover vehicles can influence operational effectiveness and potentially endanger ACCPD personnel. Once identified, it is unlikely that suspects
will engage in activity with the vehicles and may become hostile towards such vehicles and occupants. Investigative vehicles are traded‐in each year so that they will
be under warranty. This practice also limits potential vehicle repair costs.
No impact.
Capital Detail by Department
FY22 Budget D-101

Police Department Priority
Motorcycle Replacement Program 6 of 17CS, Vehicles Project Timeline: FY22 to Ongoing
Project Description
Project Justification
Impact on Annual Operating Expenses FY22 FY23 FY24 FY25 FY26 FY27‐31 Annual
‐ ‐ ‐ ‐ ‐ ‐ ‐
Financial Plan Project ID: c0600
FY20 FY21 FY22 FY23 FY24 FY25 FY26 FY27‐31 Total
End Bal. Budget Approved Proposed Proposed Proposed Proposed Proposed Proposed
SOURCES
General Cap Proj Fund ‐ ‐ 60,000 60,000 60,000 60,000 60,000 315,000 615,000
TOTAL SOURCES ‐ ‐ 60,000 60,000 60,000 60,000 60,000 315,000 615,000
USES
Capital ‐ Vehicles ‐ ‐ 60,000 60,000 60,000 60,000 60,000 315,000 615,000
TOTAL USES ‐ ‐ 60,000 60,000 60,000 60,000 60,000 315,000 615,000
Replacement of Traffic Section motorcycles that are used for traffic safety programs, enforcement of traffic statutes, and accident investigations. The traffic section
has ten (10) motorcycles of various model years. This project seeks to provide funds for the maintenance of such motorcycle assets with the provision of necessary
funds for the replacement of two (2) new police motorcycles per year, allowing for a five (5) year rotation of the motorcycle fleet.
These motorcycles are used daily (weather permitting). The officers routinely use radar, monitor red‐lights, perform speed zone enforcement in school zones, and
other duties associated with traffic enforcement. A motorcycle is estimated to cost $25,000 with an additional $5,000 required to fully equip each new motorcycle in
FY22.
No impact.
Capital Detail by Department FY22 Budget D-102

Police Department Priority
Renovate Training/Firing Range 7 of 17CS, Other Project Timeline: FY23 to Ongoing
Project Description
Project Justification
Impact on Annual Operating Expenses FY22 FY23 FY24 FY25 FY26 FY27‐31 Annual
‐ ‐ ‐ ‐ ‐ ‐ ‐
Financial Plan Project ID: N/A
FY20 FY21 FY22 FY23 FY24 FY25 FY26 FY27‐31 Total
End. Bal. Budget Approved Proposed Proposed Proposed Proposed Proposed Proposed
SOURCES
General Cap Proj Fund ‐ ‐ ‐ 100,000 50,000 ‐ ‐ ‐ 150,000
TOTAL SOURCES ‐ ‐ ‐ 100,000 50,000 ‐ ‐ ‐ 150,000
USES
Other ‐ ‐ ‐ 100,000 50,000 ‐ ‐ ‐ 150,000
TOTAL USES ‐ ‐ ‐ 100,000 50,000 ‐ ‐ ‐ 150,000
The Firing Range Renovation Project is intended to improve and modernize the training provided to Athens‐Clarke County law enforcement professionals. The
proposed renovation consists of multiple phases, inclusive of but not limited to renovations of existing range structures, training systems, and site improvements.
Originally designed for a 60‐person department, the 20‐plus year old firing range is now used by over 400 law enforcement professionals. General repairs are needed
throughout the facility.
Not anticipated to affect annual operating expenses.
Capital Detail by Department
FY22 Budget D-103

Police Department Priority
Use of Force Simulator Replacement Plan 8 of 17CS, Equipment Project Timeline: FY23 to Ongoing
Project Description
Project Justification
Impact on Annual Operating Expenses FY22 FY23 FY24 FY25 FY26 FY27‐31 Annual
‐ ‐ ‐ ‐ ‐ ‐ ‐
New
Financial Plan Project ID: N/A
FY20 FY21 FY22 FY23 FY24 FY25 FY26 FY27‐31 Total
End Bal. Budget Approved Proposed Proposed Proposed Proposed Proposed Proposed
SOURCES
General Cap Proj Fund ‐ ‐ ‐ 350,000 ‐ ‐ ‐ 150,000 500,000
TOTAL SOURCES ‐ ‐ ‐ 350,000 ‐ ‐ ‐ 150,000 500,000
USES
Capital ‐ Machinery & Equip ‐ ‐ ‐ 350,000 ‐ ‐ ‐ 150,000 500,000
TOTAL USES ‐ ‐ ‐ 350,000 ‐ ‐ ‐ 150,000 500,000
In 2015, the ACCPD acquired a use of force simulator for use by the department and law enforcement stakeholders. The simulator needs to be put on a replacement
plan.
The ACCPD acquired a simulator to enhance firearms proficiency, and to allow for the incorporation of realistic, diverse training simulations into the toolkit of
officers. The simulator allows for a realistic, reactive training environment with high definition graphics. To such an end, the simulator has been used to hone skills as
with the provision of firearms usage diagnostics, skills training and branching/reactive simulations to build decision making skills that reduce the potential for deadly
force events, while enhancing the ability to make legal and ethical decisions in the worst situations officers may face while conducting their duties. Of particular note,
members of the public have been afforded opportunities to take part in such trainings. While the system proves robust, components require replacement and
modification.
No impact.
Capital Detail by Department FY22 Budget D-104

Police Department Priority
Mobile Computing Replacement Program 9 of 17CS, Equipment Project Timeline: Ongoing
Project Description
Project Justification
Impact on Annual Operating Expenses FY22 FY23 FY24 FY25 FY26 FY27‐31 Annual
‐ ‐ ‐ ‐ ‐ ‐ ‐
Financial Plan Project ID: c0559
FY20 FY21 FY22 FY23 FY24 FY25 FY26 FY27‐31 Total
End Bal. Budget Approved Proposed Proposed Proposed Proposed Proposed Proposed
SOURCES
General Cap Proj Fund 106,366 195,000 195,000 195,000 195,000 195,000 195,000 975,000 1,950,000
TOTAL SOURCES 106,366 195,000 195,000 195,000 195,000 195,000 195,000 975,000 1,950,000
USES
Capital ‐ Machinery & Equip 106,366 195,000 195,000 195,000 195,000 195,000 195,000 975,000 1,950,000
TOTAL USES 106,366 195,000 195,000 195,000 195,000 195,000 195,000 975,000 1,950,000
To provide annual funding for future replacement of police mobile computers and related mounts, docks, and antennas in police vehicles. Funds for the replacement
of mobile laptops and related equipment have been provided in the past from revenues generated by the Red Light Violation Program. Red Light Camera funds are
inadequate to sustain the computer replacement cycle and must be supplemented with general fund resources. The initial purchase of 120 laptops was approved by
the Mayor and Commission on April 01, 2008.
Mobile computers provide critical communications capabilities for police officers in the field to access the databases of the Computer Aided Dispatch (CAD) System
and the Records Management System (RMS). The absence of such computers would have a chilling effect on operations. Officers would still have access to
databases, yet would need to access such information at one of the precincts/substations lessening departmental efficiencies in the field. In addition, a viable
replacement cycle must be maintained as to ensure operational needs are met, and to reduce the potential for excessive replacement expenses within any one year.
Computer repair costs will continue to rise absent a clear
replacement cycle. Successor systems may require additional
equipment, peripheral devices, and/or mounts as to allow for
full functionality of mobile computers to be enjoyed.
Capital Detail by Department
FY22 Budget D-105

Police Department Priority
Police Radio Battery & Microphone Replacement Cycle 10 of 17CS, Equipment Project Timeline: FY23 to Ongoing
Project Description
Project Justification
Impact on Annual Operating Expenses FY22 FY23 FY24 FY25 FY26 FY27‐31 Annual
‐ ‐ ‐ ‐ ‐ ‐ ‐
Financial Plan Project ID: N/A
FY20 FY21 FY22 FY23 FY24 FY25 FY26 FY27‐31 Total
End. Bal. Budget Approved Proposed Proposed Proposed Proposed Proposed Proposed
SOURCES
General Cap Proj Fund ‐ ‐ ‐ 43,000 43,000 43,000 43,000 215,000 387,000
TOTAL SOURCES ‐ ‐ ‐ 43,000 43,000 43,000 43,000 215,000 387,000
USES
Capital ‐ Machinery & Equip ‐ ‐ ‐ 43,000 43,000 43,000 43,000 215,000 387,000
TOTAL USES ‐ ‐ ‐ 43,000 43,000 43,000 43,000 215,000 387,000
Establishment of a replacement cycle for officer radio batteries & microphones.
Department radios were issued with two battery packs each. The expected useful life of a battery pack is approximately two years. The ACCPD seeks to establish a
fixed replacement cycle for radio battery packs to reduce strain upon the operating budget and ensure fund availability for battery pack replacement. Microphones
must also be replaced periodically with a similar anticipated lifespan.
No impact.
Capital Detail by Department FY22 Budget D-106
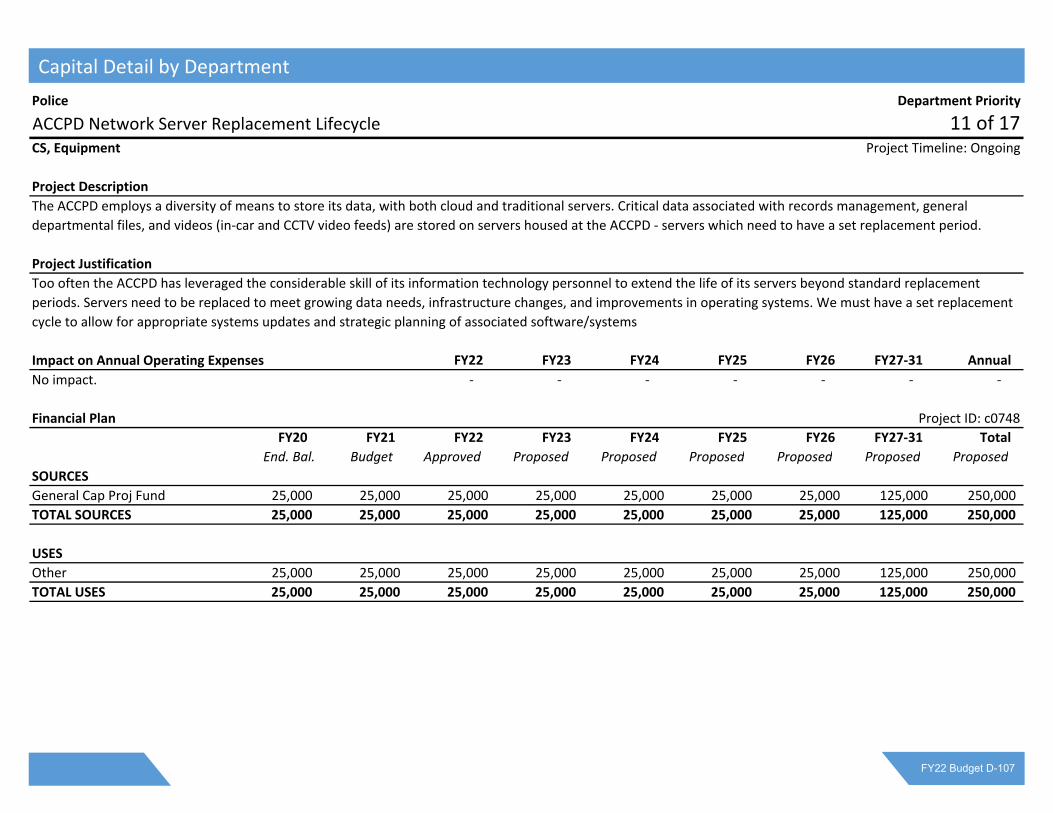
Police Department Priority
ACCPD Network Server Replacement Lifecycle 11 of 17CS, Equipment Project Timeline: Ongoing
Project Description
Project Justification
Impact on Annual Operating Expenses FY22 FY23 FY24 FY25 FY26 FY27‐31 Annual
‐ ‐ ‐ ‐ ‐ ‐ ‐
Financial Plan Project ID: c0748
FY20 FY21 FY22 FY23 FY24 FY25 FY26 FY27‐31 Total
End. Bal. Budget Approved Proposed Proposed Proposed Proposed Proposed Proposed
SOURCES
General Cap Proj Fund 25,000 25,000 25,000 25,000 25,000 25,000 25,000 125,000 250,000
TOTAL SOURCES 25,000 25,000 25,000 25,000 25,000 25,000 25,000 125,000 250,000
USES
Other 25,000 25,000 25,000 25,000 25,000 25,000 25,000 125,000 250,000
TOTAL USES 25,000 25,000 25,000 25,000 25,000 25,000 25,000 125,000 250,000
The ACCPD employs a diversity of means to store its data, with both cloud and traditional servers. Critical data associated with records management, general
departmental files, and videos (in‐car and CCTV video feeds) are stored on servers housed at the ACCPD ‐ servers which need to have a set replacement period.
Too often the ACCPD has leveraged the considerable skill of its information technology personnel to extend the life of its servers beyond standard replacement
periods. Servers need to be replaced to meet growing data needs, infrastructure changes, and improvements in operating systems. We must have a set replacement
cycle to allow for appropriate systems updates and strategic planning of associated software/systems
No impact.
Capital Detail by Department
FY22 Budget D-107

Police Department Priority
Maintenance of Downtown Safety Camera System 12 of 17CS, Equipment Project Timeline: Ongoing
Project Description
Project Justification
Impact on Annual Operating Expenses FY22 FY23 FY24 FY25 FY26 FY27‐31 Annual
‐ ‐ ‐ ‐ ‐ ‐ ‐
Financial Plan Project ID: c0685
FY20 FY21 FY22 FY23 FY24 FY25 FY26 FY27‐31 Total
End Bal. Budget Approved Proposed Proposed Proposed Proposed Proposed Proposed
SOURCES
General Cap Proj Fund 68,542 ‐ 60,000 ‐ 60,000 ‐ 60,000 300,000 480,000
TOTAL SOURCES 68,542 ‐ 60,000 ‐ 60,000 ‐ 60,000 300,000 480,000
USES
Capital ‐ Machinery & Equip 68,542 ‐ 60,000 ‐ 60,000 ‐ 60,000 300,000 480,000
TOTAL USES 68,542 ‐ 60,000 ‐ 60,000 ‐ 60,000 300,000 480,000
Since 2005, the Athens‐Clarke County Police Department has operated a camera system within the Downtown District. Such cameras have added to the
department's situational awareness, have allowed for video recordings in investigative actions, and have added to the general level of safety enjoyed by citizens and
visitors to the district. The requested program funding seeks to allow for repair/maintenance of system components, and allow for all components to be integrated
within a single criminal justice stakeholder framework.
The camera system allows for an increased level of situational awareness for ACCPD personnel, contributes to officer safety, and allows for investigators to review
materials. Should a camera location need to be repaired/replaced/added, costs are approximately $5,000 per site (camera, mounts, connectivity). Each of the 29
camera sites needs to be placed on a 5 year replacement cycle, and a service & maintenance contract enacted for the totality of the system. Costs will appreciate as
the camera system expands to meet operational needs and core system components are replaced as they reach the end of their serviceable life.
No impact.
Capital Detail by Department FY22 Budget D-108
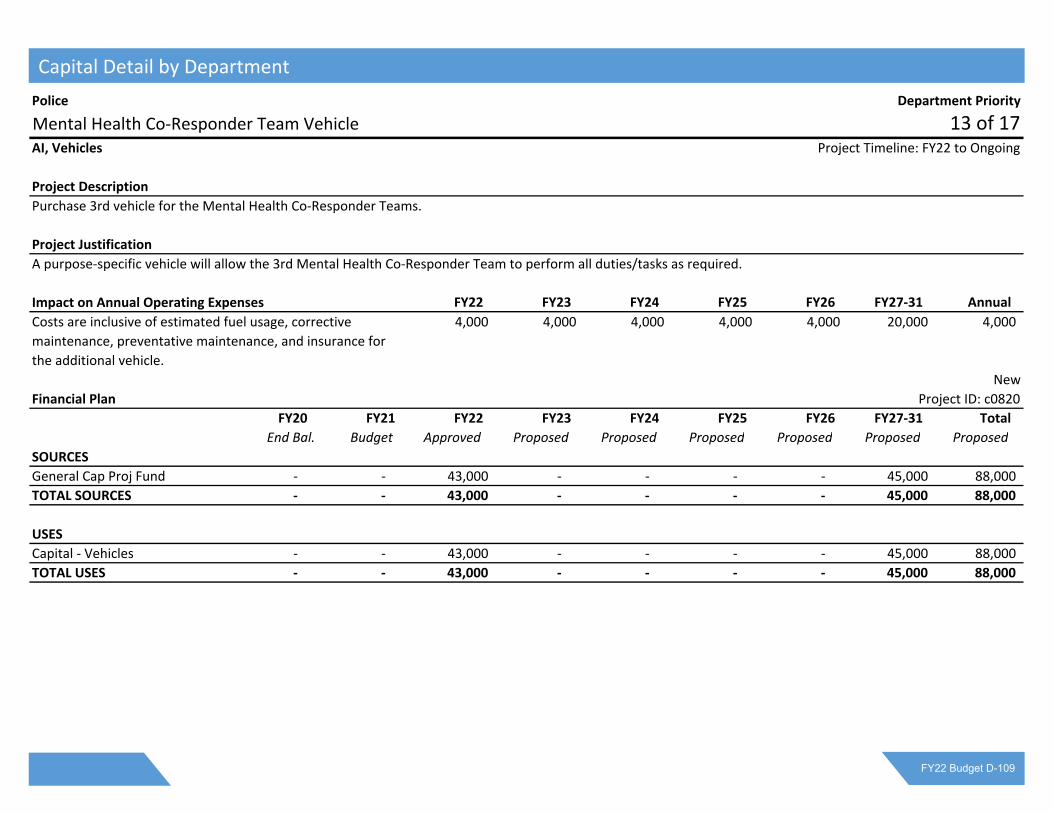
Police Department Priority
Mental Health Co‐Responder Team Vehicle 13 of 17AI, Vehicles Project Timeline: FY22 to Ongoing
Project Description
Project Justification
Impact on Annual Operating Expenses FY22 FY23 FY24 FY25 FY26 FY27‐31 Annual
4,000 4,000 4,000 4,000 4,000 20,000 4,000
New
Financial Plan Project ID: c0820
FY20 FY21 FY22 FY23 FY24 FY25 FY26 FY27‐31 Total
End Bal. Budget Approved Proposed Proposed Proposed Proposed Proposed Proposed
SOURCES
General Cap Proj Fund ‐ ‐ 43,000 ‐ ‐ ‐ ‐ 45,000 88,000
TOTAL SOURCES ‐ ‐ 43,000 ‐ ‐ ‐ ‐ 45,000 88,000
USES
Capital ‐ Vehicles ‐ ‐ 43,000 ‐ ‐ ‐ ‐ 45,000 88,000
TOTAL USES ‐ ‐ 43,000 ‐ ‐ ‐ ‐ 45,000 88,000
Purchase 3rd vehicle for the Mental Health Co‐Responder Teams.
A purpose‐specific vehicle will allow the 3rd Mental Health Co‐Responder Team to perform all duties/tasks as required.
Costs are inclusive of estimated fuel usage, corrective
maintenance, preventative maintenance, and insurance for
the additional vehicle.
Capital Detail by Department
FY22 Budget D-109

Police Department Priority
Replacement of Computer‐Aided Dispatch (CAD) Workstations 14 of 17CS, Other Project Timeline: FY23 to Ongoing
Project Description
Project Justification
Impact on Annual Operating Expenses FY22 FY23 FY24 FY25 FY26 FY27‐31 Annual
‐ ‐ ‐ ‐ ‐ ‐ ‐
New
Financial Plan Project ID: N/A
FY20 FY21 FY22 FY23 FY24 FY25 FY26 FY27‐31 Total
End Bal. Budget Approved Proposed Proposed Proposed Proposed Proposed Proposed
SOURCES
General Cap Proj Fund ‐ ‐ ‐ 60,000 ‐ ‐ ‐ 60,000 120,000
TOTAL SOURCES ‐ ‐ ‐ 60,000 ‐ ‐ ‐ 60,000 120,000
USES
Capital ‐ Other ‐ ‐ ‐ 60,000 ‐ ‐ ‐ 60,000 120,000
TOTAL USES ‐ ‐ ‐ 60,000 ‐ ‐ ‐ 60,000 120,000
The ACCPD seeks to ensure funds are available to replace all Computer‐Aided Dispatch (CAD) workstations (10 units) at the end of the workstations' anticipated
lifespan.
Computer‐Aided Dispatch is a core function of the E911/Communications Center. The workstations should not have an anticipated service life of greater than five
years given: the criticality of services provided by the units and the need for reliable components; a desire to avoid costly repairs; and the need to acquire
software/hardware updates to ensure all functionalities are realized and sustained.
Not anticipated to affect annual operating expenses.
Capital Detail by Department FY22 Budget D-110

Police Department Priority
Mobile Command Center Replacement 15 of 17CS, Vehicle Project Timeline: FY24 to Ongoing
Project Description
Project Justification
Impact on Annual Operating Expenses FY22 FY23 FY24 FY25 FY26 FY27‐31 Annual
‐ ‐ ‐ ‐ ‐ ‐ ‐
New
Financial Plan Project ID: N/A
FY20 FY21 FY22 FY23 FY24 FY25 FY26 FY27‐31 Total
End. Bal. Budget Approved Proposed Proposed Proposed Proposed Proposed Proposed
SOURCES
General Cap Proj Fund ‐ ‐ ‐ ‐ 850,000 ‐ ‐ ‐ 850,000
TOTAL SOURCES ‐ ‐ ‐ ‐ 850,000 ‐ ‐ ‐ 850,000
USES
Capital ‐ Vehicles ‐ ‐ ‐ ‐ 850,000 ‐ ‐ ‐ 850,000
TOTAL USES ‐ ‐ ‐ ‐ 850,000 ‐ ‐ ‐ 850,000
Acquisition of a vehicle in support of operations and tactical communications at incident scenes and special events.
The department's Mobile Command Unit, a 2005 chassis and initially funded under the terms of a grant, is approaching the end of its anticipated service life and will
need to be replaced to ensure timely operational support and tactical communications at incident scenes and special events. This vehicle is not included in the
ACCGov Fleet Replacement Program.
With the removal of the current Mobile Command Center
from service, no additional expense impacts are anticipated.
Capital Detail by Department
FY22 Budget D-111

Police Department Priority
Emergency Medical Dispatch (EMD) Program 16 of 17AI, Other Project Timeline: FY23 to Ongoing
Project Description
Project Justification
Impact on Annual Operating Expenses FY22 FY23 FY24 FY25 FY26 FY27‐31 Annual
‐ ‐ ‐ ‐ ‐ ‐ ‐
Financial Plan Project ID: N/A
FY20 FY21 FY22 FY23 FY24 FY25 FY26 FY27‐31 Total
End. Bal. Budget Approved Proposed Proposed Proposed Proposed Proposed Proposed
SOURCES
General Cap Proj Fund ‐ ‐ ‐ 100,000 ‐ ‐ ‐ ‐ 100,000
TOTAL SOURCES ‐ ‐ ‐ 100,000 ‐ ‐ ‐ ‐ 100,000
USES
Other ‐ ‐ ‐ 100,000 ‐ ‐ ‐ ‐ 100,000
TOTAL USES ‐ ‐ ‐ 100,000 ‐ ‐ ‐ ‐ 100,000
This request is a based on a growing need to implement an Emergency Medical Dispatch (EMD) program and address staffing and equipment needs surrounding the
call handling and dispatch of medical calls in Athens‐Clarke County. Such a program will take at least 3 years to fully develop and field.
This request addresses a fragmented system between dispatch operations involving National EMS and ACC Fire‐Rescue. It also provides an EMD system with
protocols that can be shared with callers who are able to begin patient care prior to the arrival of emergency medical personnel.
Annual operating expenses will be impacted by the proposed
EMD program, yet are unknown at this time.
Capital Detail by Department FY22 Budget D-112

Police Department Priority
Ballistic Vest Replacement (Rifle Plates & Carriers) 17 of 17CS, Equipment Project Timeline: FY24 to Ongoing
Project Description
Project Justification
Impact on Annual Operating Expenses FY22 FY23 FY24 FY25 FY26 FY27‐31 Annual
‐ ‐ ‐ ‐ ‐ ‐ ‐
Financial Plan Project ID: N/A
FY20 FY21 FY22 FY23 FY24 FY25 FY26 FY27‐31 Total
End. Bal. Budget Approved Proposed Proposed Proposed Proposed Proposed Proposed
SOURCES
General Cap Proj Fund ‐ ‐ ‐ ‐ 50,000 ‐ ‐ ‐ 50,000
TOTAL SOURCES ‐ ‐ ‐ ‐ 50,000 ‐ ‐ ‐ 50,000
USES
Capital ‐ Other ‐ ‐ ‐ ‐ 50,000 ‐ ‐ ‐ 50,000
TOTAL USES ‐ ‐ ‐ ‐ 50,000 ‐ ‐ ‐ 50,000
This project seeks to establish a five year replacement cycle for all ACCPD Special Operations Unit ballistic vests (more commonly known by the misnomer, "bullet‐
proof vests"); specifically to allow for the replacement of requisite rifle plates and carriers.
An increased potential exposure to higher caliber weapons and operational needs necessitate that members of the Special Operations Unit are issued additional
ballistic vest components (plates and carriers) with a greater ballistic rating. Of particular note, ballistic vest components must be replaced every five years as to
ensure the integrity of the protective elements. In the past, Special Operations ballistic vests have been purchased as required, a practice which has placed an
unnecessary burden upon departmental operating accounts.
Not anticipated to affect annual operating expenses.
Capital Detail by Department
FY22 Budget D-113

Public Utilities Department Priority
W&S Lines ‐ Additions and Improvements 1 of 18CS, Infrastructure Project Timeline: Ongoing
Project Description
Project Justification
Impact on Annual Operating Expenses FY22 FY23 FY24 FY25 FY26 FY27‐31 Annual
‐ ‐ ‐ ‐ ‐ ‐ ‐
Financial Plan Project ID: c0591
FY20 FY21 FY22 FY23 FY24 FY25 FY26 FY27‐31 Total
End Bal. Budget Approved Proposed Proposed Proposed Proposed Proposed Proposed
SOURCES
Water & Sewer Const. Fund ‐ 955,000 975,000 994,500 1,010,000 1,030,200 1,050,800 5,600,000 10,660,500
TOTAL SOURCES ‐ 955,000 975,000 994,500 1,010,000 1,030,200 1,050,800 5,600,000 10,660,500
USES
Capital ‐ Infrastructure ‐ 955,000 975,000 994,500 1,010,000 1,030,200 1,050,800 5,600,000 10,660,500
TOTAL USES ‐ 955,000 975,000 994,500 1,010,000 1,030,200 1,050,800 5,600,000 10,660,500
In‐house construction costs for capital project labor, equipment/vehicles and materials. Crews work out of the W&S construction office located at 1000 Alexander
Street.
To provide annual funding for labor and materials cost associated with in‐house construction projects to add and improve the water and sewer infrastructure.
No Impact.
Capital Detail by Department FY22 Budget D-114

Public Utilities Department Priority
Meter and Water/Sewer Stub Additions 2 of 18CS, Equipment Project Timeline: Ongoing
Project Description
Project Justification
Impact on Annual Operating Expenses FY22 FY23 FY24 FY25 FY26 FY27‐31 Annual
‐ ‐ ‐ ‐ ‐ ‐ ‐
Financial Plan Project ID: c0589
FY20 FY21 FY22 FY23 FY24 FY25 FY26 FY27‐31 Total
End Bal. Budget Approved Proposed Proposed Proposed Proposed Proposed Proposed
SOURCES
Water & Sewer Const. Fund ‐ 501,600 510,000 520,000 530,000 540,600 551,500 2,927,000 5,579,100
TOTAL SOURCES ‐ 501,600 510,000 520,000 530,000 540,600 551,500 2,927,000 5,579,100
USES
Other ‐ 501,600 510,000 520,000 530,000 540,600 551,500 2,927,000 5,579,100
TOTAL USES ‐ 501,600 510,000 520,000 530,000 540,600 551,500 2,927,000 5,579,100
In‐house construction costs for capital project labor, equipment/vehicles and materials. Crews work out of the Meter Management office located at 1025 Alexander
Street.
To provide annual funding for labor and materials cost associated with in‐house construction and installation of water meters and water and sewer stub additions.
No Impact.
Capital Detail by Department
FY22 Budget D-115

Public Utilities Department Priority
Donated W&S Additions Management 3 of 18CS, Equipment Project Timeline: Ongoing
Project Description
Project Justification
Impact on Annual Operating Expenses FY22 FY23 FY24 FY25 FY26 FY27‐31 Annual
‐ ‐ ‐ ‐ ‐ ‐ ‐
Financial Plan Project ID: c0590
FY20 FY21 FY22 FY23 FY24 FY25 FY26 FY27‐31 Total
End Bal. Budget Approved Proposed Proposed Proposed Proposed Proposed Proposed
SOURCES
Water & Sewer Const. Fund ‐ 226,800 230,000 234,600 239,000 243,800 249,000 1,320,000 2,516,400
TOTAL SOURCES ‐ 226,800 230,000 234,600 239,000 243,800 249,000 1,320,000 2,516,400
USES
Other ‐ 226,800 230,000 234,600 239,000 243,800 249,000 1,320,000 2,516,400
TOTAL USES ‐ 226,800 230,000 234,600 239,000 243,800 249,000 1,320,000 2,516,400
In‐house surveying, design and inspection costs for capital project labor, equipment/vehicles and materials. Crews work out of the Engineering Management office
located at 124 East Hancock Avenue.
To provide annual funding for labor and materials cost associated with management, inspection, and acceptance of donated additions to the water and sewer
infrastructure.
No Impact.
Capital Detail by Department FY22 Budget D-116

Public Utilities Department Priority
Watershed Protection Long‐Term Monitoring 4 of 18CS, General Project Timeline: FY12 to Ongoing
Project Description
Project Justification
Impact on Annual Operating Expenses FY22 FY23 FY24 FY25 FY26 FY27‐31 Annual
‐ ‐ ‐ ‐ ‐ ‐ ‐
Financial Plan Project ID: c0654
FY20 FY21 FY22 FY23 FY24 FY25 FY26 FY27‐31 Total
End Bal. Budget Approved Proposed Proposed Proposed Proposed Proposed Proposed
SOURCES
Water & Sewer Const. Fund 115,239 100,000 100,000 100,000 100,000 100,000 100,000 575,000 1,075,000
TOTAL SOURCES 115,239 100,000 100,000 100,000 100,000 100,000 100,000 575,000 1,075,000
USES
Capital ‐ Other 115,239 100,000 100,000 100,000 100,000 100,000 100,000 575,000 1,075,000
TOTAL USES 115,239 100,000 100,000 100,000 100,000 100,000 100,000 575,000 1,075,000
This project provides annual funding to implement a Long‐Term Watershed Protection Plan and Monitoring to remain in compliance with the standards set by the
Georgia Environmental Protection Division (GAEPD). The Long‐Term Watershed Protection Plan was required by the EPD as part of the issuance of the new NPDES
permits for the upgrade/expansion of three (3) Water Reclamation Facilities. The Long‐Term Water Shed Protection Plan must be updated each year.
These funds will be used to cover expenses incurred in updating ACC PUD's Long‐Term Watershed Protection Plan in accordance with the EPD's requirements. The
scope of the services provided are to include monitoring water quality, compiling data and development of reports for submittal to the EPD. This project is aligned
with the Mayor and Commission strategic commitment of Healthy, Livable and Sustainable Athens‐Clarke County.
No Impact.
Capital Detail by Department
FY22 Budget D-117

Public Utilities Department Priority
Replace Water Meters 5 of 18CS, Equipment Project Timeline: Ongoing
Project Description
Project Justification
Impact on Annual Operating Expenses FY22 FY23 FY24 FY25 FY26 FY27‐31 Annual
‐ ‐ ‐ ‐ ‐ ‐ ‐
Financial Plan Project ID: c0013
FY20 FY21 FY22 FY23 FY24 FY25 FY26 FY27‐31 Total
End Bal. Budget Approved Proposed Proposed Proposed Proposed Proposed Proposed
SOURCES
Water & Sewer Const. Fund 5,154,326 365,000 365,000 365,000 365,000 365,000 365,000 1,825,000 3,650,000
Water & Sewer Fund 1,563,414 ‐ ‐ ‐ ‐ ‐ ‐ ‐
TOTAL SOURCES 6,717,740 365,000 365,000 365,000 365,000 365,000 365,000 1,825,000 3,650,000
USES
Capital ‐ Machinery & Equip 6,717,740 365,000 365,000 365,000 365,000 365,000 365,000 1,825,000 3,650,000
TOTAL USES 6,717,740 365,000 365,000 365,000 365,000 365,000 365,000 1,825,000 3,650,000
The approximate revenue generated/contributed annually for the Meter Replacement Program. This program's single purpose is to ensure that the water meters are
replaced over a designated cycle to ensure accuracy is maintained. This project includes Automated Meter Infrastructure (AMI), which began in FY 2016.
Funding needed for AMI water meter life‐cycle replacements to ensure meter accuracy, fairness in billing, and improved customer service. Replacing AMI meters
through life‐cycle replacement will also help with the Utility's water loss reduction. Continuous funding from Enterprise and Bond account for replacement of this
critical asset is required for sustainable operations. This project is aligned with the Mayor and Commission strategic commitment of Financial Health and Economic
Prosperity.
Predicted increase in operating revenues by replacing meters
which under‐report consumption.
Capital Detail by Department FY22 Budget D-118

Public Utilities Department Priority
Rehabilitate and Replace Sewers 6 of 18CS, Infrastructure Project Timeline: FY12 to Ongoing
Project Description
Project Justification
Impact on Annual Operating Expenses FY22 FY23 FY24 FY25 FY26 FY27‐31 Annual
‐ ‐ ‐ ‐ ‐ ‐ ‐
Financial Plan Project ID: c0644
FY20 FY21 FY22 FY23 FY24 FY25 FY26 FY27‐31 Total
End Bal. Budget Approved Proposed Proposed Proposed Proposed Proposed Proposed
SOURCES
Water & Sewer Const. Fund 37,605,086 5,000,000 7,500,000 7,500,000 10,500,000 7,500,000 6,000,000 30,000,000 69,000,000
TOTAL SOURCES 37,605,086 5,000,000 7,500,000 7,500,000 10,500,000 7,500,000 6,000,000 30,000,000 69,000,000
USES
Capital ‐ Infrastructure 37,605,086 5,000,000 7,500,000 7,500,000 10,500,000 7,500,000 6,000,000 30,000,000 69,000,000
TOTAL USES 37,605,086 5,000,000 7,500,000 7,500,000 10,500,000 7,500,000 6,000,000 30,000,000 69,000,000
Evaluation of the sewer lines is the first step in determining specific locations in need of rehabilitation. The evaluation process is conducted utilizing a number of different procedures
such as TV inspection, smoke testing, as‐built surveys and monitoring existing flow conditions. The specific locations and the rehabilitation or replacement methods will be determined
on a case‐by‐case basis. This project also includes Sewer System Evaluation Survey (SSES) inspections and cured‐in‐place pipe lining rehabilitation where needed on sewer pipes in the
highest‐ranked‐flow meter basins, which comprise of 260 miles of pipe. SSES and R&R costs continue into out years to evaluate and rehabilitate trunk, interceptor and collection
system assets. Finally, and most importantly, the project work will add capacity to existing sewers for existing customers. The latter includes replacing sewers in these sewersheds:
Brooklyn, Tanyard, Upper North Oconee, Middle Oconee East and McNutt Creek.
Sections of the existing wastewater collection system are 80‐100 years old and much of the system was constructed with vitrified clay pipe. As a result, there are sections of pipe
within the wastewater collection system experiencing inflow and infiltration problems. These problems may be minor cracks in pipe or they could represent sections experiencing
major structural problems. Locating and correcting these problems will ensure the integrity of the wastewater collection system and help eliminate wet‐weather sewer system
overflows and will restore both sewer and plant capacity. Continuous funding for replacement of this critical asset is required for sustainable operations. This project is aligned with
the Mayor and Commission strategic commitments of Financial Health and Economic Prosperity and Accountable and Responsive Government.
Predicted decrease in emergency calls, overtime, and emergency
repairs. Predicted decrease in wastewater reclamation costs and
deferral of future Water Reclamation Facility expansion. Added cost
for depreciation.
Capital Detail by Department
FY22 Budget D-119

Public Utilities Department Priority
Extend Wastewater Collection System 7 of 18AI, Infrastructure Project Timeline: Ongoing
Project Description
Project Justification
Impact on Annual Operating Expenses FY22 FY23 FY24 FY25 FY26 FY27‐31 Annual
‐ ‐ ‐ ‐ ‐ ‐ ‐
Financial Plan Project ID: c0112
FY20 FY21 FY22 FY23 FY24 FY25 FY26 FY27‐31 Total
End Bal. Budget Approved Proposed Proposed Proposed Proposed Proposed Proposed
SOURCES
Water & Sewer Const. Fund 4,984,504 100,000 100,000 100,000 100,000 100,000 100,000 2,000,000 2,500,000
TOTAL SOURCES 4,984,504 100,000 100,000 100,000 100,000 100,000 100,000 2,000,000 2,500,000
USES
Capital ‐ Infrastructure 4,984,504 100,000 100,000 100,000 100,000 100,000 100,000 2,000,000 2,500,000
TOTAL USES 4,984,504 100,000 100,000 100,000 100,000 100,000 100,000 2,000,000 2,500,000
Through the year 2035, new trunk sewers and interceptor sewer lines may be constructed and/or extended into sub‐basins currently without public sewer service.
Such extensions could either be by gravity sewer (with or without pump stations) or by small‐diameter pressurized systems. Bond money will be used for the Upper
North Oconee sewer line improvements. This placeholder capital project thus provides a funding source should Mayor and Commission decide to extend the sewer
system.
To provide capacity in areas where service does not currently exist and provide service for new customers. Conversion of problematic individual sewage disposal
systems to public sewer could also improve stream quality. Funding is thus available if neighborhoods on septic tank systems petition for sewer extension via
creation of special improvement districts. This project is aligned with the Mayor and Commission strategic commitment of Healthy, Livable and Sustainable Athens‐
Clarke County.
Increased costs of wastewater collection and treatment offset
by increased revenues.
Capital Detail by Department FY22 Budget D-120

Public Utilities Department Priority
Replace and Upgrade Facilities and Equipment 8 of 18CS, Equipment Project Timeline: Ongoing
Project Description
Project Justification
Impact on Annual Operating Expenses FY22 FY23 FY24 FY25 FY26 FY27‐31 Annual
‐ ‐ ‐ ‐ ‐ ‐ ‐
Financial Plan Project ID: c0216/c0217/c0218/c0219/c0563
FY20 FY21 FY22 FY23 FY24 FY25 FY26 FY27‐31 Total
End Bal. Budget Approved Proposed Proposed Proposed Proposed Proposed Proposed
SOURCES
Water & Sewer Const. Fund 10,533,907 3,300,000 3,400,000 3,450,000 3,300,000 3,450,000 3,516,400 18,625,419 35,741,819
TOTAL SOURCES 10,533,907 3,300,000 3,400,000 3,450,000 3,300,000 3,450,000 3,516,400 18,625,419 35,741,819
USES
Capital ‐ Machinery & Equip 10,533,907 3,300,000 3,400,000 3,450,000 3,300,000 3,450,000 3,516,400 18,625,419 35,741,819
TOTAL USES 10,533,907 3,300,000 3,400,000 3,450,000 3,300,000 3,450,000 3,516,400 18,625,419 35,741,819
Annual cost to replace and / or conduct major repairs to fixed equipment and facilities within the Public Utilities Department (PUD). Facilities include the drinking
water plant and intakes, water reclamation facilities, the Water Resources Center, 124 East Hancock Avenue, Water & Sewer Construction & Maintenance shop, and
the Meter Management shop. Also includes vehicles and stocking critical spare parts as required by EPD permits. This program also includes upgrades which
improve plant efficiency, permit compliance and / or performance reliability. Land acquisition and construction of new shops for Water & Sewer and Meters is
included.
Avoid spikes in the water rates by maintaining a consistent level of funding for major repairs and replacement. Continuous funding for replacement of equipment is
required for sustainable operations, reliable performance under the Safe Drinking Water Act and Clean Water Act, and for compliance with permit conditions. For
example, our Clean Water Act permits state that the "permittee shall maintain ... all treatment or control facilities and related equipment". This project is aligned
with the Mayor and Commission strategic commitments of Financial Health and Economic Prosperity and Accountable and Responsive Government.
Net zero impact. Cost savings can derive from the following:
avoid permit penalties; shift from corrective maintenance to
less expensive preventive maintenance; gain treatment
process efficiencies. Added cost from increased depreciation.
Capital Detail by Department
FY22 Budget D-121

Public Utilities Department Priority
Rehabilitate and Replace Water Lines 9 of 18CS, Infrastructure Project Timeline: FY17 to Ongoing
Project Description
Project Justification
Impact on Annual Operating Expenses FY22 FY23 FY24 FY25 FY26 FY27‐31 Annual
‐ ‐ ‐ ‐ ‐ ‐ ‐
Financial Plan Project ID: c0720
FY20 FY21 FY22 FY23 FY24 FY25 FY26 FY27‐31 Total
End Bal. Budget Approved Proposed Proposed Proposed Proposed Proposed Proposed
SOURCES
Water & Sewer Const. Fund 2,443,405 3,000,000 3,000,000 3,000,000 3,000,000 3,000,000 3,000,000 15,000,000 30,000,000
TOTAL SOURCES 2,443,405 3,000,000 3,000,000 3,000,000 3,000,000 3,000,000 3,000,000 15,000,000 30,000,000
USES
Capital ‐ Infrastructure 2,443,405 3,000,000 3,000,000 3,000,000 3,000,000 3,000,000 3,000,000 15,000,000 30,000,000
TOTAL USES 2,443,405 3,000,000 3,000,000 3,000,000 3,000,000 3,000,000 3,000,000 15,000,000 30,000,000
This R&R program includes a) replacement of small diameter water mains, b) leak detection program, c) repairing leaks, d) relining and replacing older mains, and e)
gridding or looping existing dead‐end lines. Where homes and businesses are on wells, this program includes funding for fire protection extensions. The individual
R&R projects will be turnkey and will therefore include reconnection of services to the main and, as needed, relocation of meters.
This reinvestment in a substantial part of the utility's public health and safety infrastructure will improve the hydraulic capacity of the water distribution system,
enhance fire protection, reduce discolored water complaints, help maintain ACC's ISO fire rating and extend the life of the older water mains. Replacing break‐prone
water lines will reduce the utility's real water losses and reduce customer outages. The leak detection program will make this program more cost effective by
maximizing the expenditure for R&R measured against real losses. This project is aligned with the Mayor and Commission strategic commitments of Financial Health
and Economic Prosperity and Accountable and Responsive Government.
Predicted decrease in emergency calls, overtime, and
emergency repairs. Predicted decrease in water treatment
costs and deferral of future water treatment plant expansion.
Added cost to depreciation.
Capital Detail by Department FY22 Budget D-122

Public Utilities Department Priority
Relocate Water & Sewer Lines for DOT Projects 10 of 18CS, Infrastructure Project Timeline: Ongoing
Project Description
Project Justification
Impact on Annual Operating Expenses FY22 FY23 FY24 FY25 FY26 FY27‐31 Annual
‐ ‐ ‐ ‐ ‐ ‐ ‐
Financial Plan Project ID: c0102
FY20 FY21 FY22 FY23 FY24 FY25 FY26 FY27‐31 Total
End Bal. Budget Approved Proposed Proposed Proposed Proposed Proposed Proposed
SOURCES
Water & Sewer Const. Fund 517,772 2,000,000 100,000 100,000 100,000 100,000 100,000 500,000 1,000,000
TOTAL SOURCES 517,772 2,000,000 100,000 100,000 100,000 100,000 100,000 500,000 1,000,000
USES
Capital ‐ Infrastructure 517,772 2,000,000 100,000 100,000 100,000 100,000 100,000 500,000 1,000,000
TOTAL USES 517,772 2,000,000 100,000 100,000 100,000 100,000 100,000 500,000 1,000,000
This project provides annual funding to cover water / sewer line relocations for transportation projects not covered by another project. It is anticipated that in future
years FY21‐24 the proposed request will be removed, with a carryforward target of $500,000.
To avoid spikes in the water rates by maintaining a consistent level of funding for DOT initiated water/sewer line relocation projects. This project is aligned with the
Mayor and Commission strategic commitment of Transportation Mobility and Connectivity.
No Impact.
Capital Detail by Department
FY22 Budget D-123

Public Utilities Department Priority
Manage and Reuse Residual Solids 11 of 18CS, Infrastructure Project Timeline: Ongoing
Project Description
Project Justification
Impact on Annual Operating Expenses FY22 FY23 FY24 FY25 FY26 FY27‐31 Annual
‐ ‐ ‐ ‐ ‐ ‐ ‐
Financial Plan Project ID: c0548
FY20 FY21 FY22 FY23 FY24 FY25 FY26 FY27‐31 Total
End Bal. Budget Approved Proposed Proposed Proposed Proposed Proposed Proposed
SOURCES
Water & Sewer Const. Fund 2,248,728 6,380,000 4,780,000 300,000 300,000 300,000 300,000 25,000,000 30,980,000
TOTAL SOURCES 2,248,728 6,380,000 4,780,000 300,000 300,000 300,000 300,000 25,000,000 30,980,000
USES
Capital ‐ Const. 2,248,728 6,380,000 4,780,000 300,000 300,000 300,000 300,000 25,000,000 30,980,000
TOTAL USES 2,248,728 6,380,000 4,780,000 300,000 300,000 300,000 300,000 25,000,000 30,980,000
Reduce and reuse residual solids from wastewater treatment. In addition to current composting, pursue opportunities for other modes of biosolids beneficial reuse
by upgrading biosolids stabilization and drying. Continue to dredge the alum sludge lagoon at the water plant approximately every 6‐7 years until the solids handling
facility is constructed at the J.G. Beacham Water Treatment Plant.
Alternative plans for biosolids could extend the life of the ACC landfill. Based on the volume of waste by‐product being received at the WTP, dredging the sludge
lagoon is the most cost effective at this time. This project is aligned with the Mayor and Commission strategic commitments of Healthy, Livable and Sustainable
Athens‐Clarke County.
Biosolids treatment, handling and disposal cost will increase
by an undetermined amount. ACC landfill operating costs may
decline with beneficial reuse.
Capital Detail by Department FY22 Budget D-124

Public Utilities Department Priority
Improve Water Supply Reliability 12 of 18CS, Infrastructure Project Timeline: FY18 to FY38
Project Description
Project Justification
Impact on Annual Operating Expenses FY22 FY23 FY24 FY25 FY26 FY27‐31 Annual
‐ ‐ ‐ ‐ ‐ ‐ ‐
Financial Plan Project ID: c0719
FY20 FY21 FY22 FY23 FY24 FY25 FY26 FY27‐31 Total
End Bal. Budget Approved Proposed Proposed Proposed Proposed Proposed Proposed
SOURCES
Water & Sewer Const. Fund 9,004,717 4,479,000 6,000,000 2,000,000 3,000,000 3,000,000 9,000,000 35,000,000 58,000,000
TOTAL SOURCES 9,004,717 4,479,000 6,000,000 2,000,000 3,000,000 3,000,000 9,000,000 35,000,000 58,000,000
USES
Capital ‐ Other 9,004,717 4,479,000 6,000,000 2,000,000 3,000,000 3,000,000 9,000,000 35,000,000 58,000,000
TOTAL USES 9,004,717 4,479,000 6,000,000 2,000,000 3,000,000 3,000,000 9,000,000 35,000,000 58,000,000
Implement the first phase of a non‐potable recycled water utility consistent with an overarching master plan of non‐potable and potable reuse and to develop a water storage facility and conveyance of
raw water. The non‐potable water utility makes existing ratepayers less vulnerable to water shortages by switching bulk users of potable water to non‐potable water (recycling of wastewater). Additional
raw water storage provides water during protracted drought, nearly drought‐proofing the community into the foreseeable future.
Part of the intent of a reuse system is to displace demand on potable supplies; non‐potable reuse is thus an element of a larger strategy to drought‐proof existing supplies by reducing raw water
withdrawals from the rivers or reservoir. Other elements which make the community less vulnerable to drought include current and future conservation programs, tiered pricing on discretionary water (as
exists), and potable reuse where opportune. In the latter case, and if the community is willing, purified recycled water could be mixed with raw water in the storage facility described below, thus providing
an additional source of water to the drinking water treatment plant.
Additional raw water storage is also an element of a larger strategy to drought‐proof existing supplies by making available raw water when the rivers and/or Bear Creek Reservoir are unavailable due to
drought or other issues. Raw water storage serves as ballast between intake (raw water withdrawal) and the drinking water plant; most large water systems that rely on river flow have many weeks of
local raw water storage to weather either reduced river flows or water quality problems with the supply source, such as a chemical spill. ACC’s share in Bear Creek Reservoir partially fulfills this purpose.
But the prospects of a drought worse than design are a chronic concern to water purveyors.
This project is aligned with the M&C strategic commitment of Safe and Prepared Community.
To be determined. Although replacing potable with less‐expensive reuse
water would diminish revenue from potable water sales, ratepayers benefit
from the reduced likelihood of enforced reductions during a drought.
Capital Detail by Department
FY22 Budget D-125

Public Utilities Department Priority
W&S Contribution to Economic Development 13 of 18AI, Infrastructure Project Timeline: Ongoing
Project Description
Project Justification
Impact on Annual Operating Expenses FY22 FY23 FY24 FY25 FY26 FY27‐31 Annual
‐ ‐ ‐ ‐ ‐ ‐ ‐
Financial Plan Project ID: c0105
FY20 FY21 FY22 FY23 FY24 FY25 FY26 FY27‐31 Total
End Bal. Budget Approved Proposed Proposed Proposed Proposed Proposed Proposed
SOURCES
Water & Sewer Const. Fund 771,013 100,000 100,000 100,000 100,000 100,000 100,000 500,000 1,000,000
TOTAL SOURCES 771,013 100,000 100,000 100,000 100,000 100,000 100,000 500,000 1,000,000
USES
Capital ‐ Other 771,013 100,000 100,000 100,000 100,000 100,000 100,000 500,000 1,000,000
TOTAL USES 771,013 100,000 100,000 100,000 100,000 100,000 100,000 500,000 1,000,000
The annual contribution for economic development projects which are not part of the Service Delivery Plan.
To provide a consistent level of funding for economic development projects which are not identified in other named projects. By providing a consistent level of
funding, spikes in the water rates can be avoided. The level of funding is based on average annual expenditures for projects of this type. This project is aligned with
the M&C strategic commitment of Financial Health and Economic Prosperity. A carryforward balance of $300,00 is targeted.
No Impact.
Capital Detail by Department FY22 Budget D-126

Public Utilities Department Priority
Investigate and Install Alternative Energy Generation 14 of 18CS, Equipment Project Timeline: Ongoing
Project Description
Project Justification
Impact on Annual Operating Expenses FY22 FY23 FY24 FY25 FY26 FY27‐31 Annual
‐ ‐ ‐ ‐ ‐ ‐ ‐
Financial Plan Project ID: c0718
FY20 FY21 FY22 FY23 FY24 FY25 FY26 FY27‐31 Total
End Bal. Budget Approved Proposed Proposed Proposed Proposed Proposed Proposed
SOURCES
Water & Sewer Const. Fund 110,460 50,000 100,000 ‐ 2,690,000 ‐ ‐ 500,000 3,290,000
TOTAL SOURCES 110,460 50,000 100,000 ‐ 2,690,000 ‐ ‐ 500,000 3,290,000
USES
Capital ‐ Site Improvements 110,460 50,000 100,000 ‐ 2,690,000 ‐ ‐ 500,000 3,290,000
TOTAL USES 110,460 50,000 100,000 ‐ 2,690,000 ‐ ‐ 500,000 3,290,000
Investigate alternative sources of energy for water and wastewater treatment if determined to be feasible and cost neutral. This project includes the installation and
maintenance of a solar energy generation facility at the Cedar Creek Water Reclamation Facility.
This project is aligned with the Mayor and Commission strategic commitments of Healthy, Livable and Sustainable Athens‐Clarke County.
No Impact.
Capital Detail by Department
FY22 Budget D-127

Public Utilities Department Priority
WRF Phosphorous Improvements 15 of 18AI, Equipment Project Timeline: FY19 to Ongoing
Project Description
Project Justification
Impact on Annual Operating Expenses FY22 FY23 FY24 FY25 FY26 FY27‐31 Annual
‐ ‐ ‐ ‐ ‐ ‐ ‐
Financial Plan Project ID: c0786
FY20 FY21 FY22 FY23 FY24 FY25 FY26 FY27‐31 Total
End Bal. Budget Approved Proposed Proposed Proposed Proposed Proposed Proposed
SOURCES
Water & Sewer Const. Fund 8,129,058 9,000,000 5,500,000 2,000,000 2,000,000 500,000 ‐ ‐ 10,000,000
W&S Bonds Const. Fund 6,444,249 ‐ ‐ ‐ ‐ ‐ ‐ ‐ ‐
TOTAL SOURCES 14,573,307 9,000,000 5,500,000 2,000,000 2,000,000 500,000 ‐ ‐ 10,000,000
USES
Capital ‐ Site Improvements 14,573,307 9,000,000 5,500,000 2,000,000 2,000,000 500,000 ‐ ‐ 10,000,000
TOTAL USES 14,573,307 9,000,000 5,500,000 2,000,000 2,000,000 500,000 ‐ ‐ 10,000,000
The NPDES permitted phosphorus limit is changing. This project addresses necessary upgrades at the three Water Reclamation Facilities.
This project was approved by Mayor & Commission on October 2, 2018. An agenda item was necessary to address the changes in timing and budget versus those
planned as part of the 2015 Service Delivery Update. This project aligns with the Healthy, Livable, Sustainable Athens‐Clarke County and the Safe and Prepared
Community FY19 Strategic Commitments.
No impact.
Capital Detail by Department FY22 Budget D-128

Public Utilities Department Priority
Water & Sewer Additions and Improvements 16 of 20AI, Infrastructure Project Timeline: FY21 to Ongoing
Project Description
Project Justification
Impact on Annual Operating Expenses FY22 FY23 FY24 FY25 FY26 FY27‐31 Annual
‐ ‐ ‐ ‐ ‐ ‐ ‐
Financial Plan Project ID: c0104
FY20 FY21 FY22 FY23 FY24 FY25 FY26 FY27‐31 Total
End. Bal. Budget Approved Proposed Proposed Proposed Proposed Proposed Proposed
SOURCES
Water & Sewer Const. Fund 404,707 200,000 200,000 200,000 200,000 200,000 200,000 1,000,000 2,000,000
TOTAL SOURCES 404,707 200,000 200,000 200,000 200,000 200,000 200,000 1,000,000 2,000,000
USES
Capital ‐ Infrastructure 404,707 200,000 200,000 200,000 200,000 200,000 200,000 1,000,000 2,000,000
TOTAL USES 404,707 200,000 200,000 200,000 200,000 200,000 200,000 1,000,000 2,000,000
This project provides annual funding to cover projects which do not fall under any of the other categories, such as replacement/repair of damaged river crossings,
replacement of old and/or deteriorated water mains and sewer lines, minor projects to meet new regulatory requirements, etc.
To provide a consistent level of funding for repairs and replacements to water/sewer lines, which are not identified in other named projects, to avoid spikes in the
water rates. The level of funding is based on average annual expenditures.
No impact.
Capital Detail by Department
FY22 Budget D-129

Public Utilities Department Priority
Downtown Infrastructure Improvements 17 of 20AI, Infrastructure Project Timeline: FY21 to Ongoing
Project Description
Project Justification
Impact on Annual Operating Expenses FY22 FY23 FY24 FY25 FY26 FY27‐31 Annual
‐ ‐ ‐ ‐ ‐ ‐ ‐
Financial Plan Project ID: c0254
FY20 FY21 FY22 FY23 FY24 FY25 FY26 FY27‐31 Total
End. Bal. Budget Approved Proposed Proposed Proposed Proposed Proposed Proposed
SOURCES
Water & Sewer Const. Fund 1,231,912 300,000 250,000 250,000 250,000 250,000 250,000 1,250,000 2,500,000
TOTAL SOURCES 1,231,912 300,000 250,000 250,000 250,000 250,000 250,000 1,250,000 2,500,000
USES
Capital ‐ Infrastructure 1,231,912 300,000 250,000 250,000 250,000 250,000 250,000 1,250,000 2,500,000
TOTAL USES 1,231,912 300,000 250,000 250,000 250,000 250,000 250,000 1,250,000 2,500,000
Replace and upgrade water & sewer mains. Existing water & sewer lines and service connections and water meters will be upgraded and/or replaced along the route
of the water main replacement. This project addresses some of the oldest water mains in the ACC‐PUD system.
The scope of this project has been expanded to include areas adjoining the downtown area. The project duration is indefinite.
No impact.
Capital Detail by Department FY22 Budget D-130

Public Utilities Department Priority
Renovate/Expand W&S/Meter Mgt Construction Facility 18 of 20CS, Infrastructure Project Timeline: FY21 to FY23
Project Description
Project Justification
Impact on Annual Operating Expenses FY22 FY23 FY24 FY25 FY26 FY27‐31 Annual
‐ ‐ ‐ ‐ ‐ ‐ ‐
Financial Plan Project ID: c0647
FY20 FY21 FY22 FY23 FY24 FY25 FY26 FY27‐31 Total
End. Bal. Budget Approved Proposed Proposed Proposed Proposed Proposed Proposed
SOURCES
Water & Sewer Const. Fund 1,770,832 400,000 ‐ ‐ ‐ ‐ ‐ 8,000,000 8,000,000
TOTAL SOURCES 1,770,832 400,000 ‐ ‐ ‐ ‐ ‐ 8,000,000 8,000,000
USES
Capital ‐ Infrastructure 1,770,832 400,000 ‐ ‐ ‐ ‐ ‐ 8,000,000 8,000,000
TOTAL USES 1,770,832 400,000 ‐ ‐ ‐ ‐ ‐ 8,000,000 8,000,000
Determine the location, design and construct a building which can house both the Water & Sewer and Meter Management division staff. To provide an adequate
facility for existing and future requirements inclusive of vehicular and equipment parking and a materials storage area.
This project accommodates the long‐range goal of the Water Treatment Plant Master Plan in regards to future expansion and plant upgrades. The new facility will
provide adequate office and equipment space for staff, and future land purchases will be offset by the sale of land on Alexander Street owned by ACC PUD. This
project aligns with the Healthy, Livable, Sustainable Athens‐Clarke County FY20 M&C Strategic Commitments.
No impact.
Capital Detail by Department
FY22 Budget D-131

Public Utilities Department Priority
Water Transmission Grid Improvements 19 of 20AI, Infrastructure Project Timeline: Ongoing
Project Description
Project Justification
Impact on Annual Operating Expenses FY22 FY23 FY24 FY25 FY26 FY27‐31 Annual
‐ ‐ ‐ ‐ ‐ ‐ ‐
Financial Plan Project ID: c0787
FY20 FY21 FY22 FY23 FY24 FY25 FY26 FY27‐31 Total
End Bal. Budget Approved Proposed Proposed Proposed Proposed Proposed Proposed
SOURCES
Water & Sewer Const. Fund 2,439,453 ‐ 650,000 2,100,000 2,100,000 ‐ ‐ ‐ 4,850,000
TOTAL SOURCES 2,439,453 ‐ 650,000 2,100,000 2,100,000 ‐ ‐ ‐ 4,850,000
USES
Capital ‐ Infrastructure 2,439,453 ‐ 650,000 2,100,000 2,100,000 ‐ ‐ ‐ 4,850,000
TOTAL USES 2,439,453 ‐ 650,000 2,100,000 2,100,000 ‐ ‐ ‐ 4,850,000
To provide redundancy in the water distribution system by performing interconnections at numerous junctures for large diameter pipes resulting in improved water
service reliability and fire protection.
Failure of the West Athens Transmission Line would impact much of the water service area with either total loss of service or water pressure below safe levels, with
accompanying boil water notices and impaired fire protection. Improvements to the grid structure will reduce the impact should the transmission line be out of
service because of breaks or the need for planned maintenance. This project is consistent with the M&C strategic commitment of Safe and Prepared Community.
This is an infrastructure improvement construction project.
No annual operating expenses are anticipated.
Capital Detail by Department FY22 Budget D-132

Public Utilities Department Priority
Utility Billing System 20 of 20AI, Infrastructure Project Timeline: Ongoing
Project Description
Project Justification
Impact on Annual Operating Expenses FY22 FY23 FY24 FY25 FY26 FY27‐31 Annual
‐ ‐ ‐ ‐ ‐ ‐ ‐
New
Financial Plan Project ID: c0821
FY20 FY21 FY22 FY23 FY24 FY25 FY26 FY27‐31 Total
End Bal. Budget Approved Proposed Proposed Proposed Proposed Proposed Proposed
SOURCES
Water & Sewer Const. Fund ‐ ‐ 100,000 300,000 ‐ ‐ ‐ ‐ 400,000
TOTAL SOURCES ‐ ‐ 100,000 300,000 ‐ ‐ ‐ ‐ 400,000
USES
Capital ‐ Other ‐ ‐ 100,000 300,000 ‐ ‐ ‐ ‐ 400,000
TOTAL USES ‐ ‐ 100,000 300,000 ‐ ‐ ‐ ‐ 400,000
Evaluation and purchase of financial software be used by ACCGov Public Utilities Department water business office for billing and engage billing software consultant
to marshal the procurement and installation.
The current billing system is in need of replacement.
No Impact.
Capital Detail by Department
FY22 Budget D-133

Sheriff Department Priority
Public Safety Initiative ‐Equip Tech 1 of 7CS, Equipment Project Timeline: FY05 to Ongoing
Project Description
Project Justification
Impact on Annual Operating Expenses FY22 FY23 FY24 FY25 FY26 FY27‐31 Annual
‐ ‐ ‐ ‐ ‐ ‐ ‐
Financial Plan Project ID: c0417
FY20 FY21 FY22 FY23 FY24 FY25 FY26 FY27‐31 Total
End Bal. Budget Approved Proposed Proposed Proposed Proposed Proposed Proposed
SOURCES
General Capital Fund 27,506 30,000 ‐ 30,000 30,000 30,000 30,000 150,000 270,000
TOTAL SOURCES 27,506 30,000 ‐ 30,000 30,000 30,000 30,000 150,000 270,000
USES
Capital ‐ Machinery & Equip 27,506 30,000 ‐ 30,000 30,000 30,000 30,000 150,000 270,000
TOTAL USES 27,506 30,000 ‐ 30,000 30,000 30,000 30,000 150,000 270,000
Public Safety, Field Service Initiative: Investment in new law enforcement technology, equipment and matching funds for grants as approved by Mayor and
Commission.
Continue office upgrades, along with camera and recording systems at the jail and courthouse, including repair and replacement of cameras, wiring, etc., as needed.
Purchase of new duty gear that utilizes the newest technology such as firearms, electronic control devices, wearable cameras, etc. Provide the necessary funding for
a staffing analysis of the Field Section of the Sheriff's Office. Provide matching local funds for grants. These funds have been needed for local cash match monies for
grants and will be needed for future grant opportunities.
No Impact.
Capital Detail by Department FY22 Budget D-134

Sheriff Department Priority
Replace Mobile Data Computers 2 of 7CS, Equipment Project Timeline: FY10 to Ongoing
Project Description
Project Justification
Impact on Annual Operating Expenses FY22 FY23 FY24 FY25 FY26 FY27‐31 Annual
19,520 19,520 19,520 19,520 19,520 97,600 19,520
Financial Plan Project ID: c0715
FY20 FY21 FY22 FY23 FY24 FY25 FY26 FY27‐31 Total
End Bal. Budget Approved Proposed Proposed Proposed Proposed Proposed Proposed
SOURCES
General Capital Fund ‐ ‐ 76,000 ‐ ‐ ‐ ‐ 76,000 152,000
TOTAL SOURCES ‐ ‐ 76,000 ‐ ‐ ‐ ‐ 76,000 152,000
USES
Capital ‐ Machinery & Equip ‐ ‐ 76,000 ‐ ‐ ‐ ‐ 76,000 152,000
TOTAL USES ‐ ‐ 76,000 ‐ ‐ ‐ ‐ 76,000 152,000
To purchase 20 Mobile Data Terminals (computers) that will be used by the Clarke County Sheriff’s Office Field Deputies in their cars to conduct their daily duties
while out in the field. The cost of the project includes an extended maintenance and warranty plan for the equipment.
This project allows for deputies to access the Public Safety Records Management System in the field through mobile data terminals (computers) to conduct the
following tasks:
. Check status of arrest warrants
. Access photographs and other personal information on wanted persons
. Access Temporary Protection Orders to check for compliance
. Access the sexual offender registry to check for compliance
. Access maps and other tools for criminal investigations.
. Access criminal history information on wanted person
The ability to conduct these tasks in the field verses the office saves time and resources.
Service requirement of 8 additional mobile data computers
(12 units to 20 units) and replacement costs
Capital Detail by Department
FY22 Budget D-135

Sheriff Department Priority
Purchase Body Security Scanning System 3 of 7AI, Equipment Project Timeline: FY22 to Ongoing
Project Description
Project Justification
Impact on Annual Operating Expenses FY22 FY23 FY24 FY25 FY26 FY27‐31 Annual
‐ 10,000 10,000 10,000 10,000 50,000 100,000
New
Financial Plan Project ID: N/A
FY20 FY21 FY22 FY23 FY24 FY25 FY26 FY27‐31 Total
End Bal. Budget Approved Proposed Proposed Proposed Proposed Proposed Proposed
SOURCES
General Capital Fund ‐ ‐ ‐ ‐ ‐ ‐ ‐ 138,000 138,000
TOTAL SOURCES ‐ ‐ ‐ ‐ ‐ ‐ ‐ 138,000 296,000
USES
Capital ‐ Machinery & Equip ‐ ‐ ‐ ‐ ‐ ‐ ‐ 138,000 138,000
TOTAL USES ‐ ‐ ‐ ‐ ‐ ‐ 138,000 138,000
Purchase of full body security scanning sytem to be used as a means of protection of staff members and inmates at the jail. This scanner will detect and deter
dangerous contraband hidden both inside and outside of the body.
Deputies at the Sheriff's Office must book, release, and transport inmates to various locations within Athens‐Clarke County and other jurisdictions. This equipment
would give the Sheriff's Office the ability to provide a safe and secure jail facility, and keep deputies and community members safe as well.
10 year preventative maintenance contract.
Capital Detail by Department FY22 Budget D-136

Sheriff Department Priority
Purchase Body Worn Cameras 4 of 7CS, Public Safety Equipment Project Timeline: FY23 to Ongoing
Project Description
Project Justification
Impact on Annual Operating Expenses FY22 FY23 FY24 FY25 FY26 FY27‐31 Annual
‐ ‐ 60,000 60,000 60,000 300,000 48,000
Financial Plan Project ID: c0796
FY20 FY21 FY22 FY23 FY24 FY25 FY26 FY27‐31 Total
End Bal. Budget Approved Proposed Proposed Proposed Proposed Proposed Proposed
SOURCES
General Capital Fund ‐ ‐ ‐ 300,000 ‐ 50,000 350,000 700,000
TOTAL SOURCES ‐ ‐ ‐ 300,000 ‐ 50,000 ‐ 350,000 700,000
USES
Capital ‐ Machinery & Equip ‐ ‐ ‐ 300,000 ‐ 50,000 ‐ 350,000 700,000
TOTAL USES ‐ ‐ ‐ 300,000 ‐ 50,000 ‐ 350,000 700,000
Provide replacement Body Worn Camera to Sheriff Jail Section (125 units) in FY23 and Field Section (25 units) in FY25. Included in the first year pricing for the jail
and field is the camera purchase, service, software, support, and video storage. Life expectacy for equipment is 5 years.
Body Worn Cameras (BWC) contribute to safety, transparency, and accountability of detention staff in jail operations. Availability and visibility of BWC equipment
creates an immediate positive change in the demeanor and behavior of individuals in law enforcement encounters. Availability of video and audio record of law
enforcement encounters enhances investigative accuracy of information for investigation of criminal behavior, potential inmate/citizen complaints, and review of
law enforcement conduct. This combination of available information increases safety of law enforcement and community members, increases transparency of
incident information, and reduces liability and associated costs.
Video storage after year one.
Capital Detail by Department
FY22 Budget D-137

Sheriff Department Priority
Purchase Tasers and Related Equipment 5 of 7CS, Public Safety Equipment Project Timeline: FY21 to Ongoing
Project Description
Project Justification
Impact on Annual Operating Expenses FY22 FY23 FY24 FY25 FY26 FY27‐31 Annual
‐ 25,571 25,571 25,571 25,571 127,855 23,014
Financial Plan Project ID: N/A
FY20 FY21 FY22 FY23 FY24 FY25 FY26 FY27‐31 Total
End Bal. Budget Approved Proposed Proposed Proposed Proposed Proposed Proposed
SOURCES
General Capital Fund ‐ ‐ ‐ 103,000 ‐ ‐ ‐ 103,000 206,000
TOTAL SOURCES ‐ ‐ 103,000 ‐ ‐ ‐ 103,000 206,000
USES
Capital ‐ Machinery & Equip ‐ ‐ ‐ 103,000 ‐ ‐ ‐ 103,000 206,000
TOTAL USES ‐ ‐ 103,000 ‐ ‐ ‐ 103,000 206,000
This project will provide provision and replacement for fifty (50) Tasers and support equipment (Holsters, cartridges, batteries, etc.) for the Sheriff's Office. This
project includes an extended warranty for the equipment.
Electronic Control Weapons (Tasers) are an integral part of our force continuum model. Tasers are a 'less than lethal' use of force option that may assist our deputies
when dealing with combative, violent or aggressive people. The use of Tasers help reduce risk of injury to deputies, offenders, and members of the public. Taser
technology can immobilize a suspect who can overcome pain, might be on dangerous drugs like cocaine or methamphetamine or even emotionally disturbed,
whereas other non‐lethal tools rely upon pain compliance. The Taser system doesn't use pain compliance but immediately stops any coordinated action by the
subject only while the Taser system's current is flowing.
Purchasing cartridges, batteries, training supplies, repairs, and
replacement.
Capital Detail by Department FY22 Budget D-138

Sheriff Department Priority
Replace Courthouse Security Equipment 6 of 7CS, Equipment Project Timeline: FY05 to Ongoing
Project Description
Project Justification
Impact on Annual Operating Expenses FY22 FY23 FY24 FY25 FY26 FY27‐31 Annual
‐ ‐ ‐ ‐ ‐ 102,500 10,250
Financial Plan Project ID: c0500
FY20 FY21 FY22 FY23 FY24 FY25 FY26 FY27‐31 Total
End Bal. Budget Approved Proposed Proposed Proposed Proposed Proposed Proposed
SOURCES
General Capital Fund ‐ ‐ ‐ ‐ ‐ ‐ 75,000 75,000
TOTAL SOURCES ‐ ‐ ‐ ‐ ‐ ‐ ‐ 75,000 75,000
USES
Capital ‐ Machinery & Equip ‐ ‐ ‐ ‐ ‐ ‐ ‐ 75,000 75,000
TOTAL USES ‐ ‐ ‐ ‐ ‐ ‐ ‐ 75,000 75,000
This project involves the purchase of two security screening x‐ray machines (PX6.4 X‐Ray Systems at $30,000 each) and two walk through metal detectors (PD6500i
WTMD's at $4,000 each) in FY27‐31 to replace existing equipment. The current equipment has a ten year life cycle. Total cost is estimated at $75,000 for the initial
purchase. After the first year of purchase, there will also be operating expenses for a maintenance plan at an annual cost of $13,000 for both sets of machines.
The security screening machines and the walk through metal detectors are essential to providing the necessary security for the Clarke County Courthouse. The
screening machines are able to scan packages and other belongings that are brought into the courthouse. It also displays images of property for the purpose of
detecting weapons and/or explosive devices. The advanced features of the security screening machine include operator assistance, image archiving, and threat
image protection. The walk through metal detectors have the capability to detect metal objects in eight different zones within its frame. It will also provide visual
display that pinpoints the area of alarm.
Service contract and replacement.
Capital Detail by Department
FY22 Budget D-139

Sheriff Department Priority
Replace Prisoner Transport Bus 7 of 7CS, Transportation Project Timeline: FY00 to Ongoing
Project Description
Project Justification
Impact on Annual Operating Expenses FY22 FY23 FY24 FY25 FY26 FY27‐31 Annual
‐ ‐ ‐ ‐ ‐ ‐ ‐
Financial Plan Project ID: N/A
FY20 FY21 FY22 FY23 FY24 FY25 FY26 FY27‐31 Total
End Bal. Budget Approved Proposed Proposed Proposed Proposed Proposed Proposed
SOURCES
General Capital Fund ‐ ‐ ‐ ‐ ‐ ‐ ‐ 250,000 250,000
TOTAL SOURCES ‐ ‐ ‐ ‐ ‐ ‐ ‐ 250,000 250,000
USES
Capital ‐ Vehicles ‐ ‐ ‐ ‐ ‐ ‐ ‐ 250,000 250,000
TOTAL USES ‐ ‐ ‐ ‐ ‐ ‐ ‐ 250,000 250,000
The existing prisoner transport bus (44 passenger) was purchased and delivered in February 2000. It was purchased through the Sheriff's Inmate Special Revenue
Fund. It is currently not in the vehicle replacement program.
The existing prisoner transport bus is used to transport inmates between the jail and the courthouse for court appearances. It is vital and necessary to the Sheriff's
Office to have this means of transportation because it reduces the number of trips back and forth from the jail to the courthouse because of its passenger capacity.
No Impact.
Capital Detail by Department FY22 Budget D-140
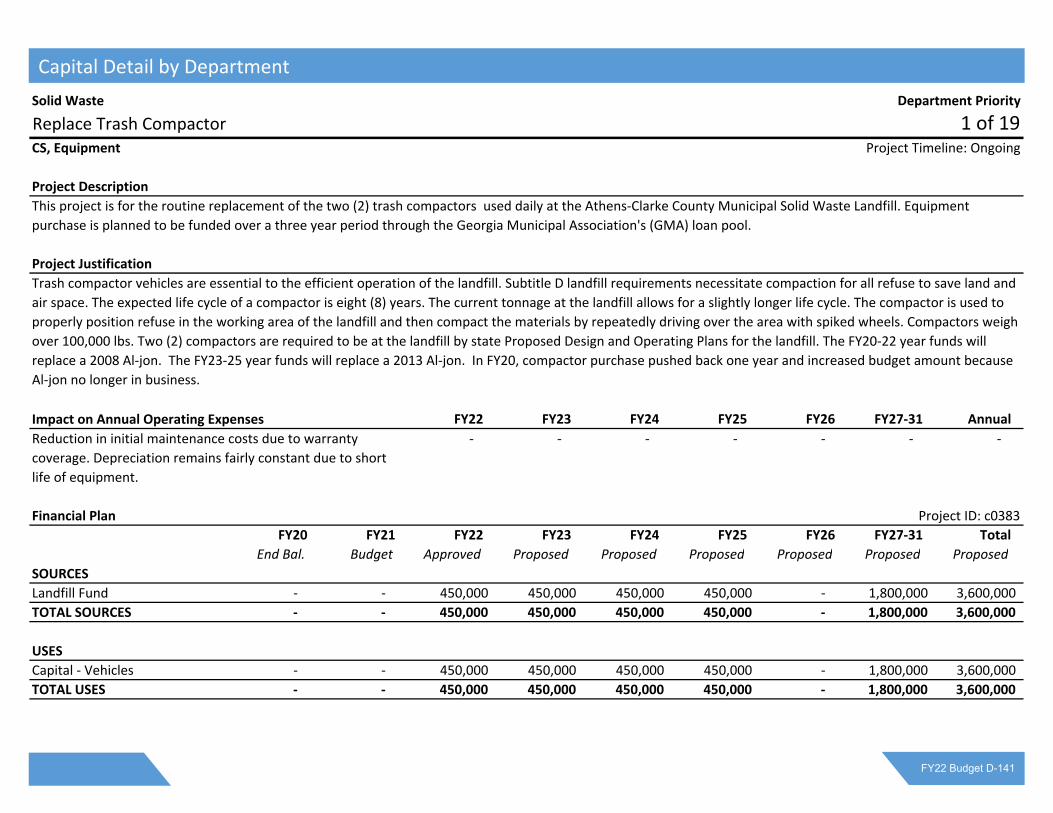
Solid Waste Department Priority
Replace Trash Compactor 1 of 19CS, Equipment Project Timeline: Ongoing
Project Description
Project Justification
Impact on Annual Operating Expenses FY22 FY23 FY24 FY25 FY26 FY27‐31 Annual
‐ ‐ ‐ ‐ ‐ ‐ ‐
Financial Plan Project ID: c0383
FY20 FY21 FY22 FY23 FY24 FY25 FY26 FY27‐31 Total
End Bal. Budget Approved Proposed Proposed Proposed Proposed Proposed Proposed
SOURCES
Landfill Fund ‐ ‐ 450,000 450,000 450,000 450,000 ‐ 1,800,000 3,600,000
TOTAL SOURCES ‐ ‐ 450,000 450,000 450,000 450,000 ‐ 1,800,000 3,600,000
USES
Capital ‐ Vehicles ‐ ‐ 450,000 450,000 450,000 450,000 ‐ 1,800,000 3,600,000
TOTAL USES ‐ ‐ 450,000 450,000 450,000 450,000 ‐ 1,800,000 3,600,000
This project is for the routine replacement of the two (2) trash compactors used daily at the Athens‐Clarke County Municipal Solid Waste Landfill. Equipment
purchase is planned to be funded over a three year period through the Georgia Municipal Association's (GMA) loan pool.
Trash compactor vehicles are essential to the efficient operation of the landfill. Subtitle D landfill requirements necessitate compaction for all refuse to save land and
air space. The expected life cycle of a compactor is eight (8) years. The current tonnage at the landfill allows for a slightly longer life cycle. The compactor is used to
properly position refuse in the working area of the landfill and then compact the materials by repeatedly driving over the area with spiked wheels. Compactors weigh
over 100,000 lbs. Two (2) compactors are required to be at the landfill by state Proposed Design and Operating Plans for the landfill. The FY20‐22 year funds will
replace a 2008 Al‐jon. The FY23‐25 year funds will replace a 2013 Al‐jon. In FY20, compactor purchase pushed back one year and increased budget amount because
Al‐jon no longer in business.
Reduction in initial maintenance costs due to warranty
coverage. Depreciation remains fairly constant due to short
life of equipment.
Capital Detail by Department
FY22 Budget D-141

Solid Waste Department Priority
Belt Replacements for RMPF 2 of 19CS, Equipment Project Timeline: Ongoing
Project Description
Project Justification
Impact on Annual Operating Expenses FY22 FY23 FY24 FY25 FY26 FY27‐31 Annual
‐ ‐ ‐ ‐ ‐ ‐ ‐
Financial Plan Project ID: c0797
FY20 FY21 FY22 FY23 FY24 FY25 FY26 FY27‐31 Total
End Bal. Budget Approved Proposed Proposed Proposed Proposed Proposed Proposed
SOURCES
Landfill Fund 6,946 67,000 67,000 ‐ ‐ ‐ ‐ ‐ 67,000
TOTAL SOURCES 6,946 67,000 67,000 ‐ ‐ ‐ ‐ ‐ 67,000
USES
Capital ‐ Infrastructure 6,946 67,000 67,000 ‐ ‐ ‐ ‐ ‐ 67,000
TOTAL USES 6,946 67,000 67,000 ‐ ‐ ‐ ‐ ‐ 67,000
This request is for the ongoing purchase and replacement of belts in the RMPF. Current belts needing replacement are as follows: Baler Infeed (Alley belt) and
Suspended Cross Belt Magnet. The RMPF has the following belts: single stream incline infeed, presort, OCC quality control, CP screen feed, 2D fiber transfer (2),
fiber sort, ADS feed, flexible fiber transfer, container transfer, glass transfer (2), trash/residue transfer (after Eddy Current), trash transfer, rigid plastic transfer,
container incline infeed, and container sort. Belt lifecycle approximately 10 years.
Belts carry recyclable material throughout the RMPF system. There are over 25 belts in the RMPF that move material so the whole system can function properly and
move approximately 120 tpd.
No Impact.
Capital Detail by Department FY22 Budget D-142
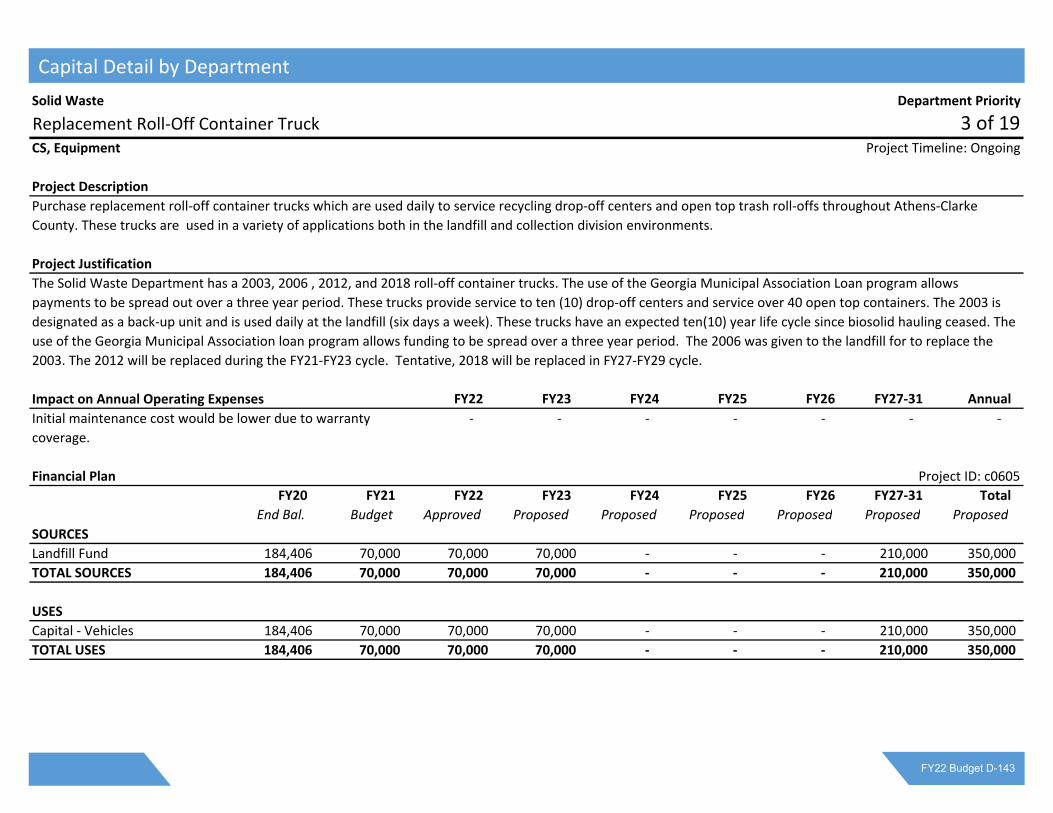
Solid Waste Department Priority
Replacement Roll‐Off Container Truck 3 of 19CS, Equipment Project Timeline: Ongoing
Project Description
Project Justification
Impact on Annual Operating Expenses FY22 FY23 FY24 FY25 FY26 FY27‐31 Annual
‐ ‐ ‐ ‐ ‐ ‐ ‐
Financial Plan Project ID: c0605
FY20 FY21 FY22 FY23 FY24 FY25 FY26 FY27‐31 Total
End Bal. Budget Approved Proposed Proposed Proposed Proposed Proposed Proposed
SOURCES
Landfill Fund 184,406 70,000 70,000 70,000 ‐ ‐ ‐ 210,000 350,000
TOTAL SOURCES 184,406 70,000 70,000 70,000 ‐ ‐ ‐ 210,000 350,000
USES
Capital ‐ Vehicles 184,406 70,000 70,000 70,000 ‐ ‐ ‐ 210,000 350,000
TOTAL USES 184,406 70,000 70,000 70,000 ‐ ‐ ‐ 210,000 350,000
Purchase replacement roll‐off container trucks which are used daily to service recycling drop‐off centers and open top trash roll‐offs throughout Athens‐Clarke
County. These trucks are used in a variety of applications both in the landfill and collection division environments.
The Solid Waste Department has a 2003, 2006 , 2012, and 2018 roll‐off container trucks. The use of the Georgia Municipal Association Loan program allows
payments to be spread out over a three year period. These trucks provide service to ten (10) drop‐off centers and service over 40 open top containers. The 2003 is
designated as a back‐up unit and is used daily at the landfill (six days a week). These trucks have an expected ten(10) year life cycle since biosolid hauling ceased. The
use of the Georgia Municipal Association loan program allows funding to be spread over a three year period. The 2006 was given to the landfill for to replace the
2003. The 2012 will be replaced during the FY21‐FY23 cycle. Tentative, 2018 will be replaced in FY27‐FY29 cycle.
Initial maintenance cost would be lower due to warranty
coverage.
Capital Detail by Department
FY22 Budget D-143

Solid Waste Department Priority
Replace Track Excavator 4 of 19CS, Equipment Project Timeline: Ongoing
Project Description
Project Justification
Impact on Annual Operating Expenses FY22 FY23 FY24 FY25 FY26 FY27‐31 Annual
‐ ‐ ‐ ‐ ‐ ‐ ‐
Financial Plan Project ID: c0807
FY20 FY21 FY22 FY23 FY24 FY25 FY26 FY27‐31 Total
End Bal. Budget Approved Proposed Proposed Proposed Proposed Proposed Proposed
SOURCES
Landfill Fund ‐ 90,000 90,000 90,000 ‐ ‐ ‐ ‐ 180,000
TOTAL SOURCES ‐ 90,000 90,000 90,000 ‐ ‐ ‐ ‐ 270,000
USES
Capital ‐ Machinery & Equip ‐ 90,000 90,000 90,000 ‐ ‐ ‐ ‐ 180,000
TOTAL USES ‐ 90,000 90,000 90,000 ‐ ‐ ‐ ‐ 270,000
Replace the existing Track Excavator at the landfill.
The excavator is used daily to load dirt, rock, mulch and for maintenance and construction of drainage/detention areas. The current excavator is a 2001 and has an
estimated useful life of 12 years. The 2001 track excavator was replaced in FY21.
Initial maintenance cost would be lower due to warranty
coverage.
Capital Detail by Department FY22 Budget D-144

Solid Waste Department Priority
Replace Bulldozer 5 of 19CS, Equipment Project Timeline: Ongoing
Project Description
Project Justification
Impact on Annual Operating Expenses FY22 FY23 FY24 FY25 FY26 FY27‐31 Annual
‐ ‐ ‐ ‐ ‐ ‐ ‐
Financial Plan Project ID: c0728
FY20 FY21 FY22 FY23 FY24 FY25 FY26 FY27‐31 Total
End Bal. Budget Approved Proposed Proposed Proposed Proposed Proposed Proposed
SOURCES
Landfill Fund ‐ 140,000 140,000 140,000 140,000 140,000 140,000 280,000 980,000
TOTAL SOURCES ‐ 140,000 140,000 140,000 140,000 140,000 140,000 280,000 980,000
USES
Capital ‐ Machinery & Equip ‐ 140,000 140,000 140,000 140,000 140,000 140,000 280,000 980,000
TOTAL USES ‐ 140,000 140,000 140,000 140,000 140,000 140,000 280,000 980,000
This project is for the routine replacement of the two (2) bulldozers used daily at the Athens‐Clarke County Municipal Solid Waste landfill.
The two (2) D8 bulldozers are the most heavily used pieces of equipment at the landfill. They are used daily for earth‐moving, pushing trash to the working face,
covering trash with dirt and rock removal. The current bulldozers are a 2011 and a 2014 Caterpillars . Historically, their useful life has been seven years althought five
years is a better estimate. The replacements can be done using the Georgia Municipal Association loan program spreading the purchase over a three year time
frame. On June 7, 2016, the Mayor & Commission approved moving funding for one of the two new bulldozers to FY17 ‐ FY19. The new bulldozer was purchased in
July 2016 (FY17) and replaced the 2011 due to a catastrophic failure. The 2014 will be replaced FY20 and the 2016 will be replaced in FY23‐FY25. Pricing was
increased in FY21 due to market.
The two bulldozers are the most heavily used pieces of
equipment at the landfill. Their useful life is short due to the
harsh operating environment. Initial maintenance costs are
reduced due to warranty coverages. Depreciation is not
Capital Detail by Department
FY22 Budget D-145

Solid Waste Department Priority
Replace Loaders (Compost Operations) 6 of 19CS, Equipment Project Timeline: FY22 to FY24
Project Description
Project Justification
Impact on Annual Operating Expenses FY22 FY23 FY24 FY25 FY26 FY27‐31 Annual
‐ ‐ ‐ ‐ ‐ ‐ ‐
New
Financial Plan Project ID: c0822
FY20 FY21 FY22 FY23 FY24 FY25 FY26 FY27‐31 Total
End. Bal. Budget Approved Proposed Proposed Proposed Proposed Proposed Proposed
SOURCES
Landfill Fund ‐ ‐ 75,000 75,000 75,000 ‐ ‐ ‐ 225,000
TOTAL SOURCES ‐ ‐ 75,000 75,000 75,000 ‐ ‐ ‐ 225,000
USES
Capital ‐ Machinery & Equip ‐ ‐ 75,000 75,000 75,000 ‐ ‐ ‐ 225,000
TOTAL USES ‐ ‐ 75,000 75,000 75,000 ‐ ‐ ‐ 225,000
Replace current 2009 loader that was purchased in 2009.
This loader is used to load, bulk compost sales and move/mix material in composting operations.
Initial maintenance cost would be lower due to warranty
coverage.
Capital Detail by Department FY22 Budget D-146

Solid Waste Department Priority
Replace Glass Crusher in RMPF 7 of 19CS, Equipment Project Timeline: FY21 to Ongoing
Project Description
Project Justification
Impact on Annual Operating Expenses FY22 FY23 FY24 FY25 FY26 FY27‐31 Annual
‐ ‐ ‐ ‐ ‐ ‐ ‐
Financial Plan Project ID: c0809
FY20 FY21 FY22 FY23 FY24 FY25 FY26 FY27‐31 Total
End. Bal. Budget Approved Proposed Proposed Proposed Proposed Proposed Proposed
SOURCES
Landfill Fund ‐ 100,000 120,000 ‐ ‐ ‐ ‐ ‐ 120,000
TOTAL SOURCES ‐ 100,000 120,000 ‐ ‐ ‐ ‐ ‐ 120,000
USES
Capital ‐ Machinery & Equip ‐ 100,000 120,000 ‐ ‐ ‐ ‐ ‐ 120,000
TOTAL USES ‐ 100,000 120,000 ‐ ‐ ‐ ‐ ‐ 120,000
Replace the glass crusher in the RMPF.
This is a request to maintain the RMPF. The glass crusher removes glass off the line first and crushes the glass then directs the glass through a series of conveyor
belts out outside for storage prior to pick‐up for shipping to another processor.
Minimal.
Capital Detail by Department
FY22 Budget D-147

Solid Waste Department Priority
Purchase Replacement Road Tractor 8 of 19CS, Equipment Project Timeline: FY22 to FY24
Project Description
Project Justification
Impact on Annual Operating Expenses FY22 FY23 FY24 FY25 FY26 FY27‐31 Annual
‐ ‐ ‐ ‐ ‐ ‐ ‐
New
Financial Plan Project ID: c0823
FY20 FY21 FY22 FY23 FY24 FY25 FY26 FY27‐31 Total
End. Bal. Budget Approved Proposed Proposed Proposed Proposed Proposed Proposed
SOURCES
Landfill Fund ‐ ‐ 67,000 67,000 67,000 ‐ ‐ ‐ 201,000
TOTAL SOURCES ‐ ‐ 67,000 67,000 67,000 ‐ ‐ ‐ 201,000
USES
Capital ‐ Vehicles ‐ ‐ 67,000 67,000 67,000 ‐ ‐ ‐ 201,000
TOTAL USES ‐ ‐ 67,000 67,000 67,000 ‐ ‐ ‐ 201,000
Replacement of road tractor used at the landfill to haul semi‐trailers with trash, recycling, fuel and/or leachate. This purchase would replace the 2010 road tractor.
This purchase would take place in FY25.
Road tractors are used daily at the landfill to transport various materials. Semi‐trailers are used to collect materials that are later delivered to the landfill working
face; recyclable materials to the RMPF; leachate to recirculate; and fuel tank moving, as needed. Out year funding would be used to replace the 2010 Freightliner
M2‐112 road tractor through the GMA Load Pool Program.
Initial maintenance cost would be lower due to warranty
coverage.
Capital Detail by Department FY22 Budget D-148

Solid Waste Department Priority
Replace Track Loader 9 of 19CS, Equipment Project Timeline: Ongoing
Project Description
Project Justification
Impact on Annual Operating Expenses FY22 FY23 FY24 FY25 FY26 FY27‐31 Annual
‐ ‐ ‐ ‐ ‐ ‐ ‐
Financial Plan Project ID: c0492
FY20 FY21 FY22 FY23 FY24 FY25 FY26 FY27‐31 Total
End Bal. Budget Approved Proposed Proposed Proposed Proposed Proposed Proposed
SOURCES
Landfill Fund ‐ ‐ 167,000 167,000 167,000 ‐ ‐ ‐ 501,000
TOTAL SOURCES ‐ ‐ 167,000 167,000 167,000 ‐ ‐ ‐ 501,000
USES
Capital ‐ Machinery & Equip ‐ ‐ 167,000 167,000 167,000 ‐ ‐ ‐ 501,000
TOTAL USES ‐ ‐ 167,000 167,000 167,000 ‐ ‐ ‐ 501,000
Replace 2006 crawler/loader used to load materials (dirt, mulch, rock, etc.) at the landfill.
This vehicle is used to maintain and support daily "cover" operations at the landfill. The crawler/loader is used six (6) days per week and is essential to landfill
operations. This equipment is on a ten (10) year life cycle, but is currently in good condition and is not expected to need replacement until in FY21 or later. The
current machine was purchased in FY06. Use of the Georgia Municipal Association loan program allows funding to be spread over a three year period. Funds are set
aside annually for the replacement of equipment at the landfill.
Initial maintenance cost would be lower due to warranty
coverage.
Capital Detail by Department
FY22 Budget D-149

Solid Waste Department Priority
Replace OCC Decks 10 of 19CS, Equipment Project Timeline: FY21 to Ongoing
Project Description
Project Justification
Impact on Annual Operating Expenses FY22 FY23 FY24 FY25 FY26 FY27‐31 Annual
‐ ‐ ‐ ‐ ‐ ‐ ‐
Financial Plan Project ID: c0824
FY20 FY21 FY22 FY23 FY24 FY25 FY26 FY27‐31 Total
End. Bal. Budget Approved Proposed Proposed Proposed Proposed Proposed Proposed
SOURCES
Landfill Fund ‐ ‐ 60,000 60,000 ‐ ‐ ‐ ‐ 120,000
TOTAL SOURCES ‐ ‐ 60,000 60,000 ‐ ‐ ‐ ‐ 120,000
USES
Capital ‐ Machinery & Equip ‐ ‐ 60,000 60,000 ‐ ‐ ‐ ‐ 60,000
TOTAL USES ‐ ‐ 60,000 60,000 ‐ ‐ ‐ ‐ 120,000
Replace the Old Corrugated Container (OCC) decks at the Recovered Material Processing Facility (RMPF).
This is a request to maintain the RMPF. The OCC decks separate OCC from the rest of the recycling stream. If this is not replaced, OCC will not be properly separated
and this deck, if not operating properly, can shut down the entire single stream system.
Minimal due to private contractor operating the facility.
Capital Detail by Department FY22 Budget D-150

Solid Waste Department Priority
Replace Two Kubota Tractors 11 of 19CS, Equipment Project Timeline: FY24 to Ongoing
Project Description
Project Justification
Impact on Annual Operating Expenses FY22 FY23 FY24 FY25 FY26 FY27‐31 Annual
‐ ‐ ‐ ‐ ‐ ‐ ‐
New
Financial Plan Project ID: c0825
FY20 FY21 FY22 FY23 FY24 FY25 FY26 FY27‐31 Total
End. Bal. Budget Approved Proposed Proposed Proposed Proposed Proposed Proposed
SOURCES
Landfill Fund ‐ ‐ 34,000 68,000 68,000 34,000 ‐ ‐ 204,000
TOTAL SOURCES ‐ ‐ 34,000 68,000 68,000 34,000 ‐ ‐ 204,000
USES
Capital ‐ Machinery & Equip ‐ ‐ 34,000 68,000 68,000 34,000 ‐ ‐ 204,000
TOTAL USES ‐ ‐ 34,000 68,000 68,000 34,000 ‐ ‐ 204,000
Replace current 2010 and 2011 Kubota composting tractors.
These tractors are needed to mix feedstocks (carbon and nitrogen) and make the aerated compost piles.
Initial maintenance cost would be lower due to warranty
coverage.
Capital Detail by Department
FY22 Budget D-151
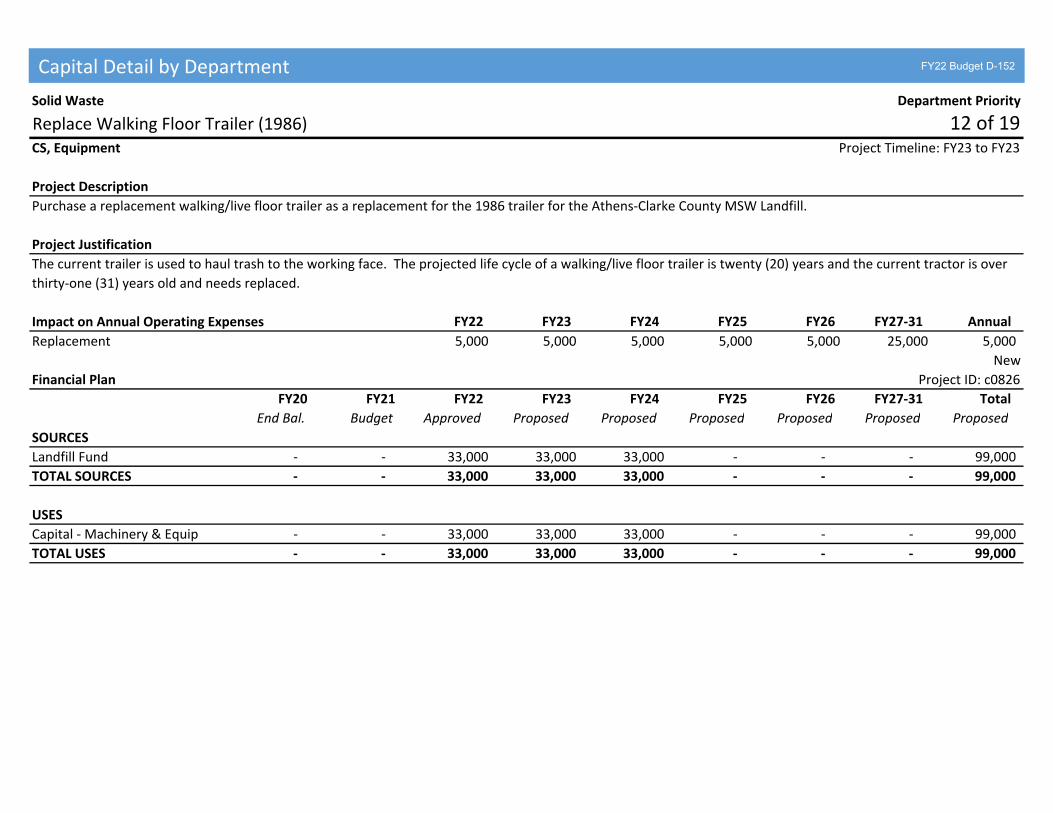
Solid Waste Department Priority
Replace Walking Floor Trailer (1986) 12 of 19CS, Equipment Project Timeline: FY23 to FY23
Project Description
Project Justification
Impact on Annual Operating Expenses FY22 FY23 FY24 FY25 FY26 FY27‐31 Annual
5,000 5,000 5,000 5,000 5,000 25,000 5,000
New
Financial Plan Project ID: c0826
FY20 FY21 FY22 FY23 FY24 FY25 FY26 FY27‐31 Total
End Bal. Budget Approved Proposed Proposed Proposed Proposed Proposed Proposed
SOURCES
Landfill Fund ‐ ‐ 33,000 33,000 33,000 ‐ ‐ ‐ 99,000
TOTAL SOURCES ‐ ‐ 33,000 33,000 33,000 ‐ ‐ ‐ 99,000
USES
Capital ‐ Machinery & Equip ‐ ‐ 33,000 33,000 33,000 ‐ ‐ ‐ 99,000
TOTAL USES ‐ ‐ 33,000 33,000 33,000 ‐ ‐ ‐ 99,000
Purchase a replacement walking/live floor trailer as a replacement for the 1986 trailer for the Athens‐Clarke County MSW Landfill.
The current trailer is used to haul trash to the working face. The projected life cycle of a walking/live floor trailer is twenty (20) years and the current tractor is over
thirty‐one (31) years old and needs replaced.
Replacement
Capital Detail by Department FY22 Budget D-152

Solid Waste Department Priority
Replace RMPF Tip Floors 13 of 19CS, Equipment Project Timeline: FY21 to Ongoing
Project Description
Project Justification
Impact on Annual Operating Expenses FY22 FY23 FY24 FY25 FY26 FY27‐31 Annual
‐ ‐ ‐ ‐ ‐ ‐ ‐
New
Financial Plan Project ID: c0827
FY20 FY21 FY22 FY23 FY24 FY25 FY26 FY27‐31 Total
End. Bal. Budget Approved Proposed Proposed Proposed Proposed Proposed Proposed
SOURCES
Landfill Fund ‐ ‐ 65,000 65,000 ‐ ‐ ‐ ‐ 130,000
TOTAL SOURCES ‐ ‐ 65,000 65,000 ‐ ‐ ‐ ‐ 130,000
USES
Capital ‐ Machinery & Equip ‐ ‐ 65,000 65,000 ‐ ‐ ‐ ‐ 60,000
TOTAL USES ‐ ‐ 65,000 65,000 ‐ ‐ ‐ ‐ 130,000
Replace the Recovered Material Processing Facility(RMPF) tip floors.
This is a request to maintain the RMPF. The tip floors are concrete floors that hold material prior to processing. If not replaced appropriately, the damage can affect
the infrastructure of the RMPF.
Minimal due to private contractor operating the facility.
Capital Detail by Department
FY22 Budget D-153

Solid Waste Department Priority
Landfill Well Construction 14 of 19CS, Infrastructure Project Timeline: FY22 to Ongoing
Project Description
Project Justification
Impact on Annual Operating Expenses FY22 FY23 FY24 FY25 FY26 FY27‐31 Annual
1,000 1,000 2,000 2,000 2,000 2,000 1,000
New
Financial Plan Project ID: c0828
FY20 FY21 FY22 FY23 FY24 FY25 FY26 FY27‐31 Total
End Bal. Budget Approved Proposed Proposed Proposed Proposed Proposed Proposed
SOURCES
Landfill Fund ‐ ‐ 100,000 100,000 100,000 100,000 ‐ ‐ 400,000
TOTAL SOURCES ‐ ‐ 100,000 100,000 100,000 100,000 ‐ ‐ 400,000
USES
Capital ‐ Infrastructure ‐ ‐ 100,000 100,000 100,000 100,000 ‐ ‐ 400,000
TOTAL USES ‐ ‐ 100,000 100,000 100,000 100,000 ‐ ‐ 400,000
Creation or replacement of methane and/or groundwater wells at the landfill.
The Environmental Protection Division is requiring additional wells and/or replacement of older wells. This is a compliance issue.
Minimal testing/maintenance expense
Capital Detail by Department FY22 Budget D-154

Solid Waste Department Priority
Replace Dump Truck (25 yard articulating) 15 of 19CS, Equipment Project Timeline: Ongoing
Project Description
Project Justification
Impact on Annual Operating Expenses FY22 FY23 FY24 FY25 FY26 FY27‐31 Annual
‐ ‐ ‐ ‐ ‐ ‐ ‐
Financial Plan Project ID: c0601
FY20 FY21 FY22 FY23 FY24 FY25 FY26 FY27‐31 Total
End Bal. Budget Approved Proposed Proposed Proposed Proposed Proposed Proposed
SOURCES
Landfill Fund (1,815) 134,000 ‐ ‐ ‐ ‐ 134,000 400,000 534,000
TOTAL SOURCES (1,815) 134,000 ‐ ‐ ‐ ‐ 134,000 400,000 534,000
USES
Capital ‐ Vehicles (1,815) 134,000 ‐ ‐ ‐ ‐ 134,000 400,000 534,000
TOTAL USES (1,815) 134,000 ‐ ‐ ‐ ‐ 134,000 400,000 534,000
This project is for the routine replacement of the two 25 yard Articulating Dump Trucks for use at the ACC Municipal Solid Waste Landfill.
The landfill currently uses two 25 yard articulating dump trucks to haul dirt and other materials. The current vehicles are a 2016 Volvo and 2019 Caterpillar. The
vehicles have a useful operational life of approximately 15 years. Vehicles are typically purchased using the Georgia Municipal Association loan program thereby
spreading the payments our over three years. Funds are set aside annually in the landfill's budget for equipment replacements.
Reduced maintenance cost due to warranty coverage.
Capital Detail by Department
FY22 Budget D-155

Solid Waste Department Priority
Closure of Landfill‐ Phase 1 & 2 Areas 16 of 19CS, Facilities Project Timeline: Ongoing
Project Description
Project Justification
Impact on Annual Operating Expenses FY22 FY23 FY24 FY25 FY26 FY27‐31 Annual
‐ ‐ ‐ ‐ ‐ ‐ ‐
Financial Plan Project ID: c0432
FY20 FY21 FY22 FY23 FY24 FY25 FY26 FY27‐31 Total
End Bal. Budget Approved Proposed Proposed Proposed Proposed Proposed Proposed
SOURCES
Landfill Fund ‐ ‐ ‐ ‐ ‐ ‐ ‐ 2,500,000 2,500,000
TOTAL SOURCES ‐ ‐ ‐ ‐ ‐ ‐ ‐ 2,500,000 2,500,000
USES
Capital ‐ Other ‐ ‐ ‐ ‐ ‐ ‐ ‐ 200,000 200,000
Capital ‐ Site Improvements ‐ ‐ ‐ ‐ ‐ ‐ ‐ 2,300,000 2,300,000
TOTAL USES ‐ ‐ ‐ ‐ ‐ ‐ ‐ 2,500,000 2,500,000
The existing Athens‐Clarke County Sanitary Landfill located at 5700 Lexington Road consist of approximately 460 acres on the Clarke/Oglethorpe County line. It has
been owned and operated as a municipal landfill since November 1976. A‐CC is currently operating a Sub‐title D (lined) landfill which is designed to meet all federal
standards, including a closure and post‐closure care plan to be implemented when the landfill has reached capacity. Closure of Phase 1 was funded in FY06 at $3.1
million, but due to operational changes the closure has been delayed. Two years of capacity are remaining in Phase 2.
The landfill has proposed to expand the landfill adjacent to Phase 1 (Phase 5). With this change the closure of Phase 1 may not be required in the next 10 years.
Funds previously set aside for closure of Phase 1 are proposed to be used for Phase 2 closure. The out year funds are requested for the closure of Phase 3 sometime
in FY18. Funds for closure and post closure care are set aside annually in the Landfill Enterprise Fund.
No Impact.
Capital Detail by Department FY22 Budget D-156

Solid Waste Department Priority
Replace Windrow Turner in Compost Operations 17 of 19CS, Equipment Project Timeline: Ongoing
Project Description
Project Justification
Impact on Annual Operating Expenses FY22 FY23 FY24 FY25 FY26 FY27‐31 Annual
‐ ‐ ‐ ‐ ‐ ‐ ‐
Financial Plan Project ID: c0564
FY20 FY21 FY22 FY23 FY24 FY25 FY26 FY27‐31 Total
End Bal. Budget Approved Proposed Proposed Proposed Proposed Proposed Proposed
SOURCES
Landfill Fund ‐ ‐ ‐ ‐ 50,000 50,000 50,000 ‐ 150,000
TOTAL SOURCES ‐ ‐ ‐ ‐ 50,000 50,000 50,000 ‐ 150,000
USES
Capital ‐ Machinery & Equip ‐ ‐ ‐ ‐ 50,000 50,000 50,000 ‐ 150,000
TOTAL USES ‐ ‐ ‐ ‐ 50,000 50,000 50,000 ‐ 150,000
Purchase a replacement windrow turner for the bio‐solid/yard and food scrap composting program.
A windrow turner is a critical piece of equipment for the composting program. The turner self propelled and mixes the windrows of compost approximately once
every three days. Proper turning of the windrows is critical and mandated (when composting bio‐solids) to accelerate the composting process and reduce odors. The
equipment has a 12 year life and funds are set aside in the landfill enterprise fund annually for replacement. This purchase will assist the Department in reaching the
Mayor and Commission waste diversion goals with the final goal of 75% waste diverted by 2020. The only way to reach this goal is through an expanded composting
program. Pushed purchase from FY20‐FY21 due to ASP conversion.
Initial maintenance cost would be lower due to warranty
coverage.
Capital Detail by Department
FY22 Budget D-157
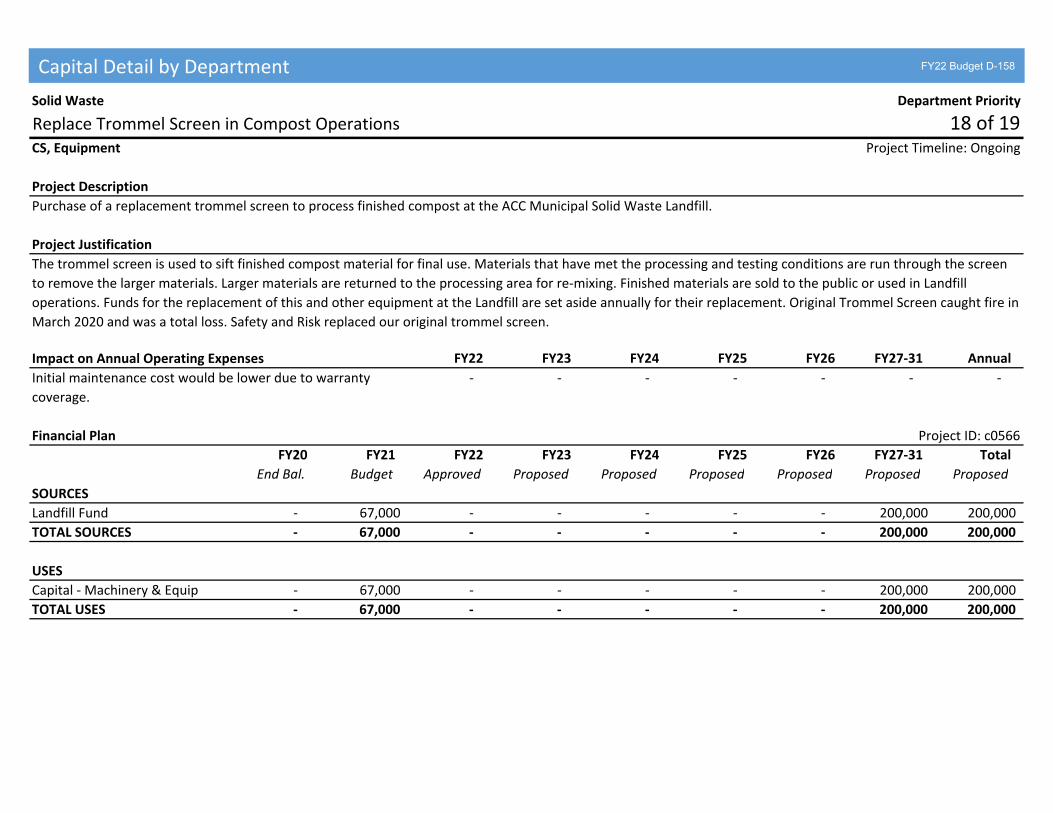
Solid Waste Department Priority
Replace Trommel Screen in Compost Operations 18 of 19CS, Equipment Project Timeline: Ongoing
Project Description
Project Justification
Impact on Annual Operating Expenses FY22 FY23 FY24 FY25 FY26 FY27‐31 Annual
‐ ‐ ‐ ‐ ‐ ‐ ‐
Financial Plan Project ID: c0566
FY20 FY21 FY22 FY23 FY24 FY25 FY26 FY27‐31 Total
End Bal. Budget Approved Proposed Proposed Proposed Proposed Proposed Proposed
SOURCES
Landfill Fund ‐ 67,000 ‐ ‐ ‐ ‐ ‐ 200,000 200,000
TOTAL SOURCES ‐ 67,000 ‐ ‐ ‐ ‐ ‐ 200,000 200,000
USES
Capital ‐ Machinery & Equip ‐ 67,000 ‐ ‐ ‐ ‐ ‐ 200,000 200,000
TOTAL USES ‐ 67,000 ‐ ‐ ‐ ‐ ‐ 200,000 200,000
Purchase of a replacement trommel screen to process finished compost at the ACC Municipal Solid Waste Landfill.
The trommel screen is used to sift finished compost material for final use. Materials that have met the processing and testing conditions are run through the screen
to remove the larger materials. Larger materials are returned to the processing area for re‐mixing. Finished materials are sold to the public or used in Landfill
operations. Funds for the replacement of this and other equipment at the Landfill are set aside annually for their replacement. Original Trommel Screen caught fire in
March 2020 and was a total loss. Safety and Risk replaced our original trommel screen.
Initial maintenance cost would be lower due to warranty
coverage.
Capital Detail by Department FY22 Budget D-158

Solid Waste Department Priority
Purchase Skid Steer (Compost Loading) 19 of 19CS, Equipment Project Timeline: FY21 to Ongoing
Project Description
Project Justification
Impact on Annual Operating Expenses FY22 FY23 FY24 FY25 FY26 FY27‐31 Annual
‐ ‐ ‐ ‐ ‐ ‐ ‐
Financial Plan Project ID: c0808
FY20 FY21 FY22 FY23 FY24 FY25 FY26 FY27‐31 Total
End. Bal. Budget Approved Proposed Proposed Proposed Proposed Proposed Proposed
SOURCES
Landfill Fund ‐ 60,000 ‐ ‐ ‐ ‐ ‐ 60,000 60,000
TOTAL SOURCES ‐ 60,000 ‐ ‐ ‐ ‐ ‐ 60,000 60,000
USES
Capital ‐ Machinery & Equip ‐ 60,000 ‐ ‐ ‐ ‐ ‐ 60,000 60,000
TOTAL USES ‐ 60,000 ‐ ‐ ‐ ‐ ‐ 60,000 60,000
Purchase skid steer (small loader) for loading compost into customer vehicles.
Small loader is needed to load purchased compost in to customer vehicles. Without a loader landfill staff would not be able to load finished compost into smaller
vehicles (trucks) around the MRF (red building). New Caterpillar skid steer purchased in FY21.
Initial maintenance cost would be lower due to warranty
coverage.
Capital Detail by Department
FY22 Budget D-159

Solid Waste Department Priority
Replace Commercial Dumpster Collection Front‐end Loader 1 of 3CS, Equipment Project Timeline: Ongoing
Project Description
Project Justification
Impact on Annual Operating Expenses FY22 FY23 FY24 FY25 FY26 FY27‐31 Annual
‐ ‐ ‐ ‐ ‐ ‐ ‐
Financial Plan Project ID: c0587
FY20 FY21 FY22 FY23 FY24 FY25 FY26 FY27‐31 Total
End Bal. Budget Approved Proposed Proposed Proposed Proposed Proposed Proposed
SOURCES
Solid Waste Fund (5,298) 90,000 90,000 90,000 92,000 92,000 92,000 276,000 732,000
TOTAL SOURCES (5,298) 90,000 90,000 90,000 92,000 92,000 92,000 276,000 732,000
USES
Capital ‐ Vehicles (5,298) 90,000 90,000 90,000 92,000 92,000 92,000 276,000 732,000
TOTAL USES (5,298) 90,000 90,000 90,000 92,000 92,000 92,000 276,000 732,000
Purchase replacement 40‐cubic yard front‐end load truck for commercial dumpster collection. These vehicles provide for commercial waste and recycling throughout
the community.
Systematic replacement of vehicles is necessary to keep the fleet in adequate operating condition and to provide efficient commercial dumpster collection (refuse
and recycling) to our customers. The expected useful life of front‐end load trucks is seven (7) years. Funds for the replacement of these vehicles is put in the Solid
Waste Enterprise fund annually. The use of the Georgia Municipal Association loan program allows funding to be spread over a three year period. Out year funding
will replace 2010 and 2012 vehicles. In FY20 altered price due to rising costs to purchase a FEL truck.
Initial maintenance cost would be lower due to warranty
coverage.
Capital Detail by Department FY22 Budget D-160
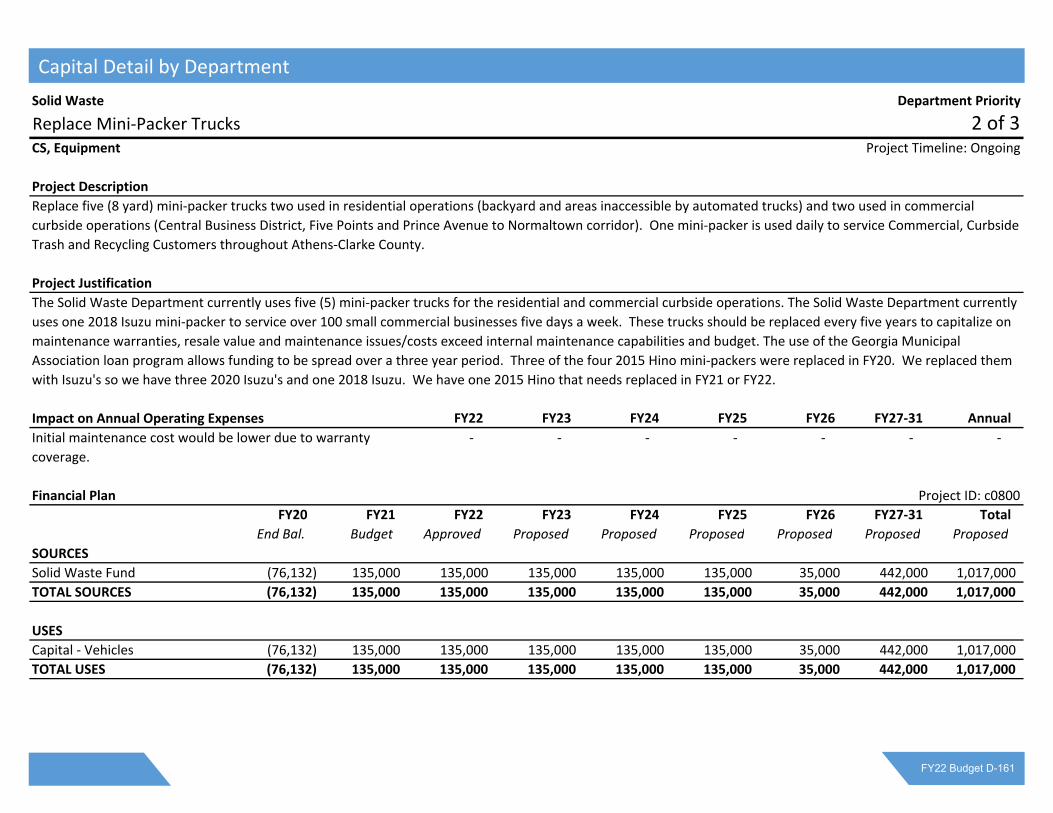
Solid Waste Department Priority
Replace Mini‐Packer Trucks 2 of 3CS, Equipment Project Timeline: Ongoing
Project Description
Project Justification
Impact on Annual Operating Expenses FY22 FY23 FY24 FY25 FY26 FY27‐31 Annual
‐ ‐ ‐ ‐ ‐ ‐ ‐
Financial Plan Project ID: c0800
FY20 FY21 FY22 FY23 FY24 FY25 FY26 FY27‐31 Total
End Bal. Budget Approved Proposed Proposed Proposed Proposed Proposed Proposed
SOURCES
Solid Waste Fund (76,132) 135,000 135,000 135,000 135,000 135,000 35,000 442,000 1,017,000
TOTAL SOURCES (76,132) 135,000 135,000 135,000 135,000 135,000 35,000 442,000 1,017,000
USES
Capital ‐ Vehicles (76,132) 135,000 135,000 135,000 135,000 135,000 35,000 442,000 1,017,000
TOTAL USES (76,132) 135,000 135,000 135,000 135,000 135,000 35,000 442,000 1,017,000
Replace five (8 yard) mini‐packer trucks two used in residential operations (backyard and areas inaccessible by automated trucks) and two used in commercial
curbside operations (Central Business District, Five Points and Prince Avenue to Normaltown corridor). One mini‐packer is used daily to service Commercial, Curbside
Trash and Recycling Customers throughout Athens‐Clarke County.
The Solid Waste Department currently uses five (5) mini‐packer trucks for the residential and commercial curbside operations. The Solid Waste Department currently
uses one 2018 Isuzu mini‐packer to service over 100 small commercial businesses five days a week. These trucks should be replaced every five years to capitalize on
maintenance warranties, resale value and maintenance issues/costs exceed internal maintenance capabilities and budget. The use of the Georgia Municipal
Association loan program allows funding to be spread over a three year period. Three of the four 2015 Hino mini‐packers were replaced in FY20. We replaced them
with Isuzu's so we have three 2020 Isuzu's and one 2018 Isuzu. We have one 2015 Hino that needs replaced in FY21 or FY22.
Initial maintenance cost would be lower due to warranty
coverage.
Capital Detail by Department
FY22 Budget D-161

Solid Waste Department Priority
Replace Automated Refuse/Recycling Truck 3 of 3CS, Equipment Project Timeline: Ongoing
Project Description
Project Justification
Impact on Annual Operating Expenses FY22 FY23 FY24 FY25 FY26 FY27‐31 Annual
‐ ‐ ‐ ‐ ‐ ‐ ‐
Financial Plan Project ID: c0679
FY20 FY21 FY22 FY23 FY24 FY25 FY26 FY27‐31 Total
End Bal. Budget Approved Proposed Proposed Proposed Proposed Proposed Proposed
SOURCES
Solid Waste Fund 1,280,000 310,000 310,000 310,000 310,000 310,000 310,000 620,000 2,170,000
TOTAL SOURCES 1,280,000 310,000 310,000 310,000 310,000 310,000 310,000 620,000 2,170,000
USES
Capital ‐ Vehicles 1,280,000 310,000 310,000 310,000 310,000 310,000 310,000 620,000 2,170,000
TOTAL USES 1,280,000 310,000 310,000 310,000 310,000 310,000 310,000 620,000 2,170,000
Replacement of automated residential refuse/recycling fleet. The current fleet consists of six 2015 Mack/Labrie ‐ automated sideloaders and four of these trucks
were scheduled for replacement in FY20.
The original project reduced the Solid Waste Fleet by five vehicles and also reduced personnel by 9 employees by converting the fleet to automated vehicles.
Automated vehicles operate with a single person versus the current three person crews. The up front capital cost to replace the fleet is paid back in approximately
three years with the reduction in personnel and maintenance costs. Four of the original 2015 Mack/Labrie, automated sideloaders will be replaced in FY20. The
other two will be replaced in FY21‐FY22. These trucks are on a five year replacement cycle.
There was a reduction in personnel cost of approximately
$350,000 per year along with reduced maintenance cost.
Capital Detail by Department FY22 Budget D-162

Solid Waste Department Priority
Purchase One Leaf Vacuum 1 of 2CS, Equipment Project Timeline: FY22 to Ongoing
Project Description
Project Justification
Impact on Annual Operating Expenses FY22 FY23 FY24 FY25 FY26 FY27‐31 Annual
1,500 1,500 2,000 2,000 2,500 3,000 1,250
New
Financial Plan Project ID: c0829
FY20 FY21 FY22 FY23 FY24 FY25 FY26 FY27‐31 Total
End Bal. Budget Approved Proposed Proposed Proposed Proposed Proposed Proposed
SOURCES
General Cap Proj Fund ‐ ‐ 75,000 ‐ ‐ ‐ ‐ ‐ 75,000
TOTAL SOURCES ‐ ‐ 75,000 ‐ ‐ ‐ ‐ ‐ 75,000
USES
Capital ‐ Machinery & Equip ‐ ‐ 75,000 ‐ ‐ ‐ ‐ ‐ 75,000
TOTAL USES ‐ ‐ 75,000 ‐ ‐ ‐ ‐ ‐ 75,000
Purchase one leaf vacuum for downtown litter and leaf removal operations. This is a request from the General Fund since the staff that would utilize the equipment
are in the Litter/Dumpster cost center housed in the General Fund.
This request would allow staff to collect leaves and litter faster, safer and quieter. This equipment would minimize the use of leaf blowers that are currently used.
Leaf blowers are loud, unsafe for staff (hearing) and environmentally unfriendly (two stroke engine emissions). Transportation and Public Works is interested in
using them for bike lane leaf removal too.
Fuel expenses
Capital Detail by Department
FY22 Budget D-163

Solid Waste Department Priority
Dunlap & Pittard Environmental Study 2 of 2AI, Other Project Timeline: FY22 to FY22
Project Description
Project Justification
Impact on Annual Operating Expenses FY22 FY23 FY24 FY25 FY26 FY27‐31 Annual
‐ ‐ ‐ ‐ ‐ ‐ ‐
New
Financial Plan Project ID: c0830
FY20 FY21 FY22 FY23 FY24 FY25 FY26 FY27‐31 Total
End Bal. Budget Approved Proposed Proposed Proposed Proposed Proposed Proposed
SOURCES
General Capital Fund ‐ ‐ 50,000 ‐ ‐ ‐ ‐ ‐ 50,000
TOTAL SOURCES ‐ ‐ 50,000 ‐ ‐ ‐ ‐ ‐ 50,000
USES
Capital ‐ Infrastructure ‐ ‐ 50,000 ‐ ‐ ‐ ‐ ‐ ‐
TOTAL USES ‐ ‐ 50,000 ‐ ‐ ‐ ‐ ‐ 50,000
This funding would allow for a Dunlap & Pittard Envrironmental Study.
This project supports the Mayor & Commission goals to have a safe and prepared community.
No Impact.
Capital Detail by Department FY22 Budget D-164

Transit Department Priority
Matching Funds for Transit Capital Improvement Grants 1 of 2CS, Transportation Project Timeline: Ongoing
Project Description
Project Justification
Impact on Annual Operating Expenses
Financial Plan Project ID: c0376
FY20 FY21 FY22 FY23 FY24 FY25 FY26 FY27‐31 Total
End Bal. Budget Approved Proposed Proposed Proposed Proposed Proposed Proposed
SOURCES
General Capital Fund 94,678 ‐ 50,000 80,000 80,000 80,000 80,000 400,000 770,000
TOTAL SOURCES 94,678 ‐ 50,000 80,000 80,000 80,000 80,000 400,000 770,000
USES
Capital ‐ Vehicles/Facilities 94,678 ‐ 50,000 80,000 80,000 80,000 80,000 400,000 770,000
TOTAL USES 94,678 ‐ 50,000 80,000 80,000 80,000 80,000 400,000 770,000
Funding provides the local match funds for various Federal and State Transit Capital Grants not funded by SPLOST or TSPLOST. Typical grant funding is 80% Federal‐20% local match.
Some projects may receive a 10% state match, if State funding is appropriated, reducing local match to 10%. The Projects receiving annual grants and matching dollars are for
replacements and expansions of transit vehicles (buses, demand response vans, and support vehicles) capital maintenance items and equipment, transit facility improvements, bus
shelters, benches and other various transit related capital equipment. This project corresponds to the approved 2018‐2021 Transportation Improvement Plan (TIP) and the Madison
Athens Clarke Oconee Regional Transportation Study (MACORTS) 2022‐23 Second Tier projects listing and 2040 Long Range Plan Transportation Plan. Based on the currently alloacted
budget, the department will Carry Forward $94,687 of funding from the sale of surplus buses and equipment, thereby reducing the FY22GF request to $50,000. (Note: No GF match
has been required for the last three fiscal years, because the department funded the local match to the grants with revenues from the sale of surplus buses and equipment.)
The Federal Transit Administration and the Georgia Department of Transportation recommend replacement of transit buses when they are 10 or 12 years old and vans when they are
5 or 7 years old, depending on FTA useful life rating by specific vehicle type. The average cost for a hybrid electric bus is $725,000 per bus and $85,000 for vans. All grants require a
minimum 20% local match, which is reflected in the increased funding levels. It's anticipated that Federal funding will be available in FY21 for various vehicle replacements, capital
maintenance items and other capital equipment replacements. TSPLOST 2017 funding is available to cover the local match required for all vehicle replacements and Bus Stop
Facilities Improvements in FY19‐23 years. Note: Buses ordered in 2020, will not be delivered until spring of calendar 2021. (Funding sources identified in FY22‐26 and FY27‐31 are not
approved)
The SPLOST 2011 Project # 7, Transit Vehicles and Bus Stop Improvements program and and TSPLOST 2017 programs will provide for the replacement of older transit vehicles or
acquisition of new vehicles to expand service and for capital improvements to system bus stops. Capital improvements are to include installation of signage, pad pavement, seating,
covered shelters, landscaping, bicycle racks, route information, and related bus stop improvements. This is a continuation of a SPLOST 2005, 2011 and TSPLOST 2017 program. SPLOST
and TSPLOST funding currently will not pay local match for capital maintenance items, spare parts, tires and and other capital equipment replacements.
Capital Detail by Department
FY22 Budget D-165

Transit Department Priority
Update Transit Plans and Transit Studies 2 of 2AI, Transportation Project Timeline: FY19 to FY23
Project Description
Project Justification
Impact on Annual Operating Expenses
Financial Plan Project ID: c0703
FY20 FY21 FY22 FY23 FY24 FY25 FY26 FY27‐31 Total
End Bal. Budget Approved Proposed Proposed Proposed Proposed Proposed Proposed
SOURCES
General Capital Fund ‐ ‐ 30,000 ‐ ‐ ‐ ‐ 150,000 180,000
TOTAL SOURCES ‐ ‐ 30,000 ‐ ‐ ‐ ‐ 150,000 180,000
USES
Capital ‐ Other ‐ ‐ 30,000 ‐ ‐ ‐ ‐ 150,000 180,000
TOTAL USES ‐ ‐ 30,000 ‐ ‐ ‐ ‐ 150,000 180,000
Annually revises 2018‐2021 Transit development plan, a five‐year action plan to improve planning, funding, and delivery of public transit services in Athens‐Clarke
County. Based on recommendations from the Mayor and Commission directed Transit Feasibility study that reviewed Athens Transit Systems current operations,
service delivery, a demand analysis, various surveys, and developed a plan for increasing services system wide.
This is a continuation of the Transit Feasibility study that was directed by Mayor and Commission and is a Federally mandated TDP. A study which is required once
every five years by Federal guidelines.
Staff will request additional funding through the Federal Grant process for FY21 and the out years for additional studies that may or will be required based on
recommendations of upcoming Transit services study. General Capital Funds will be needed for local match to grant requests.
Capital Detail by Department FY22 Budget D-166

Transportation & Public Works Department Priority
Signal Replacement 1 of 14CS, Transportation Project Timeline: Ongoing
Project Description
Project Justification
Impact on Annual Operating Expenses FY22 FY23 FY24 FY25 FY26 FY27‐31 Annual
‐ ‐ ‐ ‐ ‐ ‐ ‐
Financial Plan Project ID: c0094
FY20 FY21 FY22 FY23 FY24 FY25 FY26 FY27‐31 Total
End Bal. Budget Approved Proposed Proposed Proposed Proposed Proposed Proposed
SOURCES
General Capital Fund 153,468 200,000 75,000 620,000 829,000 1,058,000 1,058,000 5,287,500 8,927,500
TOTAL SOURCES 153,468 200,000 75,000 620,000 829,000 1,058,000 1,058,000 5,287,500 8,927,500
USES
Capital ‐ Infrastructure 153,468 200,000 75,000 620,000 829,000 1,058,000 1,058,000 5,287,500 8,927,500
TOTAL USES 153,468 200,000 75,000 620,000 829,000 1,058,000 1,058,000 5,287,500 8,927,500
Athens‐Clarke County is responsible for the routine maintenance and efficient operation of 173 traffic signals (91 are owned by ACC; 76 are owned by GDOT; and 6
are owned by UGA). The life cycle for existing traffic signal equipment, to keep it operating efficiently and have it responsive to traffic flows, is approximately 13
years. Funds will be used to purchase and install equipment necessary to rebuilding aging traffic signals including poles, controller equipment, signal heads, signal
wire, and miscellaneous equipment. Should a new traffic signal become warranted, this capital budget would fund installation.
FY21 M&C Strategic Commitment: Transportation Mobility and Connectivity
Relevant Departmental Performance Measure: "Annual Signal Rebuilds". Goal: >8% of signal network rebuilt; 5‐year average: 2.5%; FY21 Pace: 1.0% (December
2020)
The costs to maintain traffic signal equipment increase as the equipment ages beyond 13 years. The current average age of the 91 traffic signals owned by ACCGOV is
about 22 years, with 31 signals that are over 40 years old. At current funding levels, it is expected that this number would continue to grow. With increased age,
required maintenance repairs also increase which affects the Department's operating budget. Further, the increased likelihood of malfunctions threatens the safety
and efficiency of the overall traffic signal system. The proposed funding levels would achieve a sustainable 13‐year replacement cycle by FY25, considering costs of a
new traffic signal to range between $150k and $200k in present dollars. Specifically, Traffic Engineering would be able deliver 21 priority traffic signal rebuilds (which
have an average age of 39 years) over the next five fiscal years based on these funding levels.
No Impact.
Capital Detail by Department
FY22 Budget D-167

Transportation & Public Works Department Priority
Expand Fiber Optic Cable Communications System 2 of 14AI, Transportation Project Timeline: Ongoing
Project Description
Project Justification
Impact on Annual Operating Expenses FY22 FY23 FY24 FY25 FY26 FY27‐31 Annual
‐ ‐ ‐ ‐ ‐ ‐ ‐
Financial Plan Project ID: c0704
FY20 FY21 FY22 FY23 FY24 FY25 FY26 FY27‐31 Total
End Bal. Budget Approved Proposed Proposed Proposed Proposed Proposed Proposed
SOURCES
General Capital Fund 40,341 ‐ ‐ 30,000 30,000 40,000 40,000 200,000 340,000
TOTAL SOURCES 40,341 ‐ ‐ 30,000 30,000 40,000 40,000 200,000 340,000
USES
Capital ‐ Infrastructure 40,341 ‐ ‐ 30,000 30,000 40,000 40,000 200,000 340,000
TOTAL USES 40,341 ‐ ‐ 30,000 30,000 40,000 40,000 200,000 340,000
Fiber optic cable is the most efficient means of providing the needed communication link between traffic signals and the Traffic Control Center (TCC) to manage
traffic signal timing and operations. The project will expand and maintain the current fiber optic cable system which includes the fiber cable, Ethernet equipment,
and infrastructure at the TCC. The system is also utilized by the Computer Information Services Department to provide server connectivity to ACCGOV's remote
facilities.
FY21 M&C Strategic Commitment: Transportation Mobility and Connectivity
Relevant Departmental Performance Measure: "Percentage of Signal Network with fiber connection". Goal: 100%; 5‐year average: New for FY20; FY21 Pace: 40%
(December 2020)
Traffic signal systems have specific timing plans that rely on interconnection to ensure that the plans remain in step with one another. Further, interconnection
allows for instant modifications at the TCC based on real‐time conditions. Currently, only about 40 percent of the traffic signals are interconnected and many do not
communicate with the TCC. The completion of these communication gaps is critical to reduce travel time and unnecessary delay for drivers on the roadways.
No Impact.
Capital Detail by Department FY22 Budget D-168
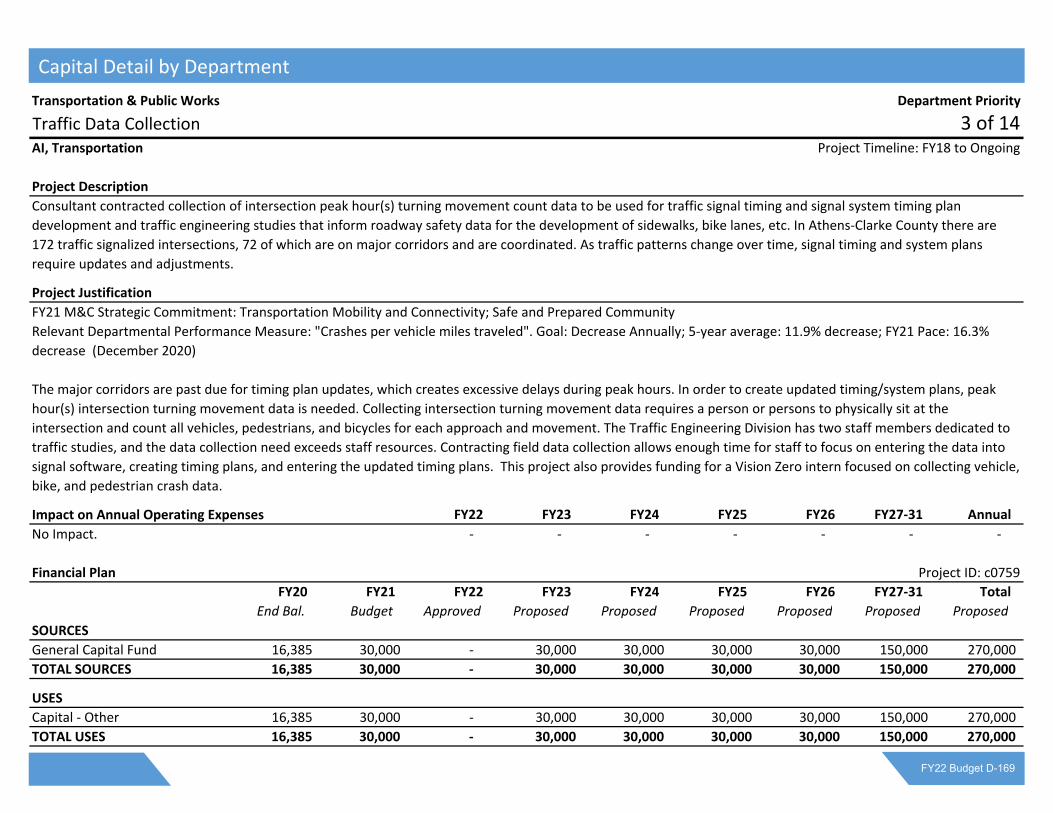
Transportation & Public Works Department Priority
Traffic Data Collection 3 of 14AI, Transportation Project Timeline: FY18 to Ongoing
Project Description
Project Justification
Impact on Annual Operating Expenses FY22 FY23 FY24 FY25 FY26 FY27‐31 Annual
‐ ‐ ‐ ‐ ‐ ‐ ‐
Financial Plan Project ID: c0759
FY20 FY21 FY22 FY23 FY24 FY25 FY26 FY27‐31 Total
End Bal. Budget Approved Proposed Proposed Proposed Proposed Proposed Proposed
SOURCES
General Capital Fund 16,385 30,000 ‐ 30,000 30,000 30,000 30,000 150,000 270,000
TOTAL SOURCES 16,385 30,000 ‐ 30,000 30,000 30,000 30,000 150,000 270,000
USES
Capital ‐ Other 16,385 30,000 ‐ 30,000 30,000 30,000 30,000 150,000 270,000
TOTAL USES 16,385 30,000 ‐ 30,000 30,000 30,000 30,000 150,000 270,000
Consultant contracted collection of intersection peak hour(s) turning movement count data to be used for traffic signal timing and signal system timing plan
development and traffic engineering studies that inform roadway safety data for the development of sidewalks, bike lanes, etc. In Athens‐Clarke County there are
172 traffic signalized intersections, 72 of which are on major corridors and are coordinated. As traffic patterns change over time, signal timing and system plans
require updates and adjustments.
FY21 M&C Strategic Commitment: Transportation Mobility and Connectivity; Safe and Prepared Community
Relevant Departmental Performance Measure: "Crashes per vehicle miles traveled". Goal: Decrease Annually; 5‐year average: 11.9% decrease; FY21 Pace: 16.3%
decrease (December 2020)
The major corridors are past due for timing plan updates, which creates excessive delays during peak hours. In order to create updated timing/system plans, peak
hour(s) intersection turning movement data is needed. Collecting intersection turning movement data requires a person or persons to physically sit at the
intersection and count all vehicles, pedestrians, and bicycles for each approach and movement. The Traffic Engineering Division has two staff members dedicated to
traffic studies, and the data collection need exceeds staff resources. Contracting field data collection allows enough time for staff to focus on entering the data into
signal software, creating timing plans, and entering the updated timing plans. This project also provides funding for a Vision Zero intern focused on collecting vehicle,
bike, and pedestrian crash data.
No Impact.
Capital Detail by Department
FY22 Budget D-169

Transportation & Public Works Department Priority
Sidewalk and Other Improvements 4 of 14AI, Transportation Project Timeline: Ongoing
Project Description
Project Justification
Impact on Annual Operating Expenses FY22 FY23 FY24 FY25 FY26 FY27‐31 Annual
‐ ‐ ‐ ‐ ‐ ‐ ‐
Financial Plan Project ID: c0071
FY20 FY21 FY22 FY23 FY24 FY25 FY26 FY27‐31 Total
End Bal. Budget Approved Proposed Proposed Proposed Proposed Proposed Proposed
SOURCES
General Capital Fund 52,144 ‐ ‐ 40,000 40,000 40,000 40,000 200,000 360,000
TOTAL SOURCES 52,144 ‐ ‐ 40,000 40,000 40,000 40,000 200,000 360,000
USES
Capital ‐ Infrastructure 52,144 ‐ ‐ ‐ 20,000 20,000 20,000 100,000 160,000
Capital ‐ Other ‐ ‐ ‐ 40,000 20,000 20,000 20,000 100,000 200,000
TOTAL USES 52,144 ‐ ‐ 40,000 40,000 40,000 40,000 200,000 360,000
The purpose of this project is to construct a comprehensive pedestrian system which provides enhanced pedestrian safety and accessibility. Annual project locations
have typically focused on Athens‐Clarke County owned arterial and collector roadways along bus routes in commercial and multi‐family zoned areas that meet
pedestrian needs for schools, shopping areas, recreation facilities, and access to public transportation. Future projects will address sidewalk connectivity needs
throughout Athens‐Clarke County consistent with the recommendation of the comprehensive Bicycle and Pedestrian Master Plan.
FY21 M&C Strategic Commitment: Transportation Mobility and Connectivity; Informed and Engaged Citizens
Relevant Departmental Performance Measure: "Percentage of Roadway Network with pedestrian facilities". Goal: Data Only; 5‐year average: 32.3%; FY21 Pace:
32.5% (December 2020)
Previous budget years incorporate funding from the SPLOST 2011 referendum project Pedestrian Safety and Safe Routes to School Program, and funding from the
TSPLOST referendum is available through FY23. However, SPLOST and TSPLOST funding can only be applied specifically to construction projects, and these must come
through the Athens in Motion (AiM) Master Plan. There are further funding needs for Pedestrian education and outreach, as well as small‐scale pedestrian projects
outside of the scope of AiM that can't be met through current SPLOST capital (constituent‐ and commission‐requested sidewalk improvements) that require
supplemental general capital funds.
No Impact.
Capital Detail by Department FY22 Budget D-170
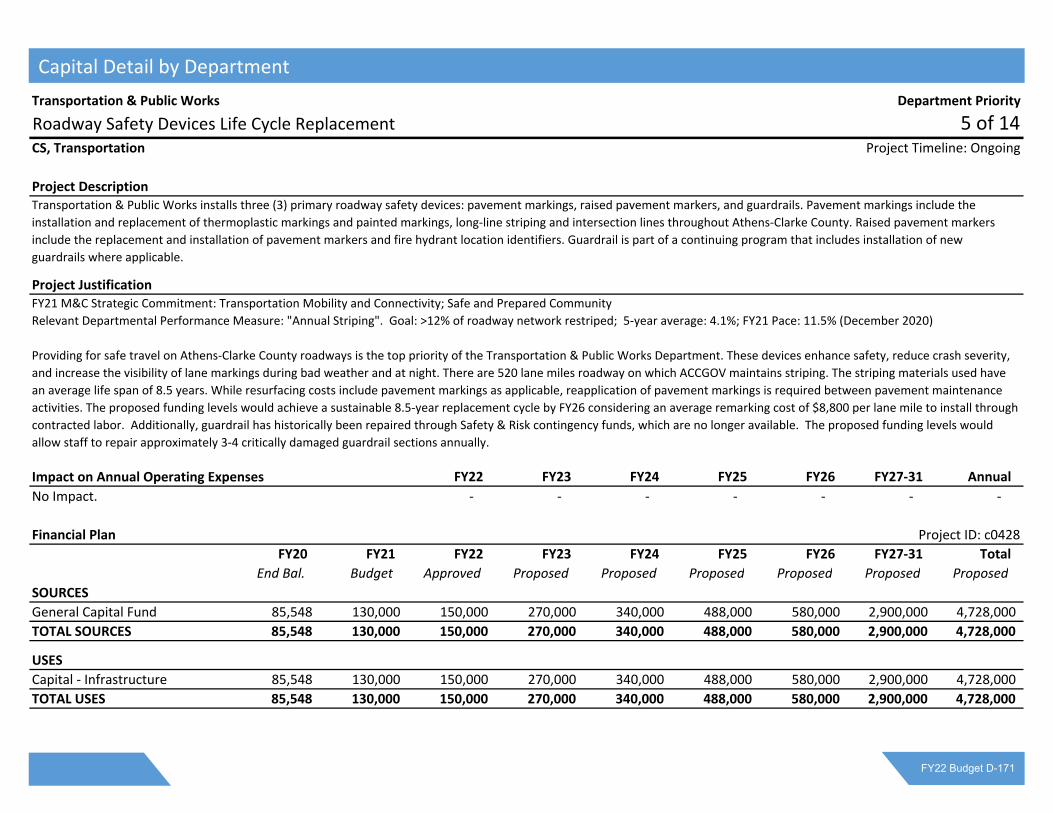
Transportation & Public Works Department Priority
Roadway Safety Devices Life Cycle Replacement 5 of 14CS, Transportation Project Timeline: Ongoing
Project Description
Project Justification
Impact on Annual Operating Expenses FY22 FY23 FY24 FY25 FY26 FY27‐31 Annual
‐ ‐ ‐ ‐ ‐ ‐ ‐
Financial Plan Project ID: c0428
FY20 FY21 FY22 FY23 FY24 FY25 FY26 FY27‐31 Total
End Bal. Budget Approved Proposed Proposed Proposed Proposed Proposed Proposed
SOURCES
General Capital Fund 85,548 130,000 150,000 270,000 340,000 488,000 580,000 2,900,000 4,728,000
TOTAL SOURCES 85,548 130,000 150,000 270,000 340,000 488,000 580,000 2,900,000 4,728,000
USES
Capital ‐ Infrastructure 85,548 130,000 150,000 270,000 340,000 488,000 580,000 2,900,000 4,728,000
TOTAL USES 85,548 130,000 150,000 270,000 340,000 488,000 580,000 2,900,000 4,728,000
Transportation & Public Works installs three (3) primary roadway safety devices: pavement markings, raised pavement markers, and guardrails. Pavement markings include the
installation and replacement of thermoplastic markings and painted markings, long‐line striping and intersection lines throughout Athens‐Clarke County. Raised pavement markers
include the replacement and installation of pavement markers and fire hydrant location identifiers. Guardrail is part of a continuing program that includes installation of new
guardrails where applicable.
FY21 M&C Strategic Commitment: Transportation Mobility and Connectivity; Safe and Prepared Community
Relevant Departmental Performance Measure: "Annual Striping". Goal: >12% of roadway network restriped; 5‐year average: 4.1%; FY21 Pace: 11.5% (December 2020)
Providing for safe travel on Athens‐Clarke County roadways is the top priority of the Transportation & Public Works Department. These devices enhance safety, reduce crash severity,
and increase the visibility of lane markings during bad weather and at night. There are 520 lane miles roadway on which ACCGOV maintains striping. The striping materials used have
an average life span of 8.5 years. While resurfacing costs include pavement markings as applicable, reapplication of pavement markings is required between pavement maintenance
activities. The proposed funding levels would achieve a sustainable 8.5‐year replacement cycle by FY26 considering an average remarking cost of $8,800 per lane mile to install through
contracted labor. Additionally, guardrail has historically been repaired through Safety & Risk contingency funds, which are no longer available. The proposed funding levels would
allow staff to repair approximately 3‐4 critically damaged guardrail sections annually.
No Impact.
Capital Detail by Department
FY22 Budget D-171

Transportation & Public Works Department Priority
Upgrade Overhead Street Name Signs 6 of 14CS, Transportation Project Timeline: Ongoing
Project Description
Project Justification
Impact on Annual Operating Expenses FY22 FY23 FY24 FY25 FY26 FY27‐31 Annual
‐ ‐ ‐ ‐ ‐ ‐ ‐
Financial Plan Project ID: c0544
FY20 FY21 FY22 FY23 FY24 FY25 FY26 FY27‐31 Total
End Bal. Budget Approved Proposed Proposed Proposed Proposed Proposed Proposed
SOURCES
General Capital Fund 25,364 150,000 75,000 406,000 500,000 550,000 550,000 3,300,000 5,381,000
TOTAL SOURCES 25,364 150,000 75,000 406,000 500,000 550,000 550,000 3,300,000 5,381,000
USES
Capital ‐ Infrastructure 25,364 150,000 75,000 406,000 500,000 550,000 550,000 3,300,000 5,381,000
TOTAL USES 25,364 150,000 75,000 406,000 500,000 550,000 550,000 3,300,000 5,381,000
This program upgrades street name signs, both overhead and ground mounted throughout Athens‐Clarke County. Many of the ground mounted street name signs on the classified
roadway system do not comply with current MUTCD standards for size and reflectivity. There are signs (street name and regulatory/warning traffic signs) on residential streets that
are non‐reflective due to extreme age and are not compliant with MUTCD requirements, causing safety and wayfinding issues. The program will aid with addressing the large number
of non‐standard, non‐reflective, and non‐compliant signs.
FY21 M&C Strategic Commitment: Transportation Mobility and Connectivity; Safe and Prepared Community
Relevant Departmental Performance Measure: "Annual Sign Replacements". Goal: >8% of sign network replaced; 5‐year average: 4.7%; FY21 Pace: 4.4% (December 2020)
This project will install street name signs at the intersections and improve the reflectivity to "diamond grade" sheeting material which will make the signs significantly more visible at
night and comply with MUTCD requirements. Additionally, new signs will have block numbers on them to aid emergency services personnel and visitors to Athens‐Clarke County. The
project also includes the replacement of traffic signs within residential neighborhoods that have outlived their life cycle (some over 30 years old) and will support a long‐term plan to
have all traffic signs meet the current MUTCD retro‐reflectivity standard. The life cycle for roadway signs is 12 years, and there are approximately 33,000 signs in Athens‐Clarke County.
Current funding only provides for a 45‐year life cycle, in non‐compliance with MUTCD requirements. The proposed funding levels would achieve a sustainable 12‐year replacement
cycle by FY25 considering an average replacement cost per sign of $200.
No Impact.
Capital Detail by Department FY22 Budget D-172

Transportation & Public Works Department Priority
Local Road Improvement Projects 7 of 14AI, Transportation Project Timeline: Ongoing
Project Description
Project Justification
Impact on Annual Operating Expenses FY22 FY23 FY24 FY25 FY26 FY27‐31 Annual
‐ ‐ ‐ ‐ ‐ ‐ ‐
Financial Plan Project ID: c0281
FY20 FY21 FY22 FY23 FY24 FY25 FY26 FY27‐31 Total
End Bal. Budget Approved Proposed Proposed Proposed Proposed Proposed Proposed
SOURCES
General Capital Fund 177,332 ‐ ‐ 100,000 125,000 125,000 130,000 650,000 1,130,000
TOTAL SOURCES 177,332 ‐ ‐ 100,000 125,000 125,000 130,000 650,000 1,130,000
USES
Capital ‐ Infrastructure 117,332 ‐ ‐ 100,000 125,000 125,000 130,000 277,000 757,000
Capital ‐ Other 60,000 ‐ ‐ ‐ ‐ ‐ ‐ 373,000 373,000
TOTAL USES 177,332 ‐ ‐ 100,000 125,000 125,000 130,000 650,000 1,130,000
The Local Road Improvement Program includes safety and operational transportation improvements to key intersections, interchanges, and roadway segments
within Athens‐Clarke County's roadway network. As traffic and safety patterns change over time, it is important to continually address and improve roadway
conditions. These changes may include, but are not limited to innovative intersections, additional lanes, signalization, improved alignment, increased sight distances,
and pedestrian / bicycle improvements. This program also provides funding for roadway and intersection studies, as well as asset mapping assistance, as well as a
portion of the ROW Agent's salary and benefits when assigned to capital projects.
FY21 M&C Strategic Commitment: Transportation Mobility and Connectivity
Relevant Departmental Performance Measure: "Overall Arterial Level of Service (LOS)". Goal: C (on A to F grading scale); 5‐year average: New for FY21; FY21 Pace:
New for FY21
The safe and efficient operation of traffic through intersections and corridors is a key component in allowing roadways to function at high levels of service. By
upgrading selected roadways and intersections throughout ACC, the roadway system will be improved and used more effectively and safely.
The ROW Agent position is 80% funded through Local Roads
General Capital funds, thereby reducing Annual Operating
Expenses by ≈$65,000 each year (adjusted for inflation).
Capital Detail by Department
FY22 Budget D-173

Transportation & Public Works Department Priority
Pavement Maintenance Program 8 of 14CS, Transportation Project Timeline: Ongoing
Project Description
Project Justification
Impact on Annual Operating Expenses FY22 FY23 FY24 FY25 FY26 FY27‐31 Annual
‐ ‐ ‐ ‐ ‐ ‐ ‐
Financial Plan Project ID: c0183
FY20 FY21 FY22 FY23 FY24 FY25 FY26 FY27‐31 Total
End Bal. Budget Approved Proposed Proposed Proposed Proposed Proposed Proposed
SOURCES
General Capital Fund 198,379 ‐ 700,000 1,400,000 3,085,000 3,208,000 4,820,000 41,347,000 54,560,000
TOTAL SOURCES 198,379 ‐ 700,000 1,400,000 3,085,000 3,208,000 4,820,000 41,347,000 54,560,000
USES
Capital ‐ Infrastructure 198,379 ‐ 500,000 1,200,000 2,885,000 3,008,000 4,620,000 39,398,000 51,611,000
Capital ‐ Other ‐ ‐ 200,000 200,000 200,000 200,000 200,000 1,949,000 2,949,000
TOTAL USES 198,379 ‐ 700,000 1,400,000 3,085,000 3,208,000 4,820,000 41,347,000 54,560,000
This Life Cycle program provides for the maintenance, repair, and reconstruction of pavements on Athens‐Clarke County roads. The majority of the maintenance work is performed by
a contractor under the direction of the Engineering Division within the Transportation & Public Works Department.
FY21 M&C Strategic Commitment: Transportation Mobility and Connectivity
Relevant Departmental Performance Measure: "Pavement Network Conditions". Goal: >70% of roadway network in good or excellent condition; 5‐year average: 46%; FY21 Pace: 66%
(December 2020)
This program is critical to the effective operation of our transportation system and benefits all the citizens and motorists in Athens‐Clarke County. ACCGOV is responsible for
approximately 130 lane‐miles of arterial roads, 290 lane‐miles of collector roads, and 845 lane‐miles of local roads. Pavement rehabilitation is a life cycle item with an estimated annual
capital cost of approximately $7.4 million, and this is expected to grow at a rate of 4% per year due to market forces. The Department's goal and industry standard sets a resurfacing
frequency of 10 years for arterials, 15 years for collectors, and 20 years for local roads. Frequencies longer than these recommendations result in failing roadway structures and
increased rehabilitation costs. This funding proposal equates to resurfacing 75 lane‐miles annually for a weighted frequency of about 17 years by FY28. Current funding levels allow for
an approximate 58 year resurfacing frequency. Given the ongoing underfunding of PMP, the funding deficit will continue to grow without the proposed, significant funding increases.
The Current TSPLOST addresses the existing paving deficit list, not on‐going life cycle needs. Future SPLOST or TSPLOST funding would supplement life cycle needs.
Both PMP Inspector positions are fully funded through PMP Capital
funds (one through General Capital and the other through TSPLOST,
thereby reducing Annual Operating Expenses by ≈$162,000 each
year (adjusted for inflation).
Capital Detail by Department FY22 Budget D-174
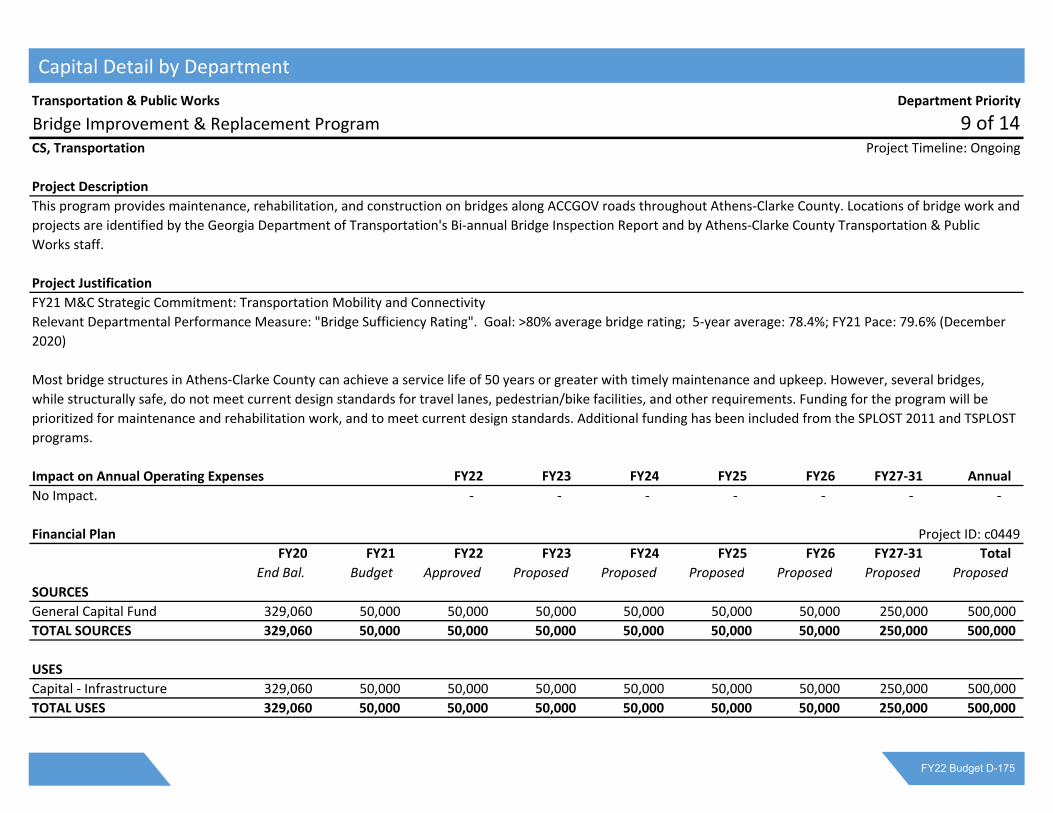
Transportation & Public Works Department Priority
Bridge Improvement & Replacement Program 9 of 14CS, Transportation Project Timeline: Ongoing
Project Description
Project Justification
Impact on Annual Operating Expenses FY22 FY23 FY24 FY25 FY26 FY27‐31 Annual
‐ ‐ ‐ ‐ ‐ ‐ ‐
Financial Plan Project ID: c0449
FY20 FY21 FY22 FY23 FY24 FY25 FY26 FY27‐31 Total
End Bal. Budget Approved Proposed Proposed Proposed Proposed Proposed Proposed
SOURCES
General Capital Fund 329,060 50,000 50,000 50,000 50,000 50,000 50,000 250,000 500,000
TOTAL SOURCES 329,060 50,000 50,000 50,000 50,000 50,000 50,000 250,000 500,000
USES
Capital ‐ Infrastructure 329,060 50,000 50,000 50,000 50,000 50,000 50,000 250,000 500,000
TOTAL USES 329,060 50,000 50,000 50,000 50,000 50,000 50,000 250,000 500,000
This program provides maintenance, rehabilitation, and construction on bridges along ACCGOV roads throughout Athens‐Clarke County. Locations of bridge work and
projects are identified by the Georgia Department of Transportation's Bi‐annual Bridge Inspection Report and by Athens‐Clarke County Transportation & Public
Works staff.
FY21 M&C Strategic Commitment: Transportation Mobility and Connectivity
Relevant Departmental Performance Measure: "Bridge Sufficiency Rating". Goal: >80% average bridge rating; 5‐year average: 78.4%; FY21 Pace: 79.6% (December
2020)
Most bridge structures in Athens‐Clarke County can achieve a service life of 50 years or greater with timely maintenance and upkeep. However, several bridges,
while structurally safe, do not meet current design standards for travel lanes, pedestrian/bike facilities, and other requirements. Funding for the program will be
prioritized for maintenance and rehabilitation work, and to meet current design standards. Additional funding has been included from the SPLOST 2011 and TSPLOST
programs.
No Impact.
Capital Detail by Department
FY22 Budget D-175

Transportation & Public Works Department Priority
Stormwater Improvement Prog / Areawide 10 of 14CS, Equipment Project Timeline: Ongoing
Project Description
Project Justification
Impact on Annual Operating Expenses FY22 FY23 FY24 FY25 FY26 FY27‐31 Annual
‐ ‐ ‐ ‐ ‐ ‐ ‐
Financial Plan Project ID: c0033
FY20 FY21 FY22 FY23 FY24 FY25 FY26 FY27‐31 Total
End Bal. Budget Approved Proposed Proposed Proposed Proposed Proposed Proposed
SOURCES
Storm Water Utility Fund 1,891,375 600,000 200,000 200,000 200,000 200,000 200,000 1,000,000 2,000,000
TOTAL SOURCES 1,891,375 600,000 200,000 200,000 200,000 200,000 200,000 1,000,000 2,000,000
USES
Capital ‐ Infrastructure 1,811,375 500,000 100,000 100,000 100,000 100,000 100,000 500,000 1,000,000
Capital ‐ Other 80,000 100,000 100,000 100,000 100,000 100,000 100,000 500,000 1,000,000
TOTAL USES 1,891,375 600,000 200,000 200,000 200,000 200,000 200,000 1,000,000 2,000,000
This is a continuing program of constructing improvements for publicly‐owned stormwater management facilities located throughout Athens‐Clarke County. Exact
project locations are determined through the Areawide Stormwater Master Plan, the requirements of the NPDES Phase II permit, the Live Stream Pipe Replacement
Program, and the Watershed Master Plan. Please note, the program reflects only the capital improvements associated with stormwater improvements since the
operating and general maintenance costs are included in the Stormwater Enterprise Fund annual budget.
FY21 M&C Strategic Commitment: Healthy, Livable, Sustainable Athens‐Clarke County
Relevant Departmental Performance Measure: "Number of Stormwater Pipes in Critical or Failed Condition". Goal: 0; 5‐year average: 30.5;
FY21 Pace: 34 (December 2020)
The purpose of this program is to continue the implementation of water quality and quantity projects identified in the Areawide Stormwater Master Plan, Watershed
Master Plan, and Live Stream Pipe Replacement Program. The program includes the repair and upgrade of existing facilities and construction of new stormwater
management facilities. Priority for design and construction is based on a rating system approved by Mayor and Commission.
No Impact.
Capital Detail by Department FY22 Budget D-176

Transportation & Public Works Department Priority
Pedestrian Safety and Traffic Calming Improvements 11 of 14AI, Transportation Project Timeline: Ongoing
Project Description
Project Justification
Impact on Annual Operating Expenses FY22 FY23 FY24 FY25 FY26 FY27‐31 Annual
‐ ‐ ‐ ‐ ‐ ‐ ‐
Financial Plan Project ID: c0392
FY20 FY21 FY22 FY23 FY24 FY25 FY26 FY27‐31 Total
End Bal. Budget Approved Proposed Proposed Proposed Proposed Proposed Proposed
SOURCES
General Capital Fund 114,612 ‐ ‐ ‐ ‐ ‐ 40,000 200,000 240,000
TOTAL SOURCES 114,612 ‐ ‐ ‐ ‐ ‐ 40,000 200,000 240,000
USES
Capital ‐ Infrastructure 114,612 ‐ ‐ ‐ ‐ ‐ 40,000 200,000 240,000
TOTAL USES 114,612 ‐ ‐ ‐ ‐ ‐ 40,000 200,000 240,000
This project will fund transportation projects to improve pedestrian safety and traffic calming improvements throughout Athens‐Clarke County. This program is
aimed at constructing crosswalk improvements at new and existing locations to provide safer pedestrian crossings at unsignalized locations. Required signage,
thermoplastic markings, countdown pedestrian signals, and Rapid Flashing Beacon systems at these locations may be installed based on an engineering study and the
documented need of increased safety measures. All improvements shall be consistent with the installation guidelines for marked crosswalks as adopted by the
Mayor and Commission. Additionally, this project provides funding to identify and support small‐scale Roadway Safety Audit projects.
FY21 M&C Strategic Commitment: Transportation Mobility and Connectivity; Safe and Prepared Community
Relevant Departmental Performance Measure: "Annual Number of Pedestrian‐related crashes". Goal: Decrease Annually; 5‐year average: 61 crashes;
FY21 Pace: 28 Crashes (December 2020)
Additional signage, markings, and Rapid Flashing Beacon systems, when installed in a systematic and warranted manner, have all been proven to be an effective
measure at increasing motorist awareness of crossing pedestrians and bicyclists. Therefore, prior to the installation of any additional warning devices, an engineering
study is needed to determine if additional warnings are necessary and what is the most appropriate measure or device to be installed.
No Impact.
Capital Detail by Department
FY22 Budget D-177

Transportation & Public Works Department Priority
Bicycle Transportation Improvements 12 of 14AI, Transportation Project Timeline: FY01 to Ongoing
Project Description
Project Justification
Impact on Annual Operating Expenses FY22 FY23 FY24 FY25 FY26 FY27‐31 Annual
‐ ‐ ‐ ‐ ‐ ‐ ‐
Financial Plan Project ID: c0211
FY20 FY21 FY22 FY23 FY24 FY25 FY26 FY27‐31 Total
End Bal. Budget Approved Proposed Proposed Proposed Proposed Proposed Proposed
SOURCES
General Capital Fund ‐ ‐ ‐ ‐ ‐ ‐ ‐ 1,000,000 1,000,000
TOTAL SOURCES ‐ ‐ ‐ ‐ ‐ ‐ ‐ 1,000,000 1,000,000
USES
Capital ‐ Infrastructure ‐ ‐ ‐ ‐ ‐ ‐ ‐ 680,000 680,000
Capital ‐ Land ‐ ‐ ‐ ‐ ‐ ‐ ‐ 200,000 200,000
Capital ‐ Other ‐ ‐ ‐ ‐ ‐ ‐ ‐ 120,000 120,000
TOTAL USES ‐ ‐ ‐ ‐ ‐ ‐ ‐ 1,000,000 1,000,000
This is a continuing program to implement recommendations of the recently completed Bicycle and Pedestrian Master Plan, Athens in Motion. As defined in the
Master Plan projects look to accomplish one or more of the following: construction of bicycle facilities, event‐based activities, education opportunities, information
architecture, respect and attention campaigns, and safety campaigns.
FY21 M&C Strategic Commitment: Transportation Mobility and Connectivity; Healthy, Livable, Sustainable Athens‐Clarke County
Relevant Departmental Performance Measure: "Percentage of Roadway Network with bicycle facilities". Goal: >51%; 5‐year average: 12.8%;
FY21 Pace: 13% (December 2020)
In addition to improving the connectivity of the bicycle network of Athens‐Clarke County through infrastructure, the purpose of this project is to improve the culture
of cycling through the following initiatives, as identified in the Athens in Motion Plan: Education, Safety, and Encouragement. Education refers to teaching drivers and
cyclists how to properly interact; safety refers to planning and creating safe infrastructure, and encouragement refers to promoting cycling as a viable transportation
alternative.
No Impact.
Capital Detail by Department FY22 Budget D-178

Transportation & Public Works Department Priority
Streetlight Capital 13 of 14AI, Infrastructure Project Timeline: FY22 to FY22
Project Description
Project Justification
Impact on Annual Operating Expenses FY22 FY23 FY24 FY25 FY26 FY27‐31 Annual
‐ ‐ ‐ ‐ ‐ ‐ ‐
Financial Plan Project ID: c0554
FY20 FY21 FY22 FY23 FY24 FY25 FY26 FY27‐31 Total
End Bal. Budget Approved Proposed Proposed Proposed Proposed Proposed Proposed
SOURCES
General Capital Fund ‐ ‐ 19,000 ‐ ‐ ‐ ‐ ‐ 19,000
TOTAL SOURCES ‐ ‐ 19,000 ‐ ‐ ‐ ‐ ‐ 19,000
USES
Capital ‐ Infrastructure ‐ ‐ 19,000 ‐ ‐ ‐ ‐ ‐ ‐
TOTAL USES ‐ ‐ 19,000 ‐ ‐ ‐ ‐ ‐ 19,000
Installation of roadway and residential streetlights along public roadways throughout Athens‐Clarke County.
Roadway and residential streetlights provide enhanced traffic safety measures for all roadway users in low‐light conditions. The selection of new streetlight
installations is in accordance with the minimum streetlighting standards developed by Transportation & Public Works and approved by Mayor and Commission.
No Impact.
Capital Detail by Department
FY22 Budget D-179

Transportation & Public Works Department Priority
Neighborhood Traffic 14 of 14AI, Transportation Project Timeline: FY22 to FY22
Project Description
Project Justification
Impact on Annual Operating Expenses FY22 FY23 FY24 FY25 FY26 FY27‐31 Annual
‐ ‐ ‐ ‐ ‐ ‐ ‐
Financial Plan Project ID: c0210
FY20 FY21 FY22 FY23 FY24 FY25 FY26 FY27‐31 Total
End Bal. Budget Approved Proposed Proposed Proposed Proposed Proposed Proposed
SOURCES
General Capital Fund ‐ ‐ 20,000 ‐ ‐ ‐ ‐ ‐ 20,000
TOTAL SOURCES ‐ ‐ 20,000 ‐ ‐ ‐ ‐ ‐ 20,000
USES
Capital ‐ Infrastructure ‐ ‐ 20,000 ‐ ‐ ‐ ‐ ‐ ‐
TOTAL USES ‐ ‐ 20,000 ‐ ‐ ‐ ‐ ‐ 20,000
Installation of traffic calming devices on residential streets in various neighborhoods throughout Athens‐Clarke County.
The purpose of the Neighborhood Traffic Management Program is to reduce crashes, traffic volumes and/or speeds on residential streets, thereby creating safer and
more pleasant neighborhoods for the citizens of Athens‐Clarke County. The selection of neighborhoods for this program is in accordance with the priority system
approved by the Commission. The continuation of this program is an initiative to improve traffic conditions in residential areas.
No Impact.
Capital Detail by Department FY22 Budget D-180

This section provides summary budget information by Fund for revenues and expenditures. A Fund is an individual accounting entity, which segregates expenditures, revenues, and other transactions for a specific group of activities.
The General Fund budget supports the major portion of basic governmental services such as police, fire, judicial, planning, public works, leisure services, etc. These services are primarily supported from tax revenues such as the property tax and the sales tax.
Special Revenue Funds are established to account for specific revenue sources that are usually legally restricted. These include:
‐ Hotel/Motel Tax ‐ Supportive Housing Fund ‐ Community Development Block Grant (CDBG) ‐ Special Programs and Initiatives Fund ‐ Emergency Telephone (E‐911) ‐ Building Inspection ‐ Revolving Loan Fund ‐ Sheriff Inmate Fund ‐ HOME Grant Program ‐ Corrections Inmate Fund ‐ Grants (All other grant programs) ‐ American Rescue Plan Fund ‐ Alternative Dispute Resolution (ADR) ‐ Tax Allocation District Funds ‐ Affordable Housing Fund Capital Projects Funds are used to account for financial resources for the acquisition and construction of major Capital Facilities. This includes:
‐Public Facilities Authority Fund which accounts for capital projects and debt service projects approved through the Authority (DFCS Building and Jail Advance Housing facility).
‐Economic Development Fund which accounts for revenues and expenditures for infrastructure improvements needed to recruit new or expansions of existing industries
‐General Capital Projects Fund for capital projects which are not accounted for in the General Fund Debt Service Funds are established to account for expenditures for debt principal and interest.
‐SPLOST Debt Service ‐ Established to account for the debt service expenditures financed through Special Purpose Local Option Sales Tax programs.
Enterprise Funds are used to account for operations which are similar to a private business enterprise or the governing body has identified a need to account for an operation in this manner. These include:
‐ Airport ‐ Water & Sewer ‐ Landfill ‐ Solid Waste Collection ‐ Transit ‐ Stormwater Utility Internal Service Funds are used to account for the operations of departments which provide goods and services to other government departments or agencies on a cost reimbursement basis. These include:
‐ Internal Support ‐ Self‐Funded Insurance & Claims ‐ Fleet Management ‐ Self‐Funded Health Insurance ‐ Fleet Replacement In addition, this section includes a listing of Interfund Transfer payments or transfers between funds on the last page.
Budgets by Fund
FY22 Budget E-1
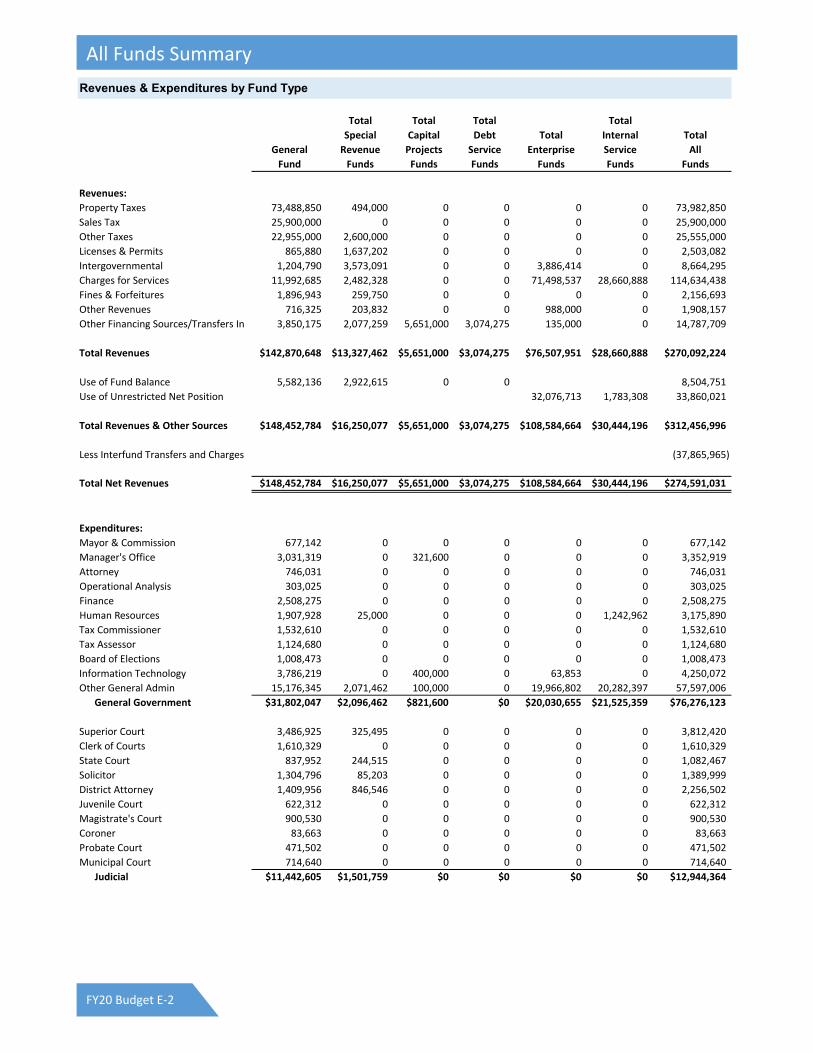
Revenues & Expenditures by Fund Type
Total Total Total Total
Special Capital Debt Total Internal Total
General Revenue Projects Service Enterprise Service All
Fund Funds Funds Funds Funds Funds Funds
Revenues:
Property Taxes 73,488,850 494,000 0 0 0 0 73,982,850
Sales Tax 25,900,000 0 0 0 0 0 25,900,000
Other Taxes 22,955,000 2,600,000 0 0 0 0 25,555,000
Licenses & Permits 865,880 1,637,202 0 0 0 0 2,503,082
Intergovernmental 1,204,790 3,573,091 0 0 3,886,414 0 8,664,295
Charges for Services 11,992,685 2,482,328 0 0 71,498,537 28,660,888 114,634,438
Fines & Forfeitures 1,896,943 259,750 0 0 0 0 2,156,693
Other Revenues 716,325 203,832 0 0 988,000 0 1,908,157
Other Financing Sources/Transfers In 3,850,175 2,077,259 5,651,000 3,074,275 135,000 0 14,787,709
Total Revenues $142,870,648 $13,327,462 $5,651,000 $3,074,275 $76,507,951 $28,660,888 $270,092,224
Use of Fund Balance 5,582,136 2,922,615 0 0 8,504,751
Use of Unrestricted Net Position 32,076,713 1,783,308 33,860,021
Total Revenues & Other Sources $148,452,784 $16,250,077 $5,651,000 $3,074,275 $108,584,664 $30,444,196 $312,456,996
Less Interfund Transfers and Charges (37,865,965)
Total Net Revenues $148,452,784 $16,250,077 $5,651,000 $3,074,275 $108,584,664 $30,444,196 $274,591,031
Expenditures:
Mayor & Commission 677,142 0 0 0 0 0 677,142
Manager's Office 3,031,319 0 321,600 0 0 0 3,352,919
Attorney 746,031 0 0 0 0 0 746,031
Operational Analysis 303,025 0 0 0 0 0 303,025
Finance 2,508,275 0 0 0 0 0 2,508,275
Human Resources 1,907,928 25,000 0 0 0 1,242,962 3,175,890
Tax Commissioner 1,532,610 0 0 0 0 0 1,532,610
Tax Assessor 1,124,680 0 0 0 0 0 1,124,680
Board of Elections 1,008,473 0 0 0 0 0 1,008,473
Information Technology 3,786,219 0 400,000 0 63,853 0 4,250,072
Other General Admin 15,176,345 2,071,462 100,000 0 19,966,802 20,282,397 57,597,006
General Government $31,802,047 $2,096,462 $821,600 $0 $20,030,655 $21,525,359 $76,276,123
Superior Court 3,486,925 325,495 0 0 0 0 3,812,420
Clerk of Courts 1,610,329 0 0 0 0 0 1,610,329
State Court 837,952 244,515 0 0 0 0 1,082,467
Solicitor 1,304,796 85,203 0 0 0 0 1,389,999
District Attorney 1,409,956 846,546 0 0 0 0 2,256,502
Juvenile Court 622,312 0 0 0 0 0 622,312
Magistrate's Court 900,530 0 0 0 0 0 900,530
Coroner 83,663 0 0 0 0 0 83,663
Probate Court 471,502 0 0 0 0 0 471,502
Municipal Court 714,640 0 0 0 0 0 714,640
Judicial $11,442,605 $1,501,759 $0 $0 $0 $0 $12,944,364
All Funds Summary
FY20 Budget E-2

Total Total Total Total
Special Capital Debt Total Internal Total
General Revenue Projects Service Enterprise Service All
Fund Funds Funds Funds Funds Funds Funds
Police 23,264,737 3,758,605 935,144 0 0 0 27,958,486
Fire 14,862,157 0 75,000 0 0 0 14,937,157
Corrections 4,208,946 50,000 30,000 0 0 0 4,288,946
Animal Services 1,225,614 0 0 0 0 0 1,225,614
Sheriff 18,067,908 35,000 76,000 0 0 0 18,178,908
Public Safety $61,629,362 $3,843,605 $1,116,144 $0 $0 $0 $66,589,111
Airport 0 0 86,500 0 2,540,412 0 2,626,912
Transit 0 100,841 80,000 0 6,009,006 0 6,189,847
Transportation & Public Works 4,794,406 0 1,089,000 0 3,597,428 0 9,480,834
Public Utilities 0 0 0 0 55,757,539 0 55,757,539
Solid Waste 1,319,873 36,000 125,000 0 7,860,021 0 9,340,894
Central Services 10,322,053 130,000 1,782,756 0 0 8,107,580 20,342,389
Public Works $16,436,332 $266,841 $3,163,256 $0 $75,764,406 $8,107,580 $103,738,415
Leisure Services 8,499,761 685,000 550,000 0 0 0 9,734,761
Culture & Recreation $8,499,761 $685,000 $550,000 $0 $0 $0 $9,734,761
Housing & Comm. Dev. 697,932 3,242,746 0 0 0 0 3,940,678
Economic Development 624,109 553,130 0 0 0 0 1,177,239
Planning 1,184,835 381,173 0 0 0 0 1,566,008
Building Inspection 924,329 1,292,002 0 0 28,618 0 2,244,949
Cooperative Extension 231,150 0 0 0 0 0 231,150
Housing & Development $3,662,355 $5,469,051 $0 $0 $28,618 $0 $9,160,024
Independent Agencies 5,936,922 2,254,460 0 0 0 8,191,382
Debt Service 1,315,141 0 0 3,074,275 9,193,365 269,445 13,852,226
Total Expenditures $140,724,525 $16,117,178 $5,651,000 $3,074,275 $105,017,044 $29,902,384 $300,486,406
Other Financing Uses/Transfers Out 7,728,259 125,340 0 3,529,856 226,915 11,610,370
Total Expenditures & Other $148,452,784 $16,242,518 $5,651,000 $3,074,275 $108,546,900 $30,129,299 $312,096,776
Financing Uses
Less Interfund Transfers and Charges (37,865,965)
Total Net Expenditures $148,452,784 $16,242,518 $5,651,000 $3,074,275 $108,546,900 $30,129,299 $274,230,811
Designated for Future Capital
Improvements & Debt Service 0 7,559 0 0 37,764 314,897 360,220
Total Expenditures & Designations $148,452,784 $16,250,077 $5,651,000 $3,074,275 $108,584,664 $30,444,196 $274,591,031
All Funds Summary
FY22 Budget E-3

Expenditures by Fund
FY21 FY22
Budget Approved $▲ %▲General Fund 140,480,552 148,452,784 7,972,232 5.7%
Special Revenue Funds
Hotel/Motel Fund 3,373,000 2,700,000 (673,000) ‐20.0%
Community Development Block Grant Fund 1,409,876 1,363,769 (46,107) ‐3.3%
Emergency Telephone System Fund 3,624,346 3,725,223 100,877 2.8%
HUD HOME Grant Fund 665,156 691,534 26,378 4.0%
Grants Fund 447,776 450,321 2,545 0.6%
Alternative Dispute Resolution Fund 215,195 217,228 2,033 0.9%
Affordable Housing Fund 161,987 213,487 51,500 31.8%
Supportive Housing Grant Fund 322,943 322,943 0 0.0%
Special Programs Fund 1,677,127 2,088,490 411,363 24.5%
Building Inspection Fund 1,497,276 1,634,643 137,367 9.2%
Sheriff Inmate Fund 70,000 70,000 0 0.0%
Corrections Inmate Fund 50,000 50,000 0 0.0%
American Rescue Plan Fund 0 2,220,880 2,220,880 ‐‐
Mall Area TAD 0 22,000 22,000 ‐‐
West Broad/Hawthorne TAD 0 118,000 118,000 ‐‐
Newton Bridge TAD 0 73,000 73,000 ‐‐
East Downtown TAD 0 49,000 49,000 ‐‐
North Avenue TAD 0 30,000 30,000 ‐‐
Lexington Road TAD 0 202,000 202,000 ‐‐
Subtotal Special Revenue Funds $13,514,682 $16,242,518 $2,727,836 20.2%
Capital Projects Funds
Public Facilities Authority Fund 524,836 0 (524,836) ‐100.0%
Economic Dev. Capital Projects Fund 225,000 0 (225,000) ‐100.0%
General Capital Projects Fund 2,381,200 5,651,000 3,269,800 137.3%
Subtotal Capital Projects Funds $3,131,036 $5,651,000 $2,519,964 80.5%
Debt Service Funds
SPLOST Debt Service Fund 3,702,160 3,074,275 (627,885) ‐17.0%
Enterprise Funds
Airport Fund 3,229,003 3,124,252 (104,751) ‐3.2%
Landfill Fund 4,998,364 6,010,841 1,012,477 20.3%
Transit Fund* 7,337,915 7,277,617 (60,298) ‐0.8%
Water & Sewer Fund 84,251,330 82,237,458 (2,013,872) ‐2.4%
Solid Waste Fund 4,361,797 4,418,457 56,660 1.3%
Stormwater Fund 6,073,684 5,478,275 (595,409) ‐9.8%
Subtotal Enterprise Funds $110,252,093 $108,546,900 ($1,705,193) ‐1.5%
Internal Service Funds
Internal Support Fund 2,061,769 2,022,511 (39,258) ‐1.9%
Fleet Management Fund 2,729,496 2,734,556 5,060 0.2%
Fleet Replacement Fund 1,385,400 3,943,000 2,557,600 184.6%
Insurance & Claims Fund 3,649,172 3,698,693 49,521 1.4%
Health Insurance Fund 16,367,934 17,730,539 1,362,605 8.3%
Subtotal Internal Service Funds $26,193,771 $30,129,299 $3,935,528 15.0%
Less Interfund Transfers and Charges (33,128,904) (37,865,965) (4,737,061) 14.3%
Total Operating & Capital Expenditures $264,145,390 $274,230,811 $10,085,421 3.8%
*Transit Fund figures do not include Depreciation Expenses.
All Funds Summary
FY20 Budget E-4

Revenues & Expenditures by Type
FY20 FY21 FY22 FY22
Actual Budget Requested Approved $▲ %▲Revenues
Property Taxes 66,669,631 68,175,350 73,488,850 73,488,850 5,313,500 7.8%
Sales Tax 25,121,935 24,650,000 25,900,000 25,900,000 1,250,000 5.1%
Other Taxes 23,299,226 21,960,500 22,955,000 22,955,000 994,500 4.5%
Licenses & Permits 1,643,490 961,310 865,880 865,880 (95,430) ‐9.9%
Intergovernmental Revenues 1,378,495 1,380,403 1,304,790 1,204,790 (175,613) ‐12.7%
Charges for Services 11,319,312 13,788,970 12,087,785 11,992,685 (1,796,285) ‐13.0%
Fines & Forfeitures 2,503,529 3,586,382 1,896,943 1,896,943 (1,689,439) ‐47.1%
Other Revenues 1,420,068 670,725 716,325 716,325 45,600 6.8%
Other Financing Sources/Transfers In 3,841,884 3,993,283 3,883,581 3,850,175 (143,108) ‐3.6%
Total Revenues $137,197,570 $139,166,923 $143,099,154 $142,870,648 $3,703,725 2.7%
Prior Year Fund Balance ‐ Operating 0 1,313,629 11,160,832 2,443,136 1,129,507 86.0%
Prior Year Fund Balance ‐ Capital 0 0 43,223,582 3,139,000 3,139,000 ‐‐
Total Revenues & Other Sources $137,197,570 $140,480,552 $197,483,568 $148,452,784 $7,972,232 5.7%
Expenditures
Personal Services 91,567,493 98,355,675 105,432,894 101,125,870 2,770,195 2.8%
Operating Expenditures 25,393,793 29,697,986 35,442,522 31,146,592 1,448,606 4.9%
Debt Service 1,050,335 1,312,446 1,315,141 1,315,141 2,695 0.2%
Operating Contingency 0 1,200,000 1,200,000 1,200,000 0 0.0%
Independent Agencies 5,477,578 5,826,343 5,936,922 5,936,922 110,579 1.9%
Transfers to Other Funds 3,841,902 1,576,102 4,932,507 2,077,259 501,157 31.8%
Transfers for Capital 2,363,000 2,512,000 43,223,582 5,651,000 3,139,000 125.0%
Total Expenditures $129,694,101 $140,480,552 $197,483,568 $148,452,784 $7,972,232 5.7%
General Fund Revenues
Property Taxes: 51.4%
Sales Tax: 18.1%
Other Taxes: 16.1%
Charges for Services: 8.4%
Transfers In: 2.7%
Fines & Forfeitures: 1.3%
Licenses & Permits: 0.6%
Intergovernmental Revenues: 0.8%
Other Revenues: 0.5%
General Fund Expenditures
Personal Services: 68.1%
Operating Expenditures: 21.0%
Independent Agencies: 4.0%
Transfers for Capital: 3.8%
Transfers to Other Funds: 1.4%
Debt Service: 0.9%
Operating Contingency: 0.8%
General Fund
FY22 Budget E-5

Expenditures by Department
FY20 FY21 FY22 FY22
Actual Budget Requested Approved $▲ %▲Mayor & Commission's Office 608,771 669,402 677,142 677,142 7,740 1.2%
Manager's Office 2,171,615 2,552,973 3,599,308 3,031,319 478,346 18.7%
Attorney's Office 703,516 723,257 803,031 746,031 22,774 3.1%
Office of Operational Analysis 283,677 323,869 310,425 303,025 (20,844) ‐6.4%
Finance 2,165,262 2,464,952 2,518,275 2,508,275 43,323 1.8%
Human Resources 1,524,966 1,768,629 2,061,827 1,907,928 139,299 7.9%
Tax Commissioner's Office 1,503,493 1,525,628 1,534,610 1,532,610 6,982 0.5%
Tax Assessors 1,097,159 1,111,580 1,196,555 1,124,680 13,100 1.2%
Board of Elections 925,585 859,488 1,012,647 1,008,473 148,985 17.3%
Information Technology 2,951,694 3,622,546 4,601,576 3,786,219 163,673 4.5%
Other General Administration 10,167,634 13,885,781 14,592,345 15,176,345 1,290,564 9.3%
Total General Government $24,103,372 $29,508,105 $32,907,741 $31,802,047 $2,293,942 7.8%
Superior Court 2,857,101 3,324,224 3,652,763 3,486,925 162,701 4.9%
Clerk of Courts 1,370,142 1,558,216 1,618,329 1,610,329 52,113 3.3%
State Court 787,548 827,330 1,082,284 837,952 10,622 1.3%
Solicitor General's Office 1,223,120 1,287,876 1,324,796 1,304,796 16,920 1.3%
District Attorney's Office 1,364,041 1,387,359 1,534,784 1,409,956 22,597 1.6%
Juvenile Court 600,915 607,152 790,726 622,312 15,160 2.5%
Magistrate's Court 809,248 882,053 905,530 900,530 18,477 2.1%
Coroner's Office 55,245 56,992 83,663 83,663 26,671 46.8%
Probate Court 513,840 529,549 476,502 471,502 (58,047) ‐11.0%
Municipal Court 656,271 702,324 717,140 714,640 12,316 1.8%
Total Judicial $10,237,471 $11,163,075 $12,186,517 $11,442,605 $279,530 2.5%
Police Services 21,153,329 22,513,278 24,913,795 23,264,737 751,459 3.3%
Fire & Emergency Services 14,261,780 14,477,207 15,871,502 14,862,157 384,950 2.7%
Corrections 3,598,460 4,025,093 4,223,946 4,208,946 183,853 4.6%
Animal Services 689,087 1,148,337 1,325,270 1,225,614 77,277 6.7%
Sheriff's Office 17,355,839 17,762,584 19,284,456 18,067,908 305,324 1.7%
Total Public Safety $57,058,495 $59,926,499 $65,618,969 $61,629,362 $1,702,863 2.8%
Trans. & Public Works 4,309,876 4,547,823 4,974,866 4,794,406 246,583 5.4%
Solid Waste 895,623 1,206,652 1,623,804 1,319,873 113,221 9.4%
Central Services 9,357,958 9,925,816 10,695,205 10,322,053 396,237 4.0%
Total Public Works $14,563,457 $15,680,291 $17,293,875 $16,436,332 $756,041 4.8%
Leisure Services 7,535,602 8,535,108 9,272,986 8,499,761 (35,347) ‐0.4%
Total Culture & Recreation $7,535,602 $8,535,108 $9,272,986 $8,499,761 ($35,347) ‐0.4%
Housing & Community Development 869,426 1,585,864 1,573,932 697,932 (887,932) ‐56.0%
Economic Development 458,284 551,102 847,239 624,109 73,007 13.2%
Planning & Zoning 1,067,248 1,172,946 1,200,435 1,184,835 11,889 1.0%
Building Inspection 856,763 891,717 924,329 924,329 32,612 3.7%
Cooperative Extension 211,167 238,954 249,393 231,150 (7,804) ‐3.3%
Total Housing & Development $3,462,888 $4,440,583 $4,795,328 $3,662,355 ($778,228) ‐17.5%
Independent Agencies 5,477,579 5,826,343 5,936,922 5,936,922 110,579 1.9%
Debt Service 1,050,335 1,312,446 1,315,141 1,315,141 2,695 0.2%
Total Expenditures $123,489,199 $136,392,450 $149,327,479 $140,724,525 $4,332,075 3.2%
Other Financing Uses/Transfers Out 3,841,902 1,576,102 4,932,507 2,077,259 501,157 31.8%
Transfers for Capital 2,363,000 2,512,000 43,223,582 5,651,000 3,139,000 125.0%
Total Other Financing Uses $6,204,902 $4,088,102 $48,156,089 $7,728,259 $3,640,157 89.0%
Total Expenditures & Uses $129,694,101 $140,480,552 $197,483,568 $148,452,784 $7,972,232 5.7%
General Fund
FY20 Budget E-6

Changes in Fund Balance
FY20 FY21 FY22Actual Budget Approved
Fund Balance - Beginning $26,376,353 $33,879,822 $43,209,795Excess Revenue over Expenditures $7,503,469Budgeted Use of Fund Balance ($1,313,629) ($5,582,136)CARES Act Funding $6,643,602Anticipated ARPA FundingEstimated Budget Savings (Projected) $4,000,000
Fund Balance - Ending $33,879,822 $43,209,795 $37,627,659
Less Assignments/Commitments of Fund Balance:Nonspendable ($501) ($501) ($501)Assigned - Prosperity Package ($622,043) ($622,043) ($622,043)Assigned - COVID Comm. Relief (Resiliency Pkg) ($5,627,605) ($5,627,605) ($5,627,605)Assigned - Athens CARES Package ($5,538,150) ($5,538,150)Assigned - Athens CARES (unallocated) ($1,105,452) ($1,105,452)
Unassigned Fund Balance $27,629,673 $30,316,044 $24,733,908
% of Expenditures and Transfers Out: 21.3% 22.2% 16.7%
Other Information
General Fund Balance as Percent of Total Expenditures & Transfers Out
The FY22 General Fund Operating Budget (not including capital) is $142.8 million, 3.5% higher than the FY21 Budget. Over thelast several budget years, the General Fund Operating Budget has grown at a rate lower than the combined annual change of the Consumer Price Index (CPI) and population. However, for FY21 and FY22 the growth rate exceeds the CPI and population.
$0
$20
$40
$60
$80
$100
$120
$140
$160
FY13 FY14 FY15 FY16 FY17 FY18 FY19 FY20 FY21 FY22
General Fund Budgets Compared to Population and CPI Increases(FY13-FY22)
Projected Budget Approved/Recommended Budget
Millions
Note: FY91 = 1.0
19.2%18.1%
21.3%22.2% 22.2%
16.7%
0%
5%
10%
15%
20%
25%
FY17 FY18 FY19 FY20 FY21 (Est.) FY22 (Est.)
16.67% /ACCGov Reserve Fund Pollicy Amount (2 months)
General Fund
FY22 Budget E-7

Hotel/Motel Fund
FY20 FY21 FY22 FY22
Actual Budget Requested Approved $▲ %▲Revenues
Taxes 2,889,554 3,373,000 2,600,000 2,600,000 (773,000) ‐22.9%
Other Revenues 7,520 0 0 0 0 ‐‐
Total Revenues $2,897,074 $3,373,000 $2,600,000 $2,600,000 ($773,000) ‐22.9%
Prior Year Fund Balance 0 88,707 100,000 100,000 ‐‐
Total Revenues & Other Sources $2,897,074 $3,373,000 $2,688,707 $2,700,000 ($673,000) ‐20.0%
Expenditures
Airport 5,555 0 0 0 0 ‐‐
Economic Development 177,677 115,000 115,000 100,000 (15,000) ‐13.0%
Central Services 5,663 0 0 100,000 100,000 ‐‐
Independent Agencies:
Classic Center Authority & CVB 2,482,432 2,890,999 2,228,460 2,228,460 (662,539) ‐22.9%
Other General Administration
Tourism Improvement & Special Activities 95,857 146,501 146,501 131,200 (15,301) ‐10.4%
Mayor's Community Improvement Pgrm 18,900 20,000 20,000 20,000 0 0.0%
Other Financing Uses
Transfer to General Fund 190,000 160,500 123,746 90,340 (70,160) ‐43.7%
Total Expenditures $2,976,084 $3,333,000 $2,633,707 $2,670,000 ($663,000) ‐19.9%
Capital ‐ Central Services 75,175 40,000 55,000 30,000 (10,000) ‐25.0%
Total Operating & Capital Expenditures $3,051,259 $3,373,000 $2,688,707 $2,700,000 ($673,000) ‐20.0%
Excess of Revenues over Expenditures ($154,185) $0 $0 $0
Changes in Fund Balance
FY20 FY21 FY22
Actual Budget Approved
Fund Balance ‐ Beginning $597,737 $443,552 $302,554
Excess Revenue over Expenditures ($154,185)
Budgeted Use of Fund Balance 0 (100,000)
Estimated Budget Savings (Loss) (140,998)
Fund Balance ‐ Ending $443,552 $302,554 $202,554
Committed for Capital Projects $168,558 $168,558 $168,558
Assigned/Available Fund Balance $274,994 $274,994 $174,994
Hotel/Motel Fund Revenue FY13‐FY22 (Budgeted)
$0.0 M
$0.5 M
$1.0 M
$1.5 M
$2.0 M
$2.5 M
$3.0 M
$3.5 M
$4.0 M
FY13 FY14 FY15 FY16 FY17 FY18 FY19 FY20 FY21 FY22
Special Revenue Funds
FY20 Budget E-8

Community Development Block Grant Fund
FY20 FY21 FY22 FY22
Actual Budget Requested Approved $▲ %▲Revenues
Intergovernmental 1,215,622 1,409,876 1,363,769 1,363,769 (46,107) ‐3.3%
Other Revenues 0 0 0 0 0 ‐‐
Total Revenues $1,215,622 $1,409,876 $1,363,769 $1,363,769 ($46,107) ‐3.3%
Expenditures
CDBG Administration:
Housing & Community Development 266,582 272,106 267,254 267,254 (4,852) ‐1.8%
Other General Administration 5,500 9,870 5,500 5,500 (4,370) ‐44.3%
CDBG Grant Programs 943,541 1,127,900 1,091,015 1,091,015 (36,885) ‐3.3%
Total Expenditures $1,215,623 $1,409,876 $1,363,769 $1,363,769 ($46,107) ‐3.3%
Excess of Revenues over Expenditures ($1) $0 $0 $0
Changes in Fund Balance
FY20 FY21 FY22
Actual Budget Approved
Fund Balance ‐ Beginning $3,220 $3,219 $3,219
Excess Revenue over Expenditures ($1)
Fund Balance ‐ Ending $3,219 $3,219 $3,219
Restricted Fund Balance $3,219 $3,219
Special Revenue Funds
FY22 Budget E-9

Revolving Loan Fund
FY20 FY21 FY22 FY22
Actual Budget Requested Approved $▲ %▲Revenues
Other Revenues 2,254 5,000 5,000 5,000 0 0.0%
Expenditures
Other General Administration 0 0 0 0 0 ‐‐
Excess of Revenues over Expenditures $2,254 $5,000 $5,000 $5,000
Changes in Fund Balance
FY20 FY21 FY22
Actual Budget Approved
Fund Balance ‐ Beginning $237,387 $239,641 $244,641
Excess Revenue over Expenditures $2,254 $5,000 $5,000
Fund Balance ‐ Ending $239,641 $244,641 $249,641
Nonspendable $0 $0
Restricted Fund Balance $239,641 $244,641 $249,641
Special Revenue Funds
FY20 Budget E-10

Emergency Telephone System (E-911) Fund
FY20 FY21 FY22 FY22
Actual Budget Requested Approved $▲ %▲Revenues
Charges for Services 2,092,457 2,050,000 2,200,000 2,200,000 150,000 7.3%
Other Revenues 32,618 20,000 20,000 20,000 0 0.0%
Total Revenues $2,125,075 $2,070,000 $2,220,000 $2,220,000 150,000 7.2%
Other Financing Sources/Transfers In 758,044 1,111,000 1,111,000 1,111,000 0 0.0%
Prior Year Fund Balance 0 443,346 394,223 394,223 (49,123) ‐11.1%
Total Revenues & Other Sources $2,883,119 $3,624,346 $3,725,223 $3,725,223 $100,877 2.8%
Expenditures
Police 2,595,040 3,428,926 3,526,295 3,526,295 97,369 2.8%
Other General Administration 171,891 195,420 198,928 198,928 3,508 1.8%
Total Operating Expenditures $2,766,931 $3,624,346 $3,725,223 $3,725,223 $100,877 2.8%
Capital Expenditures 0 82,489 0 0 (82,489) ‐100.0%
Total Operating & Capital Expenses $2,766,931 $3,706,835 $3,725,223 $3,725,223 18,388 0.5%
Excess of Revenues over Expenditures $116,188 $0 $0 $0
Changes in Fund Balance
FY20 FY21 FY22
Actual Budget Approved
Fund Balance ‐ Beginning $726,964 $843,152 $399,806
Excess Revenue over Expenditures $116,188
Budgeted Use of Fund Balance (443,346) (394,223)
Fund Balance ‐ Ending $843,152 $399,806 $5,583
Assigned/Available Fund Balance $843,152 $399,806 $5,583
Special Revenue Funds
FY22 Budget E-11

HUD HOME Grant Fund
FY20 FY21 FY22 FY22
Actual Budget Requested Approved $▲ %▲Revenues
Intergovernmental 272,769 665,156 691,534 691,534 26,378 4.0%
Other Revenues 0 0 0 0 0 ‐‐
Total Revenues $272,769 $665,156 $691,534 $691,534 26,378 4.0%
Prior Year Fund Balance 0 0 0 0 ‐‐
Total Revenues & Other Sources $272,769 $665,156 $691,534 $691,534 $26,378 4.0%
Expenditures
HOME Grant Administration:
Housing & Community Development 55,566 66,516 69,153 69,153 2,637 4.0%
Other General Administration 0 0 0 0 0 ‐‐
HOME Grant Programs 205,844 598,640 622,381 622,381 23,741 4.0%
Total Expenditures $261,410 $665,156 $691,534 $691,534 $26,378 4.0%
Excess of Revenues over Expenditures $11,359 $0 $0 $0
Changes in Fund Balance
FY20 FY21 FY22
Actual Budget Approved
Fund Balance ‐ Beginning $56,680 $68,039 $68,039
Excess Revenue over Expenditures $11,359
Fund Balance ‐ Ending $68,039 $68,039 $68,039
Restricted Fund Balance $68,039 $68,039
Special Revenue Funds
FY20 Budget E-12

Grants Special Revenue Fund
FY20 FY21 FY22 FY22
Actual Budget Requested Approved $▲ %▲Revenues
Intergovernmental 6,714,813 278,749 281,413 281,413 2,664 1.0%
Other Revenues 68,826 24,206 23,832 23,832 (374) ‐1.5%
Total Revenues $6,783,639 $302,955 $305,245 $305,245 2,290 0.8%
Other Financing Sources/Transfers In 209,570 144,821 145,076 145,076 255 0.2%
Prior Year Fund Balance 0 ‐‐
Total Revenues & Other Sources $6,993,209 $447,776 $450,321 $450,321 $2,545 0.6%
Expenditures
Manager's Office 8,939 0 0 0 0 ‐‐
Other General Administration 97,900 27,100 27,100 27,100 0 0.0%
Superior Court 381,986 0 0 0 0 ‐‐
Clerk of Courts 16,498 0 0 0 0 ‐‐
State Court 94,616 0 0 0 0 ‐‐
Solicitor General's Office 115,680 0 0 0 0 ‐‐
Sheriff's Office 47,898 0 0 0 0 ‐‐
Juvenile Court 193,596 0 0 0 0 ‐‐
Police 992,487 84,060 84,060 84,060 0 0.0%
Fire 19,965 0 0 0 0 ‐‐
Corrections 4,321 0 0 0 0 ‐‐
Transit 71,999 94,552 100,841 100,841 6,289 6.7%
Animal Services 4,952 0 0 0 0 ‐‐
Leisure Services 9,719 0 0 0 0 ‐‐
Planning 206,218 242,064 238,320 238,320 (3,744) ‐1.5%
Total Operating Expenditures $2,266,774 $447,776 $450,321 $450,321 $2,545 0.6%
Capital Expenditures 4,856,142 0 0 0 0 ‐‐
Total Operating & Capital Expenses $7,122,916 $447,776 $450,321 $450,321 $2,545 0.6%
Excess of Revenues over Expenditures ($129,707) $0 $0 $0
Changes in Fund Balance
FY20 FY21 FY22
Actual Budget Approved
Fund Balance ‐ Beginning $1,778,032 $1,648,325 $1,648,325
Excess Revenue over Expenditures ($129,707)
Fund Balance ‐ Ending $1,648,325 $1,648,325 $1,648,325
Nonspendable $157,082 $157,082 $157,082
Restricted Fund Balance $1,978,311 $1,978,311 $1,978,311
Unassigned Fund Balance ($487,068) ($487,068) ($487,068)
Special Revenue Funds
FY22 Budget E-13

Alternative Dispute Resolution Fund
FY20 FY21 FY22 FY22
Actual Budget Requested Approved $▲ %▲Revenues
Charges for Services 189,458 215,195 217,228 217,228 2,033 0.9%
Expenditures
Superior Court 155,002 199,501 201,210 201,210 1,709 0.9%
Other General Administration 17,456 15,694 16,018 16,018 324 2.1%
Total Expenditures $172,458 $215,195 $217,228 $217,228 $2,033 0.9%
Excess of Revenues over Expenditures $17,000 $0 $0 $0
Changes in Fund Balance
FY20 FY21 FY22
Actual Budget Approved
Fund Balance ‐ Beginning $79,300 $96,300 $96,300
Excess Revenue over Expenditures $17,000
Fund Balance ‐ Ending $96,300 $96,300 $96,300
Unassigned Fund Balance $96,300 $96,300
Special Revenue Funds
FY20 Budget E-14

Affordable Housing Fund
FY20 FY21 FY22 FY22
Actual Budget Requested Approved $▲ %▲Revenues
Intergovernmental 167,217 135,000 175,000 175,000 40,000 29.6%
Other Revenue 3,399 0 0 0 0 ‐‐
Total Revenues $170,616 $135,000 $175,000 $175,000 40,000 29.6%
Other Financing Sources/Transfers In 0 0 0 0 0 ‐‐
Prior Year Fund Balance 26,987 0 38,487 11,500 42.6%
Total Revenues & Other Sources $170,616 $161,987 $175,000 $213,487 $51,500 31.8%
Expenditures
Housing & Community Development 0 0 0 120,000 120,000 ‐‐
Building Inspection 54,454 56,787 58,287 58,287 1,500 2.6%
Other General Administration 5,200 105,200 116,713 35,200 (70,000) ‐66.5%
Total Expenditures $59,654 $161,987 $175,000 $213,487 $51,500 31.8%
Excess of Revenues over Expenditures $110,962 $0 $0 $0
Changes in Fund Balance
FY20 FY21 FY22
Actual Budget Approved
Fund Balance ‐ Beginning $251,229 $362,191 $335,204
Excess Revenue over Expenditures $110,962 $0 $0
Budgeted Use of Fund Balance (26,987) (38,487)
Fund Balance ‐ Ending $362,191 $335,204 $296,717
Special Revenue Funds
FY22 Budget E-15

Supportive Housing Grant Fund
FY20 FY21 FY22 FY22
Actual Budget Requested Approved $▲ %▲Revenues
Intergovernmental 256,091 322,943 322,943 322,943 0 0.0%
Total Revenues & Other Sources $256,091 $322,943 $322,943 $322,943 $0 0.0%
Expenditures
Housing & Community Development 256,091 322,943 322,943 322,943 0 0.0%
Total Expenditures $256,091 $322,943 $322,943 $322,943 $0 0.0%
Excess of Revenues over Expenditures $0 $0 $0 $0
Changes in Fund Balance
FY20 FY21 FY22
Actual Budget Approved
Fund Balance ‐ Beginning $0 $0 $0
Excess Revenue over Expenditures $0
Fund Balance ‐ Ending $0 $0 $0
Special Revenue Funds
FY20 Budget E-16

Special Programs Fund
FY20 FY21 FY22 FY22
Actual Budget Requested Approved $▲ %▲Revenues
Intergovernmental 681,726 713,358 738,432 738,432 25,074 3.5%
Charges for Services 189,173 111,100 0 65,100 (46,000) ‐41.4%
Fines & Forfeitures 361,964 326,500 259,750 259,750 (66,750) ‐20.4%
Other Revenues 163,875 35,000 35,000 35,000 0 0
Total Revenues $1,396,738 $1,185,958 $1,033,182 $1,098,282 ($87,676) ‐7.4%
Other Financing Sources/Transfers In 440,450 320,281 371,183 821,183 500,902 156.4%
Prior Year Fund Balance 170,888 0 169,025 (1,863) ‐1.1%
Total Revenues & Other Sources $1,837,188 $1,677,127 $1,404,365 $2,088,490 $411,363 24.5%
Expenditures
Manager's Office 10,013 0 0 0 0 ‐‐
Human Resources 92,158 25,000 25,000 25,000 0 0.0%
Information Technology 104,741 0 0 0 0 ‐‐
Other General Administration 84,200 103,667 93,691 493,691 390,024 376.2%
Superior Court 85,181 123,430 124,285 124,285 855 0.7%
State Court 166,872 253,771 183 244,515 (9,256) ‐3.6%
Solicitor General's Office 81,192 83,442 85,203 85,203 1,761 2.1%
District Attorney's Office 795,075 818,867 846,546 846,546 27,679 3.4%
Sheriff's Office 25,640 0 0 0 0 ‐‐
Police 465,339 148,250 148,250 148,250 0 0.0%
Leisure Services 3,380 35,000 35,000 35,000 0 0.0%
HCD 38,851 0 0 0 0 ‐‐
Economic Development 0 59,700 60,000 60,000 300 0.5%
Independent Agencies 26,000 26,000 26,000 26,000 0 0.0%
Total Operating Expenditures $1,978,642 $1,677,127 $1,444,158 $2,088,490 $411,363 24.5%
Capital Expenditures 82,616 0 0 0 0 ‐‐
Other Financing Uses/Transfers Out 0 0 0 0 0 ‐‐
Total Expenditures $2,061,258 $1,677,127 $1,444,158 $2,088,490 $0 ‐‐
Excess of Revenues over Expenditures ($224,070) $0 ($39,793) $0
Changes in Fund Balance
FY20 FY21 FY22
Actual Budget Approved
Fund Balance ‐ Beginning $3,129,000 $2,904,930 $2,904,930
Excess Revenue over Expenditures ($224,070) $0
Budgeted Use of Fund Balance (169,025)
Fund Balance ‐ Ending $2,904,930 $2,904,930 $2,735,905
Restricted Fund Balance $529,586 $529,586 $529,586
Committed to Existing Programs $1,798,400 $1,798,400 $1,629,375
Assigned/Available Fund Balance $576,944 $576,944 $576,944
Special Revenue Funds
FY22 Budget E-17

Building Inspection Fund
FY20 FY21 FY22 FY22
Actual Budget Requested Approved $▲ %▲Revenues
Licenses & Permits 1,778,347 1,300,000 1,637,202 1,637,202 337,202 25.9%
Other Revenues 35,666 0 0 0 0 ‐‐
Total Revenues $1,814,013 $1,300,000 $1,637,202 $1,637,202 $337,202 25.9%
Prior Year Fund Balance 0 264,114 0 0 (264,114) ‐100.0%
Total Revenues & Other Sources $1,814,013 $1,564,114 $1,637,202 $1,637,202 $73,088 4.7%
Expenditures
Building Inspection 882,617 1,101,059 1,233,715 1,233,715 132,656 12.0%
Planning & Zoning 151,286 151,458 142,853 142,853 (8,605) ‐5.7%
Other General Administration 224,062 244,759 258,075 258,075 13,316 5.4%
Total Expenditures $1,257,965 $1,497,276 $1,634,643 $1,634,643 $137,367 9.2%
Capital Funding 15,000 0 0 0 0 ‐‐
Total Operating & Capital Expenditures $1,272,965 $1,497,276 $1,634,643 $1,634,643 $137,367 9.2%
Excess of Revenues over Expenditures $541,048 $66,838 $2,559 $2,559
Changes in Fund Balance
FY20 FY21 FY22
Actual Budget Approved
Fund Balance ‐ Beginning $2,084,986 $2,626,034 $2,428,758
Excess Revenue over Expenditures $541,048 $66,838 $2,559
Budgeted Use of Fund Balance (264,114)
Fund Balance ‐ Ending $2,626,034 $2,428,758 $2,431,317
Committed/Available for Building Insp. $2,626,034 $2,431,317
Special Revenue Funds
FY20 Budget E-18
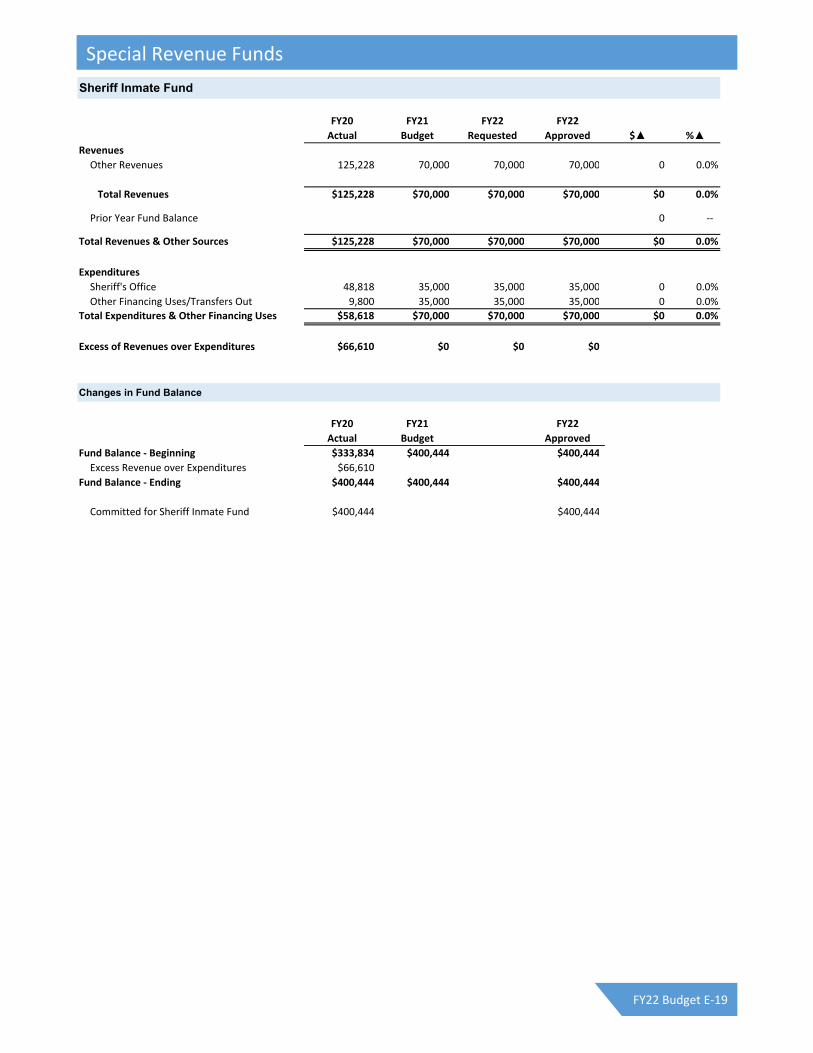
Sheriff Inmate Fund
FY20 FY21 FY22 FY22
Actual Budget Requested Approved $▲ %▲Revenues
Other Revenues 125,228 70,000 70,000 70,000 0 0.0%
Total Revenues $125,228 $70,000 $70,000 $70,000 $0 0.0%
Prior Year Fund Balance 0 ‐‐
Total Revenues & Other Sources $125,228 $70,000 $70,000 $70,000 $0 0.0%
Expenditures
Sheriff's Office 48,818 35,000 35,000 35,000 0 0.0%
Other Financing Uses/Transfers Out 9,800 35,000 35,000 35,000 0 0.0%
Total Expenditures & Other Financing Uses $58,618 $70,000 $70,000 $70,000 $0 0.0%
Excess of Revenues over Expenditures $66,610 $0 $0 $0
Changes in Fund Balance
FY20 FY21 FY22
Actual Budget Approved
Fund Balance ‐ Beginning $333,834 $400,444 $400,444
Excess Revenue over Expenditures $66,610
Fund Balance ‐ Ending $400,444 $400,444 $400,444
Committed for Sheriff Inmate Fund $400,444 $400,444
Special Revenue Funds
FY22 Budget E-19

Corrections Inmate Fund
FY20 FY21 FY22 FY22
Actual Budget Requested Approved $▲ %▲Revenues
Other Revenues 50,106 50,000 50,000 50,000 0 0.0%
Total Revenues & Other Sources $50,106 $50,000 $50,000 $50,000 $0 0.0%
Expenditures
Sheriff's Office 51,949 50,000 50,000 50,000 0 0.0%
Total Expenditures & Other Financing Uses $51,949 $50,000 $50,000 $50,000 $0 0.0%
Excess of Revenues over Expenditures ($1,843) $0 $0 $0
Changes in Fund Balance
FY20 FY21 FY22
Actual Budget Approved
Fund Balance ‐ Beginning $192,895 $191,052 $191,052
Excess Revenue over Expenditures ($1,843)
Fund Balance ‐ Ending $191,052 $191,052 $191,052
Committed for Sheriff Inmate Fund $191,052 $191,052
Special Revenue Funds
FY20 Budget E-20

American Rescue Plan - CSLFRF
FY20 FY21 FY22 FY22
Actual Budget Requested Approved $▲ %▲Revenues
Other Revenues 0 0 0 0 0 ‐‐
Total Revenues $0 $0 $0 $0 $0 ‐‐
Prior Year Fund Balance 0 0 0 2,220,880 2,220,880 ‐‐
Total Revenues & Other Sources $0 $0 $0 $2,220,880 $2,220,880 ‐‐
Expenditures
Other General Administration 0 0 0 496,750 496,750 ‐‐
Solid Waste 0 0 0 36,000 36,000 ‐‐
Leisure Services 0 0 0 650,000 650,000 ‐‐
Housing & Community Development 0 0 0 750,000 750,000 ‐‐
Economic Development 0 0 0 288,130 288,130 ‐‐
Total Expenditures & Other Financing Uses $0 $0 $0 $2,220,880 $2,220,880 ‐‐
Excess of Revenues over Expenditures $0 $0 $0 $0
Changes in Fund Balance
FY20 FY21 FY22
Actual Budget Approved
Fund Balance ‐ Beginning $0 $0 $28,794,421
Excess Revenue over Expenditures $0
Anticipated Proceeds $28,794,421
Budgeted Use of Fund Balance (2,220,880)
Fund Balance ‐ Ending $0 $28,794,421 $26,573,541
Restricted for American Rescue Plan Fund $0 $26,573,541
Special Revenue Funds
FY22 Budget E-21

Mall Area Tax Allocation District
FY20 FY21 FY22 FY22
Actual Budget Requested Approved $▲ %▲Revenues
Taxes 0 0 22,000 22,000 22,000 ‐‐
Total Revenues & Other Sources $0 $0 $22,000 $22,000 $22,000 ‐‐
Expenditures
Economic Development 0 0 4,676 4,676 4,676 ‐‐
Other General Administration 0 0 17,324 17,324 17,324 ‐‐
Total Expenditures & Other Financing Uses $0 $0 $22,000 $22,000 $22,000 ‐‐
Excess of Revenues over Expenditures $0 $0 $0 $0
Changes in Fund Balance
FY20 FY21 FY22
Actual Budget Approved
Fund Balance ‐ Beginning $0 $0 $0
Excess Revenue over Expenditures $0
Budgeted Use of Fund Balance
Fund Balance ‐ Ending $0 $0 $0
Committed for Mall Area TAD Fund $0 $0
Special Revenue Funds
FY20 Budget E-22

West Broad/Hawthorne Tax Allocation District
FY20 FY21 FY22 FY22
Actual Budget Requested Approved $▲ %▲Revenues
Taxes 0 0 118,000 118,000 118,000 ‐‐
Total Revenues & Other Sources $0 $0 $118,000 $118,000 $118,000 ‐‐
Expenditures
Economic Development 0 0 25,081 25,081 25,081 ‐‐
Other General Administration 0 0 92,919 92,919 92,919 ‐‐
Total Expenditures & Other Financing Uses $0 $0 $118,000 $118,000 $118,000 ‐‐
Excess of Revenues over Expenditures $0 $0 $0 $0
Changes in Fund Balance
FY20 FY21 FY22
Actual Budget Approved
Fund Balance ‐ Beginning $0 $0 $0
Excess Revenue over Expenditures $0
Budgeted Use of Fund Balance
Fund Balance ‐ Ending $0 $0 $0
Committed for W Broad/Hawthorne TAD $0 $0
Special Revenue Funds
FY22 Budget E-23

Newton Bridge Tax Allocation District
FY20 FY21 FY22 FY22
Actual Budget Requested Approved $▲ %▲Revenues
Taxes 0 0 73,000 73,000 73,000 ‐‐
Total Revenues & Other Sources $0 $0 $73,000 $73,000 $73,000 ‐‐
Expenditures
Economic Development 0 0 15,516 15,516 15,516 ‐‐
Other General Administration 0 0 57,484 57,484 57,484 ‐‐
Total Expenditures & Other Financing Uses $0 $0 $73,000 $73,000 $73,000 ‐‐
Excess of Revenues over Expenditures $0 $0 $0 $0
Changes in Fund Balance
FY20 FY21 FY22
Actual Budget Approved
Fund Balance ‐ Beginning $0 $0 $0
Excess Revenue over Expenditures $0
Budgeted Use of Fund Balance
Fund Balance ‐ Ending $0 $0 $0
Committed for Newton Bridge TAD $0 $0
Special Revenue Funds
FY20 Budget E-24

East Downtown Tax Allocation District
FY20 FY21 FY22 FY22
Actual Budget Requested Approved $▲ %▲Revenues
Taxes 0 0 49,000 49,000 49,000 ‐‐
Total Revenues & Other Sources $0 $0 $49,000 $49,000 $49,000 ‐‐
Expenditures
Economic Development 0 0 10,415 10,415 10,415 ‐‐
Other General Administration 0 0 38,585 38,585 38,585 ‐‐
Total Expenditures & Other Financing Uses $0 $0 $49,000 $49,000 $49,000 ‐‐
Excess of Revenues over Expenditures $0 $0 $0 $0
Changes in Fund Balance
FY20 FY21 FY22
Actual Budget Approved
Fund Balance ‐ Beginning $0 $0 $0
Excess Revenue over Expenditures $0
Budgeted Use of Fund Balance
Fund Balance ‐ Ending $0 $0 $0
Committed for East Downtown TAD $0 $0
Special Revenue Funds
FY22 Budget E-25

North Avenue Tax Allocation District
FY20 FY21 FY22 FY22
Actual Budget Requested Approved $▲ %▲Revenues
Taxes 0 0 30,000 30,000 30,000 ‐‐
Total Revenues & Other Sources $0 $0 $30,000 $30,000 $30,000 ‐‐
Expenditures
Economic Development 0 0 6,377 6,377 6,377 ‐‐
Other General Administration 0 0 23,623 23,623 23,623 ‐‐
Total Expenditures & Other Financing Uses $0 $0 $30,000 $30,000 $30,000 ‐‐
Excess of Revenues over Expenditures $0 $0 $0 $0
Changes in Fund Balance
FY20 FY21 FY22
Actual Budget Approved
Fund Balance ‐ Beginning $0 $0 $0
Excess Revenue over Expenditures $0
Budgeted Use of Fund Balance
Fund Balance ‐ Ending $0 $0 $0
Committed for North Avenue TAD $0 $0
Special Revenue Funds
FY20 Budget E-26

Lexington Road Tax Allocation District
FY20 FY21 FY22 FY22
Actual Budget Requested Approved $▲ %▲Revenues
Taxes 0 0 202,000 202,000 202,000 ‐‐
Total Revenues & Other Sources $0 $0 $202,000 $202,000 $202,000 ‐‐
Expenditures
Economic Development 0 0 42,935 42,935 42,935 ‐‐
Other General Administration 0 0 159,065 159,065 159,065 ‐‐
Total Expenditures & Other Financing Uses $0 $0 $202,000 $202,000 $202,000 ‐‐
Excess of Revenues over Expenditures $0 $0 $0 $0
Changes in Fund Balance
FY20 FY21 FY22
Actual Budget Approved
Fund Balance ‐ Beginning $0 $0 $0
Excess Revenue over Expenditures $0
Budgeted Use of Fund Balance
Fund Balance ‐ Ending $0 $0 $0
Committed for Lexington Road TAD $0 $0
Special Revenue Funds
FY22 Budget E-27
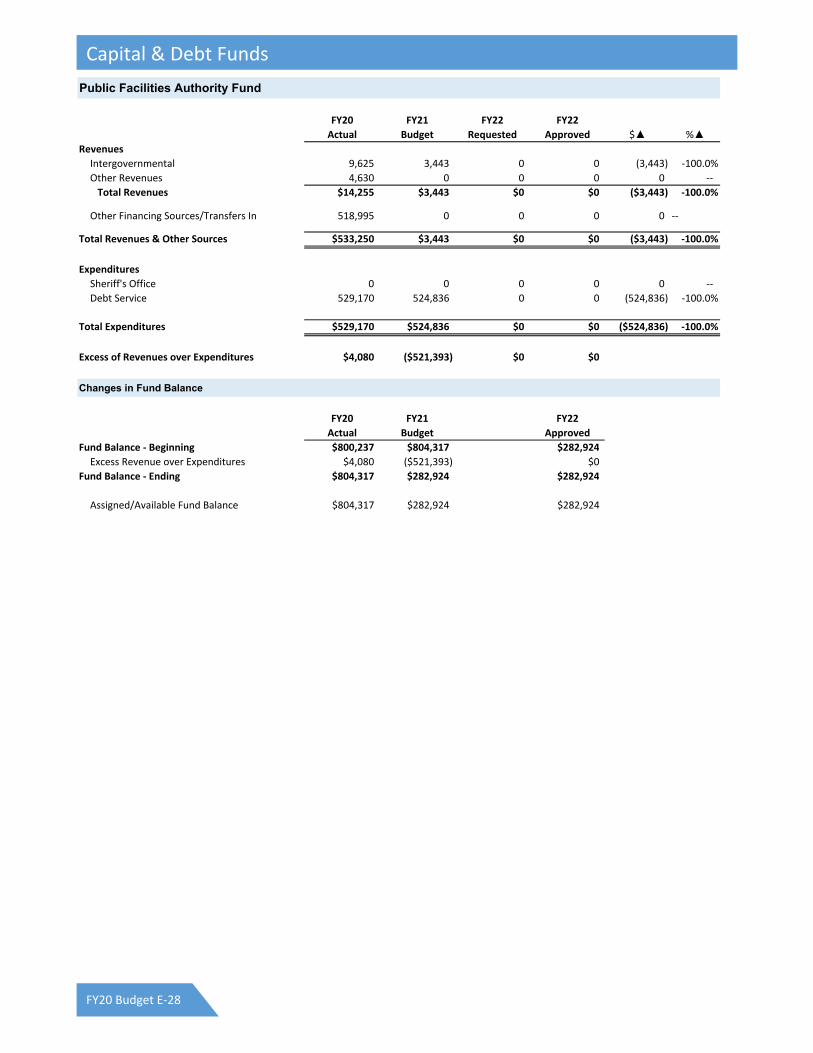
Public Facilities Authority Fund
FY20 FY21 FY22 FY22
Actual Budget Requested Approved $▲ %▲Revenues
Intergovernmental 9,625 3,443 0 0 (3,443) ‐100.0%
Other Revenues 4,630 0 0 0 0 ‐‐
Total Revenues $14,255 $3,443 $0 $0 ($3,443) ‐100.0%
Other Financing Sources/Transfers In 518,995 0 0 0 0 ‐‐
Total Revenues & Other Sources $533,250 $3,443 $0 $0 ($3,443) ‐100.0%
Expenditures
Sheriff's Office 0 0 0 0 0 ‐‐
Debt Service 529,170 524,836 0 0 (524,836) ‐100.0%
Total Expenditures $529,170 $524,836 $0 $0 ($524,836) ‐100.0%
Excess of Revenues over Expenditures $4,080 ($521,393) $0 $0
Changes in Fund Balance
FY20 FY21 FY22
Actual Budget Approved
Fund Balance ‐ Beginning $800,237 $804,317 $282,924
Excess Revenue over Expenditures $4,080 ($521,393) $0
Fund Balance ‐ Ending $804,317 $282,924 $282,924
Assigned/Available Fund Balance $804,317 $282,924 $282,924
Capital & Debt Funds
FY20 Budget E-28

Economic Development Capital Projects Fund
FY20 FY21 FY22 FY22
Actual Budget Requested Approved $▲ %▲Revenues
Other Revenues 8,767 0 0 0 0 ‐‐
Total Revenues $8,767 $0 $0 $0 $0 ‐‐
Other Financing Sources/Transfers In 200,000 225,000 225,000 0 (225,000) ‐100.0%
Total Revenues & Other Sources $208,767 $225,000 $225,000 $0 ($225,000) ‐100.0%
Expenditures
Economic Development Capital Program 20,470 225,000 225,000 0 (225,000) ‐100.0%
Total Expenditures $20,470 $225,000 $225,000 $0 ($225,000) ‐100.0%
Excess of Revenues over Expenditures $188,297 $0 $0 $0
Changes in Fund Balance
FY20 FY21 FY22
Actual Budget Approved
Fund Balance ‐ Beginning $707,449 $895,746 $895,746
Excess Revenue over Expenditures $188,297
Fund Balance ‐ Ending $895,746 $895,746 $895,746
Committed to Capital Projects $837,630 $837,630 $837,630
Assigned/Available Fund Balance $58,116 $58,116 $58,116
Capital & Debt Funds
FY22 Budget E-29

General Capital Project Fund
FY20 FY21 FY22 FY22
Actual Budget Requested Approved $▲ %▲Revenues
Other Taxes 8,453 0 0 0 0 ‐‐
Other Revenues 108,279 0 0 0 0 ‐‐
Total Revenues $116,732 $0 $0 $0 $0 ‐‐
Other Financing Sources/Transfers In 3,822,384 2,287,000 42,998,582 5,651,000 3,364,000 147.1%
Prior Year Fund Balance 0 94,200 0 0 (94,200) ‐100.0%
Total Revenues & Other Sources $3,939,116 $2,381,200 $42,998,582 $5,651,000 $3,269,800 137.3%
Expenditures
Manager's Office 42,497 150,000 549,600 321,600 171,600 114.4%
Human Resources 0 36,000 0 0 (36,000) ‐100.0%
Board of Elections 0 20,000 0 0 (20,000) ‐100.0%
Information Technology 840,177 350,000 415,000 400,000 50,000 14.3%
Other General Administration 12,352 0 225,000 100,000 100,000 ‐‐
Clerk of Courts 14,378 0 346,500 0 0 ‐‐
District Attorney's Office 33,572 0 0 0 0 ‐‐
Sheriff's Office 48,569 30,000 244,000 76,000 46,000 153.3%
Police 157,383 708,200 1,608,144 935,144 226,944 32.0%
Fire 352,727 50,000 20,577,100 75,000 25,000 50.0%
Corrections 0 20,000 650,160 30,000 10,000 50.0%
Airport 42,832 25,000 86,500 86,500 61,500 246.0%
Transit 0 0 80,000 80,000 80,000 ‐‐
Transportation & Public Works 854,643 560,000 2,235,000 1,089,000 529,000 94.5%
Solid Waste 0 0 640,000 125,000 125,000 ‐‐
Central Services 983,026 300,000 8,109,104 1,782,756 1,482,756 494.3%
Leisure Services 135,216 132,000 7,232,474 550,000 418,000 316.7%
Planning 6,363 0 0 0 0 ‐‐
Other Financing Uses 1,342 0 0 0 0 ‐‐
Total Expenditures & Other Financing Uses $3,525,077 $2,381,200 $42,998,582 $5,651,000 $3,269,800 137.3%
Excess of Revenues over Expenditures $414,039 $0 $0 $0
Changes in Fund Balance
FY20 FY21 FY22
Actual Budget Approved
Fund Balance ‐ Beginning $7,610,948 $8,024,987 $7,930,787
Excess Revenue over Expenditures $414,039 $0
Budgeted Use of Fund Balance (94,200) 0
Fund Balance ‐ Ending $8,024,987 $7,930,787 $7,930,787
Nonspendable $0 $0 $0
Committed to Capital Projects $7,930,787 $7,930,787 $7,930,787
Assigned/Available Fund Balance $94,200 $0 $0
FY22 Budget by Department
Police
Transportation & Public Works
Information Technology
Central Services
Manager's Office
Leisure Services
All Others
Capital & Debt Funds
FY20 Budget E-30
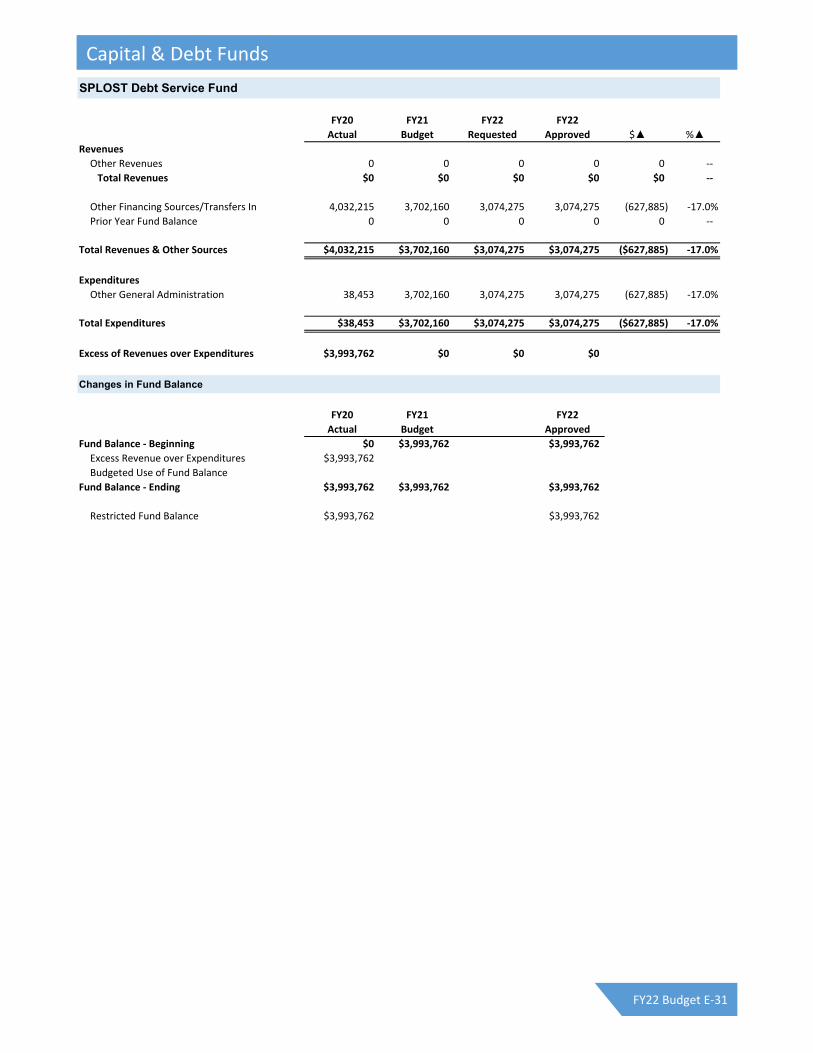
SPLOST Debt Service Fund
FY20 FY21 FY22 FY22
Actual Budget Requested Approved $▲ %▲Revenues
Other Revenues 0 0 0 0 0 ‐‐
Total Revenues $0 $0 $0 $0 $0 ‐‐
Other Financing Sources/Transfers In 4,032,215 3,702,160 3,074,275 3,074,275 (627,885) ‐17.0%
Prior Year Fund Balance 0 0 0 0 0 ‐‐
Total Revenues & Other Sources $4,032,215 $3,702,160 $3,074,275 $3,074,275 ($627,885) ‐17.0%
Expenditures
Other General Administration 38,453 3,702,160 3,074,275 3,074,275 (627,885) ‐17.0%
Total Expenditures $38,453 $3,702,160 $3,074,275 $3,074,275 ($627,885) ‐17.0%
Excess of Revenues over Expenditures $3,993,762 $0 $0 $0
Changes in Fund Balance
FY20 FY21 FY22
Actual Budget Approved
Fund Balance ‐ Beginning $0 $3,993,762 $3,993,762
Excess Revenue over Expenditures $3,993,762
Budgeted Use of Fund Balance
Fund Balance ‐ Ending $3,993,762 $3,993,762 $3,993,762
Restricted Fund Balance $3,993,762 $3,993,762
Capital & Debt Funds
FY22 Budget E-31

Airport Fund
FY20 FY21 FY22 FY22
Actual Budget Requested Approved $▲ %▲Revenues
Charges for Services
Fuel 2,000,981 2,487,729 2,404,166 2,404,166 (83,563) ‐3.4%
Leases 434,702 529,542 550,450 550,450 20,908 3.9%
Airport Fees 198,452 124,900 202,200 202,200 77,300 61.9%
Other Charges for Services 3,958 5,600 5,200 5,200 (400) ‐7.1%
Other Revenues 38,326 0 0 0 0 ‐‐
Total Operating Revenues $2,676,419 $3,147,771 $3,162,016 $3,162,016 $14,245 0.5%
Other Financing Sources/Transfers In 139,218 0 0 0 0 ‐‐
Total Revenues & Other Sources $2,815,637 $3,147,771 $3,162,016 $3,162,016 $14,245 0.5%
Expenses
Personal Services 655,533 644,603 626,682 626,682 (17,921) ‐2.8%
Operating 548,160 648,844 670,832 670,832 21,988 3.4%
Fuel Expenses 1,237,183 1,621,692 1,517,064 1,517,064 (104,628) ‐6.5%
Depreciation 226,965 229,400 229,400 229,400 0 0.0%
Debt Service (Interest) 18,056 15,105 13,553 13,553 (1,552) ‐10.3%
Total Expenses $2,685,897 $3,159,644 $3,057,531 $3,057,531 ($102,113) ($0)
Other Financing Uses/Transfers Out 74,590 69,359 66,721 66,721 (2,638) ‐3.8%
Total Expenses & Other Financing Uses $2,760,487 $3,229,003 $3,124,252 $3,124,252 ($104,751) ‐3.2%
Capital Funding $33,941 0 0 0
Net Operating Income/(Loss) Incl. Capital $21,209 ($81,232) $37,764 $37,764
Changes in Unrestricted Net Position
FY20 FY21 FY22
Actual Budget Approved
Beginning Unrestricted Net Position $643,450 $800,338 $852,878
Net Income/(Loss) $21,209 ($81,232) $37,764
Other Changes to Unrestricted Net Position:
Less Debt Service Principal Payments ($91,286) ($95,628) ($94,690)
Plus Depreciation $226,965 $229,400 $229,400
Ending Unrestricted Net Position $800,338 $852,878 $1,025,352
Less:
Approved Capital from prior years ($60,301) ($60,301) ($60,301)
Operating Reserve (3 months) ($381,000) ($402,000) ($402,000)
Available Unrestricted Net Position $359,037 $390,577 $563,051
Enterprise Funds
FY20 Budget E-32

Landfill Fund
FY20 FY21 FY22 FY22
Actual Budget Requested Approved $▲ %▲Revenues
Charges for Services 4,081,344 4,320,230 4,276,730 4,276,730 (43,500) ‐1.0%
Other Revenues 174,859 0 4,000 4,000 4,000 ‐‐
Total Revenues & Other Sources $4,551,566 $4,320,230 $4,280,730 $4,280,730 ($39,500) ‐0.9%
Expenses
Solid Waste
Recycling 1,161,706 1,070,380 793,624 1,092,555 22,175 2.1%
Landfill 1,389,761 1,600,514 1,689,002 1,689,002 88,488 5.5%
Closure/Post‐Closure 334,872 120,000 120,000 120,000 0 0.0%
Other General Administration 988,247 1,063,145 1,142,760 1,142,760 79,615 7.5%
Debt Service (Interest) 131,727 104,256 104,256 104,256 0 0.0%
Total Expenses $4,006,313 $3,958,295 $3,849,642 $4,148,573 $190,278 $0
Other Financing Uses/Transfers Out 331,277 312,069 324,268 324,268 12,199 3.9%
Total Expenses & Other Financing Uses $4,337,590 $4,270,364 $4,173,910 $4,472,841 $202,477 4.7%
Capital Funding 1,837,327 728,000 1,538,000 1,538,000
Net Operating Income/(Loss) Incl. Capital ($1,623,351) ($678,134) ($1,431,180) ($1,730,111)
Changes in Unrestricted Net Position
FY20 FY21 FY22
Actual Budget Approved
Beginning Unrestricted Net Position $6,129,341 $3,233,650 $2,544,862
Net Income/(Loss) ($1,623,351) ($678,134) ($1,730,111)
Other Changes to Unrestricted Net Position:
Less Debt Service Principal Payments ($1,837,327) ($603,194) ($595,750)
Plus Depreciation $564,987 $592,540 $592,540
Ending Unrestricted Net Position $3,233,650 $2,544,862 $811,541
Less:
Approved Capital from prior years ($1,591,384) ($815,048) ($815,048)
Operating Reserve (3 months) ($943,000) ($919,000) ($970,000)
Available Unrestricted Net Position $699,266 $810,814 ($973,507)
Enterprise Funds
FY22 Budget E-33

Transit Fund
FY20 FY21 FY22 FY22
Actual Budget Requested Approved $▲ %▲Revenues
Intergovernmental1 3,990,324 4,973,088 3,886,414 3,886,414 (1,086,674) ‐21.9%
Charges for Services
Regular Farebox 266,400 496,000 0 0 (496,000) ‐100.0%
UGA Farebox 459,587 391,354 0 0 (391,354) ‐100.0%
Other Charges for Services 49,557 65,000 65,000 65,000 0 0.0%
Other Revenues 47,558 10,000 10,000 10,000 0 0.0%
Total Operating Revenues $4,813,426 $5,935,442 $3,961,414 $3,961,414 ($1,974,028) ‐33.3%
Other Financing Sources/Transfers In 3,648,923 0 3,305,248 0 0 ‐‐
Total Revenues & Other Sources $8,462,349 $5,935,442 $7,266,662 $3,961,414 ($1,974,028) ‐33.3%
Expenses
Transit Department:
Administration 493,171 584,464 616,915 616,915 32,451 5.6%
Transit Operations 3,752,577 4,164,562 3,989,355 3,989,355 (175,207) ‐4.2%
Demand Response 258,622 355,391 316,527 316,527 (38,864) ‐10.9%
Transit Maintenance 967,796 1,062,014 1,086,209 1,086,209 24,195 2.3%
Other General Administration 3,735,867 4,868,092 4,971,368 4,971,368 103,276 2.1%
Total Expenses $9,208,033 $11,034,523 $10,980,374 $10,980,374 ($54,149) ‐0.5%
Other Financing Uses/Transfers Out 676,142 705,992 699,843 699,843 (6,149) ‐0.9%
Total Expenses & Other Financing Uses $9,884,175 $11,740,515 $11,680,217 $11,680,217 ($60,298) ‐0.5%
Net Operating Income/(Loss) Incl. Capital ($1,421,826) ($5,805,073) ($4,413,555) ($7,718,803) ($1,913,730) 33.0%
Changes in Unrestricted Net Position
FY20 FY21 FY22
Actual Budget Approved
Beginning Unrestricted Net Position $1,238,590 $3,139,336 $1,736,863
Net Income/(Loss) ($1,421,826) ($5,805,073) ($7,718,803)
Other Changes to Unrestricted Net Position:
Plus Depreciation $3,322,572 $4,402,600 $4,402,600
Ending Unrestricted Net Position $3,139,336 $1,736,863 ($1,579,340)
Less:
Operating Reserve (3 months) ($1,640,000) ($1,834,000) ($1,819,000)
Available Unrestricted Net Position $1,499,336 ($97,137) ($3,398,340)
(1) Additional Funds for Transit operations have been approved by the Federal government as part of the American Rescue Plan.
However, final grant amounts for Transit were not known at the time of budget adoption. The budget will be amended once
final grant awards are issued.
FY22 Revenues
Intergovernmental: 98.1%
Transfers In: 0.0%
UGA Farebox: 0.0%
Regular Farebox: 0.0%
Other Charges for Services: 1.6%
Other Revenues: 0.3%
Enterprise Funds
FY20 Budget E-34

Water & Sewer Fund
Revenues & Expenditures by Type
FY20 FY21 FY22 FY22
Actual Budget Requested Approved $▲ %▲Revenues
Charges for Services 59,810,940 53,464,412 56,019,291 56,019,291 2,554,879 4.8%
Other Revenues 2,062,368 100,000 950,000 950,000 850,000 850.0%
Total Operating Revenues $61,873,308 $53,564,412 $56,969,291 $56,969,291 $3,404,879 6.4%
Other Financing Sources/Transfers In 1,911,918 0 0 0 0 ‐‐
Total Revenues & Other Sources $63,785,226 $53,564,412 $56,969,291 $56,969,291 $3,404,879 6.4%
Operating Expenses by Type
Personal Services 9,913,773 10,675,574 10,866,201 10,867,701 192,127 1.8%
Operating Expenses 10,192,055 12,997,395 13,316,593 13,315,093 317,698 2.4%
Depreciation 13,896,963 13,229,000 13,229,000 13,229,000 0 0.0%
Debt Service (Interest) 9,445,566 9,075,556 9,075,556 9,075,556 0 0.0%
Other Expenses 0 3,000 3,000 3,000 0 0.0%
Total Expenses $43,448,357 $45,980,525 $46,490,350 $46,490,350 $509,825 1.1%
Other Financing Uses/Transfers Out 1,733,577 1,813,405 1,787,108 1,787,108 (26,297) ‐1.5%
Total Expenses & Other Financing Uses $45,181,934 $47,793,930 $48,277,458 $48,277,458 $483,528 1.0%
Capital Funding 12,953,971 36,457,400 34,058,064 33,960,000 (2,497,400) ‐6.9%
Net Operating Income/(Loss) Incl. Capital $5,649,321 ($30,686,918) ($25,366,231) ($25,268,167) $5,418,751 ‐17.7%
Changes in Unrestricted Net Position
FY20 FY21 FY22
Actual Budget Approved
Beginning Unrestricted Net Position $106,578,924 $118,022,010 $93,034,614
Net Income/(Loss) 5,649,321 (30,686,918) (25,268,167)
Other Changes to Unrestricted Net Position:
Less Debt Service Principal Payments (8,103,198) (7,529,478) (7,898,205)
Plus Depreciation 13,896,963 13,229,000 13,229,000
Ending Unrestricted Net Position $118,022,010 $93,034,614 $73,097,242
Less:
Approved Capital from prior years (74,115,505) (74,115,505) (74,115,505)
Operating Reserve (3 months) (5,460,000) (6,372,000) (6,493,000)
Available Unrestricted Net Position $38,446,505 $12,547,109 ($7,511,263)
Enterprise Funds
FY22 Budget E-35

Total Expenses & Financing Uses by Department/Division
FY20 FY21 FY22 FY22
Actual Budget Requested Approved $▲ %▲Public Utilities:
Administration 1,152,269 1,263,109 1,239,692 1,238,192 (24,917) ‐2.0%
Constr & Proj Management 6,069,164 7,031,238 7,178,926 7,178,926 147,688 2.1%
Plant Operations 10,629,697 12,612,337 12,797,923 12,799,423 187,086 1.5%
Engineering Management 475,815 576,976 580,998 580,998 4,022 0.7%
Information Technology 61,304 62,005 63,853 63,853 1,848 3.0%
Building Inspection 28,810 27,996 28,618 28,618 622 2.2%
Other General Administration 15,585,732 15,331,308 15,524,784 15,524,784 193,476 1.3%
Debt Service (interest) 9,445,566 9,075,556 9,075,556 9,075,556 0 0.0%
Other Financing Uses/Transfers Out 1,733,577 1,813,405 1,787,108 1,787,108 (26,297) ‐1.5%
Total Expenses & Other Financing Uses $45,181,934 $47,793,930 $48,277,458 $48,277,458 $483,528 1.0%
Expenses by Department
Public Utilities: 45.2%
Other General Admin.:32.2%
Debt Service: 18.8%
Transfers Out: 3.7%
Information Technology:0.1%
Building Inspection: 0.1%
Public Utilities by Division
Plant Operations: 58.7%
Constr & ProjManagement: 32.9%
Administration: 5.7%
EngineeringManagement: 2.7%
Enterprise Funds
FY20 Budget E-36

Solid Waste Fund
FY20 FY21 FY22 FY22
Actual Budget Requested Approved $▲ %▲Revenues
Charges for Services 3,446,453 3,465,500 3,475,500 3,475,500 10,000 0.3%
Other Revenues 21,984 4,000 4,000 4,000 0 0.0%
Total Operating Revenues $3,468,437 $3,469,500 $3,479,500 $3,479,500 $10,000 0.3%
Other Financing Sources/Transfers In 135,000 135,000 135,000 135,000 0 0.0%
Total Revenues & Other Sources $3,603,437 $3,604,500 $3,614,500 $3,614,500 $10,000 0.3%
Expenses
Solid Waste Administration 384,123 391,061 404,424 404,424 13,363 3.4%
Solid Waste Collection 2,421,031 2,453,385 2,481,040 2,481,040 27,655 1.1%
Other General Administration 726,537 705,561 718,009 718,009 12,448 1.8%
Total Expenses $3,531,691 $3,550,007 $3,603,473 $3,603,473 $53,466 1.5%
Other Financing Uses/Transfers Out 268,473 276,790 279,984 279,984 3,194 1.2%
Total Expenses & Other Financing Uses $3,800,164 $3,826,797 $3,883,457 $3,883,457 $56,660 1.5%
Capital Funding 373,644 535,000 535,000 535,000 0 0.0%
Net Operating Income/(Loss) Incl. Capital ($570,371) ($757,297) ($803,957) ($803,957) ($46,660) 6.2%
Changes in Unrestricted Net Position
FY20 FY21 FY22
Actual Budget Approved
Beginning Unrestricted Net Position $1,971,118 $1,733,589 $1,295,792
Net Income/(Loss) (570,371) (757,297) (803,957)
Other Changes to Unrestricted Net Position:
Plus Depreciation 332,842 319,500 319,500
Ending Unrestricted Net Position $1,733,589 $1,295,792 $811,335
Less:
Approved Capital from prior years (1,273,566) (1,273,566) (1,273,566)
Operating Reserve (3 months) (867,000) (877,000) (891,000)
Available Unrestricted Net Position ($406,977) ($854,774) ($1,353,231)
Enterprise Funds
FY22 Budget E-37

Stormwater Fund
FY20 FY21 FY22 FY22
Actual Budget Requested Approved $▲ %▲Revenues
Charges for Services 4,497,795 4,500,000 4,500,000 4,500,000 0 0.0%
Other Revenues 96,793 35,000 20,000 20,000 (15,000) ‐42.9%
Total Operating Revenues $4,594,588 $4,535,000 $4,520,000 $4,520,000 ($15,000) ‐0.3%
Other Financing Sources/Transfers In 1,545 0 0 0 0 ‐‐
Total Revenues & Other Sources $4,596,133 $4,535,000 $4,520,000 $4,520,000 ($15,000) ‐0.3%
Expenses
Transportation & Public Works 2,945,088 3,587,363 3,397,428 3,397,428 (189,935) ‐5.3%
Other General Administration 1,489,372 1,486,826 1,508,915 1,508,915 22,089 1.5%
Total Expenses $4,434,460 $5,074,189 $4,906,343 $4,906,343 ($167,846) ‐3.3%
Other Financing Uses/Transfers Out 379,558 399,495 371,932 371,932 (27,563) ‐6.9%
Total Expenses & Other Financing Uses $4,814,018 $5,473,684 $5,278,275 $5,278,275 ($195,409) ‐3.6%
Capital Funding 1,299,205 600,000 200,000 200,000 (400,000) ‐66.7%
Net Operating Income/(Loss) Incl. Capital ($1,517,090) ($1,538,684) ($958,275) ($958,275) $580,409 ‐37.7%
Changes in Unrestricted Net Position
FY20 FY21 FY22
Actual Budget Approved
Beginning Unrestricted Net Position $4,646,301 $4,192,803 $3,717,219
Net Income/(Loss) (1,517,090) (1,538,684) (958,275)
Other Changes to Unrestricted Net Position:
Plus Depreciation 1,063,592 1,063,100 1,063,100
Ending Unrestricted Net Position $4,192,803 $3,717,219 $3,822,044
Less:
Approved Capital from prior years (1,794,296) (1,794,296) (1,794,296)
Operating Reserve (3 months) (938,000) (1,103,000) (1,054,000)
Available Unrestricted Net Position $1,460,507 $819,923 $973,748
Enterprise Funds
FY20 Budget E-38

Internal Support Fund
FY20 FY21 FY22 FY22
Actual Budget Requested Approved $▲ %▲Revenues
Charges for Services 1,664,857 1,955,704 1,967,003 1,967,003 11,299 0.6%
Other Revenues 7,028 0 0 0 0 ‐‐
Total Operating Revenues $1,671,885 $1,955,704 $1,967,003 $1,967,003 $11,299 0.6%
Other Financing Sources/Transfers In 25,166 0 0 0 0 ‐‐
Total Revenues & Other Sources $1,697,051 $1,955,704 $1,967,003 $1,967,003 $11,299 0.6%
Expenses
Central Services 1,537,516 1,596,482 1,600,488 1,600,488 4,006 0.3%
Other General Administration 87,473 52,285 53,365 53,365 1,080 2.1%
Debt Service ‐ Capital Lease 31,811 262,211 269,445 269,445 7,234 2.8%
Total Expenses $1,656,800 $1,910,978 $1,923,298 $1,923,298 $12,320 0.6%
Other Financing Uses/Transfers Out 41,459 43,791 42,213 42,213 (1,578) ‐3.6%
Total Expenses & Other Financing Uses $1,698,259 $1,954,769 $1,965,511 $1,965,511 $10,742 0.5%
Capital Funding 0 107,000 132,000 57,000 (50,000) ‐46.7%
Net Operating Income/(Loss) Incl. Capital ($1,208) ($106,065) ($130,508) ($55,508) $50,557 ‐47.7%
Changes in Unrestricted Net Position
FY20 FY21 FY22
Actual Budget Approved
Beginning Unrestricted Net Position $317,807 $397,857 $335,792
Net Income/(Loss) ($1,208) ($106,065) ($55,508)
Other Changes to Unrestricted Net Position:
Plus Depreciation $81,258 $44,000 $44,000
Ending Unrestricted Net Position $397,857 $335,792 $324,284
Less:
Approved Capital from prior years ($288,706) ($288,706) ($288,706)
Operating Reserve (1 month) ($135,000) ($159,000) ($160,000)
Available Unrestricted Net Position ($25,849) ($111,914) ($124,422)
Internal Service Funds
FY22 Budget E-39

Fleet Management Fund
FY20 FY21 FY22 FY22
Actual Budget Requested Approved $▲ %▲Revenues
Charges for Services 2,192,280 2,565,036 2,739,960 2,739,960 174,924 6.8%
Other Revenues 254 0 0 0 0 ‐‐
Total Revenues & Other Sources $2,192,534 $2,565,036 $2,739,960 $2,739,960 $174,924 6.8%
Expenses
Central Services 2,196,156 2,580,010 2,587,092 2,587,092 7,082 0.3%
Other General Administration 28,073 35,674 35,072 35,072 (602) ‐1.7%
Total Expenses $2,224,229 $2,615,684 $2,622,164 $2,622,164 $6,480 0.2%
Other Financing Uses/Transfers Out 103,992 103,812 102,392 102,392 (1,420) ‐1.4%
Total Expenses & Other Financing Uses $2,328,221 $2,719,496 $2,724,556 $2,724,556 $5,060 0.2%
Capital Funding 0 10,000 10,000 10,000 0 0.0%
Net Operating Income/(Loss) Incl. Capital ($135,687) ($164,460) $5,404 $5,404 $169,864 ‐103.3%
Changes in Unrestricted Net Position
FY20 FY21 FY22
Actual Budget Approved
Beginning Unrestricted Net Position $76,715 ($46,406) ($196,266)
Net Income/(Loss) ($135,687) ($164,460) $5,404
Other Changes to Unrestricted Net Position:
Plus Depreciation $12,566 $14,600 $14,600
Ending Unrestricted Net Position ($46,406) ($196,266) ($176,262)
Less:
Approved Capital from prior years ($54,605) ($54,605) ($54,605)
Operating Reserve (1 month) ($193,000) ($225,000) ($226,000)
Available Unrestricted Net Position ($294,011) ($475,871) ($456,867)
Internal Service Funds
FY20 Budget E-40

Fleet Replacement Fund
FY20 FY21 FY22 FY22
Actual Budget Requested Approved $▲ %▲Revenues
Charges for Services 1,024,128 1,189,522 2,215,200 2,215,200 1,025,678 86.2%
Other Revenues 129,539 0 0 0 0 ‐‐
Total Operating Revenues $1,153,667 $1,189,522 $2,215,200 $2,215,200 $1,025,678 86.2%
Other Financing Sources/Transfers In 156,492 0 0 0 0 ‐‐
Total Revenues & Other Sources $1,310,159 $1,189,522 $2,215,200 $2,215,200 $1,025,678 86.2%
Expenses
Other General Administration 2,568,245 90,000 90,000 90,000 0 0.0%
Equipment Expenses 36,557 0 0 0 0 ‐‐
Debt Service 32,811 0 0 0 0 ‐‐
Total Expenses & Other Financing Uses $2,637,613 $90,000 $90,000 $90,000 $0 0.0%
Capital Funding 3,906,879 1,295,400 3,853,000 3,853,000 2,557,600 197.4%
Net Operating Income/(Loss) Incl. Capital ($5,234,333) ($195,878) ($1,727,800) ($1,727,800) ($1,531,922) 782.1%
Changes in Unrestricted Net Position
FY20 FY21 FY22
Actual Budget Approved
Beginning Unrestricted Net Position 4,951,070 2,162,170 1,966,292
Net Income/(Loss) (5,234,333) (195,878) (1,727,800)
Other Changes to Unrestricted Net Position:
Plus Depreciation 2,445,433 0 0
Ending Unrestricted Net Position 2,162,170 1,966,292 238,492
Less:
Reserve (1,100,000) (1,100,000) (1,100,000)
Available Unrestricted Net Position 1,062,170 866,292 (861,508)
Internal Service Funds
FY22 Budget E-41

Insurance & Claims Fund
FY20 FY21 FY22 FY22
Actual Budget Requested Approved $▲ %▲Revenues
Charges for Services 3,305,817 3,086,069 3,714,209 3,714,209 628,140 20.4%
Intergovernmental 0 0 0 0 0 ‐‐
Other Revenues 478,894 0 0 0 0 ‐‐
Total Operating Revenues $3,784,711 $3,086,069 $3,714,209 $3,714,209 $628,140 20.4%
Expenses
Human Resources 455,497 509,203 463,671 463,671 (45,532) ‐8.9%
Other General Administration 2,354,789 3,094,554 3,191,191 3,191,191 96,637 3.1%
Total Expenses $2,810,286 $3,603,757 $3,654,862 $3,654,862 $51,105 1.4%
Other Financing Uses/Transfers Out 337,971 45,415 43,831 43,831 (1,584) ‐3.5%
Total Expenses & Other Financing Uses $3,148,257 $3,649,172 $3,698,693 $3,698,693 $49,521 1.4%
Net Operating Income/(Loss) Incl. Capital $636,454 ($563,103) $15,516 $15,516 $578,619 ‐102.8%
Changes in Unrestricted Net Position
FY20 FY21 FY22
Actual Budget Approved
Beginning Unrestricted Net Position $3,650,715 $4,287,169 $3,724,066
Net Income/(Loss) $636,454 ($563,103) $15,516
Ending Unrestricted Net Position $4,287,169 $3,724,066 $3,739,582
Less:
Operating Reserve (1 month) ($262,000) ($304,000) ($308,000)
Available Unrestricted Net Position $4,025,169 $3,420,066 $3,431,582
Internal Service Funds
FY20 Budget E-42

Health Insurance Fund
FY20 FY21 FY22 FY22
Actual Budget Requested Approved $▲ %▲Revenues
Charges for Services 15,331,733 16,583,621 18,024,516 18,024,516 1,440,895 8.7%
Other Revenues 45,695 0 0 0 0 ‐‐
Total Revenues & Other Sources $15,377,428 $16,583,621 $18,024,516 $18,024,516 $1,440,895 8.7%
Expenses
Human Resources 584,699 751,879 779,291 779,291 27,412 3.6%
Other General Administration 14,464,508 15,583,398 16,912,769 16,912,769 1,329,371 8.5%
Total Expenses $15,049,207 $16,335,277 $17,692,060 $17,692,060 $1,356,783 8.3%
Other Financing Uses/Transfers Out 30,365 32,657 38,479 38,479 5,822 17.8%
Total Expenses & Other Financing Uses $15,079,572 $16,367,934 $17,730,539 $17,730,539 $1,362,605 8.3%
Net Operating Income/(Loss) Incl. Capital $297,856 $215,687 $293,977 $293,977
Changes in Unrestricted Net Position
FY20 FY21 FY22
Actual Budget Approved
Beginning Unrestricted Net Position $2,088,833 $2,386,689 $2,602,376
Net Income/(Loss) $297,856 $215,687 $293,977
Ending Unrestricted Net Position $2,386,689 $2,602,376 $2,896,353
Less:
Operating Reserve (1 month) ($1,257,000) ($1,364,000) ($1,478,000)
Available Unrestricted Net Position $1,129,689 $1,238,376 $1,418,353
Internal Service Funds
FY22 Budget E-43

Listed below are the budgeted transfers and charges for services between ACCGov Funds. In order to avoid
"double counting" these dollars, they are subtracted from the aggregate total of all funds.
FY22 FY22
Approved Approved
General Fund Transfers to: Transfers to General Fund from:
Emergency Telephone Fund 1,111,000 Hotel/Motel Fund 90,340
Grant Special Revenue Fund 145,076 Sheriff Inmate Fund 35,000
Special Prog Spec Rev Fund 821,183 Airport Fund 66,721
General Capital Proj Fund 5,651,000 Landfill Fund 189,268
Subtotal $7,728,259 Transit System Fund 699,843
Water & Sewer Fund 1,885,172
Solid Waste Fund 279,984
Storm Water Utility Fund 371,932
Internal Support Fund 42,213
Fleet Management Fund 102,392
Insurance & Claims Fund 43,831
Landfill Transfer for Administration to: Health Insurance Fund 38,479
Solid Waste Fund 135,000 Subtotal $3,845,175
Total Interfund Transfers $11,708,434
FY22 FY22
Approved Approved
General Fund Admin. Overhead Charge to: Internal Service Fund Operations:
Building Inspection Fund 166,658 Internal Support Fund 1,967,003
Airport Fund 182,874 Fleet Management Fund 2,739,960
Landfill Fund 112,057 Fleet Replacement Fund 2,215,200
Transit System Fund 401,033 Insurance & Claims Fund 3,714,209
Water & Sewer Fund 1,411,040 Health Insurance Fund 12,551,165
Solid Waste Fund 333,214 Subtotal $23,187,537
Storm Water Utility Fund 363,118
Subtotal $2,969,994
Total Interfund Charges for Services $26,157,531
Total Interfund Transfers and Charges $37,865,965
Interfund Transfers
Charges for Services
Interfund Transfers & Charges
FY20 Budget E-44

*Envision Athens FY19 & FY20 funding based on Mayor & Commission approved agreement on May 1, 2018 and included in the Other
General Administration portion of those budgets. Those budgets are reflected here for comparison purposes.
FY20 FY21 FY22 FY22
General Fund Budget Budget Requested Approved $▲ %▲Advantage Behavioral Health 180,206 180,206 180,206 180,206 0 0.0%
Athens‐Clarke County Libraries 2,028,197 2,098,197 2,146,186 2,146,186 47,989 2.3%
Athens Community Council on Aging 287,300 287,300 287,300 287,300 0 0.0%
Clarke County Public Health Department 946,354 946,354 946,354 946,354 0 0.0%
Department of Family & Children Services 208,600 208,600 208,600 208,600 0 0.0%
Total Quasi‐Governmental $3,650,657 $3,720,657 $3,768,646 $3,768,646 $47,989 1.3%
FY20 FY21 FY22 FY22
Budget Budget Requested Approved $▲ %▲Athens Neighborhood Health Center 100,000 100,000 100,000 100,000 0 0.0%
Athens Tutorial Program 3,500 3,500 3,500 3,500 0 0.0%
Envision Athens* 75,000 75,000 96,750 96,750 21,750 29.0%
United Way of NE GA 2‐1‐1 24,402 24,402 24,402 24,402 0 0.0%
Total Community Service Agencies $202,902 $202,902 $224,652 $224,652 $21,750 10.7%
FY20 FY21 FY22 FY22
Budget Budget Requested Approved $▲ %▲Athens Cultural Affairs Commission 21,000 21,000 21,000 21,000 0 0.0%
Athens in Motion Commission 0 0 12,000 12,000 12,000 ‐‐
Oconee Rivers Greenway Commission 16,500 16,500 16,500 16,500 0 0.0%
Total ACCGov Commissions $37,500 $37,500 $49,500 $49,500 $12,000 32.0%
Total General Fund $3,891,059 $3,961,059 $4,042,798 $4,042,798 $81,739 2.1%
Hotel/Motel Tax Special Revenue Fund
FY20 FY21 FY22 FY22
Budget Budget Requested Approved $▲ %▲Classic Center Authority 2,035,875 1,831,202 1,411,540 1,411,540 (419,662) ‐22.9%
Convention & Visitors Bureau 1,178,250 1,059,797 816,920 816,920 (242,877) ‐22.9%
Total Hotel/Motel Fund $3,214,125 $2,890,999 $2,228,460 $2,228,460 ($662,539) ‐22.9%
Special Programs/Special Revenue Fund
FY20 FY21 FY22 FY22
Budget Budget Requested Approved $▲ %▲Project Safe, Inc. 26,000 26,000 26,000 26,000 0 0.0%
Total Special Revenue Fund $26,000 $26,000 $26,000 $26,000 $0 0.0%
Grand Total Independent Agencies $7,131,184 $6,878,058 $6,297,258 $6,297,258 ($580,800) ‐8.4%
Appropriation Summary
Independent Agencies
FY22 Budget F-1

Independent Agencies are either separate legal entities or Athens‐Clarke County (ACCGov) Commissions
not included within an ACCGov department budget.
Similar to ACCGov departments, Independent Agencies were asked to provide specific descriptions &
justification details for amounts requested over FY21 Budget level.
Agency requests totaled $6,297,258, an 8.4% decrease from FY21 Budget.
$4,042,798 was requested from the General Fund, an increase of $81,739 or 2.1%
FY22 Budget for Independent Agencies is $6,297,258, which is an 8.4% decrease from FY21 Budget.
Two Independent Agencies, the Classic Center & Convention/Visitors Bureau (CVB), receive funding from
the Hotel/Motel tax, which is included in a separate special revenue fund.
FY22 Budget for Hotel/Motel Tax Fund is based on the current seven percent tax rate projected to
generate revenue of $2.6 million, a 22.9% decrease from the $3.4 million budgeted for FY21 due to the
significant impacts of the COVID‐19 pandemic.
FY22 Budget includes funding requested by the Classic Center & Convention & Visitors Bureau totaling
$2.2M, a 22.9% decrease from FY21 given the significant impacts on Hotel/Motel tax revenues from the
COVID‐19 pandemic. This amount is consistent with current allocation of six of seven cents of the
Hotel/Motel Tax.
Project Safe funding of $26,000, same as requested and the prior year Budget, is funded from dedicated
fine revenue and accounted for in the Special Programs Special Revenue Fund.
Additional information about each agency's FY22 request is provided below.
Advantage Behavioral Health Systems (ABHS) provides person‐centered treatment and support to individuals
and families experiencing behavioral health challenges, intellectual/developmental disabilities, and addictive
diseases. Advantage Behavioral provides services both within the clinical setting and within the community
(mobile services).
The agency requested $180,206 for FY22, the same funding level as FY21.
FY22 Budget includes $180,206 for ABHS as requested.
Athens‐Clarke County Libraries ‐ Mission: To have a positive and lasting effect on every individual who
interacts with the Athens‐Clarke County Libraries by reflecting our values outwards and enabling everyone to
expand their horizons, interest, knowledge and educational aspirations in an atmosphere of safe exploration.
The agency requested $2,146,186 for FY22, an increase of $47,989 or 2.3% above the FY21 level. The increase
includes the following:
Teachers Retirement rate increase from 19.06% to 19.81%: $7,101
2% staff salary increase: $18,721
Addition of one 12‐ hour per week community outreach position: $22,167
FY22 Budget includes $2,146,186, an increase of $47,989 or 2.3% above FY21.
Overview
Quasi-Governmental Agencies
Independent Agencies
FY22 Budget F-2

Athens Community Council on Aging ‐ Mission: To promote a lifetime of wellness through engagement,
advocacy, education and support by providing a continuum of services to meet the needs of our community’s
older adults, persons with disabilities and their caregivers. Some of the services that benefit from county
funding include the Athens‐Clarke County Senior Center, Meals on Wheels, The Bentley Center (Athens Day
Health), Retired & Senior Volunteer Program, Senior Community Service Employment Program, Foster
Grandparent Program, and NEGA Grandparents Raising Grandchildren.
The agency requested $287,300 for FY22, the same as FY21:
Replacement vehicle to transport clients for programs, medical appointments, & group outings: $20,000
Partial salary and benefits allocation for staff in supported programs: $267,300 FY22 Budget includes $287,300 as requested.
Clarke County Public Health Department ‐ Mission: To promote and protect the health of all our residents.
The Health Department collaborates with individuals, families, schools, hospitals, service agencies, and
businesses to improve community health and enhance quality of life for everyone in Clarke County, especially
those with limited resources to care for themselves. Funding supports services and programs that include
birth control, high blood sugar & pressure, infectious disease, environmental health, exercise, health education
& planning, and improving the nutritional status of pregnant women, children and nursing mothers. Primary
focus will continue to be providing the public health response to the COVID‐19 pandemic including vaccination
effort.
The agency requested $946,354 for FY22, the same funding level as FY21.
FY22 Budget for the Health Department is $946,354 as requested.
Clarke County Department of Family & Children Services (CCDFCS) delivers local, state and federal assistance
to vulnerable families in the community. The mission of CCDFCS is to provide these services in such a way that it
strengthens families by helping them to become safer and financially self‐sufficient. The agency provides
financial assistance such as Food Stamps, Medicaid, Temporary Assistance for Needy Families (TANF) and serves
children in the Foster Care System. The two major program areas are Social Services (Child Welfare) and
Economic Support.
CCDFCS requested $208,600 for FY22, the same funding level as FY21. Funding will be used to support:
Child Protective Services/Foster Care Program: $26,000
Emergency financial assistance any qualifying citizen of Athens‐Clarke County: $35,000
Personal Services to support critical functions of child safety and family stability: $115,877
Other administrative expenses: $31,723
FY22 Budget for CCDFCS is $208,600 as requested.
Independent Agencies
FY22 Budget F-3

Athens Neighborhood Health Center (ANHC) ‐ Mission: to provide affordable, high‐quality health care to all
individuals in Athens‐Clarke County and surrounding areas. ANHC has provided uninterrupted physician directed
primary health care in the Athens‐Clarke County community for over 49 years. ANHC is among an elite group that
has demonstrated its commitment to advancing quality in health care for the uninsured and at‐risk members of
the community. ANHC remains steadfast in its commitment to provide comprehensive health care services
targeting the medically underserved, uninsured, and low‐income individuals.
The agency requested $100,000 for FY22, the same level as FY21.
FY22 Budget for ANHC includes $100,000 as requested.
Athens Tutorial Program ‐ Mission: To provide at‐risk students in Clarke County and vicinity with academic
assistance, cultural enrichment opportunities and other basic life skill enhancement as a means of preparing
them to excel in school and become productive citizens. Athens Tutorial serves students in the local school
district who are experiencing academic and social problems. Currently, most participants are elementary and
middle school students who live in Census Tracts 301 and 302 where most of the residents are considered to
be low to moderate income.
The agency requested $3,500 for FY22, the same funding level as FY21.
FY22 Budget for Athens Tutorial is $3,500 as requested.
Envision Athens ‐ Mission: To serve Athens‐Clarke County as the catalyst, convener, & champion of progress
in addressing our community’s most pressing needs and optimizing our opportunities for collaborative
community development. Envision Athens seeks to realize 103 action items spread across 14 domains of
Athens‐Clarke County through effective project management. A complete list of the 103 action items & their
relative domains are viewable in the Envision Athens Action Agenda created in 2017 after a year of obtaining
feedback from a representative sample of 1,621 Athenians.
The agency requested $96,750 for FY22, an increase of $21,750 or 29% above FY21 Budget to provide funding
for a 5‐year update to the Envision Athens Action Agenda.
FY22 Budget for Envision Athens is $96,750, an increase of $21,750 above or 29% above FY21.
United Way of NE Georgia 2‐1‐1 ‐ Mission: Seek to motivate and mobilize resources to meet the highest
priority needs of the people living in Northeast Georgia by providing access to quality information and
referrals. FY22 Services and Programs will include 211 Resource Navigation, Resource Directory, as well as
Education & Outreach.
The agency requested $24,402 for FY22, the same funding level as FY21.
FY22 Budget for United Way 2‐1‐1 program is $24,402 as requested.
Community Service Agencies
Independent Agencies
FY22 Budget F-4

Athens Cultural Affairs Commission (ACAC) The mission of ACAC is to foster the development & enjoyment
of performing, visual, cultural, & other arts in the Athens‐Clarke County community; to make
recommendations to the Mayor and Commission on the development & promotion of practices & polices
pertaining to the arts; & to work cooperatively with county entities & other advisory commissions to include
an arts element in as many areas of ACCGov planning & development as possible.
The commission requested $21,000 for FY22, the same funding level as FY21.
FY22 Budget for ACAC is $21,000 as requested.
Athens in Motion Commission (AiMC) is responsible for development, implementation and modification of an
Athens in Motion Plan for a safe and connected network of bicycle and pedestrian facilities throughout
Athens‐Clarke County. Such plan shall also include guidelines for the implementation of the plan. The AiMC is
advisory in nature and is charged with the responsibility of recommending projects, polices and initiatives to
the Mayor & Commission.
The commission requested $12,000 for FY22.
FY22 Budget for AiMC is $12,000 as requested.
Oconee Rivers Greenway Commission ‐ Mission: To advise the ACCGov Mayor and Commission & University of
Georgia president on the protection of the natural resources of the North and Middle Oconee Rivers and their
major tributaries and floodplains for the benefit & enjoyment of Athens Clarke County citizens. The agency
develops planning guidance for a river‐oriented greenway system and recommends rules and regulations for
proper protection and management of the Oconee Rivers Greenway.
The commission requested $16,500 for FY22, the same funding level as FY21.
FY22 Budget for Oconee Rivers Greenway is $16,500 as requested.
During FY22, the seven percent Hotel/Motel Tax is projected to generate approximately $2.6 million, a
decrease of ‐22.9% below the $3.4 million budget for FY21, given the significant impacts on Hotel/Motel tax
revenues from the COVID‐19 pandemic.
Classic Center Authority & Convention & Visitors Bureau (CVB) – The Classic Center Authority seeks to enhance the quality of life in Athens‐Clarke County by serving as the cultural, civic, and social center for the southeast and by generating maximum economic impact. The CVB is a destination marketing organization with the primary function of promoting and marketing the community to attract visitors, groups, & conventions to Athens for the purpose of positively affecting the local economy. The FY22 Budget includes funding for the Classic Center & Convention & Visitors Bureau totaling $2,228,460, a 22.9% decrease from FY21, as follows:
ACCGov Commissions
Hotel/Motel Funded Agencies
Independent Agencies
FY22 Budget F-5

Classic Center Authority $1,411,540 Convention & Visitors Bureau $ 816,920 $2,228,460
The FY22 Budget amounts are based on current allocation of the Hotel/Motel tax – 3.8¢ or 54.29% to the Classic Center and 2.2¢ or 31.42% to the CVB – a total of six of seven cents tax collected.
Project Safe, Inc. The mission of Project Safe is to end domestic violence through crisis intervention, ongoing
supportive services, prevention and education, and systems change advocacy. The agency offers
comprehensive services in order to reduce incidents of domestic violence and increase survivors’ access to
safety and justice.
The agency requested $26,000 for FY22 from the Special Programs Special Revenue Fund (the 5% Crime
Victims Assistance revenue), the same level as FY21. This funding supports approximately 35% of the agency’s
volunteer program to recruit, train, and place those willing to serve throughout Project Safe. A portion of the
funding, $8,500/year, provides match for a grant funding victim outreach services.
FY22 Budget for Project Safe is $26,000, same funding level as FY21.
Special Programs/Special Revenue Fund
Independent Agencies
FY22 Budget F-6

Geography • Approximately 122 square miles (78,000 acres) • Smallest in land area of Georgia’s 159 counties • Approximately 65 miles northeast of Atlanta History • Clarke County created from Jackson County in 1801 and named for Revolutionary War General Elijah Clarke • Town of Athens chartered in 1806 and was named for Greek city of learning • Clarke County and City of Athens Unified on January 14, 1991, becoming the 2nd consolidated government in
Georgia and 28th in the nation • 34 landmarks and 16 neighborhoods are listed on the National Register of Historic Places. Demographics (2015-2020 estimate unless noted) • Population: 131,857 (2021 Estimate) • Median Household Income: $38,311 • Median Age: 28 • White: 66% | Black or African-American: 29.2% | Asian: 4.9% | Other: 2.6% |Hispanic or Latino: 10.8% • High school graduates (ages 25+): 87.9% • Bachelor’s degree or higher (ages 25+): 44% • Persons below poverty: 29.9% • Unemployment rate: 3.4% (March 2021 as reported by the Georgia Department of Labor) • Total registered voters as of 4/14/21: 122,816 (77,504 active) Major Attractions • University of Georgia; State Botanical Garden; Historic Homes; Downtown Athens; Morton Theater; Georgia
Museum of Art; Classic Center (Convention Center & Theater) Health • Public Hospital – 1; Private Hospital – 1; Doctors – 310+; Dentists – 40+; Mental Health Practitioners – 60+;
Ambulance Services – 7; Nursing Homes / Assisted Living – 9 Recreation • Tennis Courts – 13; Parks – 16; Golf Courses – 4; Swimming Pools – 6; Country Clubs – 2; Zoos – 1 • City and University of Georgia performing arts centers: theater groups, symphony, dance, drama, art groups;
Other university cultural activities including State Botanical Garden and Georgia Museum of Art; Convention center with concerts, dance, drama and comedy acts.
Transportation • Airport – 1; Bus Depot – 1 (served by Southeastern Stages); Public Transit System – 1; University of Georgia
Transit System – 1; Megabus – 1; Groome Transportation Public Accommodations • Lodging – 27; Restaurants – 150+; Conference Centers/Meeting Facilities – 8; Civic Center – 1; Enclosed Malls – 1
Athens-Clarke County by the Numbers
FY22 Budget G-1
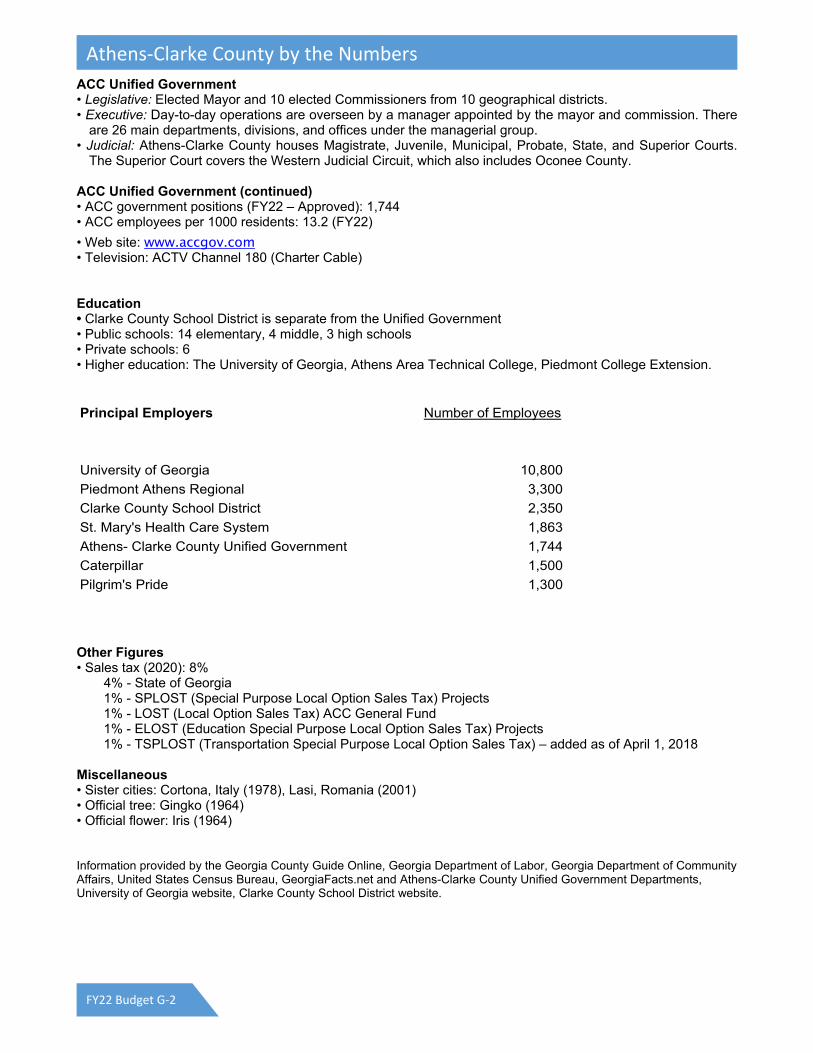
ACC Unified Government • Legislative: Elected Mayor and 10 elected Commissioners from 10 geographical districts. • Executive: Day-to-day operations are overseen by a manager appointed by the mayor and commission. There
are 26 main departments, divisions, and offices under the managerial group. • Judicial: Athens-Clarke County houses Magistrate, Juvenile, Municipal, Probate, State, and Superior Courts.
The Superior Court covers the Western Judicial Circuit, which also includes Oconee County. ACC Unified Government (continued) • ACC government positions (FY22 – Approved): 1,744 • ACC employees per 1000 residents: 13.2 (FY22)
• Web site: www.accgov.com • Television: ACTV Channel 180 (Charter Cable) Education • Clarke County School District is separate from the Unified Government • Public schools: 14 elementary, 4 middle, 3 high schools • Private schools: 6 • Higher education: The University of Georgia, Athens Area Technical College, Piedmont College Extension. Principal Employers Number of Employees
University of Georgia 10,800
Piedmont Athens Regional 3,300
Clarke County School District 2,350
St. Mary's Health Care System 1,863
Athens- Clarke County Unified Government 1,744
Caterpillar 1,500
Pilgrim's Pride 1,300
Other Figures • Sales tax (2020): 8% 4% - State of Georgia 1% - SPLOST (Special Purpose Local Option Sales Tax) Projects 1% - LOST (Local Option Sales Tax) ACC General Fund 1% - ELOST (Education Special Purpose Local Option Sales Tax) Projects 1% - TSPLOST (Transportation Special Purpose Local Option Sales Tax) – added as of April 1, 2018 Miscellaneous • Sister cities: Cortona, Italy (1978), Lasi, Romania (2001) • Official tree: Gingko (1964) • Official flower: Iris (1964) Information provided by the Georgia County Guide Online, Georgia Department of Labor, Georgia Department of Community Affairs, United States Census Bureau, GeorgiaFacts.net and Athens-Clarke County Unified Government Departments, University of Georgia website, Clarke County School District website.
Athens-Clarke County by the Numbers
FY22 Budget G-2

Programs and activities planned for FY22 from the Community Development Block Grant (CDBG) and HOME Grant appropriation, as approved by the Mayor and Commission on April 6, 2021, are listed below. CDBG and HOME grants are programs funded from the U. S. Department of Housing and Urban Development. These federal funds are directed toward community development programs in the areas of affordable housing, economic development, and public service. Projected CDBG Funding FY22 (July 1, 2021 ‐ June 30, 2022) …………………………………………………………….. $1,344,801 Reprogrammable CDBG Funds …………………………………………………………….. $ 18,968
Total Projected FY22 CDBG Funding Available…………….………………………………………………………….. $1,363,769
1. Athens Area Habitat for Humanity ………………...…………………………………….................................... $192,500
20 Brush with Kindness emergency repairs, 4 EHARP accessibility (ramp) projects, rehabilitation of 1
house and Renew Athens for affordable rental properties
2. Athens Housing Authority……………………………………………………………………………………….……..…..…..$163,000
Acquisition & rehabilitation of 3 properties with its Act 1 Home Program
3. Athens Land Trust ……………………………………………………………………………………………………..….….……$195,000
Acquisition of 2 properties for affordable homeownership, construct 2 new houses for
homeownership, develop 2 new duplexes, complete infrastructure for 2 new developments, and
provide 5 new homeowners with down payment assistance.
4. Historic Athens (formerly Athens‐Clarke Heritage Foundation)……..............................................$91,000
Homeowner rehabilitations for 18‐20 owner‐occupied historic homes
Total Affordable Housing …………………………………………………………………………………………………...……….. $641,500* *Does not include carried forward from prior year
5. Athens Land Trust.......................................................................................................................... $62,000
Through the West Broad Farmers Market Vendor Development & Young Urban Farmers Program,
serve 25 entrepreneurs, 50 microenterprises to expand business, & 30 microenterprises to expand and
increase sales revenue
6. East Athens Development Corporation………………………………………………………………..…………………..$90,000
Operation One Family at a Time, providing job training for 20 certified nursing assistants, 30
phlebotomy technicians and 5 patient care technicians
Overview
Affordable Housing Objectives
Micro-enterprise, Economic Development & Neighborhood Revitalization Objectives
FY22 CDBG & HOME
FY22 Budget G-3

7. Goodwill of North Georgia………………………………….…………………………………………….………………………$65,000
12‐week microenterprise curriculum through GoodBIZ training for 30 participants
Total Micro‐enterprise, Economic Development and Neighborhood Revitalization ………………………… $217,000
8. Acceptance Recovery Center……………………………………………………………..…………………..………………….$19,636
Alumni treatment follow‐up program for 30 recovery program graduates
9. Advantage Behavioral Health Systems…………………………………………..……………………………..……………$27,635
Housing assistance and supportive services to 40 households who are considered chronically homeless
10. Athens Community Council on Aging………………………………………………………………………………….………$19,636
Transportation for 235 seniors to appointments and services
11. Athens Land Trust……………………………………………..……………………………………………………………………....$31,635
Comprehensive housing counseling and financial education for 250 low‐income people
12. Athens Tutorial Program……………………………………………..…………………………………….……………………….$24,635
Tutoring and instruction for 50 elementary school students in East Athens
13. Casa de Amistad………………………………………………………….……………………………………………………………..$14,636
ESL and Spanish GED services for 125 people
14. Chess and Community Conference…………………….………………………………………………….…………………..$24,635
Enrichment through Project Rewire that includes STEM and critical thinking programs for 50 low‐
income youth
15. Family Promise………………………………………………………………………………………………………………………….$14,636
Shelter and services for 15 homeless families
16. The Ark UMOC………………………………………………………………………………………………………….……………...$24,636
Financial education, counseling, and financial products for 250 low‐income individuals
Total Public Services ………………………………………………………………………………………………………………………. $201,720
Public Service Objectives – Subject to the 15% Cap
FY22 CDBG & HOME
FY22 Budget G-4

17. Athens‐Clarke County Leisure Services...........................................................................................$34,589
Safe Connections to trails and parks – improved and modernized crossings for Trail Creek Street,
College Avenue Greenway Trail, Little Oak Street Trail and Crosswalk, & Walker Park Crosswalk to
Learning Pump Track
Total Public Facilities………………………………………………………………………………………………………………….…… $34,589
Total Administration ………………………………………………………………………………………………………………..….. $268,960
______________________________________________________________________
Total FY22 CDBG Expenditures………………………………………………………....….…$1,363,769* *Does not include carried forward from prior year
HOME Funding Available for FY22 (July 1, 2021 ‐ June 30, 2022) …………………………………………………………..$691,534
1. Housing and Community Development ….……………………………………………………………………………………..$622,381 To maximize the impact of HOME program funds and leverage public and private resources, HOME funds
will be available as “gap financing” for eligible housing activities under the HOME Investment Partnership Program. In order to maintain compliance with HOME regulations and utilizing the maximum allowable subsidy for individual units, HOME funds may also be made available to open projects that are approaching non‐compliance with portions of the recently revised HOME Final Rule. Applications for HOME funds will be accepted on a “first come, funds available” basis on affordable housing developments where:
‐ the proposed property site has been identified;
‐ total development costs have been projected (including sales price and/or rental rates);
‐ additional financial resources have been secured and committed. This will enable HCD to determine the actual investment of HOME funds required to make the development financially feasible and provide increased housing opportunities for decent, safe, and affordable housing for low to moderate income households in Athens‐Clarke County. 2. Administration……………………………………………………………………………………………………………..…………………..... $69,153
HCD administration of HOME program (10% cap)
TOTAL FY22 HOME EXPENDITURES………………………………..……………..……….……….$691,534
Public Facilities Objectives
Administration
HOME Grant Appropriation
FY22 CDBG & HOME
FY22 Budget G-5

Athens‐Clarke County is currently well within the debt limits established under Georgia Law. Georgia Law limits a county's indebtedness to 10% of the assessed value of all taxable property located within the county. Only General Obligation Bonds, which are repaid by property tax revenues, fall under the legal debt limit. Revenue Bonds are to be repaid from specific revenue sources and do not fall under the legal debt limit. Computation of Legal Debt Margin
Estimated Net Assessed Value of Taxable Property $ 5,070,000,000 (1) Debt Limit (10% of Assessed Value) $ 507,000,000 General Obligation Bonds outstanding $ 32,733,500
Debt Margin $ 474,266,500
(1) – Estimated Net Assessed Value of Taxable Property for 2020. Below is a summary of the debt service obligations of Athens‐Clarke County as of July 1, 2021. These obligations represent the annual installment payments of principal and interest for previous capital improvement projects or acquisitions funded through the issuance of debt. The following is a description of each obligation outstanding for FY22. General Obligation Bonds: 2018 Transportation Special Projects Local Options Sales Tax Debt
Purpose: Finance TSPLOST projects in anticipation of revenues
Interest Rate: 2.28%
Maturity Date: 2023
Original Principal Amount: $8,000,000
July 1, 2021 Principal Outstanding: $2,074,700
Funding Source: Anticipated TPLOST revenue 2020 Special Purpose Local Options Sales Tax Debt
Purpose: Finance SPLOST projects in anticipation of revenues
Interest Rate: 4% to 5%
Maturity Date: 2023
Original Principal Amount: $26,660,000
July 1, 2021 Principal Outstanding: $24,540,000
Funding Source: Anticipated SPLOST revenue Revenue Bonds: 2012 Economic Development Authority (Caterpillar Project)
Purpose: Construct infrastructure improvements for Caterpillar project
Interest Rate: 2 to 5%
Maturity Date: 2032
Original Principal Amount: $5,475,000
July 1, 2021 Principal Outstanding: $4,290,000
Funding Source: General Fund Revenue
Debt Service Requirements
FY22 Budget G-6

2007 Georgia Environmental Finance Authority (Clean Water State Revolving Loan Fund – Ph I)
Purpose: Interceptor sewer line projects
Interest Rate: 3%
Maturity Date: 2031
Original Principal Amount: $14,772,863
July 1, 2021 Principal Outstanding: $7,870,753
Funding Source: Water and Sewer Service Fees
2009 Georgia Environmental Finance Authority (Clean Water State Revolving Loan Fund– Ph 2)
Purpose: Interceptor sewer line projects
Interest Rate: 3%
Maturity Date: 2033
Original Principal Amount: $4,469,301
July 1, 2021 Principal Outstanding: $2,819,358
Funding Source: Water and Sewer Service Fees 2015 Water and Sewerage Revenue Bonds
Purpose: Construct Water & Sewerage System and facility improvements and expansions
Interest Rate: 1 to 5%
Maturity Date: 2038
Original Principal Amount: $210,140,000
July 1, 2021 Principal Outstanding: $176,955,000
Funding Source: Water and Sewer Service Fees Other Long Term Debt: 2011 ADDA ‐ Parking Deck Guaranteed Revenue Debt
Purpose: Construct Downtown Parking Deck
Interest Rate: 3.51%
Maturity Date: 2026
Original Principal Amount: $6,131,700
July 1, 2021 Principal Outstanding: $2,455,900
Funding Source: General Fund – Parking Fees 2002 Airport Guaranteed Revenue Debt
Purpose: Construct T‐Hangars at Ben‐Epps Airport
Interest Rate: 3.72% (first 10 years) and 2.74% (reset for final 10 years)
Maturity Date: 2023
Original Principal Amount: $1,000,000
July 1, 2021 Principal Outstanding: $131,000
Funding Source: Airport Enterprise Fund – Rent from T‐Hangers
Debt Service Requirements
FY22 Budget G-7

2009 Airport Guaranteed Revenue Debt
Purpose: Construct Executive Hangers at Ben‐Epps Airport
Interest Rate: 4.15%
Maturity Date: 2029
Original Principal Amount: $600,000
July 1, 2021 Principal Outstanding: $240,000
Funding Source: Airport Enterprise Fund – Rent from Executive Hangers
2019 Solid Waste Authority‐ Landfill Expansion Debt
Purpose: Expand Landfill space
Interest Rate: 2.5%
Maturity Date: 2027
Original Principal Amount: $4,765,989
July 1, 2021 Principal Outstanding: $3,574,489
Funding Source: Landfill Enterprise Fund ‐ tipping fees 2020 MUNIS Software Project
Purpose: Installation and Servicing of MUNIS Software.
Interest Rate: 2.6%
Maturity Date: 2027
Original Principal Amount: $1,635,344
July 1, 2021 Principal Outstanding: $1,419,313
Funding Source: General Fund Revenue 2018 VOIP Capital Lease
Purpose: Installation and Servicing of VOIP Services.
Interest Rate: 3.89%
Maturity Date: 2022
Original Principal Amount: $1,347,224
July 1, 2021 Principal Outstanding: $508,489
Funding Source: General Revenue
Debt Service Requirements
FY22 Budget G-8

FISCAL POLICIES OF ATHENS-CLARKE COUNTY, GEORGIA LAST REVISED BY MAYOR AND COMMISSION ON JUNE 25, 2020
Fiscal Policies
FY22 Budget G-9
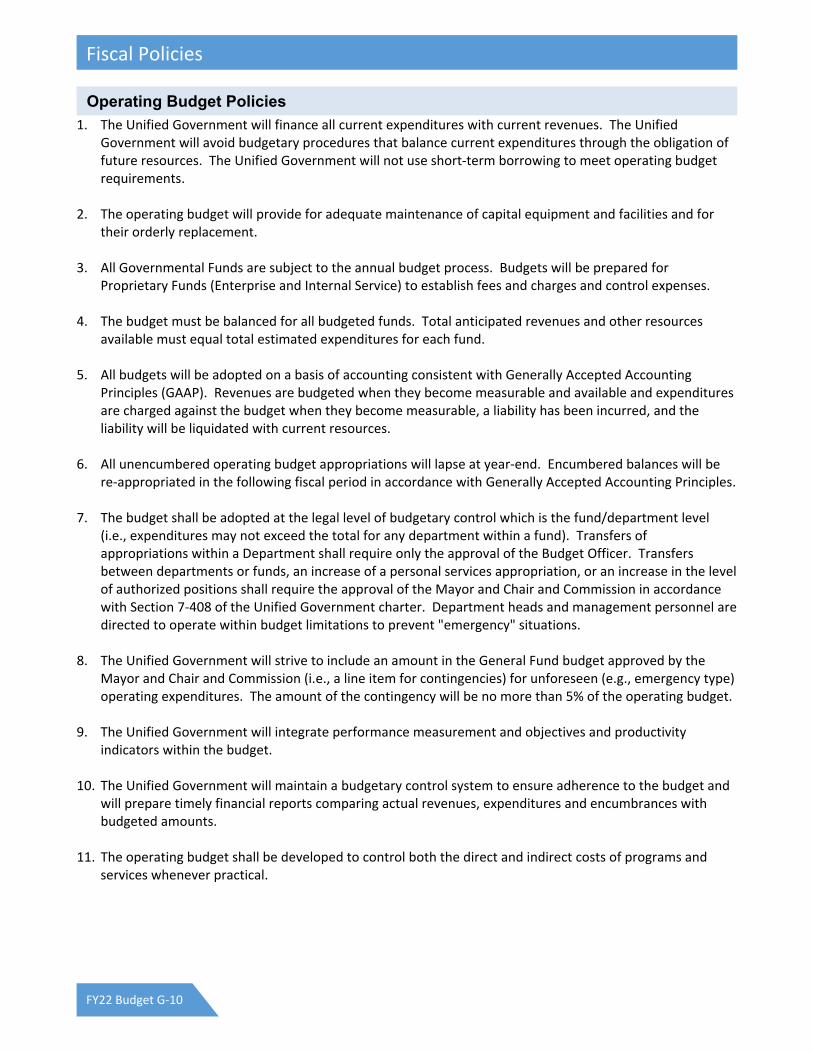
1. The Unified Government will finance all current expenditures with current revenues. The Unified
Government will avoid budgetary procedures that balance current expenditures through the obligation of future resources. The Unified Government will not use short‐term borrowing to meet operating budget requirements.
2. The operating budget will provide for adequate maintenance of capital equipment and facilities and for
their orderly replacement. 3. All Governmental Funds are subject to the annual budget process. Budgets will be prepared for
Proprietary Funds (Enterprise and Internal Service) to establish fees and charges and control expenses. 4. The budget must be balanced for all budgeted funds. Total anticipated revenues and other resources
available must equal total estimated expenditures for each fund. 5. All budgets will be adopted on a basis of accounting consistent with Generally Accepted Accounting
Principles (GAAP). Revenues are budgeted when they become measurable and available and expenditures are charged against the budget when they become measurable, a liability has been incurred, and the liability will be liquidated with current resources.
6. All unencumbered operating budget appropriations will lapse at year‐end. Encumbered balances will be
re‐appropriated in the following fiscal period in accordance with Generally Accepted Accounting Principles. 7. The budget shall be adopted at the legal level of budgetary control which is the fund/department level
(i.e., expenditures may not exceed the total for any department within a fund). Transfers of appropriations within a Department shall require only the approval of the Budget Officer. Transfers between departments or funds, an increase of a personal services appropriation, or an increase in the level of authorized positions shall require the approval of the Mayor and Chair and Commission in accordance with Section 7‐408 of the Unified Government charter. Department heads and management personnel are directed to operate within budget limitations to prevent "emergency" situations.
8. The Unified Government will strive to include an amount in the General Fund budget approved by the
Mayor and Chair and Commission (i.e., a line item for contingencies) for unforeseen (e.g., emergency type) operating expenditures. The amount of the contingency will be no more than 5% of the operating budget.
9. The Unified Government will integrate performance measurement and objectives and productivity
indicators within the budget. 10. The Unified Government will maintain a budgetary control system to ensure adherence to the budget and
will prepare timely financial reports comparing actual revenues, expenditures and encumbrances with budgeted amounts.
11. The operating budget shall be developed to control both the direct and indirect costs of programs and
services whenever practical.
Operating Budget Policies
Fiscal Policies
FY22 Budget G-10

12. The Unified Government shall comply with all state laws applicable to budget hearings, public notices,
public inspection, and budget adoption. 13. Enterprise and Internal Service fund budgets shall be self supporting whenever possible. Excess revenues
of Enterprise funds shall not be transferred to other funds unless authorized in the Annual Budget.
1. Capital projects will be undertaken to:
A. Preserve infrastructure and public facilities. B. Promote economic development and enhance the quality of life. C. Improve the delivery of services. D. Preserve community and historical assets. E. Improve economically depressed areas and those with low and moderate income households.
2. The Unified Government will develop a five year Capital Improvement Program (CIP) and update the CIP
annually to direct the financing of and appropriations for all capital projects. The Unified Government defines a capital project for inclusion in the CIP as any asset or project in excess of $30,000 with an estimated useful life of three years.
3. The Unified Government will coordinate the development of the Capital Improvement Program with the
development of the operating budget to insure that future operating costs are projected and included in the operating budget where appropriate.
4. The Unified Government will develop a program to replace authorized vehicles and equipment without
significant impact to the capital budget.
5. The Unified Government will aggressively seek public and private grants, contracts, and other outside sources of revenue to fund projects included in the Capital Improvement Program.
6. The balances of appropriations for capital projects will be designated by management at yearend and re‐
appropriated in the following years until the project is completed.
7. Proprietary Funds will depreciate capital assets in accordance with GAAP and all annual depreciation amounts available from earnings will be appropriated for replacement of existing capital plant and equipment.
8. Unreserved, undesignated fund balances for governmental funds should be used only for one time capital
non‐operating expenditures as appropriated by governing authority.
1. The Unified Government will strive to maintain a General Fund Unassigned Fund Balance at least equal to
two months (16.8%) of annual General Fund operating expenditures plus transfers out to other funds. This Unassigned Fund Balance amount shall be created and maintained to:
A. Mitigate current and future risks (e.g., revenue shortfalls and unanticipated expenditures). B. Ensure stable tax rates. C. Provide a sufficient cash balance for current financial needs.
Capital Budget Policies
Reserve Fund Policies
Fiscal Policies
FY22 Budget G-11

The conditions that warrant the use of Unassigned Fund Balance below the policy level include: A. An economic downturn resulting in revenue receipts below budget. B. An unforeseen catastrophic event. C. One‐time policy decision to meet a specific Commission determined need.
The Unified Government will replenish the Unassigned Fund Balance within two fiscal years through a means or combination of means approved by the Mayor and Commission.
2. The Unified Government will maintain reserves in compliance with all debt service requirements to
maintain bond ratings and the marketability of bonds.
3. The Unified Government will accumulate sufficient cash reserves in Enterprise Funds to equal three months of operating expenses to provide sufficient working capital without short‐term borrowing.
4. In periods of economic decline and recessionary periods, the Unified Government will reduce expenditures
and direct reserve funds using the following sequence of actions:
A. Reduce or eliminate current year funding for the Capital Additions and Improvements Program; B. Reduce or eliminate current year funding for Capital Maintenance and Repair projects and fund
essential Maintenance and Repair Projects; C. Utilize General Fund Unassigned Fund Balance to sustain essential services; D. And if necessary, reduce essential services
1. The Unified Government will try to maintain a diversified and stable revenue system to shelter it from
short‐run fluctuations in any one revenue source. The revenue mix should combine elastic and inelastic revenue sources to minimize the effect of an economic downturn.
2. The Unified Government will estimate its revenues by an objective analytical process in a prudent manner.
3. The Unified Government will follow a policy of paying for services with user charges when possible to
reduce the reliance on taxes and other general revenue sources.
4. The Unified Government will aggressively seek public and private grants, contracts, and other outside sources of revenues for funding projects where appropriate.
5. The Unified Government will establish the levels of all user charges based on an analysis of the cost of
providing the services. User charges will be evaluated annually.
6. The Unified Government will set fees charges for each Enterprise and Internal Service Fund, at a level that fully supports the total direct and indirect cost of the activity. Indirect costs include the cost of annual depreciation of capital assets and requirements for future capital costs.
1. An independent audit in compliance with Generally Accepted Audit Standards will be performed annually
by a qualified external auditor in accordance with GA. Code 36‐81‐7 and Section 7‐411 of the charter.
Revenue Administration Policies
Accounting, Auditing, & Financial Reporting
Fiscal Policies
FY22 Budget G-12

2. The Unified Government will maintain a strong internal audit function to conduct: financial, operational,
compliance, and performance audits.
3. The Unified Government will prepare a Comprehensive Annual Financial Report in accordance with Generally Accepted Accounting Principles (GAAP). The Unified Government will strive to prepare the Comprehensive Annual Financial Report to meet the standards of the GFOA Certificate of Achievement in Financial Reporting Program.
4. The Unified Government will establish and maintain a high degree of accounting practice, accounting
systems will conform to Generally Accepted Accounting Principles.
5. The Unified Government will maintain accurate records of all assets to insure a high degree of stewardship for public property.
6. The Unified Government will develop an ongoing system of financial reporting to meet the needs of the
governing authority, the manager, department heads, and the general public. Reporting systems will monitor the cost of providing services where possible. The reporting systems will promote budgetary control and comparative analysis.
1. The Unified Government will confine long‐term borrowing to capital improvements and moral obligations.
2. The Unified Government will not use short‐term debt for operating purposes.
3. The Unified Government will follow a policy of full disclosure on every financial report and bond
prospectus.
4. General obligation debt will not be used for enterprise activities.
5. The Unified Government will use voted general obligation debt to fund general purpose public improvements which cannot be financed from current revenues, available fund balances, or other current sources of capital financing.
6. Enterprise Fund debt will be used only when revenues are sufficient to satisfy operating expenses and debt
service requirements.
7. The Unified Government will limit the use of lease purchase and other short term debt when possible.
1. The Unified Government will maintain an aggressive program of investing all government funds under the
direction of the Manager or designate.
2. All investments shall be made with consideration for environmental and human rights impact.
3. The investment program shall be operated based on the following principles, in the order listed.
A. Legality ‐ all investments comply with state and local laws. B. Safety ‐ principal is protected from loss with secure investment practices and collateralization.
Debt Policies
Investment Policies
Fiscal Policies
FY22 Budget G-13

C. Liquidity ‐ investments are readily convertible to cash when needed without losses. D. Yield or Return on Investment ‐ earnings are maximized without diminishing the other principles.
4. The investment program shall comply with all Georgia laws and federal/state regulations for investing
public funds and safekeeping/security requirements.
5. The investment program should use a competitive selection process for investments in excess of 30 days. Investments should be placed with only qualified financial institutions.
6. The investment program should provide for a system of internal control over investments and timely
financial reporting over investing activities.
1. It is the intent of the governing authority of the Unified Government of Athens‐Clarke County, Georgia, to
establish uniform regulations and procedures to provide for an efficient and fiscally responsible system for the purchase of materials and services necessary for the effective operations of the Unified Government. The administration of this system will comply with the highest ethical and fiscal standards and applicable laws.
2. The Manager shall be responsible for the operation of the Unified Government's purchasing system.
3. All departments and agencies of the Unified Government must utilize competitive bidding procedures, as
specified in an ordinance adopted by Commission. Bids will be awarded on a nondiscriminatory basis with appropriate efforts to include local and minority businesses.
4. The Unified Government will strive to obtain the highest quality of goods and services for the most
economical costs. Bulk purchases, quantity discounts, standardization of common items, and other approaches will be used to economically acquire goods and services.
Purchasing Policies
Fiscal Policies
FY22 Budget G-14

FY22 Schedule of Fees & ChargesApproved by Mayor & Commission on June 15, 2021 and effective July 1, 2021
FY22 Budget G-15

Subject Fee / Unit
1 Reclaiming a neutered or spayed dog or cat
$25 first impound;
$30 second impound;
$35 subsequent impounds
2 Reclaiming an intact dog or cat$25 fee if owner chooses to get animal altered
through the free community Athens pets program.
Animal Control must transport animal to surgery.
3 Boarding fee$5/day + cost of inoculations and any vet
services
4 Adoptions
$25 Special Event fee; $100 Adult large dogs; $150
dogs under six months and or 25lbs; $50 dogs in
shelter over 30 days; $25 adult cats; $50 kittens
under six months
5 Adoption refund upon proof of neutering$0.00 ‐ Reduction included in reclaiming an intact
animal if animal is altered
6 Registering a Potentially Dangerous Dog, Dangerous Dog, or Vicious dog $100/annually
Subject Fee / UnitRamp Fees
1 Twin Piston ‐ Small $25 per aircraft
2 Twin Piston ‐ Medium $45 per aircraft
3 Twin Piston ‐ Large $125 per aircraft
4 Turbo Prop ‐ Small $95 per operation
5 Turbo Prop ‐ Medium $115 per operation
6 Turbo Prop ‐ Large $140 per operation
7 Jet ‐ Small $140 per operation
8 Jet ‐ Medium $190 per operation
9 Jet ‐ Large $450 per operation
10 Jet ‐ Extra Large $650 per operation
11 Jet ‐ Air Force One FREE
12 Helicopter $40 per operation
13 Airship Mooring Fee (Blimp) $185 per night
Minimum Fuel Purchase to waive Ramp Fees based on current market prices - adjusted by Airport Director
14 Twin Piston ‐ Small 30 gallons
15 Twin Piston ‐ Medium 40 gallons
16 Twin Piston ‐ Large 100 gallons
17 Turbo Prop ‐ Small 90 gallons
18 Turbo Prop ‐ Medium 125 gallons
19 Turbo Prop ‐ Large 150 gallons
20 Jet ‐ Small 150 gallons
21 Jet ‐ Medium 200 gallons
22 Jet ‐ Large 450 gallons
23 Jet ‐ Extra Large 650 gallons
24 Airship Mooring Fee (Blimp) 60 gallons
Landing Fees25 Commercial Operations ‐ Based on Max Gross Landing Weight $2.80 per 1,000 lbs.
Baggage Handling Fees - Passenger Capacity26 20 $250 per aircraft
27 30 $275 per aircraft
ANIMAL SERVICES
BEN EPPS AIRPORT
FY22 Schedule of Fees & Charges
FY22 Budget G-16
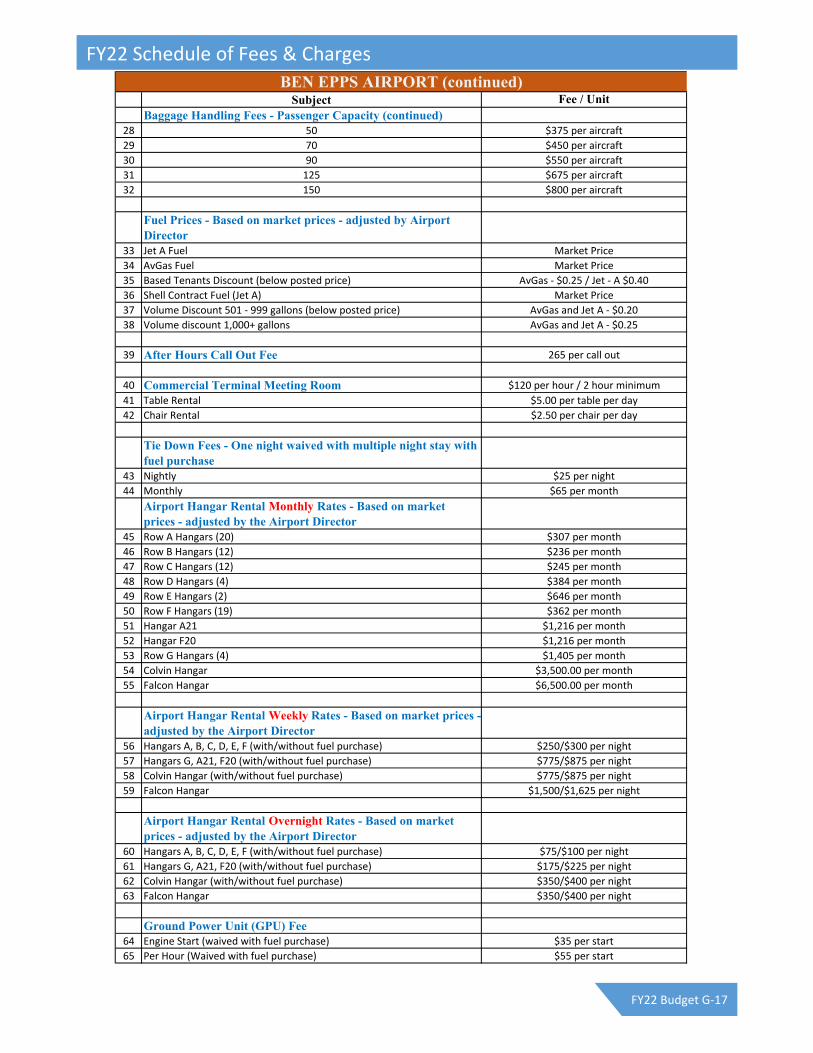
Subject Fee / UnitBaggage Handling Fees - Passenger Capacity (continued)
28 50 $375 per aircraft
29 70 $450 per aircraft
30 90 $550 per aircraft
31 125 $675 per aircraft
32 150 $800 per aircraft
Fuel Prices - Based on market prices - adjusted by Airport Director
33 Jet A Fuel Market Price
34 AvGas Fuel Market Price
35 Based Tenants Discount (below posted price) AvGas ‐ $0.25 / Jet ‐ A $0.40
36 Shell Contract Fuel (Jet A) Market Price
37 Volume Discount 501 ‐ 999 gallons (below posted price) AvGas and Jet A ‐ $0.20
38 Volume discount 1,000+ gallons AvGas and Jet A ‐ $0.25
39 After Hours Call Out Fee 265 per call out
40 Commercial Terminal Meeting Room $120 per hour / 2 hour minimum
41 Table Rental $5.00 per table per day
42 Chair Rental $2.50 per chair per day
Tie Down Fees - One night waived with multiple night stay with fuel purchase
43 Nightly $25 per night
44 Monthly $65 per month
Airport Hangar Rental Monthly Rates - Based on market prices - adjusted by the Airport Director
45 Row A Hangars (20) $307 per month
46 Row B Hangars (12) $236 per month
47 Row C Hangars (12) $245 per month
48 Row D Hangars (4) $384 per month
49 Row E Hangars (2) $646 per month
50 Row F Hangars (19) $362 per month
51 Hangar A21 $1,216 per month
52 Hangar F20 $1,216 per month
53 Row G Hangars (4) $1,405 per month
54 Colvin Hangar $3,500.00 per month
55 Falcon Hangar $6,500.00 per month
Airport Hangar Rental Weekly Rates - Based on market prices -adjusted by the Airport Director
56 Hangars A, B, C, D, E, F (with/without fuel purchase) $250/$300 per night
57 Hangars G, A21, F20 (with/without fuel purchase) $775/$875 per night
58 Colvin Hangar (with/without fuel purchase) $775/$875 per night
59 Falcon Hangar $1,500/$1,625 per night
Airport Hangar Rental Overnight Rates - Based on market prices - adjusted by the Airport Director
60 Hangars A, B, C, D, E, F (with/without fuel purchase) $75/$100 per night
61 Hangars G, A21, F20 (with/without fuel purchase) $175/$225 per night
62 Colvin Hangar (with/without fuel purchase) $350/$400 per night
63 Falcon Hangar $350/$400 per night
Ground Power Unit (GPU) Fee64 Engine Start (waived with fuel purchase) $35 per start
65 Per Hour (Waived with fuel purchase) $55 per start
BEN EPPS AIRPORT (continued)
FY22 Schedule of Fees & Charges
FY22 Budget G-17

Subject Fee / UnitTowing Fee
66 Single Engine $30 per tow
67 Twins $35 per tow
68 Airplane Lavatory Cleaning Fee $125 per service
69 Air Stair Fee $375 per service
70 Unimproved Land Lease Rate (no utilities) $0.38 per square foot
71 Improved Land Lease Rate (with utilities) $0.42 per square foot
Subject Fee / UnitPermits
1 Building Permit $80 plus $3 per $1000 of valuation
2 Electrical Permit $80 plus $2 per circuit
3 Plumbing Permit $80 plus $2 per fixture
4 Mechanical Permit $80 plus $2 per supply and return
5 Gas Permit $80 plus $2 per fixture
6 Plan Submittal Fee
$375 for project values up to $10,000;
Project values over $10,000 fee of $500 for
up to 50 plan sheets plus $2 per sheet over
50 sheets
7 Plan Review FeeOne‐half building permit fee ($80
minimum)
8 Demolition Permit $80
9 Demolition Permit ‐ Central Business District $130
10 Swimming Pool Permit $250 per pool flat fee
11 Temporary Certificate of Occupancy $100
12 Temporary Building Permit $80
13 Class A Manufactured Home Permit $80 plus $3 per $1000 of valuation
14 Class B Manufactured Home Permit $80
15 Manufactured Home Pre‐Moving Inspection $80 plus $0.45 per mile
16 Building Relocation Permit $100
17 Fire Protection Systems (sprinkler) Permit $80
18 Private water and sewer system Permit $80 each
Inspection Fees (applies to all inspection types)19 First Trip $35
20 Second Trip $50
21 Third and subsequent trips $75
Other Mechanical Permits22 Duct work Repair $80
23 Exhaust over one HP $80 each
24 Freestanding Unit $80 plus $2 each unit
25 Floor Furnace $80 plus $2 each unit
26 Wall Furnace $80 plus $2 each unit
27 Steam System $80 plus $2 each radiator
28 Refrigeration $80 plus $2 per ton
29 Grease/Vent Hoods $80 plus $80 per hood
BEN EPPS AIRPORT (continued)
BUILDING INSPECTION
FY22 Schedule of Fees & Charges
FY22 Budget G-18

Subject Fee / Unit30 Incinerator
31 Fireplaces and Wood Stoves $80 per unit
32 Construction Board of Appeals Hearing $80 each
33 After hours inspection fee $250
34 Work without permit fee $80 per hour (2 hour minimum)
35 Secured Structure $250
36 Temporary Secured Structure $50
37 Signs $75 plus $10 per $1,000
38 Copies $0.10 per page
39 Temporary Signs $30
40 Construction Valuation Table See Exhibit A at end of schedule
Subject Fee / UnitSpecial Events
1 Application Fee $25.00
2 Beer and/or Wine Special Outdoor Café Area$150 (up to 150 people); $300 (up to 300
people)
3 Home‐brew Special Event $50.00
Special Sales4 Farmer's Market (assigned locations) $100.00
5 Mobile Food Vendor Unit $515.00
6 Street Merchant Assigned Location $100.00
7 Sidewalk Sale $25.00
8 Individual Merchant Identification/Badge $20.00
9 Replacement Merchant Identification/Badge $15.00
Sidewalk Cafes10 Annual Permit Fee $100 + $1/S.F.
Publication Racks11 Annual Permit Fee $65/rack
Public Use of Government Facilities12 Application Fee $10.00
13 Security Fee $25 (if after normal operating hours)
14 Utility Fee $5/hour (if after normal operating hours)
15 Cleanup/Damage Deposit$25 (1‐25 people) / $50 (26‐50 people) /
$100 (51+ people)
On-Street Parking16 Parking Meters $1.50/hour
18 Downtown construction permit parking $10/space /day; $50 for violation
19 Legal Parking Zone Violation ‐ Expired Meter or Display Ticket $20.00
20 Legal Parking Zone Violation ‐ Overtime Parking $25.00
21 Legal Parking Zone Violation ‐ Loading Zones $50.00
22 Illegal Parking ‐ No Parking Zone $50.00
23 Illegal Parking ‐ In Disable Person Space $200.00
24 Illegal parking ‐ Parking on Sidewalk $30.00
25 Illegal Parking ‐Parking Outside of Designated Space line $50.00
26 Illegal Parking ‐ Double Parking $50.00
27 Illegal Parking ‐ During CBD Restricted Times $20.00
28 Illegal Parking ‐ Fire Lane $100.00
29 Illegal Parking ‐ Violation of Posted Sign ‐ ACCGov Property $50.00
Parking Decks30 Hourly Parking (subject to time limits) $1/hour
31 Monthly Keycard Pass $75/month
CENTRAL SERVICES
BUILDING INSPECTION (continued)
FY22 Schedule of Fees & Charges
FY22 Budget G-19

32 Monthly Keycard Pass (downtown employees) $60/month
33 UGA Football Game Days $25.00
34 Courthouse Deck ‐ Arrive after 7pm and leave before 7am $5.00
35 Courthouse Deck ‐ Arrive after 7pm and leave after 7am $10.00
36 Maximum Daily Fee $10.00
Subject Fee / UnitRoutine Fees
1 Registration Fee (one‐time per sentence) $50.00
2 Room & Board (based on income) billed weekly $90 ‐ $130
3 Parking Permit (one‐year period) $25.00
4 Staff Transportation to/from work (one‐way) $10.00
Disciplinary Report Fees5 Administration Fee (per guilty finding) $4.00
6
Possession of a cellular or wireless device, or a device associated with a
wireless communication device (inside the guard lines) (Fee set by Dept.
of Corrections)
$100.00
7Positive drug screen, or possession of drugs or a drug‐related item (Fee
set by Dept. of Corrections)$200.00
8Positive alcohol screen, or possession of alcohol (Fee set by Dept. of
Corrections)$100.00
9 Escape Fee (Fee set by Dept. of Corrections) $200.00
Other Department Services10 Drug Test (Lab cost) $15.00
11 Bus Ticket ‐ single ride (Transit System Fee) $1.75
Subject Fee / UnitAlcohol License and Permit Fees
1 Class A ‐ Retail Liquor Package $5,000.00
2 Class B ‐ Retail Beer Package $1,000.00
3 Class C ‐ Retail Wine Package $1,000.00
4 Class D ‐ Retail Liquor by the Drink (1) $1,500.00
5 Class E ‐ Retail Beer by the Drink (1) $450.00
6 Class F ‐ Retail Wine by the Drink (1) $450.00
7 Class G ‐ Wholesale Liquor $5,000.00
8 Class H ‐ Wholesale Beer $1,140.00
9 Class I ‐ Wholesale Wine $1,140.00
10 Class J ‐ Licensed Alcoholic Beverage Caterer $600.00
11 Class K ‐ Brewer, Manufacturer or Malt Beverages Only $2,600.00
12 Class L ‐ Brew Pub Operator $600.00
13 Class M ‐ Broker $600.00
14 Class N ‐ Importer $600.00
15 Class O ‐ Hotel In‐Room Service Liquor, Beer, and Wine $600.00
16 Class P ‐ Manufacturer of Wine Only $600.00
17 Class Q ‐ Manufacturer of Distilled Spirits Only $5,000.00
18 Sunday Sales Permit Fee $0.00
19 Wine Tasting Permit Fee $250.00
20 Growler Tasting Permit Fee $250.00
21 After Hours Service Permit Application Fee $60.00
22 Temporary Non‐Profit Alcohol Permit Fee $50.00
23 New Application Fee $400.00
24 Change of Ownership/Management Application Fee $100.00
Alcohol License Late Renewal Payment Penalties25 November 1st to November 15th $200.00
26 November 16th to November 30th $300.00
CORRECTIONS: Diversion Center/Transition Center
FINANCE
CENTRAL SERVICES (continued)
FY22 Schedule of Fees & Charges
FY22 Budget G-20

Subject Fee / Unit
27 After December 1st20% of annual license fee but no less than
$500, whichever is greater
Occupation Tax Certificate (OTC) and Regulatory FeesNumber of Employees (annually)
28 0 ‐1 $50.00
29 2‐3 $131.00
30 4 ‐ 6 $327.00
31 7 ‐10 $540.00
32 11‐15 $780.00
33 16‐20 $959.00
34 21‐35 $1,229.00
35 36‐50 $1,649.00
36 51‐75 $2,038.00
37 76‐100 $2,578.00
38 101‐150 $3,058.00
39 151‐250 $3,567.00
40 251 and over $3,957.00
41 OTC Late Payment Penalty & Interest (State Regulated)10% of amount due + 1.5% monthly
interest
42 Administrative Fee $50.00 annually
43 Professional Services OTC (State Regulated) $400.00
44 Nude Performances $200 new/$150 renewal
45 Massage Parlors$200 new/$150 renewal/$20 annual
individual permit
46 Pawnbrokers $100.00 new/$75.00 renewal
47 Itinerant Merchant $75.00
48 Insurance Company OTC (doing business in county) (State Regulated) $150.00
49 Insurance Company owned branch location (State Regulated) $35 per branch in excess of one location
50 Independent Insurance Agencies / Brokers (State Regulated) $35.00 each branch
51Loan Companies that sale, offer, solicit or take applications for insurance
in connection with loans (State Regulated)
$10.00 or 35% of the company license fee,
whichever is greater, per location per year
52 Trade and Merchandise Shows (Promoters or Operators) $200.00 per event
53 OTC Telephone Tax3% of recurring local service revenues (paid
quarterly)
Other Taxes
54 Financial Institutions Tax (State Regulated)Greater of 0.25% of gross receipts or
$1,000
55Insurance Premium Tax (State Regulated) (Collected and Remitted by
State Insurance Commissioner)
1% Premium Tax for life, accident and
sickness insurance policy gross direct
premiums / 2.5% Premium Tax for all other
gross direct premiums
Excise Taxes56 Mixed Drink Consumption on Premises (State Regulated) 3% gross sales of distilled spirits
57 Hotel Motel (State & Local Regulated) 7% of Taxable Sales
58 Motor Vehicle Rentals (State Regulated) 3% of Taxable Sales
Wholesale Excise Tax (State Licensed Wholesalers)
59 Malt Beverage (including Breweries) (State Regulated)
5 Cents per 12 oz. container/$6.00 per 15
1/2 gallon barrel/$12.00 per 31 gallon
barrel
60 Wine (State Regulated) 22 Cents per Liter
61 Liquor (State Regulated) 22 Cents per Liter
Franchise Fees 62 Cable & Video Services (State Regulated) 5% of gross revenue
63 Electric (EMC) 4% of gross sales in county / annual
64 Electric (GA Power) ‐ Regulated by Public Service Commission Paid Annually
65 Gas (Southern Company) ‐ Regulated by Public Service Com. quarterly
FINANCE (continued)
FY22 Schedule of Fees & Charges
FY22 Budget G-21

Subject Fee / UnitOther Fees
66 Returned Checks $20.00
Rental FeesFacility Rentals and Admissions
1 Bank of 3 Tennis Courts $24.00 / Per Hour
2 Outdoor Basketball Courts $16.00 / Per Hour
3 Cleaning Deposit ‐ Indoor Space No Kitchen $50
4 Cleaning Deposit‐Indoor or Outdoor Space with Kitchen $70
5 BBQ Building/Picnic Shelter‐‐Medium $100
6 BBQ Building/Picnic Shelter‐‐Medium $90.00 / 8 Hour Block
7 Campfire Ring $20.00 / 8 Hour Block
8 Concession Stand $100.00 / Per Day
9 Conference Room/Multi‐Purpose Room/Classroom $20.00 / Per Hour ‐ 2 hr. min
10 Dance Center Presentation Hall $100.00 / Per Hour ‐ 2 hr. min
11 Dance Studios $50.00 / Per Hour ‐ 2 hr. min
12 Dance Center Lobby $25.00/Per Hour ‐ 2 hr. min.
13 Exhibit Hall ‐ SCNC $100.00/ Per Hour ‐ 2 hr. min.
14 Full Classrooom ‐ SCNC $50.00/ Per Hour ‐ 2 hr. min.
15 Sandy Creek Park Admission $2.00 per person
16 Sandy Creek Park Horse Admission $2.00 per horse
17 Sandy Creek Park Pass $30 resident / $50 non‐resident
18 Sandy Creek Park Dog Park Reservation $1.00 / Per Hour Per dog
19 Sandy Creek Park Dog Park Punch Card $10 for 12 punches
20 Sandy Creek Park Disc Golf Play $1.00 per person
21 Sandy Creek Park Disc Golf Punch Card $10 for 12 punches
22 Gymnasium $50.00 / Per Hour ‐ Athletic Use
23 Gymnasium $75.00 / Per Hour ‐ Non‐Athletic
24 Kitchen $100.00 / Per Day
25 Large Multi‐Purpose Room $50.00 / Per Hour ‐ 2 hr. min
26 Multi‐Purpose Fields $50.00 / 4 Hour Block
27 Multi‐Purpose Fields $100.00 / 8 Hour Block
28 Outdoor Classroom‐‐Special Event ‐ SCNC $40.00 / 4 Hour Block
29 Outdoor Classroom‐‐Special Event ‐ SCNC $60.00 / 8 Hour Block
30 Pavilion/Community Building $225.00 / 8 Hour Block
31 Picnic Shelter‐‐Small $50.00 / 4 Hour Block
32 Picnic Shelter‐‐Small $75.00 / 8 Hour Block
33 Quinn Hall $75.00 / Per Hour ‐ 2 hr. min
34 Quinn Hall‐Damage Deposit $250.00 / Per Rental
35 Recreation Hall $150.00 ‐ 2 hr. min / $75.00 each add. Hr.
36 Softball/Soccer Fields $100.00 / 4 Hour Block
37 Softball/Soccer Fields $150.00 / 8 Hour Block
38 Tennis Courts $8.00 / Per Hour
39 Tennis Center Whole Complex $200.00 / Per Day
40 Walker Hall Complex $50.00 / Per Hour
41 Pool Pass ‐ Family $40.00 / Season
42 Pool Pass ‐ Single $20.00 / Season
43 Pool Pass Family of 4 $40.00
44 Lyndon House Open Studio Pass $65.00 / month
Morton Theatre
45 Conference Room$30.00 / Per Hour, Per Day with Event
Rental
46 E. D. Harris Pharmacy$90.00 / Per Hour, One‐Time with Event
RentalMorton Theatre / Auditorium
47 Full Day Rate: Mon‐Wed $575.00 / 9:00 AM ‐ 11:00 PM
48 Full Day Rate: Thu‐Sun $770.00 / 9:00 AM ‐ 11:00 PM
49 Half‐Day Rate, Evening Hours: Mon‐Wed $550.00 / 4:00 PM ‐ 11:00 PM
LEISURE SERVICES
FINANCE (continued)
FY22 Schedule of Fees & Charges
FY22 Budget G-22

Subject Fee / Unit50 Half‐Day Rate, Evening Hours: Thu‐Sun $640.00 / 4:00 PM ‐ 11:00 PM
51 Half‐Day Rate, Matinee Hours: Mon‐Wed $440.00 / 9:00 AM ‐ 4:00 PM
52 Half‐Day Rate, Matinee Hours: Thu‐Sun $500.00 / 9:00 AM ‐ 4:00 PM
53 Hourly Rate ‐ Early Hours: Mon‐Wed$80.00 / Per Hour, 9:00 AM ‐ 4:00 PM, Non‐
Event Usage
54 Hourly Rate ‐ Late Hours: Mon‐Wed$90.00 / Per Hour, 4:00 PM ‐ 11:00 PM,
Non‐Event Usage
55 Hourly Rate ‐ Early Hours: Thu‐Sun$90.00 / Per Hour, 9:00 AM ‐ 4:00 PM, Non‐
Event Usage
56 Hourly Rate ‐ Late Hours: Thu‐Sun$100.00 / Per Hour, 4:00 PM ‐ 11:00, non‐
event usage
57 Hourly Rate ‐ Additional Hours $150.00 / Per Hour, 11:00 PM‐9:00
Lyndon House Arts Center
58 Atrium $280.00 / Per Hour ‐ 2 hr. min
$70.00 each additional hr.
59 Lounge $60.00 / Per Hour ‐ 2 hr. min
$15.00 each additional hr.
60 Multi‐Purpose Room $90.00 / Per Hour ‐ 2 hr. min
$20.00 each additional hr.
61 Terrace & Back Lawn $120.00 / Per Hour ‐ 2 hr. min
$30.00 each additional hr.
62 Ware‐Lyndon House Front Lawn & Garden $120.00 / Per Hour ‐ 2 HR Min
$30.00 each additional hr.
63 Kitchen $100.00 / Flat fee when added to any other room
64 Wedding Package$600.00 / Per Hour ‐ 2 hr. min $145
each add. hr.
Birthday Party65 Party Packages $80.00 ‐ $200.00
Equipment Rentals66 10 Chairs $25.00 / Per Day + Delivery Fee
67 10'x10' Tent $60.00 / Per Day + Delivery Fee
68 20'x20' Tent $110.00 / Per Day + Delivery Fee
69 25 Barricades $50.00 / Per Day + Delivery Fee
70 4'x8'x16' Stage Platforms $20.00 / Per Unit
71 5 Tables $25.00 / Per Day + Delivery Fee
72 Bleached White Backdrop $30.00 / Per Event
73 Canoes/Kayaks $15.00 / Per Day
74 Canoes/Kayaks $8.00 / Per Hour / $2 each add hr.
75 Concert Baby Grand $25.00 / Per Day
76 Cymbals $30.00 / Per Day
77 Discovery Box $5.00 / 2 Weeks
78 DLP Projector $50.00 / Per Day
79 Drum Kit $90.00 / Per Day
80 Follow spots $30.00 / Per Unit Per Day
81 Gobos $15.00 / Per Item
82 Handheld Wireless Microphone $30.00 / Per Unit Per Day
Equipment Rentals (continued)83 Marley Floor $50.00 / Per Event
84 Mirror (Disco) Ball $30.00 / Per Event
85 Mobile Sound System $120.00 / Per Event
86 Mobile Stage $800.00 / Per Day / with Set‐Up
Mobile Stage Damage Deposit $200.00
87 Stage Extension ‐ 4x16 $330.00 / Per Day / with Set‐Up
88 Tennis Ball Machine $10.00 / Per Hour
Electric Piano $100.00/Event
LEISURE SERVICES (continued)
FY22 Schedule of Fees & Charges
FY22 Budget G-23

Subject Fee / Unit89 Upright Piano $150.00 / Per Day
90 Wireless Body Microphone $30.00 / Per Unit Per Day
Special Events91 Alcohol Fee‐Indoor Event $50.00 / 50 Attendees or Less
92 Alcohol Fee‐Indoor Event $150.00 / 51 Attendees or More
93 Alcohol Fee‐Outdoor Event $150.00/ < 2000 SF Serving Area
94 Alcohol Fee‐Outdoor Event $300.00/ < 4000 SF Serving Area
95 Electricity $5.00 / Per Hour
96 Event Staffing‐‐After Regular Hours $35.00 / Per Staff Per Hour
97 Event Staffing‐‐During Regular Hours $15.00 / Per Staff Per Hour
98 Field Lights $25.00 / Per Hour Per Field or Bank
99 Field Prep $25.00 / Per Staff Per Hour
100 Special Event Application Fee $25.00 / Per Event
101 Special Event Impact Fees $100 ‐ $1000 / Per Event/Size/Location
102 Technician Support $18.00 / Per Hour
103 Outdoor Movie Screen Package ‐ ACCGov only $1,000/ 5 hrs/ $125.00 ea. Add. Hr.
Program FeesNote: Non‐resident charges for programs are 150% of fee listed,
rounded up to the nearest dollar.
Team Sports104 Adult Athletic Leagues $100.00 ‐ $500.00 / Season
Adult105 Athletic Programs ‐ Adults $10.00 ‐ $60.00
106 Performing Arts Programs ‐ Adults $35.00 ‐ $115.00
107 Visual Arts Program ‐ Adults $45.00 ‐ $130.00
108 General Recreation & Nature Programs ‐ Adults $0.00 ‐ $40.00
All Ages 109 Family Programs $2.00 ‐ $35.00
Youth 110 Athletic Leagues ‐ Youth $65.00 / Season
111 Athletic Programs ‐ Youth $5.00 ‐ $65.00
112 Gymnastics Programs $35.00 ‐ $140.00
113 Competitive Gymnastics $60 ‐ $120 / Month
114 General Recreation and Nature Programs ‐ Youth $0.00 ‐ $60.00
115 Performing Arts Programs ‐ Youth $5.00 ‐ $115.00
116 Visual Arts Programs ‐ Youth $15.00 ‐ $65.00
117 Holiday Programs $0.00 ‐ $10.00
118 Outreach Programs ‐ Nature Center and Bear Hollow $0.00 ‐ $100.00
Special Event Programs119 Department Special Events $0.00 ‐ $10.00 Admission Fee
120 Leisure Services Community‐Wide Events $0.00 ‐ $10.00 Admission Fee
Youth Summer Camps121 Mini Camps $15 ‐ $90 / week
122 Day Camps $40 ‐ $175 / week
Merchandise for Sale 123 Merchandise for Sale $1.00 ‐ $50.00
General Business1 Community Garden Application $50.00/$10 renewal
2 Home Occupation Application $20.00
3 Neighborhood Notification Registration Form $0.00
4 Prescribed Grazing Application $20.00
LEISURE SERVICES (continued)
PLANNING
FY22 Schedule of Fees & Charges
FY22 Budget G-24

Subject Fee / Unit5 Sign Review Application $25.00
Construction/Development6 Changes to Approved Permit Plans $55.00
7 Concept Review $55.00
8 Demolition / Relocation Review ‐ Non‐Exempt $90.00
9 Demolition / Relocation Review ‐ Exempt $25.00
10 Environmental Areas Permit $25.00
11 Planning Department Inspection $50.00
12 Plans Review Application / Plans Review Handbook See Plans Review Fee Calculator
13 Plans Review Revision Submittal Form See Revision Fee Calculator
14 Revision Submittal Form $25.00 (except plans review)
15 Timber Harvesting Notification $0.00
16 Tree Management Plan Application $65.00
17 Telecommunication Facility Registration $35.00
18 Temporary Telecommunication Facility Permit $105.00
19 Zoning Permit ‐ new single family & additions over 50% $80.00
20 Zoning Permit ‐ all other work $25.00
21 Billboard Application $25.00
Plats/Subdivisions22 Preliminary Plat $100 plus $10 per lot
23 Final Plat ‐ Four lots or less $75 plus $10 per lot
24 Final Plat ‐ More than four lots $150 plus $10 per lot
25 Subdivision Site Review See Plans Review Fee Calculator
Boards & Commissions26 Appeals of Appointed Board Rulings $150.00
Hearings Board 27 Variance ‐ Community Tree Management $225.00
28 Variance ‐ Flood Protection $225.00
29 Variance ‐ Flood plain & Riparian Buffer Areas $225.00
30 Variance ‐ Signs $225.00
Hearings Board (continued)31 Variance ‐ Zoning & Development Standards $225.00
32 Variance ‐ Storm Water Management Standards $225.00
33 Variance ‐ Waiver ‐ Forest Management Activity $225.00
Historic Preservation Commission34 Certificate of Appropriateness ‐ Staff Review $25.00
35 Certificate of Appropriateness ‐ Minor Projects $55.00
36 Certificate of Appropriateness ‐ Major Projects $505.00
37 Conceptual Preliminary Design Review
38 Historic Preservation Tax Freeze Application
Certificate of Appropriateness ‐ Moderate $155.00
Planning Commission39 Planned Development Application $1,600.00
40 Rezone Application ‐ Type I $1,300.00
41 Rezone Application ‐ Type II $650.00
42 Special Use Application ‐ Type I $1,350.00
43 Special Use Application ‐ Type II $850.00
44 Variance Application $225.00
45 Alternative Compliance Application ‐ Type III $150.00
46 Concept Review Application ‐ Type III $150.00
47 Administrative Action Application $50.00
PLANNING
FY22 Schedule of Fees & Charges
FY22 Budget G-25

Subject Fee / Unit48 Pre‐Application Conference $0.00
Prints/Copies/MapsCopies
49 8 1/2 X 11 inch, black & white $0.25
50 8 1/2 x 14 inch, black & white $0.50
51 11 x 17 inch, black & white $0.50
GIS Data Viewer Prints52 8 1/2 x 11 inches $0.25
53 8 1/2 x 14 inches $0.50
54 11 x 17 inches $1.00
Special Orders /Color Prints55 8 1/2 X 11 inches $8.00
56 11 x 17 inches $10.00
57 24 x 36 inches $25.00
58 36 x 48 inches $35.00
KIP Copies59 Labor 1st 15 minutes free/then $15 per hr.
60 In‐house, no labor $0.35 per square foot
61 Other items $0.45 per square foot + labor
62 Topo's $2.50 plus labor
Ordinances/Studies/Maps63 Individual Chapters of Development Regulations $5.00
64 Environmental Areas Ordinance $5.00
65 Sign Ordinance $10.00
66 Comprehensive Plan CD $10.00
67 Infill Housing Study (2008) $30.00
68 Zoning Map $35.00
69 Future Development Map $35.00
70 GIS Data Set $50.00
71 ACC Orthophoto Data (seamless or tiles) $50.00
Staff Research72 GIS/graphics research assistance (no maps generated) Free ‐ 1st 30 minutes / then $18 per hr.
73 GIS/graphics research assistance (maps generated) Free ‐ 1st 15 minutes / then $18 per hr.
74 GIS data viewer research Free ‐ 1st 15 minutes / then $18 per hr.
75 Zoning Verification Requests ‐ Simple $25.00
Zoning Verification Requests ‐ Simple $55.00
Open Records Request76 Research, administrative work Free ‐ 1st 15 minutes / then per hr. fee
77 CD / flash drive $10.00
78 Copies 8 1/2 x 11; 8 1/2 x 14 $0.10
79 Copies 11 x 14 $0.75
80 Plans / Maps See Prints / Copies / Maps
1 DVD of Mayor & Commission Meeting $10 + $2 shipping
Water (& Sewer) Service Establishment Fees1 Water Deposit $50.00
2 Service Fee $10.00
3 Same day service $25.00
4 Re‐establish water service $15.00 plus additional expenses
PLANNING (continued)
PUBLIC INFORMATION OFFICE
PUBLIC UTILITIES
FY22 Schedule of Fees & Charges
FY22 Budget G-26

Subject Fee / Unit5 Sewer Deposit $0.00
6 Reinstatement of sewer service $0.00
7 Set Up Trash Service (requires second step with Solid Waste) $10.00
8 Late payment fee 10% of amount due
9 Meter tampering penalty $100.00
Monthly Water Rates: Single Family Residential10 Tier 1: Annual Average (AA)* $5.73 per 1,000 gallons
11 Tier 2: Up to 50% over AA $7.16 per 1,000 gallons
12 Tier 3: Between 51% ‐ 99% over AA $8.60 per 1,000 gallons
13 Tier 4: More than 100% over AA $14.32 per 1,000 gallons
* The minimum Annual Average is 3,000 gallons per month
Monthly Water Rates: Multifamily & Non-Residential 14 Tier 1 for all use $5.73 per 1,000 gallons
Water Monthly Customer Service 15 Water Monthly Customer Service $4.40/ month
Sewer Monthly Customer Service Fee16 Residential sewer use is equal to 100% of water consumption $6.76 per 1,000 gallons
Sewer monthly customer service fee $4.40 / month
Meter Replacement Fee (per month)17 5/8 or 3/4‐inch meter $0.47
18 1‐inch meter $1.05
19 1.5‐inch meter $3.29
20 2‐inch meter $25.55
21 3‐inch meter $34.73
22 4‐inch meter $48.08
23 6‐inch meter $118.47
24 8‐inch meter $156.82
Fire Sprinkler System Charges25 1.5 inch meter $1.00 / month
26 2 inch meter $1.5 / month
27 3 inch meter $2.00 / month
28 4 inch meter $5.00 / month
29 6 inch meter $10.00 / month
30 8 inch meter $15.00 / month
31 10 inch meter $30.00 / month
32 12 inch meter $45.00 / month
Industrial/ Commercial Wastewater Surcharge Rates 33 >250 mg/L Five‐Day Biochemical Oxygen Demand (BOD5) 0.30 per pound
34 >250 Total Suspended Solids (TSS) 0.30 per pound
35 101‐150 Fats, Oil, Grease (FOG) 0.16 per pound
Industrial/ Commercial Wastewater Surcharge Rates (cont.)36 Biological Oxygen Demand 5 > 1,000 mg/L $0.32 per lb.
37 Total Suspended Solids > 1,000 mg/L $0.32 per lb.
38 101‐200 Fats, Oil, Grease (FOG) $0.17 per lb.
39 >200 FOG Maximum Level 0.53 per pound
40 Wastewater discharge permit violation Up to $1,000.00 per violation / day
Fire Hydrant Flow and Pressure Measurement Request41 24 hour chart of pressure measurement $50.00 per chart
42 Fire Flow Static and Residual Flow and Pressure Measurement $50 per measurement
PUBLIC UTILITIES (continued)
FY22 Schedule of Fees & Charges
FY22 Budget G-27
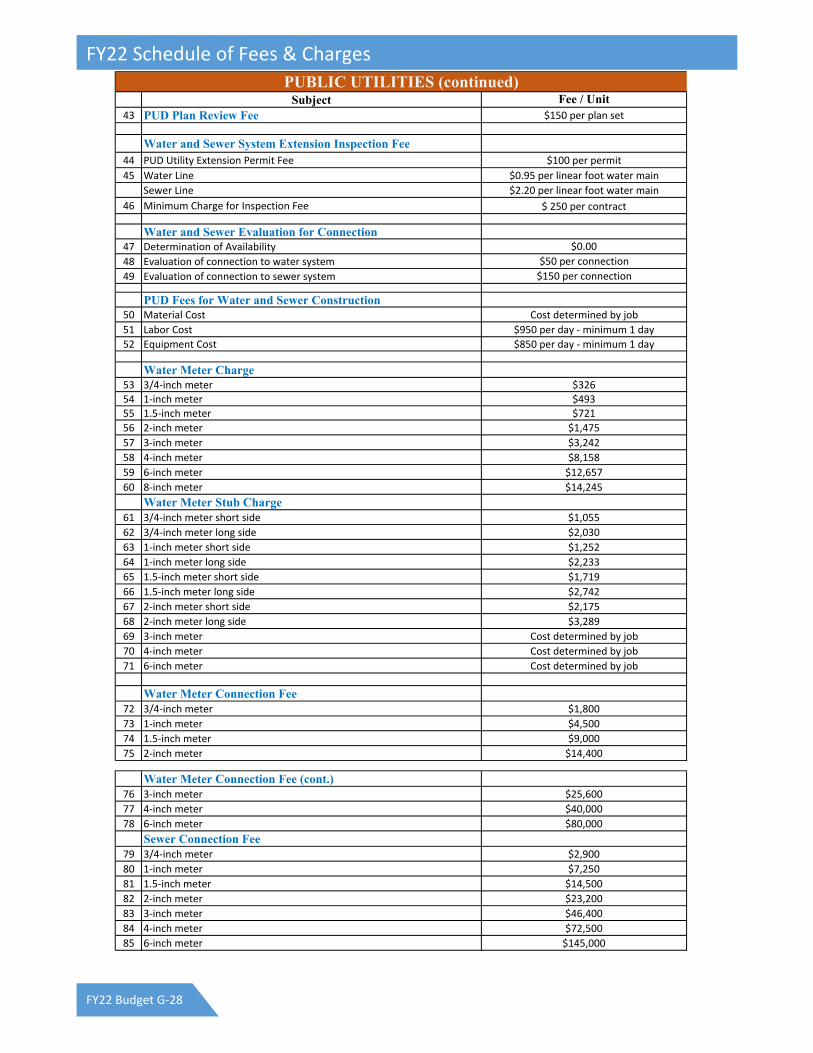
Subject Fee / Unit43 PUD Plan Review Fee $150 per plan set
Water and Sewer System Extension Inspection Fee44 PUD Utility Extension Permit Fee $100 per permit
45 Water Line $0.95 per linear foot water main
Sewer Line $2.20 per linear foot water main
46 Minimum Charge for Inspection Fee $ 250 per contract
Water and Sewer Evaluation for Connection47 Determination of Availability $0.00
48 Evaluation of connection to water system $50 per connection
49 Evaluation of connection to sewer system $150 per connection
PUD Fees for Water and Sewer Construction50 Material Cost Cost determined by job
51 Labor Cost $950 per day ‐ minimum 1 day
52 Equipment Cost $850 per day ‐ minimum 1 day
Water Meter Charge53 3/4‐inch meter $326
54 1‐inch meter $493
55 1.5‐inch meter $721
56 2‐inch meter $1,475
57 3‐inch meter $3,242
58 4‐inch meter $8,158
59 6‐inch meter $12,657
60 8‐inch meter $14,245
Water Meter Stub Charge61 3/4‐inch meter short side $1,055
62 3/4‐inch meter long side $2,030
63 1‐inch meter short side $1,252
64 1‐inch meter long side $2,233
65 1.5‐inch meter short side $1,719
66 1.5‐inch meter long side $2,742
67 2‐inch meter short side $2,175
68 2‐inch meter long side $3,289
69 3‐inch meter Cost determined by job
70 4‐inch meter Cost determined by job
71 6‐inch meter Cost determined by job
Water Meter Connection Fee72 3/4‐inch meter $1,800
73 1‐inch meter $4,500
74 1.5‐inch meter $9,000
75 2‐inch meter $14,400
Water Meter Connection Fee (cont.)76 3‐inch meter $25,600
77 4‐inch meter $40,000
78 6‐inch meter $80,000
Sewer Connection Fee79 3/4‐inch meter $2,900
80 1‐inch meter $7,250
81 1.5‐inch meter $14,500
82 2‐inch meter $23,200
83 3‐inch meter $46,400
84 4‐inch meter $72,500
85 6‐inch meter $145,000
PUBLIC UTILITIES (continued)
FY22 Schedule of Fees & Charges
FY22 Budget G-28

Subject Fee / Unit86 8‐inch meter $232,000
87 Sewer Connection Fee for Multifamily Construction3/4 inch sewer connection fee multiplied by 0.6
multiplied by the number of units.
Sewer Stub Fee88 4‐inch stub $665
89 6‐inch stub $1,200
90 Casing or manhole if required Cost determined by job
Other Fees91 Paving Cut $515
92 Casing or additional amount for paving Cost determined by job
93 Bull Head Connection $100
94 Fire Hydrant Meter Rental
$150 for water usage of 11,200 gallons. Water
usage above 11,220 gallons will be charged per
1,000 gallons at the non‐residential outdoor
water use rate.95 GDOT GUPS Permit Application Fee $130
Septage Disposal (Permitted Companies Only) per calendar year (in dollars per gallon)
96 Portable toilets Calendar Year 2021 ‐ $0.12
Calendar Year 2022 ‐ $0.12
97 Holding tanks Calendar Year 2021 ‐ $0.12
Calendar Year 2022 ‐ $0.12
98 Septage from ACC Calendar Year 2021 ‐ $0.12
Calendar Year 2022 ‐ $0.12
99 Septage from JBOOM Calendar Year 2021 ‐ $0.30
Calendar Year 2022 ‐ $0.31
100 Septage from JBOOM by ACC haulers Calendar Year 2021 ‐ $0.30
Calendar Year 2022 ‐ $0.31
101 Industrial waste ‐ ACC only Calendar Year 2021 ‐ $0.12
Calendar Year 2022 ‐ $0.12
Franchise Fees for Independent Haulers1 Initial Franchise Application Fee $300.00
2 Annual Franchise Renewal Fee $200.00
3 Franchise Decal Fee Per Truck $2.00
Residential Refuse ServicesRoll Cart Service (totals per month) Curbside / Backyard
4 Vacant Rate with active water service $13.60 / N/A
5 20 gal $15.60 / $30.60
6 32 gal $17.60 / $32.60
7 64 gal $21.60 / $36.60
8 96 gal $28.60 / $43.60
9 Two 64 gallon carts $37.60 / $52.60
10 64 & 96 gal $50.60 / $65.60 11 Downtown Residential Service (Lofts in CBD) $48.72
(includes 10 ACC Commercial Trash bags per month)
12 Return Trip Fee $10.00
13 Level Change Fee (1st one within a 12 month period is free) $10.00
14 Pedestrian Trash or Recycling Container TIP (outside CBD) $2.00 per TIP
Commercial Refuse Services
Commercial Curbside (totals per month)1 Outside Downtown - Twice a week service/no food or bar service $26.60
2 Outside Downtown - Three times a week service serving food $32.60
PUBLIC UTILITIES (continued)
SOLID WASTE
FY22 Schedule of Fees & Charges
FY22 Budget G-29

Subject Fee / Unit3 Downtown Service/no food or bar service $32.60
4 Downtown Service serving 1 meal a day $82.60
5 Downtown Service serving 2 or more meals a day $161.60
6Outside Downtown Recycling Services Only - one fixed price for 1 to 5 (96 gallon) carts
$13.60
7 Commercial ACC Trash Bags - bundle of 20 $30.00
8 Commercial ACC Trash Bags - case of 100 $150.00
9 Commercial ACC Recycling Bags $20.00 *If a business orders a case or more of Commercial ACC Trash Bags, Solid Waste will deliver them for no additional charge on Thursdays.
Commercial Dumpster (totals per month)Trash and recycling dumpster(s) included in price
# of Weekly Pickups 2 yd / 4yd / 6 yd / 8 yd
1 1 71.60 / 86.60 / 105.60 / 124.60
2 2 125.60 / 157.60 / 189.60 / 223.60
3 3 181.60 / 226.60 / 275.60 / 323.60
4 4 236.60 / 296.60 / 360.60 / $422.60
5 5 291.60 / 366.60 / 556.00 / 624.60
6 Extra Tip - above current service level 12.00 / 15.28 / 18.52 / 21.76
Recycling dumpster(s) only - dumpster(s) included in price# of Weekly Pickups 2 yd / 4yd / 6 yd / 8 yd
7 1 54.00 / 55.00 / 59.00 / 63.00
8 2 93.00 / 94.00 / 97.00 / 101.00
9 3 132.00 / 133.00 / 137.00 / 140.00
10 4 171.00 / 172.00 / 214.00 / 217.00
11 5 210.00 / 211.00 / 214.00 / 217.00
12 Tipped as trash 12.00 / 15.28 / 18.52 / 21.76
Services with a split dumpster - 8 yd dumpster half trash and half recycling
# of Weekly Pickups13 1 $86.60
14 2 $157.60
Waste Minimization Fee15 Residential Fee $1.20 per month
16 Small Business (Commercial) $8.20 per month
40 Large Business (Commercial) $16.40 per month
41 Institutional (Collegiate) $0.70 per student
Special Pickups42 Pickup for 1 or 2 trash/debris items $35.00 per trip
43 Pickup for 3 or more trash/debris items$75.00 plus the weight of disposal; disposal
is $43.00 per ton
44 Pickup of Leaf & Limb materials$75.00 plus the weight of disposal; disposal
is $25.50 per ton
45 Cooking Grease $3.00 per 5 gallon container
Center for Hard to Recycle Materials (CHaRM)
Residential Customers with loads of mixed material that contain bulbs, batteries, paint, TVs and/or monitors and other hard to recycle items
46 Facility Fee for ACC businesses and residents $2 per trip
47 Facility Fee for non-ACC businesses and residents $5 per trip
48 Batteries $0.36 per pound
49 Cleaners/Chemicals/Fertilizers $5 per gallon
50 Document Destruction $2 per box
51 Light bulbs $0.50 each
52 Plate glass or automotive window $1 per piece
SOLID WASTE (continued)
FY22 Schedule of Fees & Charges
FY22 Budget G-30

Subject Fee / Unit53 Tires $3 per tire
Landfill54 Commercial Trash: $43.00 per ton
55 Residential Trash:$1.50 per bag for up to 6 bags / $10 min.
for 7+ bags / $43 per ton
Leaf & Limb (yard debris)56 Commercial Yard Debris: $25.50 per ton
57 Residential Yard Debris: $25.00 per ton with a $5.00 minimum
Composting Fees58 Event Composting Permit Fee (Managed by Recycling Educators) $25.00 per event
59 Bio solids $50.00 per ton
60 Food scrapes, organics from residential/small commercial sources $25.00 per ton61 Food Scraps Compost Contamination Fee (Glass/metal, etc.) $20.00 per ton
Commercial Composting (restaurants, hair salons, etc.) Total per Month 62 One Collection Per Week63 One 32 Gallon Container $26.60
64 Two 32 Gallon Containers $31.60
65 Three 32 Gallon Containers $36.60
66 Four 32 Gallon Containers $41.60
67 Five 32 Gallon Containers $46.60
Two Collections Per Week68 One 32 Gallon Container $39.90
69 Two 32 Gallon Containers $44.90
70 Three 32 Gallon Containers $49.90
71 Four 32 Gallon Containers $51.90
72 Five 32 Gallon Containers $53.90
Commercial Composting (restaurants, hair salons, etc.) (continued)
Total per Month
Three Collections Per Week73 One 32 Gallon Container $44.40
74 Two 32 Gallon Containers $49.40
75 Three 32 Gallon Containers $54.40
76 Four 32 Gallon Containers $56.90
77 Five 32 Gallon Containers $58.90
78 Commercial Composting Contamination Fee $20.00 per ton
79 Commercial Composting Cart Cleaning Fee (Upon Request) $10.00 per cart
80 Commercial Composting Cart Replacement Fee $25.00 per cart
Other Disposal or Recycling Services
81 Clothing & ShoesNo Charge ‐ Must be clean & bagged
securely & placed in the available bins
82 Cooking grease No Charge ‐Used cooking grease/oil
83 Televisions $5.00 per computer or TV Monitor
84 MetalNo Charge ‐ Large and small appliances,
vacuum cleaners, fans, etc.
85 Car batteries $1.00 per battery
86 Paint $2.00 / can or $10.00 / 5 gallon bucket
87 Propane tanks $5.00 per tank
SOLID WASTE (continued)
FY22 Schedule of Fees & Charges
FY22 Budget G-31

Subject Fee / Unit
88 Tires$3.00 per standard passenger/light truck
tire without rims$10.00 per commercial truck tire without
rims$25.00 for tractor tires
$220 per ton commercial rate
89 Mattress or Box springs $10.00 per piece
Subject Fee / Unit1 Level II Electric Vehicle Chargers ‐ Park and Ride $0.75/Hour
Level II Electric Vehicle Chargers ‐ Other Locations
2 0‐2 Hours $0.75/Hour
3 2‐4 Hours $1.50/Hour
4 After 4 Hours $3.00/Hour
Subject Fee / Unit1 Road, Lane, and Sidewalk Closure Report [Traffic] $60.00 / Permit
2 Traffic Control Plan Review [Traffic] $150.00 / Per Project
3 Traffic Impact Analysis [Traffic] $250.00 / Per Project
4 Construction Plan Review $360.00 / Per Project (2 Reviews)
5 Re‐review fee $250.00 / Per Re‐Submittal
6 Storm water Management Plan Review $275.00 / Per Project (2 Reviews)
7 E&SC ‐ NPDES Review $40.00 / Disturbed Acres
8 E&SC/Construction Violation and Re‐inspection Fee $200.00 / Violation
9 Land Disturbance Activity Permit** $240.00 / Per Disturbed Acre (Six Month Permit)
**Land Disturbance Permits must be renewed after 6 months if project
is not complete.
Remaining LD Fee will be charged based on site activity as follows:
10 Active Grading$40.00 / Per Remaining Disturbed Acre Per
Month
11Second Phase Stabilization (Second Phase E&S Plan active, base material
install, underground infrastructure installed)$30.00 / Per Total Project Disturbed Acre Per
Month
12 Final Stabilization$15.00 / Per Total Project Disturbed Acre Per
Month
13 ROW Encroachment Permit $60.00 / Per Permit
14 Driveway Permit $60.00 / Per Permit
15 Floodplain Construction Permit $60.00 / Per Project
16 Bid Packages $50.00 / Per Package
17 Residential Parking Permit (Two passes ‐ two vehicles) $10.00 / Per Residence housing)
18 Temporary Residential Parking Permit $5.00 / Per Day
Subject Fee / UnitSingle Ride
1 Adults $0.00
2 Senior/Disabled (Peak‐hours) $0.00
4 Children / Youth (0‐18 years old) $0.00
5 Demand Response $0.00
6 Transfer $0.00
7 UGA Contract Rate $0.00
8 Bulk Multiple Ride Single Passes Each $0.00
22-Ride Passes9 Adults $0.00
TRANSIT
SUSTAINABILITY OFFICE
TRANSPORTATION AND PUBLIC WORKS
SOLID WASTE (continued)
FY22 Schedule of Fees & Charges
FY22 Budget G-32

ICC Occupan
cy Classification
IAIB
IIA
IIB
IIIA
IIIB
IVVA
VB
A‐1 Assem
bly, thea
ters, w
ith stage
186.39
180.26
175.96
168.68
158.61
154.03
163.34
144.88
139.45
A‐1 Assem
bly, thea
ters, w
ithout stage
170.54
164.42
160.12
152.84
142.96
138.38
147.50
129.23
123.80
A‐2 Assem
bly, n
ightclubs
145.07
140.99
137.64
132.03
124.66
121.21
127.45
112.83
109.08
A‐2 Assem
bly, restaurants, b
ars, ban
quet halls
144.31
140.23
136.11
131.27
123.13
120.45
126.69
111.30
108.32
A‐3 Assem
bly, churches
171.32
165.19
160.90
153.62
144.81
140.23
148.28
131.08
125.64
A‐3 Assem
bly, gen
eral, community halls, libraries, m
useums
144.07
137.94
132.89
126.37
115.69
111.91
121.03
102.00
97.33
A‐4 Assem
bly, arenas
169.78
163.65
158.60
152.07
141.44
137.62
146.74
127.71
123.04
A‐4 Assem
bly, o
utdoor
169.78
163.65
158.60
152.07
141.44
137.62
146.74
127.71
123.04
B Business
149.50
144.07
139.59
132.79
121.41
116.87
127.69
106.67
102.02
E Ed
ucational
158.32
152.89
148.91
142.13
132.51
125.82
137.25
115.73
112.42
F‐1 Factory and in
dustrial, m
oderate hazard
88.00
83.95
79.28
76.20
68.48
65.30
73.04
56.32
53.10
F‐2 Factory and in
dustrial, low hazard
87.23
83.18
79.28
75.44
68.48
64.53
72.27
56.32
52.33
H‐1 High Hazard, explosives
82.31
78.26
74.36
70.52
63.73
59.78
67.35
51.57
0.00
H234 High Hazard
82.31
78.26
74.36
70.52
63.73
59.78
67.35
51.57
47.58
H‐5 HPM
149.50
144.07
139.59
132.79
121.41
116.87
127.69
106.67
102.02
I‐1 In
stitutional, supervised environmen
t148.81
143.76
139.60
133.71
123.18
119.83
133.79
110.35
106.91
I‐2 In
stitutional, h
ospitals
250.10
244.67
240.20
233.39
221.24
0.00
228.30
206.50
0.00
I‐2 In
stitutional, n
ursing homes
173.60
168.16
163.69
156.88
146.27
0.00
151.79
131.53
0.00
I‐3 In
stitutional, restrained
169.94
164.51
160.04
153.23
142.81
137.51
148.14
128.07
121.90
I‐4 In
stitutional, d
ay care facilities
148.81
143.76
139.60
133.71
123.18
119.83
133.79
110.35
106.91
M M
ercantile
108.03
103.94
99.83
94.98
87.19
84.51
90.40
75.36
72.38
R‐1 Residen
tial, h
otels
150.21
145.16
141.00
135.12
124.38
121.03
135.19
111.55
108.11
R‐2 Residen
tial, m
ultiple fam
ily125.97
120.92
116.76
110.88
100.75
97.40
110.95
87.91
84.47
R‐3 Residen
tial, o
ne‐ and two‐fam
ily117.56
114.37
111.42
108.62
104.64
101.89
106.80
97.91
92.16
R‐4 Residen
tial, care/assisted
living facilities
148.81
143.76
139.60
133.71
123.18
119.83
133.79
110.35
106.91
S‐1 Storage, m
oderate hazard
81.55
77.50
72.83
69.76
62.20
59.02
66.59
50.04
46.82
S‐2 Storage, low hazard
80.79
76.74
72.83
68.99
62.20
58.26
65.83
50.04
46.05
U Utility, m
iscellaneo
us
63.85
60.29
56.53
53.71
48.45
45.28
51.32
38.31
36.48
a. Private garages, carports, porches and storage build
ings use Utility, m
iscelaneo
us
b. U
nfinished
basem
ents (all u
se groups) = $25.00 per sq. ft.
c. For shell o
nly build
ings ded
uct 20 percent of calculated valuation
d. 0
.00 valuation in
dicates not permitted
e. Decks (all u
se groups) = $18.00 per sq. ft.
EXHIBIT A
Athens‐Clarke County Build
ing Valuation Tab
le
BUILDING IN
SPEC
TION DEP
ARTM
ENT
ICC Construction Typ
e
FY22 Schedule of Fees & Charges
FY22 Budget G-33

Accrual Basis of Accounting: The method of accounting under which revenues are recorded when they are earned (whether or not cash is received at that time) and expenditures are recorded when goods and services are received (whether or not cash disbursements are recorded for those goods and services at that time). Ad Valorem Tax: Tax imposed on property according to the value of the property being taxed. Appropriation: A legal authorization granted by a legislative body to make expenditures and to incur obligations for specific purposes. Arbitrage: Taking funds that have been raised from the sale of tax‐exempt bonds and investing them at a higher rate of interest in taxable securities. Profits derived from the interest earnings must be refunded to the federal government. Assessment: The process of making the official valuation of property for taxation. Assessed Value: The value at which property is taxed. The Assessed value in the state of Georgia is forty percent (40%) of the fair market value. Asset: A probable future economic benefit obtained or controlled by a particular entity as a result of past transactions or events. Bond: A written promise to pay a specified sum of money (called the face value or principal amount), at a specified date or dates in the future, called the maturity date(s), together with periodic interest at a specified rate. Budget: A plan of financial operation embodying an estimate of proposed expenditures for a given period and the proposed means of financing them. Budget Document: The instrument used by the budget‐making authority to present a comprehensive financial program to the appropriating governing body. Capital Projects: An item for which the purchase, construction, or other acquisition will represent a public betterment to the community and adds to the total assets of Athens‐Clarke County. The project should have an anticipated life of three years or more and a total project cost of $30,000 or more. Capital Additions & Improvements: This is a capital project of more than $30,000 which "adds" to the existing capital base or "improves" the current level of service. Capital Current Services: This is a capital project of more than $30,000 which "maintains" the existing capital base or "maintains" the current level of service. Capital Budget: The first year of the CIP as approved by the Commission. Capital Improvement Program (CIP): A plan for capital expenditures to be incurred each year over a five year period. This plan will meet the capital needs as defined in the long‐term work program of Departments and other agencies of the Unified Government. It sets forth each project in which Athens‐Clarke County is to have part, and it specifies the resources estimated to be available to finance the projected expenditures. Coronavirus Aid, Relief, and Economic Security (CARES) Act: Provides for payments to State, Local and Tribal governments navigating the impact of the COVID‐19 outbreak, through the Coronavirus Relief Fund.
Glossary
FY22 Budget H-1

Cash Basis: A basis of accounting under which transactions are recognized only when cash is received or disbursed. Community Development Block Grant (CDBG): A federal domestic assistance grant to develop viable urban communities by providing adequate housing and a suitable living environment as well as expanding economic opportunities for persons of low and moderate income. Contingency: Those funds included in the budget for the purpose of providing a means to cover unexpected costs during the budget year. These funds can only be expended with Manager and/or Commission approval. Debt: An obligation resulting from the borrowing of money or from the purchase of goods and services. Delta▲: In this document, the delta symbol is used to represent change from prior year. Department: A major unit of organization in Athens‐Clarke County comprised of subunits named divisions or cost centers and responsible for the provision of a specific package of services. Depreciation: The portion of the cost of a fixed asset charged as an expense during a particular period. The cost of a fixed asset, less any salvage value, is prorated over the estimated service life of such an asset, and each period is charged with a portion of such cost. Encumbrance: Commitment related to an unperformed contract for goods and services. Encumbered funds may not be used for any other purpose. Enterprise Funds: A fund established to account for operations that are financed and operated in a manner similar to private enterprise ‐ where the intent of the governing body is to provide goods or services to the general public, charging user fees to recover financing costs. Examples are public utilities and airports. Expendable Trust Funds: A trust fund whose resources, including both principal and earnings, may be expended. Expenditures: Decreases in net financial resources. Expenditures include current operating expenses requiring the present or future use of net current assets, debt service and capital outlay, and intergovernmental grants, entitlement and shared revenues. Fiscal Year (FY): The twelve‐month period to which the annual operating budget applies. In Athens‐Clarke County this is July 1 to June 30. Franchise Fees: A fee levied on utilities in exchange for allowing the utilities the use of public right‐of‐way. Fringe Benefits: Expenditures related to employee benefits such as Vacation, Sick Leave, and Health Insurance. Fund: An independent fiscal and accounting entity with self‐balancing set of accounts recording cash and/or other resources together with all related liabilities, obligations, reserves and equities which are segregated for the purpose of carrying on specific activities or attaining certain objectives. General Service District: This district consists of the total area of Clarke County. Generally Accepted Accounting Principles (GAAP): Uniform minimum standards for financial accounting and recording, encompassing the conventions, rules, and procedures that define accepted accounting principles.
Glossary
FY22 Budget H-2

General Fund: The fund used to account for all financial resources, except those required to be accounted for in another fund. General Obligation Bonds: Bonds backed by the full faith and credit of government. Grant: A contribution of assets (usually cash) from one governmental unit or organization to another. Typically, these contributions are made to local governments from the state or federal governments to be used for specific purposes and require distinctive reporting. Goal: The Goal statements included in Department budget requests are designed to inform the reader of the department's expectations for improvement, change, and/or growth in service level and activities. A goal is a standard against which to measure progress. Governmental Funds: This category of funds includes typical governmental activities and includes funds such as the General Fund, Special Revenue Funds, and the Debt Service Fund. These funds are set up to measure current expendable financial resources (only current assets and current liabilities) and uses the modified accrual basis of accounting. Homestead Exemption: A tax relief measure whereby state law permits local governments to exempt a fixed dollar amount of appraised value of qualifying residential property. Independent Agencies: Separate legal entities or commissions not included within an Athens‐Clarke County (ACCGOV) department. Internal Service Fund: Funds used to account for the financing of goods or services provided by one department or agency to another department or agency of a government on a cost reimbursement basis. Lease‐purchase Agreements: Contractual agreements that are termed leases, but that in substance are purchase contracts. Levy: To impose taxes, special assessments or service charges for the support of government activities. Liabilities: Probable future sacrifices of economic benefits, arising from present obligations of a particular entity to transfer assets or provide services to other entities in the future as a result of past transactions or events. Line Item Budget: Listing of each category of expenditures and revenues by fund, agency, department, division and or cost center. L.O.S.T. (Local Option Sales Tax): Tax levied at the rate of one percent which applies to the same items as the State sales tax, except that the local option sales tax also applies to sales of motor fuels. Mill: One one‐thousandth of a dollar of assessed value. A tax rate of one mill produces one dollar of taxes for each $1,000 of assessed property valuation. Millage: Rate used in calculating taxes based upon the value of property, expressed in mills per dollar of property value. Mission: The Mission statements included in Department budget requests are designed to inform the reader of the department's essential functions or activities/responsibilities/tasks they are charged to accomplish, as well as, the major services they provide.
Glossary
FY22 Budget H-3

Modified Accrual Basis: The accrual basis of accounting adapted to the governmental fund‐type measurement focus. Under it, revenues and other financial resource increments are recognized when they become susceptible to accrual, that is when they become both "measurable" and "available to finance expenditures of the current period." Net Position: The difference between (a) assets and deferred outflows of resources and (b) liabilities and deferred inflows of resources. OPEB (Other Post‐Employment Benefits): Non‐pension benefits provided to employees after employment ends such as health insurance coverage for retirees, dental insurance, life insurance and term care coverage. Operating Budget: Plans of current expenditures and the proposed means of financing them. Performance Measures: Specific quantitative productivity measures of work performed within an activity or program. Also, a specific quantitative measure of results obtained through a program or activity. Personal Property: Property that can be moved with relative ease, such as motor vehicles, boats, machinery, and inventoried goods. Personal Services: Expenditures for the payment of salaries, wages and fringe benefits of employees. Property Tax: Tax based on assessed value of a property, either real estate or personal. Tax liability falls on the owner of record as of the appraisal date. Proprietary Funds: This category of funds often emulates the private sector and includes Enterprise Funds and Internal Service Funds. These funds are set up to measure the flow of economic resources (all assets and liabilities) and uses the accrual basis of accounting. Real Property: Land, buildings, permanent fixtures, and improvements. Refunding: A procedure whereby an issuer of bonds refinances an outstanding bond issue by issuing new bonds. Retained Earnings: An equity account reflecting the accumulated earnings of an enterprise or internal service fund. Revenue: Increases in the net current assets of a governmental fund type from other than expenditure refunds and residual equity transfers. Examples include property taxes, licenses and fees, and charges for services. Revenue Bonds: Bonds whose principal and interest are payable exclusively from earnings of an enterprise fund. Sales Tax: Tax levied on a broad range of goods and services at the point of sale and specified as a percentage of the transaction price. The vendor collects and reports the tax on behalf of the taxing jurisdiction. Self‐Insurance: The formal assumption or partial assumption of risks and the accounting of results. Specific accounts are set aside to fund the risks, and losses which do occur are charged against those accounts or funds. S.P.L.O.S.T. (Special Purpose Local Option Sales Tax): An additional 1 percent sales tax that may be imposed for a specific time period on the same items as the State sales tax. The tax may be levied with voter approval and must be used for specific capital projects or capital outlay.
Glossary
FY22 Budget H-4

Special Revenue Fund: A fund used to account for the proceeds of specific revenue sources (other than expendable trusts or major capital projects) that are legally restricted to expenditure for specified purposes. Tax Allocation District (TAD): A redevelopment tool that uses the increased property taxes generated by new development in a designated redevelopment area to finance costs related to development including, but not limited to, public infrastructure, demolition, utilities and planning costs. Tax Anticipation Note: Borrowing by a local government against future anticipated tax revenue. Tax Digest: The total assessed value of taxable property for a particular area. Title Ad Valorem Tax (TAVT): A one‐time title fee/tax paid at the time a motor vehicle title is transferred, based on the fair market value of the vehicle. TAVT replaced sales and use tax and the annual ad valorem tax (the “birthday” tax). TAVT is mandatory for motor vehicles purchased on or after March 1, 2013 and titled in Georgia. Trust Funds: Funds used to account for assets held by a government in a trustee capacity for individuals, private organizations, other governments, and/or other funds. T.S.P.L.O.S.T. (Transportation Special Purpose Local Option Sales Tax): A sales tax used to fund capital outlay projects proposed by the county government and municipal governments where the outlays are intended for transportation purposes only. Urban Service District: This district consists of the area within the corporate limits of the city of Athens at the time Unification became effective. VOIP (Voice Over Internet Protocol) Telephone: A category of hardware and software that enables voice communication (telephone service) and multimedia sessions over the internet.
Glossary
FY22 Budget H-5

ACCGov (Athens‐Clarke County Government)
ACA (American Correctional Association)
ACCFES (Athens‐Clarke County Fire & Emergency Services)
ACCPD (Athens‐Clarke County Police Department)
ADDA (Athens Downtown Development Authority)
ADR (Alternative Dispute Resolution)
AHA (Athens Housing Authority)
AFR (Annual Financial Report)
ARPA (American Rescue Plan Act)
ATS (Athens Transit Service)
AWWA (American Water Works Association)
AMI (Advanced Metering Infrastructure)
CALEA (Commission on Accreditation for Law Enforcement Agencies)
CARES (Coronavirus Aid Relief and Economic Security)
CBD (Central Business District)
CDBG (Community Development Block Grant)
CHaRM (Center for Hard to Recycle Materials)
CHS (Consumer Healthy Solutions)
CIP (Capital Improvement Plan)
CJCC (Criminal Justice Coordinating Council)
CMMS (Computerized Maintenance Management System)
COPPS (Community Oriented Policing Performance System)
CPI (Consumer Price Index)
CVB (Convention & Visitors Bureau)
CS (Current Services)
CY (Calendar Year)
DATE (Drug Abuse Treatment and Education)
DFCS (Department of Family and Children’s Services)
DOT (Department of Transportation)
DUI (Driving Under the Influence)
EMS (Emergency Medical Services)
EPD (Environmental Protection Division)
ERP (Enterprise Resource Planning)
FAA (Federal Aviation Administration)
FMLA (Family Medical Leave Act)
FMV (Fair Market Value)
FTA (Federal Transit Administration)
FTE (Full‐time equivalent)
FY (Fiscal Year)
GAAFR (Governmental Accounting, Auditing, and Financial Reporting)
GAAP (Generally Accepted Accounting Principles)
GACP (Georgia Association of Chiefs of Police)
GASB (Governmental Accounting Standards Board)
GCIC (Georgia Crime Information Center)
GDOT (Georgia Department of Transportation)
GEFA (Georgia Environmental Finance Authority)
Acronyms
FY22 Budget H-6

GFOA (Government Finance Officers Association)
GICH (Georgia Initiative for Community Housing)
GIS (Geographic Information System)
HCD (Housing & Community Development)
HSA (Health Savings Account)
HUD (U. S. Department of Housing and Urban Development)
HVAC (Heating, Ventilation & Air Conditioning)
ISO (Insurance Service Office)
KACCB (Keep Athens‐Clarke County Beautiful)
LOST (Local Option Sales Tax)
MACORTS (Madison Athens Clarke Oconee Regional Transportation Study)
NCCHC (National Commission on Correctional Health Care)
NRPA (National Recreation & Park Association)
OCGA (Official Code of Georgia Annotated)
OPEB (Other Post‐Employment Benefits)
PILOT (Payment in Lieu of Taxes)
PMP (Performance Management Program)
POS (Point of Service)
RFP (Request for Proposal)
SDWA (Safe Drinking Water Act)
SHP (Supportive Housing Program)
SPLOST (Special Purpose Local Option Sales Tax)
TAD (Tax Allocation District)
TAVT (Title Ad Valorem Tax)
TSPLOST (Transportation Special Local Option Sales Tax)
UGA (University of Georgia)
VAWA (Stop Violence Against Women Act)
VOIP (Voice Over Internet Protocol)
WEF (Water Environment Federation)
WRF (Water Reclamation Facility)
Acronyms
FY22 Budget H-7