THE UNIFIED ENTERPRISE ARCHITECTURE (AEU) AS A …
17
63 3C Empresa. Investigación y pensamiento crítico. ISSN: 2254-3376 Edición Especial Special Issue Enero 2021 THE UNIFIED ENTERPRISE ARCHITECTURE (AEU) AS A STRATEGIC TOOL ORGANIZATIONAL MODELING FOR THE FUNTIONAL COMPETITIVENESS OF UNIVERSITIES Oswaldo Alfaro Bernedo National University Federico Villarreal, (Perú). E-mail: [email protected] ORCID: https://orcid.org/0000-0002-9803-5986 Doris Esenarro National University Federico Villarreal, (Perú). E-mail: [email protected] ORCID: https://orcid.org/0000-0002-7186-9614 Ciro Rodriguez National University Mayor de San Marcos, (Perú). E-mail: [email protected] ORCID: https://orcid.org/0000-0003-2112-1349 Maria René Alfaro National University Federico Villarreal, (Perú). E-mail: [email protected] ORCID: https://orcid.org/0000-0003-4601-6748 Recepción: 21/10/2020 Aceptación: 29/12/2020 Publicación: 08/01/2021 Citación sugerida Suggested citation Alfaro, O., Esenarro, D., Rodriguez, C., y Alfaro, M. R. (2021). The Unified Enterprise Architecture (AEU) as a strategic tool organizational modeling for the funtional competitiveness of universities. 3C Empresa. Investigación y pensamiento crítico. Edición Especial Tourism and University: Backbone of Peruvian Economy, 63-79. https://doi.org/10.17993/3cemp.2021.specialissue1.63-79
Transcript of THE UNIFIED ENTERPRISE ARCHITECTURE (AEU) AS A …
63
3C Empresa. Investigación y pensamiento crítico. ISSN: 2254-3376 Edición Especial Special Issue Enero 2021
THE UNIFIED ENTERPRISE ARCHITECTURE (AEU) AS A STRATEGIC TOOL ORGANIZATIONAL MODELING FOR THE FUNTIONAL COMPETITIVENESS OF UNIVERSITIES
Oswaldo Alfaro BernedoNational University Federico Villarreal, (Perú).
E-mail: [email protected] ORCID: https://orcid.org/0000-0002-9803-5986
Doris EsenarroNational University Federico Villarreal, (Perú).
E-mail: [email protected] ORCID: https://orcid.org/0000-0002-7186-9614
Ciro RodriguezNational University Mayor de San Marcos, (Perú).
E-mail: [email protected] ORCID: https://orcid.org/0000-0003-2112-1349
Maria René AlfaroNational University Federico Villarreal, (Perú).
E-mail: [email protected] ORCID: https://orcid.org/0000-0003-4601-6748
Recepción: 21/10/2020 Aceptación: 29/12/2020 Publicación: 08/01/2021
Citación sugerida Suggested citationAlfaro, O., Esenarro, D., Rodriguez, C., y Alfaro, M. R. (2021). The Unified Enterprise Architecture (AEU) as a strategic tool organizational modeling for the funtional competitiveness of universities. 3C Empresa. Investigación y pensamiento crítico. Edición Especial Tourism and University: Backbone of Peruvian Economy, 63-79. https://doi.org/10.17993/3cemp.2021.specialissue1.63-79

64 https://doi.org/10.17993/3cemp.2021.specialissue1.63-79
3C Empresa. Investigación y pensamiento crítico. ISSN: 2254-3376 Edición Especial Special Issue Enero 2021
ABSTRACTThis research work proposes the design and application of an organizational model based on
two very important and well-known precedents: On the one hand, the so-called Enterprise
Architecture (EA), as a powerful methodology of business modeling based on Zachaman’s
Framework and, on the other hand, the Unified Process of Rational (UPR), so that together
they achieve a synergistic merger, giving rise to the so-called Unified Enterprise Architecture
(UEA), in order to articulate all the perspectives and aspects that are part of the original
EA with a third dimension formed by the phases and iterative dynamics of the UPR. In
this way, the systemic organizational modeling of universities is very useful; however, its
application is valid for all types of organizations. The design of the experimental research
of the pre-test and post-test type with a control group is defined, a computer application is
developed as a prototype and the empirical test is carried out through direct observation for
the control group and simulation for the experimental group; results are evaluated based on
the management indicators Efficiency, effectiveness and productivity.
KEYWORDSInformation technologies, Enterprise architecture, Unified Enterprise Architecture, Unified
process of Rational, Simulation.
65 https://doi.org/10.17993/3cemp.2021.specialissue1.63-79
3C Empresa. Investigación y pensamiento crítico. ISSN: 2254-3376 Edición Especial Special Issue Enero 2021
1. INTRODUCTIONThe scenarios in which organizations operate are increasingly complex, demanding
greater management capacity to achieve or maintain adequate levels of competitiveness.
In this regard, there are evident scientific and technological advances aimed at generating
new knowledge, management tools and technological tools; however, such efforts are not
articulated in a systemic way, achieving isolated results and, in many cases, contributing to
increase the existing complexity. Management methods focused on the organized alignment
between business plans, information systems plan and information technology plans are
still incipient. In this context, the organizations solve in an incomplete and ineffective way
the immediate problems that are manifested in their future, but it is still not considered
an integral solution of all the agents that are part of the socio-technical system (Reyes,
Rodriguez, & Esenarro, 2019).
One of the main manifestations of the deficiencies and restrictions derived from the
framework of action indicated for the Peruvian public university system in general and, in the
UNFV in particular, is the scarce use of modern management tools supported by information
technologies to improve the performance of its business processes. The indicators in which
the low performance of such processes becomes tangible are efficiency, effectiveness and
productivity. Ultimately, the result of this problematic situation is manifested in the provision
of administrative services with a low level of competitiveness, even in the national context.
Another cause of the low level of performance of administrative processes is the lack of
knowledge of management methodologies and tools supported by information technology,
which allow the integration of all the functionality of the organization (Bastidas, Helfert,
& Bezbradica, 2018).
Consequently, the objective of this research work is to “establish the degree of influence
that the design and application of an organizational model based on the Unified Enterprise
Architecture, in the functional competitiveness of universities,” understood the Unified
Enterprise Architecture as a manifestation of modern business engineering, which aims
to integrate all management tools with a coherent technological support, as well as the
dynamic and iterative component that gives the third dimension of phases provided by the
RUP (Kitsios & Kamariotou, 2019).

66 https://doi.org/10.17993/3cemp.2021.specialissue1.63-79
3C Empresa. Investigación y pensamiento crítico. ISSN: 2254-3376 Edición Especial Special Issue Enero 2021
To prove that the functional competitiveness of the universities improves as a result of this
proposed organizational model, the corresponding hypothesis is formulated in the following
terms: “If an organizational model based on the Unified Enterprise Architecture is designed
and used, then the functional competitiveness of the universities improves”. The related
independent and dependent variables for this purpose are Organizational model based on
the Unified Enterprise Architecture and the functional competitiveness of the universities,
respectively; for each of them, indicators have been identified to which a specific metric is
applied. In the case of the dependent variable, the indicators are constituted by efficiency,
effectiveness and productivity.
2. METHODOLOGYThe present research is based on the specific scientific method because of the perfection
and effectiveness it has achieved [SIE96] and because its development and improvement
are closely linked to the development of technology, since the validity of the hypothesis
formulated after data collection is tested (Bastidas et al., 2018).
This research method is framed in the typology of field research thesis, that is, the appropriate
method for researches in which information has been collected framed by the specific
environment in which the study phenomenon is presented. In the realization of these theses,
an exclusive research method is used and certain tools are designed to collect information
that are only applied in the environment in which the phenomenon of study acts; for the
tabulation and analysis of the information obtained, statistical and mathematical methods and
techniques are used that help to obtain formal, scientifically proven conclusions. As specific
orientations used, we have the deductive method, the inductive method and the experimental
method [CAB99] (Huapaya, Rodriguez, & Esenarro, 2020).
Consequently, the thesis follows a proven method of collection, tabulation and analysis of
the antecedents that have been obtained and proven to be valid directly in the field in which
the research fact has been presented.
2.1. SAMPLEThe sample selected is of the probabilistic type because any transaction corresponding
to the business processes involved has the same opportunity to form the control and
67 https://doi.org/10.17993/3cemp.2021.specialissue1.63-79
3C Empresa. Investigación y pensamiento crítico. ISSN: 2254-3376 Edición Especial Special Issue Enero 2021
experimental group. Likewise, this sample is considered to be of the probabilistic type
because the execution of such processes can occur at any time, according to the demand of
users or the organization itself when faced with environmental requirements.
2.2. PRESENTATION AND FUNCTIONAL METAMODEL OF THE AEU
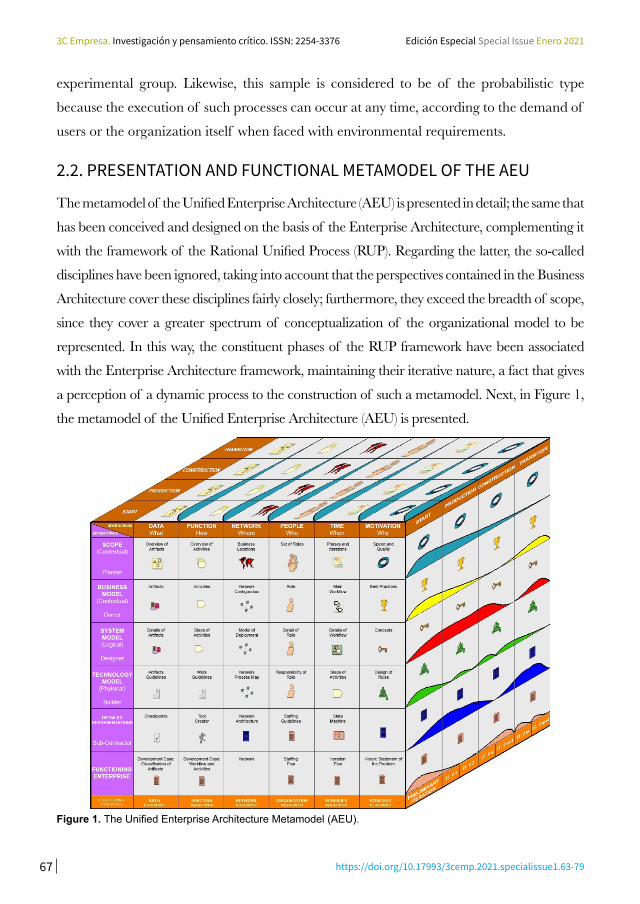
The metamodel of the Unified Enterprise Architecture (AEU) is presented in detail; the same that
has been conceived and designed on the basis of the Enterprise Architecture, complementing it
with the framework of the Rational Unified Process (RUP). Regarding the latter, the so-called
disciplines have been ignored, taking into account that the perspectives contained in the Business
Architecture cover these disciplines fairly closely; furthermore, they exceed the breadth of scope,
since they cover a greater spectrum of conceptualization of the organizational model to be
represented. In this way, the constituent phases of the RUP framework have been associated
with the Enterprise Architecture framework, maintaining their iterative nature, a fact that gives
a perception of a dynamic process to the construction of such a metamodel. Next, in Figure 1,
the metamodel of the Unified Enterprise Architecture (AEU) is presented.
Figure 1. The Unified Enterprise Architecture Metamodel (AEU).

68 https://doi.org/10.17993/3cemp.2021.specialissue1.63-79
3C Empresa. Investigación y pensamiento crítico. ISSN: 2254-3376 Edición Especial Special Issue Enero 2021
As can be seen Figure 1, the three dimensions of this metamodel constitute it: six Perspectives,
six Aspects and four Phases; the iterative component of the model suggests that the artifacts
to be built in each cube should be carried out in as many steps as necessary, depending on the
combination of the three dimensions. Therefore, this metacube is made up of 144 finished
cubes; however, taking into consideration that the corresponding artifacts (models) resulting
from each cube require at least two iterations, it is clear the extent of the functional scope and
effort required to achieve the full development of this systemic organizational model.
Once the functional metamodel of the AEU has been represented, the next step is to build
the corresponding functional model, that is, following the pattern of the perspectives (for
each one of them), to elaborate the corresponding use case diagrams, in such a way that
the whole functional scope of the Unified Enterprise Architecture is covered at the highest
level of abstraction (Reyes et al., 2019).
2.2.1. ITERATED OPERATIONAL PERSPECTIVE – 3D
Figure 2 presents the diagram of business use cases corresponding to the operational
perspective, or also called system functionality. This is a view of the system functionality in its
operational environment. The business use cases stand out: use data, execute functionality,
use the network, implement programming, etc.
Figure 2. DCU of the Operational perspective Iterada-3D of the AEU.

69 https://doi.org/10.17993/3cemp.2021.specialissue1.63-79
3C Empresa. Investigación y pensamiento crítico. ISSN: 2254-3376 Edición Especial Special Issue Enero 2021
Regarding the business actors involved in this perspective, as is obvious, it obeys the
need to operationalize all the functionality and details of the system; in addition to the
project manager, the user, the implementer, the code reviewer and the tester intervene.
(Langermeier, Saad, & Bauer, 2014).
2.2.2. AEU METAMODEL LOGIC
As it can be seen, in this metamodel, it is possible to interpret in an abstract way all
the possible models, diagrams, artifacts, activities, etc, that can be derived through the
corresponding instantiation process. Such a metamodel covers the whole scope of the AEU
(Petar et al., 2019).
The purpose of presenting this model is to map in a holistic way the main objects that are
derived from the functionality developed in the previous chapters, as well as the relationships,
both in the form of associations, aggregations, generalizations, etc., that are established by
the interaction between them.
Figure 3. AEU’s Logical Metamodel.
70 https://doi.org/10.17993/3cemp.2021.specialissue1.63-79
3C Empresa. Investigación y pensamiento crítico. ISSN: 2254-3376 Edición Especial Special Issue Enero 2021
In the Figure 3 appear the main artifacts, models, roles, etc., of the AEU metamodel using
Zachaman’s framework and in RUP.
3. RESULTSTechnically speaking, the experimental test has consisted of applying the performance
indicators to randomly selected business processes. First, for the control group, the
corresponding metrics were applied through direct observation.
To evaluate the results of the experimental group, an organizational model based on the
Unified Enterprise Architecture has been designed. With this tool, it has been possible to
integrate all the business processes of an administrative nature, eliminating all the pre-
existing deficiencies and redundancies. A fundamental aspect that has been established
is the articulation of the functionality of the organization with the strategy, that is, the
institutional strategic planning (Huapaya et al., 2020). Under these new organizational
conditions, the corresponding metrics have been applied to the same selected business
processes; for this purpose, the logical model of each process has been built and then its
behavior has been simulated by means of the simulation software called Service Model.
3.1. GROUP CONTROL
Below is the performance of the process of Preparation of Payrolls, one of the most
significant processes of university administrative management. For this purpose, we have
observed the duration of each of the activities that make up the process, the errors made,
as well as the number of people involved in carrying them out.
3.1.1. FOR THE EFFICIENCY INDICATOR
The appropriate index to evaluate the performance of the efficiency indicator is the metric
referred to the response time to transactions. In this specific case, it is the duration (in
equivalent days) of the execution of the selected processes.

71 https://doi.org/10.17993/3cemp.2021.specialissue1.63-79
3C Empresa. Investigación y pensamiento crítico. ISSN: 2254-3376 Edición Especial Special Issue Enero 2021
Table 1. Efficiency in the execution of processes.
N° PROCESSDURATION (days) EFFICIENCY
OBSERVED EXPECTED (%)
1 Training Staff 85 45 52.94
2 Staff Attendance Control 16 8 50.00
3 Assessing Staff Performance 20 9 45.00
4 Service Time Recognition 45 20 44.44
5 Select Staff 20 10 50.00
6 Make payments 15 8 53.33
7 Granting Benefits 35 17 48.57
8 Issuance of Bonus Certificate 21 11 52.38
9 Elaborate Consolidated Remuneration 12 6 50.00
10 Granting refunds 30 13 43.33
11 Update Staffing Pattern 12 6 50.00
12 Issue work certificates 10 5 50.00
13 Elaborate Payroll 14 8 57.14
Average (%) = 49.78Std. deviation = 3.85N´= 9.6
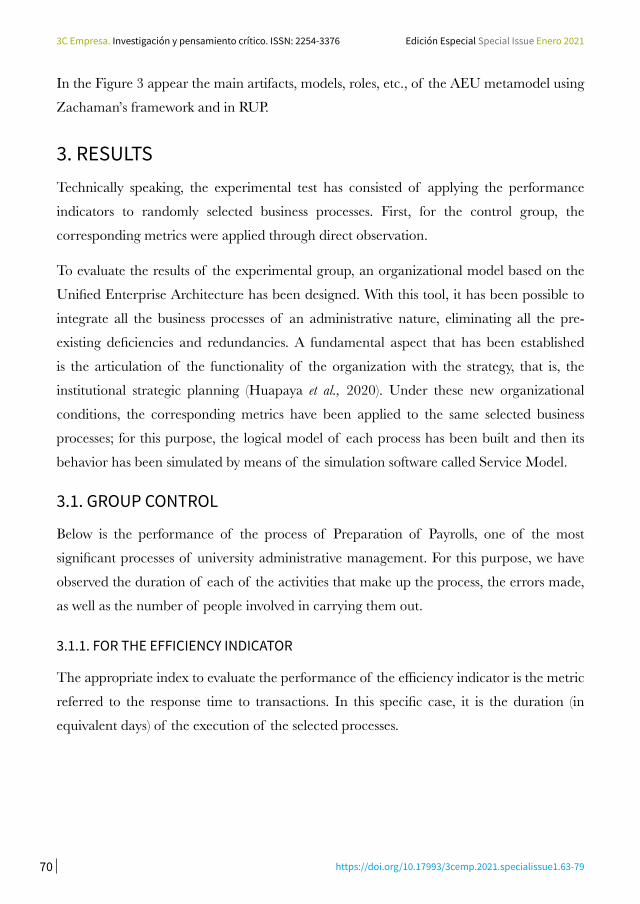
As shown in Table 1, the control group is made up of 13 randomly selected processes,
which have been measured for the observed duration and the expected duration for the
current conditions, i.e. without the application of the IT model based on the enterprise
architecture. From the relationship between these two durations, the efficiency of each
process has been calculated.
In this regard, the values range between 43.33% and 57.14%, resulting in an average of
49.78% that reveals a low system performance. Applying the formula to determine the size
of the representative sample, it is established that the number of processes selected for this
group is greater (13) than the number required in statistical terms (10).

72 https://doi.org/10.17993/3cemp.2021.specialissue1.63-79
3C Empresa. Investigación y pensamiento crítico. ISSN: 2254-3376 Edición Especial Special Issue Enero 2021
Figure 4: the trend of the results of what is observed and what is expected
In the figure 4 show results adequately represent the behavior of the rest of the processes with the observed and expected.
3.1.2. For the Productivity indicator
The appropriate index to evaluate the performance of the productivity indicator is the metric referred to the degree of utilization of one of the main resources in the performance of the system's processes, that is, human resources (expressed in the number of transactions carried out per equivalent person-day). In this specific case, for the execution of the processes involved (considering the number of transactions), the number of people involved has been identified, as well as the degree of participation. In this way, the relationship between the number of person-days and the number of transactions carried out by each process is determined.
Table 2 shows the total number of transactions produced for each process. These are the same as those used to evaluate the effectiveness indicator; in terms of the number of people and the degree of participation in carrying out the processes, these have been extracted from the current staff allocation.
Table 2: Human Resource Productivity for the Control Group
N° PROCESS PRODUCTION RESOURCES USED PRODUCTIVITY N of transact. People Participation People-
days Transac/People-
days 1 Training Staff 200 4 20% 68 0.7 2 Staff
Attendance Control
800 5 40% 120 6.7
3 Assessing Staff Performance
50 3 30% 27 1.9
85
16 20
45
20 15
35
2112
30
12 10 14
45
8 920
10 817
116
136 5 8
Trainin
g Staf
f
Staff A
ttend
ance
Con
trol
Asses
sing S
taff P
erform
ance
Service
Time R
ecog
nition
Select
Staff
Make p
aymen
ts
Grantin
g Ben
efits
Issua
nce o
f Bon
us C
ertific
ate
Elabora
te Con
solid
ated…
Grantin
g refu
nds
Update
Staffin
g Patt
ern
Issue
work
certif
icates
Elabora
te Pay
roll
DURATION (days) OBSERVED DURATION (days) EXPECTED
Figure 4. The trend of the results of what is observed and what is expected.
In the Figure 4 show results adequately represent the behavior of the rest of the processes
with the observed and expected.
3.1.2. FOR THE PRODUCTIVITY INDICATOR
The appropriate index to evaluate the performance of the productivity indicator is the
metric referred to the degree of utilization of one of the main resources in the performance
of the system’s processes, that is, human resources (expressed in the number of transactions
carried out per equivalent person-day). In this specific case, for the execution of the processes
involved (considering the number of transactions), the number of people involved has been
identified, as well as the degree of participation. In this way, the relationship between the
number of person-days and the number of transactions carried out by each process is
determined.
Table 2 shows the total number of transactions produced for each process. These are the
same as those used to evaluate the effectiveness indicator; in terms of the number of people
and the degree of participation in carrying out the processes, these have been extracted
from the current staff allocation.

73 https://doi.org/10.17993/3cemp.2021.specialissue1.63-79
3C Empresa. Investigación y pensamiento crítico. ISSN: 2254-3376 Edición Especial Special Issue Enero 2021
Table 2. Human Resource Productivity for the Control Group.
N° PROCESSPRODUCTION RESOURCES USED PRODUCTIVITY
N of transact. People Participation People-days Transac/People-days
1 Training Staff 200 4 20% 68 0.7
2 Staff Attendance Control 800 5 40% 120 6.7
3 Assessing Staff Performance 50 3 30% 27 1.9
4 Service Time Recognition 20 2 50% 15 1.3
5 Select Staff 20 2 25% 10 2
6 Make payments 200 6 30% 27 7.4
7 Granting Benefits 30 2 20% 14 2.1
8 Issuance of Bonus Certificate 25 2 60% 25.2 1
9Elaborate
Consolidated Remuneration
20 2 20% 4.8 4.2
10 Granting refunds 40 3 40% 18 44.4
11 Update Staffing Pattern 60 2 40% 11.2 5.4
12 Issue work certificates 50 2 40% 48 1
13 Elaborate Payroll 550 8 50% 56 9.8
Average (%) = 64.8Std. deviation = 11.69
However, these processes are different in nature, size, frequency, volume and resource
requirements; however, in order to evaluate the performance of human resources, it is
pertinent to calculate the average productivity of this resource.
Table 2 shows a high variability in personnel productivity, ranging from 0.7 to 44.4
transactions/day_person. The average staff productivity for the system is 6.8 transactions/
day-person.
3.2. GROUP CONTROL
For the experimental group, the same procedure applied for the control group has been
followed; after having designed the IT model based on the business architecture, the

74 https://doi.org/10.17993/3cemp.2021.specialissue1.63-79
3C Empresa. Investigación y pensamiento crítico. ISSN: 2254-3376 Edición Especial Special Issue Enero 2021
duration of each of the activities that make up the payroll process, the errors made, as well
as the number of people involved in carrying them out have been observed.
3.2.1. FOR THE EFFICIENCY INDICATOR
As for the control group, for the experimental group the appropriate index to evaluate
the behavior of the efficiency indicator is the metric referred to the response time to
transactions. In this specific case, it is the duration (in equivalent days) of the execution
of the selected processes after having applied the enterprise architecture supported by
information technology (Ubalde et al., 2020).
The behavior of the selected processes has been simulated (prior modeling). For the purposes
of the analysis, the existing gap between the simulated duration and the expected duration
under the new conditions has been determined.
Table 3. Efficiency in the execution of the processes Experimental Group.
N° PROCESSDURATION (days) EFFICIENCY
THEORICAL SIMULATED (%)
1 Training Staff 7 6 85.71
2 Staff Attendance Control 5 5 100
3 Assessing Staff Performance 10 8 80
4 Service Time Recognition 7 6 85.71
5 Select Staff 7 6 85.71
6 Make payments 8 7 87.50
7 Granting Benefits 9 8 88.89
8 Issuance of Bonus Certificate 8 7 87.50
9 Elaborate Consolidated Remuneration 6 5 83.33
10 Granting refunds 6 5 83.33
11 Update Staffing Pattern 2 2 100
12 Issue work certificates 15 14 93.33
13 Elaborate Payroll 3.104 3.1 99.87
Average (%) = 89.30Std. deviation = 6.83N´= 10
As shown in Table 3, the experimental group also consists of 13 randomly selected
processes, for which the duration under the conditions of functional redesign, derived from
the application of Enterprise Architecture, has been simulated. Likewise, the theoretical
75 https://doi.org/10.17993/3cemp.2021.specialissue1.63-79
3C Empresa. Investigación y pensamiento crítico. ISSN: 2254-3376 Edición Especial Special Issue Enero 2021
duration resulting from the assumption of zero interruptions of these processes has been
determined. From the relationship between these two durations, the efficiency of each
process has been calculated. In this regard, the values range between 80% and 100%,
resulting in an average of 89.30% that reveals a high performance of the system. Applying
the formula for determining the size of the representative sample, it is established that the
number of processes selected for this group is greater (13) than the number required in
statistical terms (10), which is why these results adequately represent the behavior of the
rest of the system’s processes.
3.2.2. FOR THE PRODUCTIVITY INDICATOR
The appropriate index to evaluate the performance of the productivity indicator is the
metric referred to the degree of utilization of one of the main resources in the performance
of the system’s processes, that is, human resources (expressed in Number of transactions
carried out per equivalent person-day). In this specific case, for the execution of the processes
involved (considering the number of transactions), the number of people involved has been
identified, as well as the degree of participation. In this way, the relationship between the
number of person-days and the number of transactions carried out by each process is
determined (Pourzolfaghar, Bastidas, & Helfert, 2019).
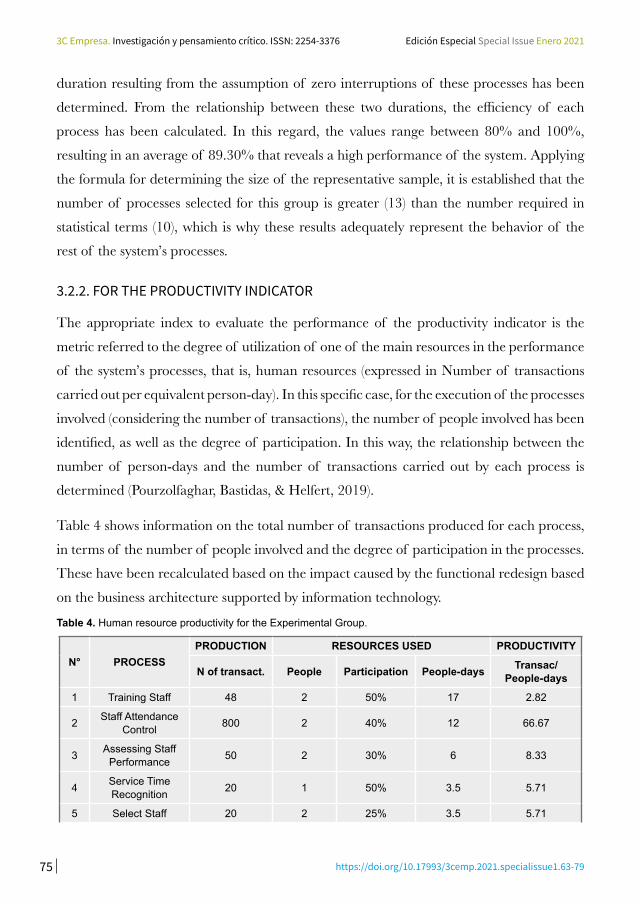
Table 4 shows information on the total number of transactions produced for each process,
in terms of the number of people involved and the degree of participation in the processes.
These have been recalculated based on the impact caused by the functional redesign based
on the business architecture supported by information technology.
Table 4. Human resource productivity for the Experimental Group.
N° PROCESSPRODUCTION RESOURCES USED PRODUCTIVITY
N of transact. People Participation People-days Transac/People-days
1 Training Staff 48 2 50% 17 2.82
2 Staff Attendance Control 800 2 40% 12 66.67
3 Assessing Staff Performance 50 2 30% 6 8.33
4 Service Time Recognition 20 1 50% 3.5 5.71
5 Select Staff 20 2 25% 3.5 5.71

76 https://doi.org/10.17993/3cemp.2021.specialissue1.63-79
3C Empresa. Investigación y pensamiento crítico. ISSN: 2254-3376 Edición Especial Special Issue Enero 2021
N° PROCESSPRODUCTION RESOURCES USED PRODUCTIVITY
N of transact. People Participation People-days Transac/People-days
6 Make payments 200 3 30% 7.2 27.78
7 Granting Benefits 30 2 20% 3.6 8.33
8 Issuance of Bonus Certificate 25 1 60% 4.8 5.21
9Elaborate
Consolidated Remuneration
20 2 20% 2.4 8.33
10 Granting refunds 40 2 80% 9.6 83.33
11 Update Staffing Pattern 60 1 40% 2.8 21.43
12 Issue work certificates 50 1 40% 6 8.33
13 Elaborate Payroll 550 3 40% 3.7248 147.66
Std. deviation = 43.32
However, these processes are different in nature, size, frequency, volume and resource
requirements; however, in order to evaluate the performance of human resources, it is
pertinent to calculate the average productivity of this resource.
Table 4 shows a high variability in personnel productivity, ranging from 2.82 to 147.66
transactions/day_person. The average staff productivity for the system is 30.74 transactions/
day-person.
4. CONCLUSIONSPeruvian universities operate in adverse conditions caused by budgetary limitations,
a situation that is evident in low levels of performance, both in the academic and
administrative aspects, despite having potentially competitive human resources. One of
the main repercussions of these budgetary restrictions is the deficient management of one
of the critical success factors, which is information technology in its role as a strategic tool
for organizational management. Likewise, an evidence of the deficient handling of the
information technology is translated in the nonexistence of some coherent organizational
model, that is aligned to the institutional objectives (Massana et al., 2017).
The organizational model based on the Unified Enterprise Architecture (AEU) proposed

77 https://doi.org/10.17993/3cemp.2021.specialissue1.63-79
3C Empresa. Investigación y pensamiento crítico. ISSN: 2254-3376 Edición Especial Special Issue Enero 2021
at the prototype level constitutes a valuable alternative for improving the functional
competitiveness of the universities that apply it, since it allows such management to
harmonize in a systemic manner the business logic with the technical language. AEU is
a powerful tool to support the management of organizations. This methodology, when
applied in an appropriate way, contributes to improve the performance of the same; on the
other hand, it is a valuable support to optimize the performance of the business processes
(Yin, 2017).
In relation to the studied reality, the tests carried out have demonstrated that the Unified
Enterprise Architecture is an adequate methodology to achieve the objectives set out
in this research work, that is, to design a holistic organizational model to influence the
administrative and academic functionality of universities. It has been demonstrated that,
to complement in a synergic way the capacity and scope of the Zachman framework as an
Enterprise Architecture platform, it is possible to apply the Unified Process methodology
(UPM). In this way, a valuable combination of object-oriented technology and the systemic
approach to organizational management is achieved (Singh, Van Sinderen, & Wieringa,
2017).
In summary, it is stated that the Unified Enterprise Architecture contributes to improving
the functional competitiveness of universities and, in general, to the administrative
management of all institutions that apply it. This work has confirmed once again that
information technologies, when used with rationality criteria, play a leading role in
consistently supporting business plans, becoming one of the main critical factors of success
and competitiveness of organizations (Reyes et al., 2019).
REFERENCESBastidas, V., Helfert, M., & Bezbradica, M. (2018). A requirements framework for the
design of smart city reference architectures. In Proceedings of the 51st Hawaii International Conference on System Sciences (HICCS). http://mural.maynoothuniversity.ie/13344/1/
MH_school%20of%20business_a%20requirements.pdf
78 https://doi.org/10.17993/3cemp.2021.specialissue1.63-79
3C Empresa. Investigación y pensamiento crítico. ISSN: 2254-3376 Edición Especial Special Issue Enero 2021
Denicolai, S., & Previtali, P. (2020) Precision Medicine: Implications for value chains
and business models in life sciences. Technological Forecasting and Social Change, 151, 119767. https://doi.org/10.1016/j.techfore.2019.119767
Huapaya, H. D., Rodriguez, C., & Esenarro, D. (2020). Comparative analysis of
supervised machine learning algorithms for heart disease detection. 3C Tecnología. Glosas de innovación aplicadas a la pyme. Edición Especial Tourism and University: Backbone of Peruvian Economy , Abril 2020, 233-247. http://doi.org/10.17993/3ctecno.2020.
specialissue5.233-247
Kitsios, F., & Kamariotou, M. (2019). Business strategy modelling based on enterprise
architecture: a state of the art review. Business Process Management Journal, 25, 606-624.
https://doi.org/10.1108/BPMJ-05-2017-0122
Langermeier, M., Saad, C., & Bauer, B. (2014). A Unified Framework for Enterprise
Architecture Analysis. In Proceedings - IEEE International Enterprise Distributed Object Computing Workshop, EDOCW. 227-236. https://doi.org/10.1109/EDOCW.2014.42
Massana, J., Pous, C., Burgas, L., Melendez, J., & Colomer, J. (2017). Identifying
services for short-term load forecasting using data driven models in a Smart City
platform. Sustainable Cities and Society, 28, 108–117. https://doi.org/10.1016/j.
scs.2016.09.001
Petar, S., Misita, M., Zoran, J., Mladen, M., Vasilije, M., & Vladimir, B. (2019).
Organizational design based on simulation modeling. The International Journal of Advanced Manufacturing Technology, 104. https://doi.org/10.1007/s00170-017-1453-0
Pourzolfaghar, Z., Bastidas, V., & Helfert, M. (2019), Standardisation of enterprise
architecture development for smart cities. Journal of the Knowledge Economy. https://
doi.org/10.1007/s13132-019-00601-8

79 https://doi.org/10.17993/3cemp.2021.specialissue1.63-79
3C Empresa. Investigación y pensamiento crítico. ISSN: 2254-3376 Edición Especial Special Issue Enero 2021
Reyes, A., Rodriguez, C., & Esenarro, D. (2019). Hyper Converged Systems Applied
(HSA) Methodology to Optimize the Process of Technological Renewal in Data
Centers. International Journal of Recent Technology and Engineering (IJRTE), 8(2S11),
4052-4056. https://www.ijrte.org/wp-content/uploads/papers/v8i2S11/
B15920982S1119.pdf
Singh, P. M., Van Sinderen, M., & Wieringa, R. (2017). Reference architecture for
integration platforms.In 2017 IEEE 21st International Enterprise Distributed Object Computing Conference (EDOC), Quebec City, QC, Canada, pp. 113-122. https://doi.
org/10.1109/EDOC.2017.24
Ubalde, R., Rodriguez, C., Petrlik, I., Esenarro, D., Lezama, P., & Sotomayor, J. (2020). Quality model for Peruvian microenterprises of a software product Factory.
Test Engineering and Management, 83, 13434. http://testmagzine.biz/index.php/
testmagzine/article/view/6062
Yin, R. K. (2017). Case study research and applications: design and methods. Sage publications.


![AeU Bachelors[2] (1)](https://static.fdocuments.in/doc/165x107/563dbb9a550346aa9aaea18c/aeu-bachelors2-1.jpg)