The “Unconventional” O&G Revolution: Another Look Under ...
23
The “Unconventional” O&G Revolution: Another Look Under the Hood Pete Stark, Senior Research Director and Advisor IHS CERA RCP Sponsors Meeting Colorado School of Mines October 25, 2013 CONFIDENTIAL © 2012, All rights reserved, Cambridge Energy Research Associates, Inc., 55 Cambridge Parkway, Cambridge, Massachusetts 02142 No portion of this presentation may be reproduced, reused or otherwise distributed in any form without prior written consent.
Transcript of The “Unconventional” O&G Revolution: Another Look Under ...

The “Unconventional” O&G Revolution: Another Look Under the Hood
Pete Stark,
Senior Research Director and Advisor
IHS CERA
RCP Sponsors Meeting
Colorado School of Mines
October 25, 2013
CONFIDENTIAL
© 2012, All rights reserved, Cambridge Energy Research Associates, Inc., 55 Cambridge Parkway, Cambridge, Massachusetts 02142
No portion of this presentation may be reproduced, reused or otherwise distributed in any form without prior written consent.
Copyright © 2013 IHS Inc. All Rights Reserved. Colorado School of Mines , 10-25-2013 1
Terms of Use
• CERA content and information, including but not limited to graphs, charts, tables, figures,
and data, are not to be disseminated outside of a client organization to any third party,
including a client’s customers, financial institutions, consultants, or the public.
• Content distributed within the client organization must display CERA’s legal notices and
attributions of authorship.
The accompanying materials were prepared by Cambridge Energy Research Associates, Inc. (CERA),
and are not to be redistributed or reused in any manner without prior written consent, with the exception
of client internal distribution as described below.
CERA strives to be supportive of client internal distribution of CERA content but requires that
Some information supplied by CERA may be obtained from sources that CERA believes to be reliable
but are in no way warranted by CERA as to accuracy or completeness. Absent a specific agreement to
the contrary, CERA has no obligation to update any content or information provided to a client.
Copyright © 2013 IHS Inc. All Rights Reserved. Colorado School of Mines , 10-25-2013
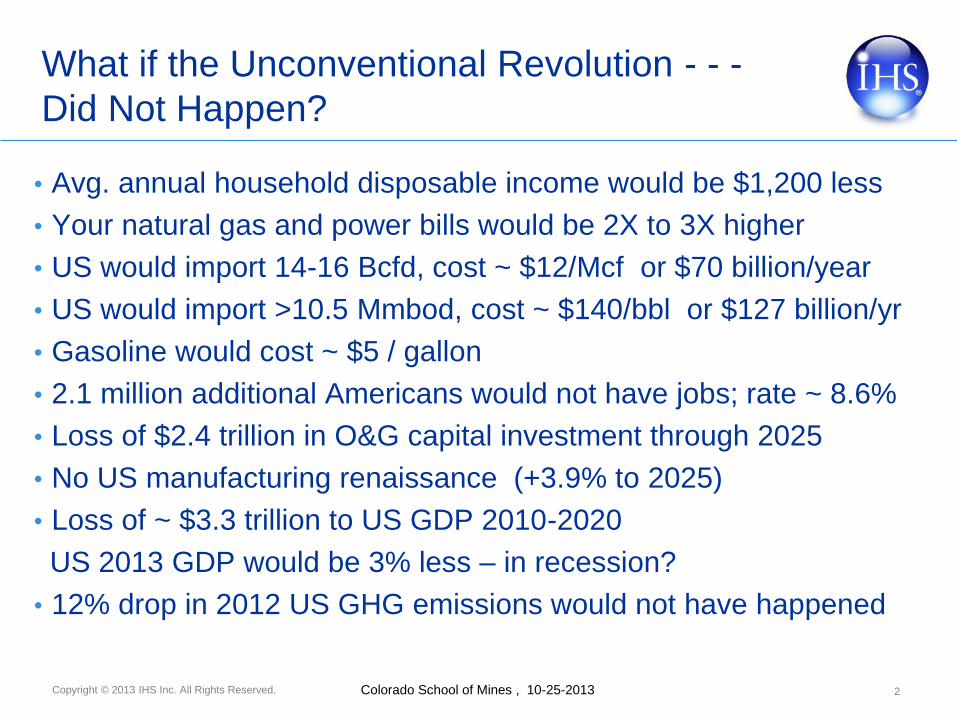
What if the Unconventional Revolution - - -
Did Not Happen?
• Avg. annual household disposable income would be $1,200 less
• Your natural gas and power bills would be 2X to 3X higher
• US would import 14-16 Bcfd, cost ~ $12/Mcf or $70 billion/year
• US would import >10.5 Mmbod, cost ~ $140/bbl or $127 billion/yr
• Gasoline would cost ~ $5 / gallon
• 2.1 million additional Americans would not have jobs; rate ~ 8.6%
• Loss of $2.4 trillion in O&G capital investment through 2025
• No US manufacturing renaissance (+3.9% to 2025)
• Loss of ~ $3.3 trillion to US GDP 2010-2020
US 2013 GDP would be 3% less – in recession?
• 12% drop in 2012 US GHG emissions would not have happened
2

Copyright © 2013 IHS Inc. All Rights Reserved. Colorado School of Mines , 10-25-2013 3
The Market Environment
• Multi-speed global recovery
• 2012 U.S. GDP 2.2%
• 2012 (Sept) Henry Hub at
$2.82 per Mcf
• Storage = 3,715 bcf
• WTI oil price at $91.08 / bbl
• Rigs: Oil Gas Horiz %
1410 427 1114 61%
• U.S. only moderate growth
• 2013 U.S. GDP ~ 1.5%
• 2013 (Sept) Henry Hub at
$3.62 per Mcf
• Storage = 3,577 bcf (- 3.7%)
• WTI oil price at $102.49 / bbl
• Rigs: Oil Gas Horiz %
1361 372 1099 63%
What has changed since 2012?
Source: IHS Cambridge Energy Research Associates.

Copyright © 2013 IHS Inc. All Rights Reserved. Colorado School of Mines , 10-25-2013
U.S. 2012 Completions with Resource Plays
4
Copyright © 2013 IHS Inc. All Rights Reserved. Colorado School of Mines , 10-25-2013
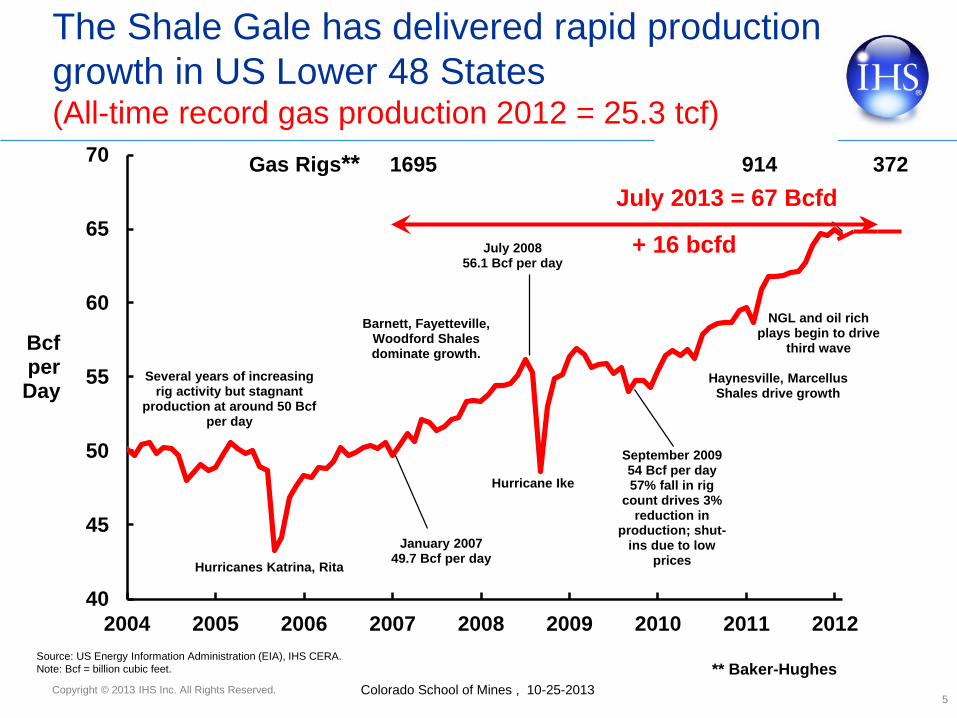
40
45
50
55
60
65
70
2004 2005 2006 2007 2008 2009 2010 2011 2012
BcfperDay
Several years of increasing rig activity but stagnant
production at around 50 Bcf per day
Hurricanes Katrina, Rita
Barnett, Fayetteville, Woodford Shales dominate growth.
January 200749.7 Bcf per day
Hurricane Ike
July 200856.1 Bcf per day
September 200954 Bcf per day57% fall in rig
count drives 3% reduction in
production; shut-ins due to low
prices
Haynesville, Marcellus Shales drive growth
NGL and oil rich plays begin to drive
third wave
February 201264.5 Bcf per day
Source: US Energy Information Administration (EIA), IHS CERA.
The Shale Gale has delivered rapid production
growth in US Lower 48 States (All-time record gas production 2012 = 25.3 tcf)
5
Source: US Energy Information Administration (EIA), IHS CERA.
Note: Bcf = billion cubic feet.
July 2013 = 67 Bcfd
+ 16 bcfd
Gas Rigs** 1695 914 372
** Baker-Hughes
Copyright © 2013 IHS Inc. All Rights Reserved. Colorado School of Mines , 10-25-2013
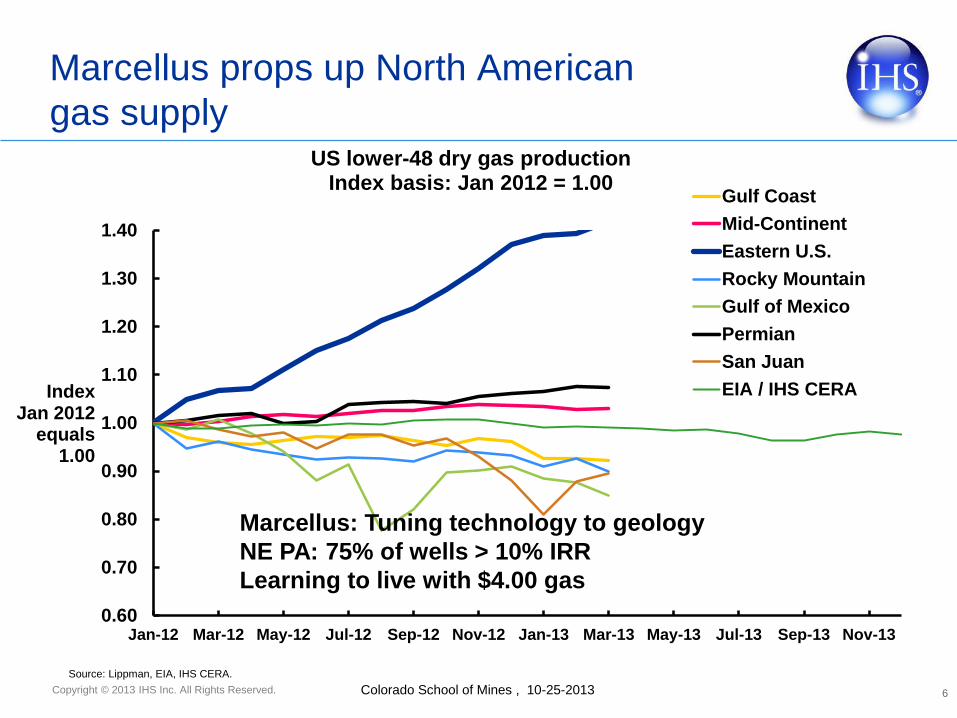
Marcellus props up North American
gas supply
6
0.60
0.70
0.80
0.90
1.00
1.10
1.20
1.30
1.40
Jan-12 Mar-12 May-12 Jul-12 Sep-12 Nov-12 Jan-13 Mar-13 May-13 Jul-13 Sep-13 Nov-13
Index Jan 2012
equals 1.00
US lower-48 dry gas production Index basis: Jan 2012 = 1.00
Gulf Coast
Mid-Continent
Eastern U.S.
Rocky Mountain
Gulf of Mexico
Permian
San Juan
EIA / IHS CERA
Source: Lippman, EIA, IHS CERA.
Marcellus: Tuning technology to geology
NE PA: 75% of wells > 10% IRR
Learning to live with $4.00 gas
Copyright © 2013 IHS Inc. All Rights Reserved. Colorado School of Mines , 10-25-2013
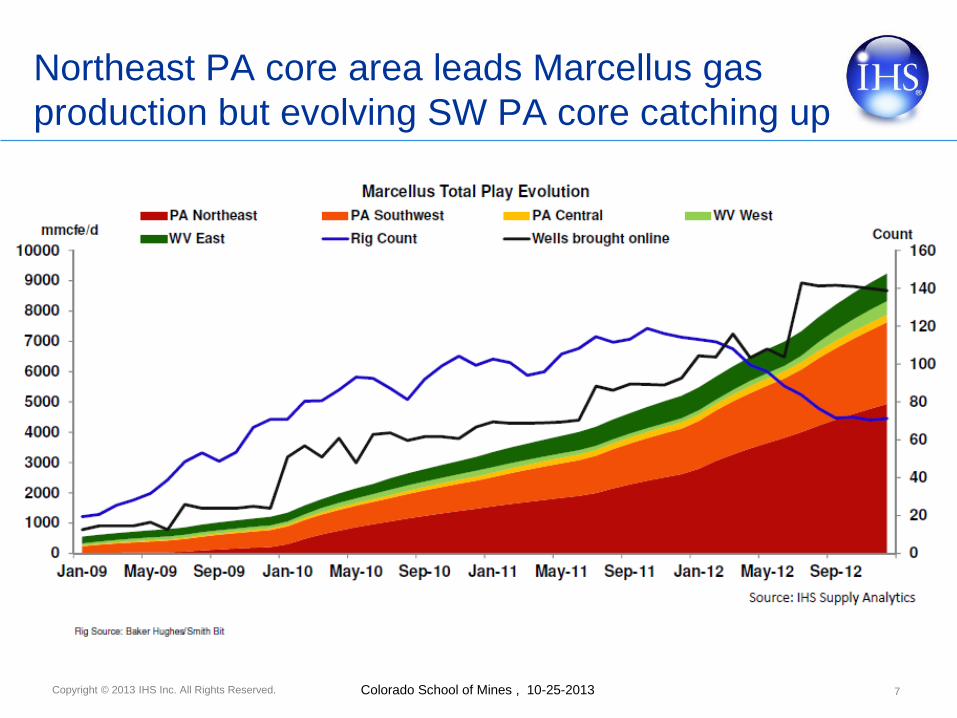
Northeast PA core area leads Marcellus gas
production but evolving SW PA core catching up
7
Copyright © 2013 IHS Inc. All Rights Reserved. Colorado School of Mines , 10-25-2013
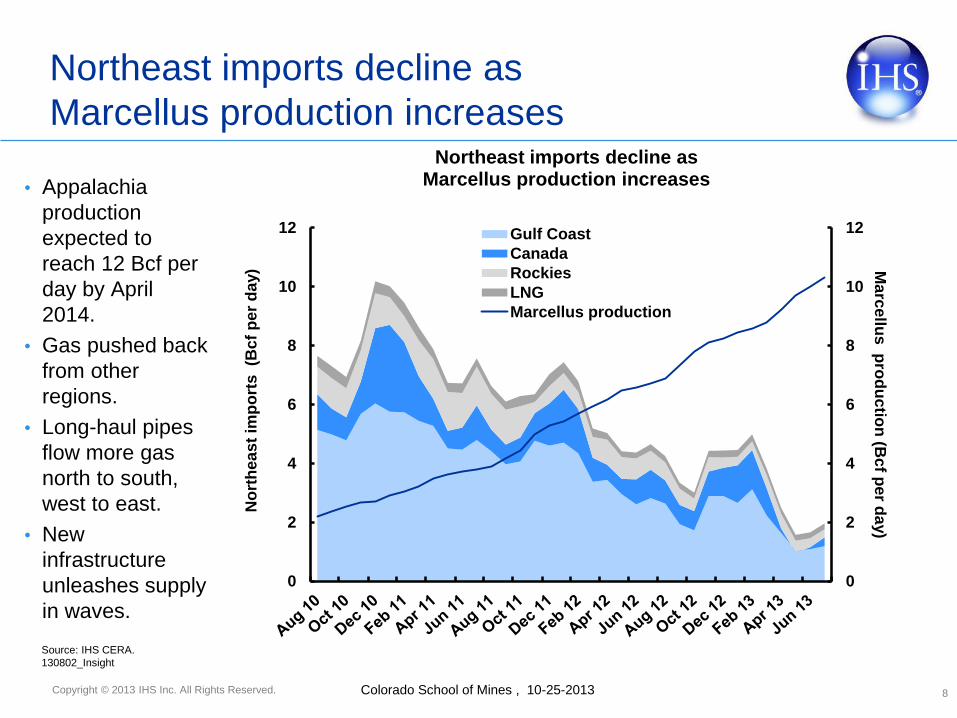
• Appalachia
production
expected to
reach 12 Bcf per
day by April
2014.
• Gas pushed back
from other
regions.
• Long-haul pipes
flow more gas
north to south,
west to east.
• New
infrastructure
unleashes supply
in waves.
Northeast imports decline as
Marcellus production increases
8
0
2
4
6
8
10
12
0
2
4
6
8
10
12
Ma
rce
llus p
rod
uc
tion
(Bcf p
er d
ay)
No
rth
ea
st
imp
ort
s (B
cf
pe
r d
ay)
Northeast imports decline as Marcellus production increases
Gulf Coast
Canada
Rockies
LNG
Marcellus production
Source: IHS CERA.
130802_Insight
Copyright © 2013 IHS Inc. All Rights Reserved. Colorado School of Mines , 10-25-2013
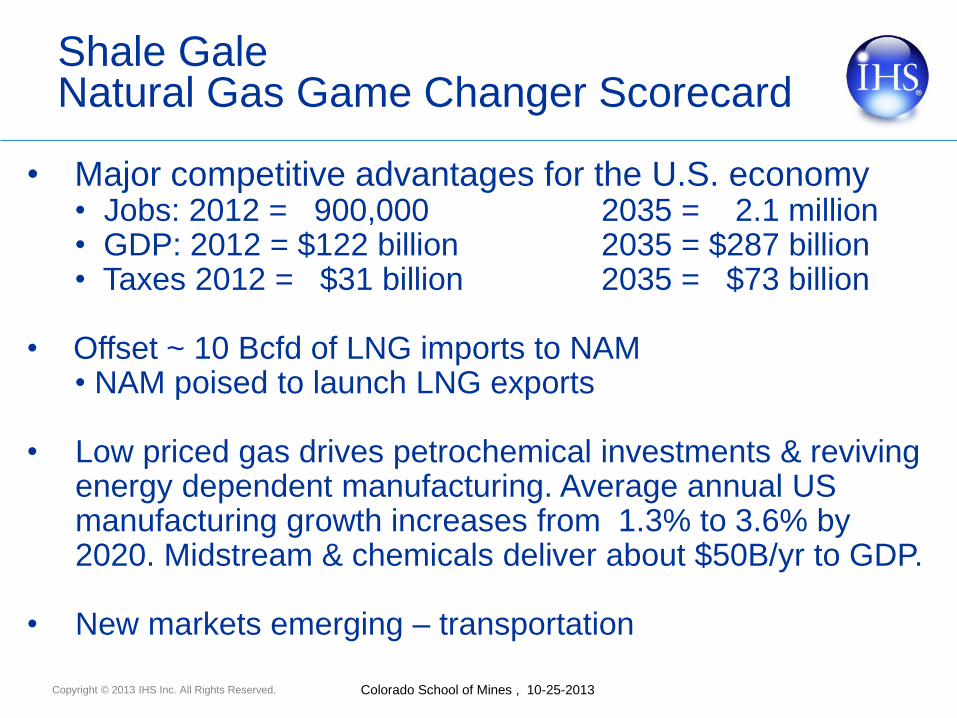
Shale Gale Natural Gas Game Changer Scorecard
• Major competitive advantages for the U.S. economy • Jobs: 2012 = 900,000 2035 = 2.1 million • GDP: 2012 = $122 billion 2035 = $287 billion • Taxes 2012 = $31 billion 2035 = $73 billion
• Offset ~ 10 Bcfd of LNG imports to NAM • NAM poised to launch LNG exports
• Low priced gas drives petrochemical investments & reviving energy dependent manufacturing. Average annual US manufacturing growth increases from 1.3% to 3.6% by 2020. Midstream & chemicals deliver about $50B/yr to GDP.
• New markets emerging – transportation
Copyright © 2013 IHS Inc. All Rights Reserved. Colorado School of Mines , 10-25-2013
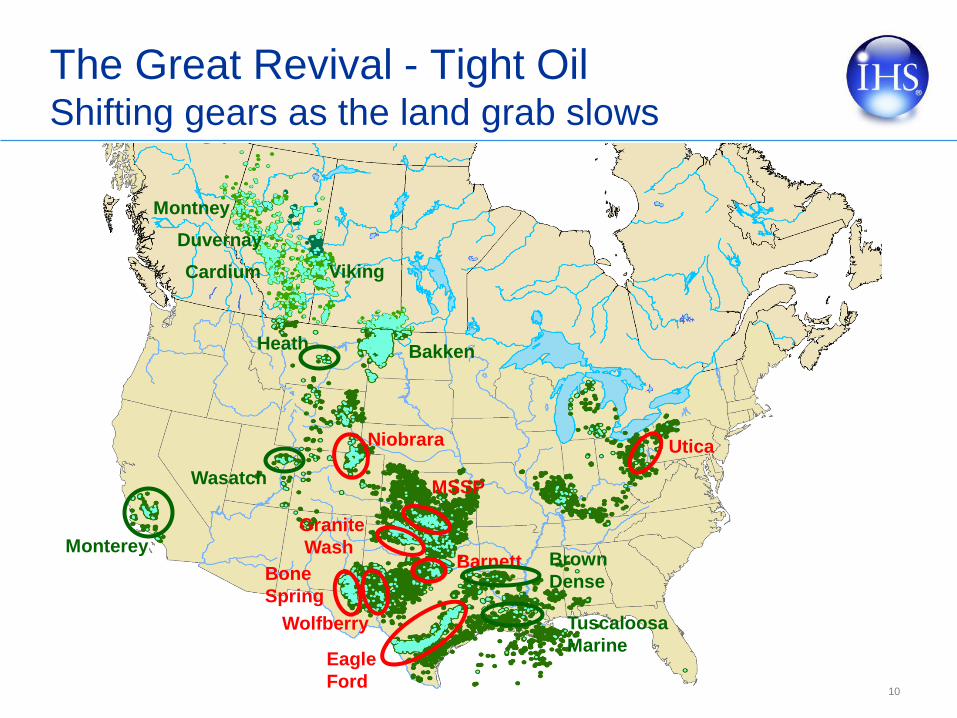
The Great Revival - Tight Oil Shifting gears as the land grab slows
10
Niobrara Utica
MSSP
Granite
Wash
Wolfberry
Eagle
Ford
Barnett Bone
Spring
Brown
Dense
Tuscaloosa
Marine
Wasatch
Monterey
Heath Bakken
Montney
Viking Cardium
Duvernay

Copyright © 2013 IHS Inc. All Rights Reserved. Colorado School of Mines , 10-25-2013
U.S. liquids production could exceed 1970’s
peak, and reverse four decades of decline. 2012 record ~ 1 MMb/d liquids production growth!
• Reversing a trend that spanned
the previous four decades, U.S.
liquids production is expected to
regain and overtake its 1970
peak by 2020.
• Driven solely by the growth in
tight oil and wet gas plays, total
liquids production could
potentially reach >11.5
mmboe/d by the end of this
decade.
0
2
4
6
8
10
12
1960 1970 1980 1990 2000 2010 2020
mmboe/d U.S. Oil and NGL Production: 1960 – 2020
Conventional Oil NGLs Tight Oil
Source: Supply Analytics, North American Crude Oil Markets

Copyright © 2013 IHS Inc. All Rights Reserved. Colorado School of Mines , 10-25-2013
Outside of the Bakken – Three Forks and Eagle Ford
plays, there is more gas and lower IP rates
12
0%
10%
20%
30%
40%
50%
60%
70%
80%
90%
100%
0
200
400
600
800
1,000
1,200
1,400
% Gas boe/d
Avg. Peak Mo. Oil Rate (bbl/d) Avg. Peak Mo. Gas Rate (boe/d) % Gas
Source: Supply Analytics
Copyright © 2013 IHS Inc. All Rights Reserved. Colorado School of Mines , 10-25-2013
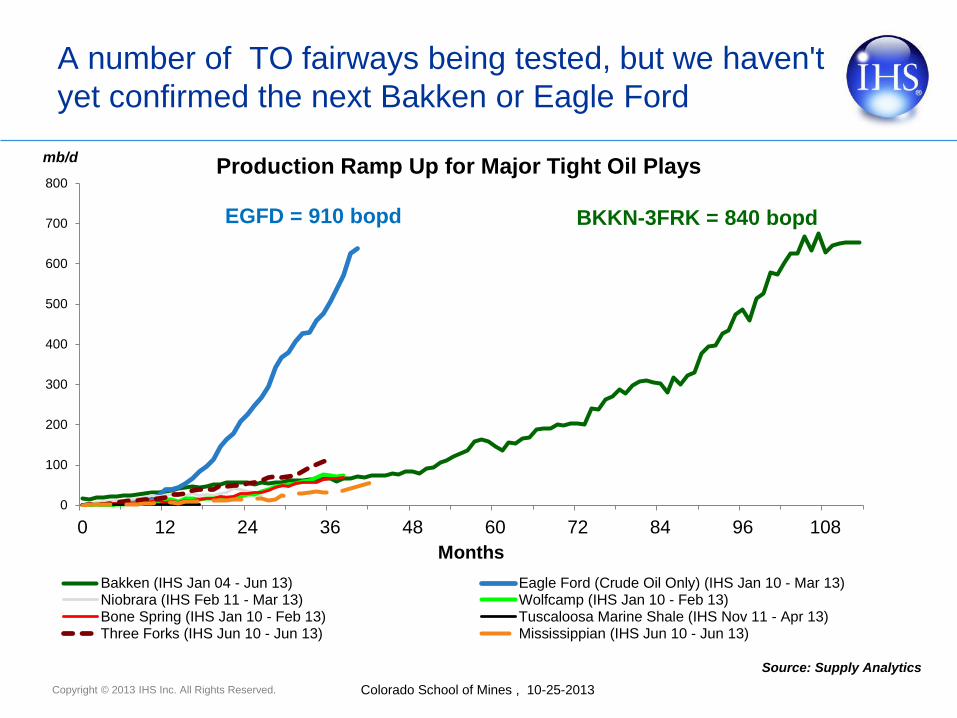
A number of TO fairways being tested, but we haven't
yet confirmed the next Bakken or Eagle Ford
0
100
200
300
400
500
600
700
800
0 12 24 36 48 60 72 84 96 108
mb/d
Months
Production Ramp Up for Major Tight Oil Plays
Bakken (IHS Jan 04 - Jun 13) Eagle Ford (Crude Oil Only) (IHS Jan 10 - Mar 13)Niobrara (IHS Feb 11 - Mar 13) Wolfcamp (IHS Jan 10 - Feb 13)Bone Spring (IHS Jan 10 - Feb 13) Tuscaloosa Marine Shale (IHS Nov 11 - Apr 13)Three Forks (IHS Jun 10 - Jun 13) Mississippian (IHS Jun 10 - Jun 13)
Source: Supply Analytics
EGFD = 910 bopd BKKN-3FRK = 840 bopd

Copyright © 2013 IHS Inc. All Rights Reserved. Colorado School of Mines , 10-25-2013
Bakken sub-plays based on
peak production / 1000 lateral ft.
14
Copyright © 2013 IHS Inc. All Rights Reserved. Colorado School of Mines , 10-25-2013
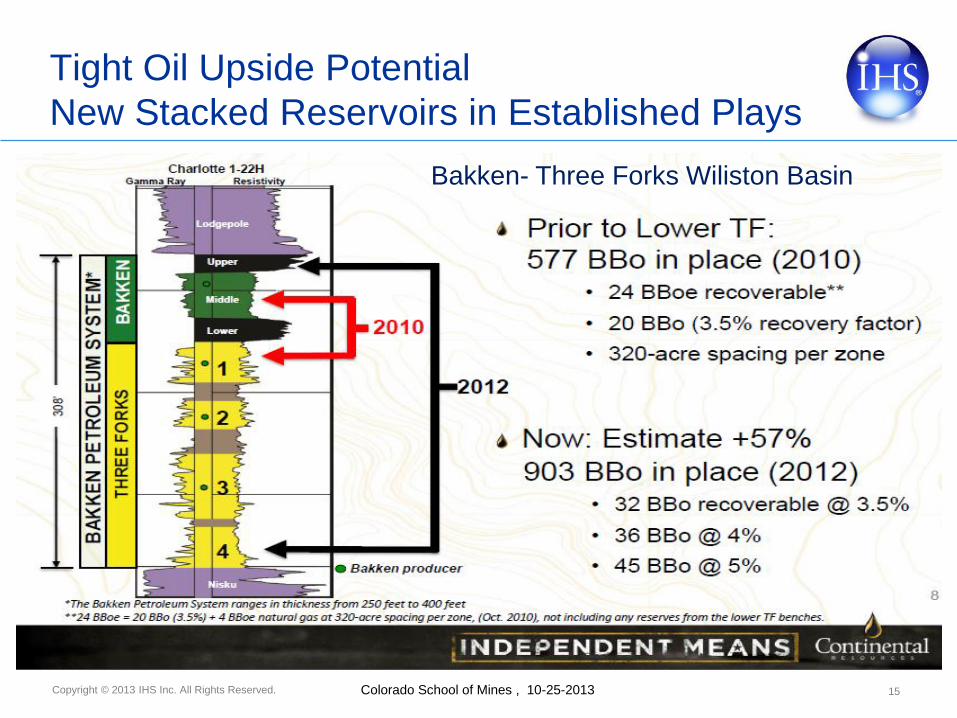
Tight Oil Upside Potential
New Stacked Reservoirs in Established Plays
15
Bakken- Three Forks Wiliston Basin

Copyright © 2013 IHS Inc. All Rights Reserved. Colorado School of Mines , 10-25-2013
The Tight Oil Revolution Scorecard
•What does this mean to the U.S. economy?
• Jobs: 2012 = 800,000 2035 = 1.4 million
• GDP: 2012 = $116 billion 2035 = $188 billion
• Taxes: 2012 = $ 30 billion 2035 = $ 51 billion
• Dramatic decrease in US oil imports
• In 2005 US net oil imports = 12.2 mbd or 58% of demand. By
2020 US net import requirement will shrink to 30% of demand.
• Huge implications for energy security and the economy
• The learning curve is alive and well
The rest of the story:
Towards a Manufacturing Renaissance – How the Rise
of Unconventional Oil and Natural Gas is Transforming
the US Economy and Changing US Global
Competitiveness
17
Estimate > $125 billion in direct capital investment
to build out the U.S. midstream infrastructure to
Incremental increases in unconventional oil and gas
Copyright © 2013 IHS Inc. All Rights Reserved. Colorado School of Mines , 10-25-2013
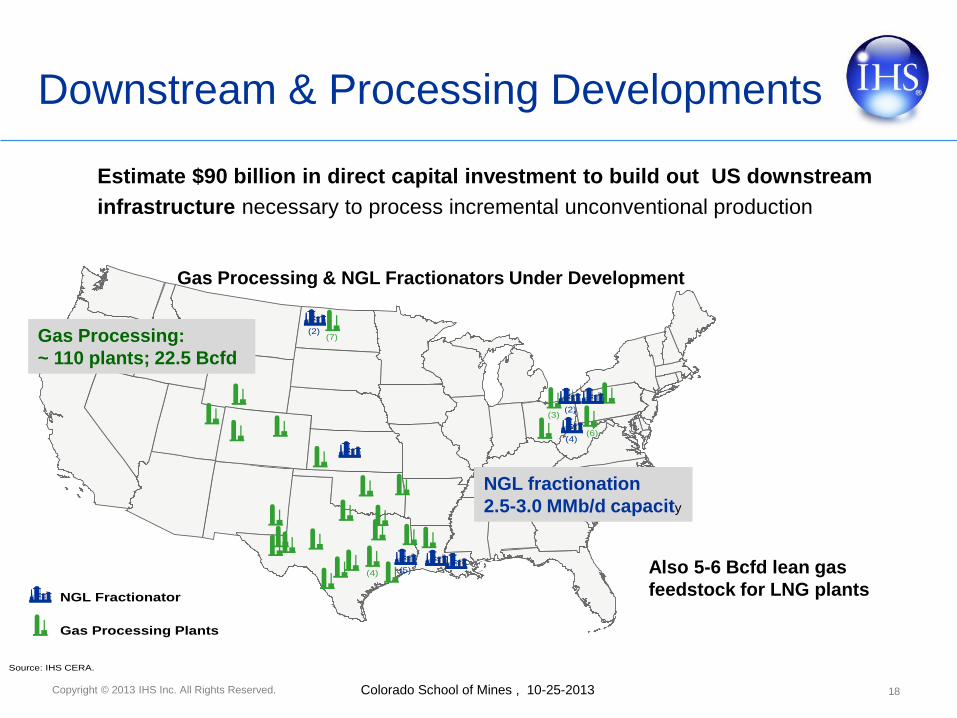
Downstream & Processing Developments
18 1
Source: IHS CERA.
Gas Processing Plants
NGL Fractionator
(5)(4)
(2)(7)
(3)(2)
(6)(4)
Estimate $90 billion in direct capital investment to build out US downstream
infrastructure necessary to process incremental unconventional production
Gas Processing & NGL Fractionators Under Development
Gas Processing:
~ 110 plants; 22.5 Bcfd
NGL fractionation
2.5-3.0 MMb/d capacity
Also 5-6 Bcfd lean gas
feedstock for LNG plants

Copyright © 2013 IHS Inc. All Rights Reserved. Colorado School of Mines , 10-25-2013
0
10
20
30
40
50
60
70
80
0
10
20
30
40
50
60
70
80
90 95 00 05 10 15 20
Million Metric Tons
North America
West Europe
A Renewal of the US Chemical Industry Basic Chemicals & Plastics Production Change
(1990 Base)
US > $100 Billion in new investment

Copyright © 2013 IHS Inc. All Rights Reserved. Colorado School of Mines , 10-25-2013
The Climate Change Benefit
US Total Energy Related GHG Emissions
20

© 2013 IHS
• Unconventional oil and natural gas activity is reshaping America’s energy future &
bringing significant benefits to the US economy in terms of jobs, government
revenues, and GDP.
• A new era of affordable and abundant energy is creating significant competitive
advantages for the US in both energy-intensive industries and industries that rely on
natural gas derivatives as critical production feedstock.
Summary: Measuring the Transformative Contribution
of Unconventional Energy to the US Economy
21
2012
$1,200
2015
$2,000
2025
$3,500
2012
2.1M
2020: 3.3M
2025: 3.9M
• Jobs: 2.1 million jobs in 2012, 3.3
million in 2020 and 3.9 million in 2025.
• GDP: annual contributions will nearly
double from $284 billion in 2012 to
$533 billion in 2025.
• Government revenues: average $115
billion annually, totaling over $1.6
trillion from 2012 to 2025.
• Real household disposable income:
increase of more than $1,200 in 2012,
$2,000 in 2015 to more than $3,500 in
2025
Employment Contribution
Contribution to Household Income
The “Unconventional” O&G Revolution: Another Look Under the Hood
Pete Stark,
Senior Research Director and Advisor
IHS CERA
RCP Sponsors Meeting
Colorado School of Mines
October 25, 2013
CONFIDENTIAL
© 2012, All rights reserved, Cambridge Energy Research Associates, Inc., 55 Cambridge Parkway, Cambridge, Massachusetts 02142
No portion of this presentation may be reproduced, reused or otherwise distributed in any form without prior written consent.