Twin Cities Area Economic and Business ... - sos.state.mn.us

NAACP Economic Inclusion Plan | 1
Minneapolis-Saint Paul | Minnesota
Derrick Johnson, NAACP President & CEOLeon W. Russell, Chairman, Board of Directors
ECONOMIC INCLUSION PLAN
THE
TWIN

TABLE OF CONTENTS
Senior Director’s Message ............................ 3
Letter from Minnesota State President ......... 4
Executive Summary ....................................... 5
Introduction ................................................... 7
Employment .................................................. 8
Income ......................................................... 11
Poverty ........................................................ 12
Wealth .......................................................... 13
Housing ....................................................... 14
Business ...................................................... 15
Education .................................................... 16
Health .......................................................... 18
Criminal Justice ........................................... 19
Twin Cities Community Engagement .......... 20
NAACP Policy Prescriptions ........................ 23
Employment ........................................... 23
Education ............................................... 28
Health ..................................................... 32
Housing .................................................. 33
Criminal Justice ..................................... 34
Voting Rights .......................................... 41
Concluding Statement ................................. 45
Acknowledgments ....................................... 46
2 | NAACP Economic Inclusion Plan

NAACP Economic Inclusion Plan | 3
SENIOR DIRECTOR’S MESSAGE
Senior Director’s Message ............................ 3
Letter from Minnesota State President ......... 4
Executive Summary ....................................... 5
Introduction ................................................... 7
Employment .................................................. 8
Income ......................................................... 11
Poverty ........................................................ 12
Wealth .......................................................... 13
Housing ....................................................... 14
Business ...................................................... 15
Education .................................................... 16
Health .......................................................... 18
Criminal Justice ........................................... 19
Twin Cities Community Engagement .......... 20
NAACP Policy Prescriptions ........................ 23
Employment ........................................... 23
Education ............................................... 28
Health ..................................................... 32
Housing .................................................. 33
Criminal Justice ..................................... 34
Voting Rights .......................................... 41
Concluding Statement ................................. 45
Acknowledgments ....................................... 46
MESSAGE FROM MARVIN OWENS, JR.Senior Director, NAACP Economic Programs
It is a true tale of two Minnesota’s one white and one Black. Minnesota represents a paradox as a state that ranks among the very best in overall quality of life and among the very worst in racial and ethnic disparities. The Twin Cities of Minnesota, Minneapolis and St. Paul, refl ect this paradox. Only ten miles away from one another, divided by a river, the Twin Cities each have decidedly different cultures.
In examining the Twin Cities, Minneapolis specifi cally has had to deal with the harsh realities of contentious/strained police community relationships. We realize decades and decades of economic discrimination and economic injustice are fueling frustrations in many cities across the Country where often all it takes is one incident to ignite violence. Perhaps what we’re not talking enough about are the underlying economic conditions.
In response, we came up with a set of economic policies around what needs to change in these cities that would impact African American communities. We were able to use research, data gathering, data analysis and community input to uncover and amplify the current economic conditions that result in the disparities. Our goal is to work with NAACP Units to identify actionable economic solutions to the issues plaguing their communities. The conversation today is focused around what we can do. There is a need to develop some plans of action and things we can work on together.
While we realize there have been numerous studies and reports documenting the stark disparities – and have heard that, “Minnesota has been studied to death”, we feel it is important to lend our voice and provide this Twin Cities Economic Inclusion Plan to further empower our NAACP Leaders on the ground and community stakeholders. Through the support of the Northwest Area Foundation, who has been committed to improved economic conditions, we present this report.
4 | NAACP Economic Inclusion Plan
LETTER FROM MINNESOTA STATE PRESIDENT
Dear Community Members and Stakeholders:
Minnesota has consistently been ranked as one of the greatest states to live and work in the United States—unless you are a person of color.
Minnesota is home of some of the greatest racial disparities for African American people in the Country. Minnesota’s racial disparities are among the worst in the nation in every key indicator of quality of life: Employment, Education, Criminal Justice, Juvenile Justice, Income, Poverty, Home Ownership, and Health.
It seems that every few months a new report comes out to highlight the disparities from economics, criminal justice to education and housing.
The latest report came from the Brookings Metropolitan Policy Program which analyzed the economic growth, prosperity, and inclusion for the 100 largest U.S. metropolitan areas in 2017. The 2019 Metro Monitor ranked Minneapolis-St. Paul 92nd out of 100 as the worst performing metro areas when it came to racial inclusion. The report shows that the Twin Cities continues to grow and prosper while communities of color are not enjoying the same benefi ts.
While the data confi rms what most members of the African-American community endures daily. The numbers cannot adequately represent the devastating impact that the racial disparities have on the African-American community. One only has to look at the faces of the African-Americans living in impoverished neighborhoods, attending failed schools, over represented in a broken criminal justice system, and suffering from covert and overt employment discrimination on a daily basis to see that not everyone is enjoying the prosperity of Minnesota.
Minnesota has reached a breaking point which has led to social and violent unrest. There is a critical need for a concrete action plan to address the racial disparities in Minnesota. Political, Community and Economic leaders must come together to intentionally address this crisis.
On behalf of the Minnesota/ Dakotas NAACP State Conference, I would like to thank the National NAACP Economic Department for identifying the Twin Cities as one of the communities in the nation to help develop an Economic Inclusion Plan to address the racial and economic disparities. We welcome the support and participation of the National NAACP as the Twin Cities works towards developing a State plan to address the socio-economic disparities and the widening gaps in wealth and income.
The problems in Minnesota have been going on far too long. If the growing disparities, in education, economics, criminal justice are not addressed immediately our children will not have a future.
Sincerely,
Minnesota/Dakotas Area State Conference President

NAACP Economic Inclusion Plan | 5
EXECUTIVE SUMMARY
There are two Minnesotas, one white, one black —
separate and unequal. This statement echoes the
1968 fi ndings of the National Advisory Commission
on Civil Disorders, commonly referred to as the
Kerner Commission. In addition to explicitly drawing
the nation’s attention to “white racism” as the root
cause of “pervasive discrimination in employment,
education and housing” faced by African Americans,
the fi nal report of the Kerner Commission was a call
to action. The recommended path forward included
legislation to promote racial integration and make
desperately needed investments in poor African
American communities through job creation, job
training and decent housing. However, failure by
President Johnson and other leaders to heed those
recommendations from over 50 years ago has left
racial inequality largely unchanged in this country.
This lack of decisive action is evident in the stark
racial divide that persists in the Twin Cities today.
This Twin Cities Economic Inclusion Plan (EIP) serves as more than just another report. In recognition of the frustration felt by many who believe that “Minnesota has been studied to death,” the NAACP issues this EIP as an admonishment to break the cycle of complacency and inaction that have left racial inequality unchecked in the following areas:
Employment and Earnings■ The unemployment rate for African Americans in the
Twin Cities averaged 7.8 percent in 2017, more than 2.5 times higher than the rate for white residents (2.9 percent).
■ While African Americans in the Twin Cities are less likely than whites to be employed, African Americans actually participate in the labor market at a higher rate than whites. In 2017, 73.7 percent of African Americans age 16 or older were either working or looking for work, compared to 71.5 percent of whites.
Income ■ In 2017, median household income for whites living in
the Twin Cities was $82,371, compared to $39,851 for African American households (just 48 percent of white household income).
Poverty■ The black poverty rate in the Twin Cities was 25.5
percent –fi ve times higher than the rate for white residents of the Twin Cities.
■ Among children under the age of 18, the child poverty rate was 8.5 times higher for black children (33.1 percent) in the Twin Cities than for the city’s young white residents (3.9 percent).
There are two Mi� esot� , � e wh� e, � e black — separa� � une� al.

6 | NAACP Economic Inclusion Plan
Business Ownership■ African Americans represent almost 9 percent of
the population, but just 6 percent of total business ownership. Compared to white-owned businesses in the area, the average black-owned business generates less revenue, is less likely to have employees and pays employees less per year.
Homeownership ■ In the Twin Cities, about a quarter of African American
residents (25.6 percent) own their homes compared to more than three-quarters (76.8 percent) of whites.
Education ■ In the Minneapolis Public School District (MPSD), 57
percent of African American students graduate within four years, compared to 86 percent of white students.
■ In the St. Paul Public School District (SPPSD), 70 percent of African American students graduate within four years, compared to 84 percent of white students.
■ During the 2016-17 school year in MPSD, African American students accounted for an astounding 76 percent of suspensions despite only being 36 percent of the student body population. By contrast, white students comprised 34 percent of the student body, but only 7 percent of the district’s suspensions.
Criminal Justice / Juvenile Justice System ■ In the Twin Cities, African Americans represent 9
percent of the overall population, but are incarcerated at 11 times the rate of whites who represent 76 percent of the population.
■ According to the 2017 Annual Report of the Minnesota Juvenile Justice Advisory Committee, black youth in Minnesota represent 11.5 percent of the population under age 18 and 31 percent of youth detained in a juvenile correctional facility. By comparison, white youth are underrepresented, accounting for 79 percent of the youth population and 46 percent of juvenile detainees.
This report also brings to bear local voices from the Twin Cities, capturing their sentiments and ideas for improving conditions in their local communities. After convening two events in the Twin Cities – a Leadership Roundtable and a Community Town Hall – three broad policy themes emerged: (1) Economically Inclusive Family Policy; (2) Economically Inclusive Financial Policy; and
(3) Economically Inclusive Criminal Justice Policy. Across these three areas of interest, leaders and community members placed particular emphasis on expanded opportunities for entrepreneurship, improved workforce outcomes, and sweeping reform of the practices and policies of the criminal justice system.
Finally, the NAACP outlines a comprehensive, multi-pronged policy agenda anchored by fi ve basic principles:
Economic Sustainability: A chance to live the American Dream for all. Every person will have equal opportunity to achieve economic success, sustainability, and fi nancial security.
Education: A free, high-quality, public education for all. Every child will receive a free, high quality, equitably-funded, public pre-K and K-12 education followed by diverse opportunities for accessible, affordable vocational or university education.
Health: Health equality for all Americans including a healthy life and high-quality health care. Everyone will have equal access to affordable, high-quality health care, and racially disparate health outcomes will end.
Public Safety and Criminal Justice: Equitable dispensation of justice for all. Disproportionate incarceration, racially motivated policing strategies, and racially biased, discriminatory, and mandatory minimum sentencing will end. Incarceration will be greatly reduced and communities will be safer. The death penalty will be abolished at the state and federal level, as well as in the military.
Voting Rights and Political Representation: Protect and enhance voting rights and fair representation. Every American will have free, open, equal, and protected access to the vote and fair representation at all levels of the political process. By protecting democracy, enhancing equity, and increasing democratic participation and civic engagement, African Americans will be proportionally elected to political offi ce.
We urge elected offi cials, NAACP leaders and community stakeholders to make use of the data, community insights and policy recommendations included in this report to create one Minneapolis, one St. Paul and one Minnesota.
E��ry pers� wi� ha�� e� al o� ��tun� y � achie�� ec� ��ic succe� , sust ainabil� y, � fi nancial secur� y.
21
34
5

NAACP Economic Inclusion Plan | 7
INTRODUCTION
A previous report on Minnesota racial disparities
from the St. Paul, Minnesota chapter of the NAACP
opened with, “There are two Minnesotas, one white,
one black —separate and unequal.” This statement
echoes the 1968 fi ndings of the National Advisory
Commission on Civil Disorders, commonly referred
to as the Kerner Commission. The Commission cited
“white racism” resulting in “pervasive discrimination
in employment, education and housing” as the
cause behind civil unrest in cities across the United
States. They also recommended a path forward that
included legislation to promote racial integration
and enrich poor African American communities in
cities across the country through job creation, job
training and decent housing. However failure by
President Johnson and other leaders to heed those
recommendations from over 50 years ago has left
racial inequality largely unchanged in this countryi.
Minnesota is home of some of the greatest disparities for African American people in the Country. Minnesota’s racial disparities are among the worst in the nation in every key indicator of quality of life: Employment, Education, Criminal Justice, Juvenile Justice, Income, Poverty, Home Ownership, and Health. These racial disparities are also typical of Minnesota’s largest metropolitan area, which includes the cities of Minneapolis and St. Paul, collectively known as the Twin Cities.
In a 2018 keynote address to a group of researchers and policy advocates in Washington, DC, Rev. Dr. William J. Barber, II, Moral Monday Architect, President and Senior Lecturer of Repairers of the Breach and Co-Chair of the Poor People’s Campaign stated:
Research has helped us pull back the cover and force society to see the hurt and the harm of the decisions that people are making….You need researchers that can say to the nation, as long as your politics are this way, you might have a little ebb and fl ow but you’re never really going to be able to fi x the society because the society’s policies have actually insulated destruction. That’s why you have to have researchers, to protect the integrity of the movementii.
This report provides the data needed to support a movement to eliminate racial disparities in employment and earnings, income, poverty, wealth, education and health in Minnesota and the Twin Cities.
MINNESOTA AND TWIN CITIES RACIAL DISPARITIES

8 | NAACP Economic Inclusion Plan
EMPLOYMENT AND EARNINGS
According to the Bureau of Labor Statistics, the 2017
average annual unemployment rate in Minnesota was one
of the lowest in the country at 3.4 percent, compared to
the U.S. unemployment rate of 4.4 percentiii. However,
Minnesota’s low overall unemployment rate masks wide
racial disparities statewide as well as in the Twin Cities.
The unemployment rate for African Americans in the
Twin Cities averaged 7.8 percent in 2017, more than
2.5 times higher than the rate for white residents (2.9
percent)iv. While African Americans in the Twin Cities are
less likely than whites to be employed, African Americans
actually participate in the labor market at a higher rate
than whites. In 2017, 73.7 percent of African Americans
age 16 or older were either working or looking for work,
compared to 71.5 percent of whites.
Racial inequality in the Twin Cities labor market goes beyond the likelihood of having a job or not. Even among working residents, there are large racial differences in the kinds of jobs held, as well as in earnings. Forty-three percent of white men are employed in management, business, science and arts occupations – jobs typically at the higher end of the wage scale – compared to 29 percent of African American men. However, relative to white men, African American men (24 percent) are more likely to be employed in jobs traditionally considered to be working class occupations. Twenty-fi ve percent of African American men and 15 percent of white men work in production, transportation, and material moving occupations while African American men (24 percent) are more than twice as likely as white men (10 percent) to be employed in lower paying service occupations.
Racial ine� al� y in � Twin C� es lab�� market g� s � y� d � likelih� d � having a job �� not.

NAACP Economic Inclusion Plan | 9
Occupational disparities by race are even larger among working women in the Twin Cities. Fifty-one percent of white women are employed in management, business, science and arts occupations, compared to 29 percent of African American women. At the other end of the wage scale, African American women are 2.5 times more concentrated in service occupations (41 percent) than white women (17 percent).
These occupational differences are refl ected in signifi cant earnings gaps by race and gender. In 2017, the typical (i.e. median) African American woman working full-time, year-round earned 56 cents for every dollar earned by a white man and the typical African American man earned 58 cents. White women earned 80 cents on the dollar, relative to white men. Median annual earnings of white men working full-time, year-round in the Twin Cities were $65,655, compared to $52,448 for white women, $38,051 for African American men, and $36,511 for African American women.
0%
12.5%
25%
37.5%
50%
Occupational Distribution of Twin Cities: Working Men by Race, 2017
Management, business, science, and arts
Service Sales andoffice
Natural resources, construction, and
maintenance
Production, transportation,
and material moving
Black men
White men
Figure A
0%
15%
30%
45%
60%
Occupational Distribution of Twin Cities: Working Women by Race, 2017
Management, business, science, and arts
Service Sales andoffice
Natural resources, construction, and
maintenance
Production, transportation,
and material moving
Black women
White women
Figure B

10 | NAACP Economic Inclusion Plan
Educational attainment also affects employment and earnings. At higher levels of education, workers have better job prospects and can earn higher wages. In the Twin Cities, nearly 60 percent of African American adults age 25 or older have completed some education beyond high school, compared to over 75 percent of whites. This includes those who have completed some college coursework (but did not earn a degree), associate’s degree holders, and those with a bachelor’s or advanced degree. While 17 percent of African American adults in the Twin Cities did not complete high school, there are still more African Americans who have a bachelor’s degree or higher (23 percent). This is an important point to make because although African Americans have actively pursued educational opportunities that would boost their employment prospects and earnings potential, large disparities in these and other economic outcomes remain.
Racial differences in educational attainment and
occupation only partly explain racial differences in
employment and earnings. Research has shown that
even after we account for factors like education and
occupation, signifi cant disparities by race and gender
persist. In fact, even among workers with the same
level of education, African Americans are more likely
than whites to be unemployed and to have lower
earnings. This strongly suggests that discrimination
is a major factor in the labor market outcomes of
African American women and men.
0%
12.5%
25%
37.5%
50%
Highest Education Completed by Twin Cities Adults (Age 25+) by Race, 2017
Black
White
Less thanhigh school
High school Some college orAssociate’s degree
Bachelor’s degreeor more
Figure C
Educati� al a� ainment also aff ects employment � earnings.

NAACP Economic Inclusion Plan | 11
INCOMEGiven that the majority of household income in the United States comes from the money people earn through work, the ability to secure and maintain a stable job that pays well and provides good benefi ts is essential. Therefore, the existence of large and persistent racial disparities in employment and earnings limits the income of African American households relative to white households. According to the U.S. Census Bureau, in 2017 the median income for White households was $65,845. The median income for Black households in 2017 was $40,165 (or 61 percent of white household income)v. The income gap between African Americans and whites in Minnesota is even larger (African Americans have just 53 percent of white household income), and the racial income gap in the Twin Cities is larger still. In 2017, median household income for whites living in the Twin Cities was $82,371, compared to $39,851 for African American households (just 48 percent of white household income).
Racial differences in household type or composition also intersect with employment and earnings disparities to affect the racial income gap. For example, households with only one adult are more likely to be households where only one person works, while two-adult households, such as married-couple families, are more likely to be dual-earner households. In the Twin Cities, over half of white households (53 percent) consist of a married-couple family, while this is true of only 30 percent of African American households. By contrast, more than a quarter of African American households (27 percent) are headed by a single woman, compared to just 7 percent of white households. The racial and gender pay gaps highlighted in the previous section further limit income for households headed by single African American women.
Median Household Income in the U.S., Minnesota and Twin Cities by Race, 2017
Black
White
$
Twin Cities
Minnesota
United States
$22,500 $45,000 $67,500 $90,00
Figure D
NAACP Economic Inclusion Plan | 11 11 11

12 | NAACP Economic Inclusion Plan
POVERTYBecause the typical (i.e. median) African American household has less than half the income of the typical white household, African American households in the Twin Cities are in a particularly vulnerable economic position. According to the U.S. Census Bureau, in 2017 Minnesota’s overall poverty rate (9.5 percent) was well below the national average (13.4 percent). However, the statewide poverty rate for black residents (28.3 percent) exceeded the national average for African Americans (22.9 percent). The black poverty rate in the Twin Cities was 25.5 percent – only marginally better than the state average for African Americans, but still fi ve times higher than the rate for white residents of the Twin Cities. Among children under the age of 18, the child poverty rate was 8.5 times higher for black children (33.1 percent) in the Twin Cities than for the city’s young white residents (3.9 percent).
Racial differences in rates of poverty are even starker by family type. On average, married couple families with children tend to have lower rates of poverty than single female-headed families with children. However, in the Twin Cities, the poverty rate among married couple black families (15.8 percent) was not only much higher than that of married couple white families (1.1 percent), but was also higher than the poverty rate for families headed by single white women (14.1 percent). For African American families headed by a single mother, the poverty rate was as high as 40.3 percent in 2017.
Poverty Rates in the United States,Minnesota and Twin Cities by Race, 2017
Black
White
30%
22.5%
15%
7.5%
0%United States Minnesota Twin Cities
Figure E1
Child Poverty Rates in the United States, Minnesota and Twin Cities by Race, 2017
Black
White
40%
30%
20%
10%
0%United States Minnesota Twin Cities
Figure E2

NAACP Economic Inclusion Plan | 13
WEALTHJust as there are clear disparities in the experience of poverty or material hardship between African Americans and whites, there are stark differences at the other end of the spectrum as well. While income is important to a family’s ability to provide for their daily needs like food, housing and utilities, wealth provides a critical shelter against uncertainties like unemployment, illness and disability. Further, wealth makes it easier for families to send their children to college without incurring large amounts of debt, to fund a comfortable retirement, or to start a business, which can bring in additional income and wealth.
Nationally, the racial income gap is much smaller than the racial wealth gap. The median black family has 61 percent of the income of the median white household, but just 10 percent of the wealthvi. While direct estimates of wealth or net worth by race are not available for the Twin Cities, housing equity accounts for about two-thirds of all wealth held by the typical (median) household in the United States. Below, we examine racial disparities in homeownership and business ownership as an illustration of the wealth gap in Minnesota and the Twin Cities.
Family Poverty Rates byRace and Family Type, 2017
Married-couple family with children
Single female householder with children
50%
37.5%
25%
12.5%
0%Black White
Figure F
Just � � ere are clear dispar� es in � experience � po��rty ��
ma� rial hardship � tw� n Afric� Americans � wh� es, � ere are st ark diff erences at � o� er end �
� e spectrum � ��� .

14 | NAACP Economic Inclusion Plan
HOMEOWNERSHIP
Minnesota’s overall home ownership rate is among the highest in the nation – 71.6 percent, compared to a
national average of 63.9 percent in 2017. African Americans have the lowest homeownership rate of all racial
and ethnic groups in Minnesota at 24 percent. This too is much lower than the average homeownership rate for
African Americans nationwide (41.7 percent). In the Twin Cities, about a quarter of African American residents
(25.6 percent) own their homes compared to more than three-quarters (76.8 percent) of whites.
Homeownership Rates in the United States, Minnesota and Twin Cities by Race, 2017
Black
White
United States
80%
60%
40%
20%
0%Minnesota Twin Cities
Figure G
The signifi cance of homeownership to the racial wealth gap goes beyond simply owning a home because even African American families who are fortunate enough to purchase a home are likely to have homes that are valued at less than homes owned by whites. In the Twin Cities, the median home value for African American homeowners is $210,500, compared to $260,200 among white homeowners. Additionally, due to the large racial disparities in unemployment and income described in this report, the cost of homeownership relative to household income is greater for African American homeowners, putting them at greater risk of falling behind on mortgage payments and other housing expenses. Forty-one percent
of black households and 21 percent of white households in the Twin Cities have homeowner costs of 30 percent or more of their annual household income. Renters face an even greater burden when it comes to housing costs. Rent payments account for at least 30 percent of annual household income for more than half of black renters (55 percent) and 43 percent of white renters. This represents a signifi cant fi nancial barrier for families who are currently renting, but seeking to save for a down payment on a home. But, even among those who are not prospective homebuyers, excessive housing costs are a hardship that threatens a family’s economic stability.

NAACP Economic Inclusion Plan | 15
BUSINESS OWNERSHIPAnother source of wealth and community development is business ownership. In addition to the fi nancial benefi ts that accrue to the business owner, local businesses bring jobs to the community and provide goods, services and much needed tax revenues. According to the Survey of Business Owners, just 4 percent of businesses in the state of Minnesota are black-owned. Relative to their share of the state population (6 percent), African Americans are slightly underrepresented as a percent of total business ownership in the state.
A similar disparity exists in the Twin Cities where African Americans represent almost 9 percent of the population, but just 6 percent of total business ownership. Compared to white-owned businesses in the area, the average black-owned business generates less revenue, is less likely to have employees and pays employees less per year. In the Twin Cities, black-owned businesses generate an average of less than $80,000 per year, and only 5 percent have employees. By comparison, while whites comprise 77 percent of the population, 87 percent of businesses in the Twin Cities are owned by white residents. The average white-owned business in the Twin Cities brings in almost $600,000 per year and 22 percent have employees.
Interestingly, although fewer black-owned businesses provide employment opportunities, those who do, employ more people on average than white-owned fi rms. The average black-owned fi rm with employees has 19 workers while the average white-owned fi rm has 12. However, due to lower revenue among black-owned businesses, the average employee of a black-owned Twin Cities business earns about 40 percent less ($22,929 per year) than the average employee of white-owned businesses in the area ($40,942). Many of these economic differences between black- and white-owned businesses may be related to differences in industry and occupation mix, which could also affect average annual hours worked and thus annual earnings of employees.
While racial differences in business ownership are partly explained by population demographics, differences in the size and health of the businesses – as measured by the number of job-generating fi rms, business revenues and average payroll – are related to well-established racial disparities in access to capital. As a result, such disparities limit the economic impact of black-owned businesses on the local economy.
Afric� Americans represent almost 9 percent � � populati� , but just 6 percent � total busine� o��ership.

16 | NAACP Economic Inclusion Plan
EDUCATIONThough education does not eliminate racial economic disparities, it is an important vehicle for economic mobility by providing better employment opportunities and higher income. Disparities in adult educational attainment among Minnesota and Twin Cities workers, as described in the Employment and Earnings section of this report, refl ect achievement gaps that begin to take shape even before kindergarten and widen as children progress through high schoolvii. Test scores from the National Assessment of Educational Progress (NAEP) are one way of measuring the achievement gap. NAEP scores can be used to assess differences in what students of different races and ethnicities know and can do in various subject areas and at three distinct points in time as they progress from elementary to high school. Scores on the math and reading assessments are available for Minnesota 4th and 8th
graders.
Based on 4th grade NAEP test scores, Minnesota
was tied with Massachusetts in having the highest
percentage of kids (53 percent) who scored at or
above profi cient in mathematics in 2017 and second in
the nation regarding the percentage of 8th graders who
scored at or above profi cient in mathviii. Fourth grade
reading achievement in Minnesota was on par with
the national average. Thirty-nine percent of Minnesota
4th graders scored at or above profi cient in reading,
ranking them at 18th in the nation. Minnesota’s 8th
graders scored slightly above the national average in
reading, ranking 12th in the nation, also with 39 percent
scoring at or above profi cient in reading in 2017.
NAEP Achievement Levels in 4th and 8th Grade Reading and Math in the United States and Minnesota by Race, 2015
United States
Math, grade 4 Reading, grade 4 Math, grade 8 Reading, grade 8
Black White Black White Black White Black White
Advanced 1% 10% 2% 11% 1% 10% 1% 4%
Profi cient 18% 41% 16% 35% 11% 32% 14% 38%
Basic 46% 39% 33% 33% 35% 39% 43% 42%
Below Basic 35% 10% 49% 21% 53% 19% 42% 16%
Minnesota
Advanced 4% 17% 2% 11% 2% 16% 5%
Profi cient 21% 46% 14% 36% 12% 40% 16% 41%
Basic 40% 31% 26% 32% 38% 33% 43% 41%
Below Basic 35% 6% 58% 21% 48% 11% 41% 13%
NAACP Economic Inclusion Plan | 17
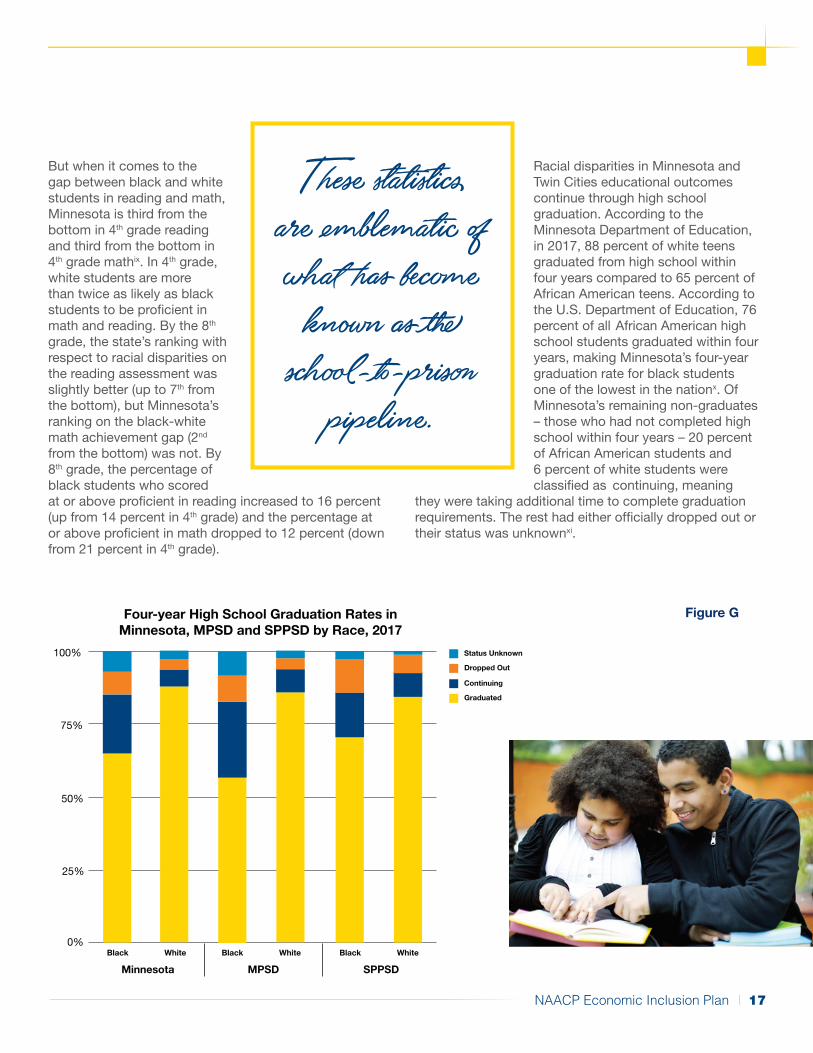
But when it comes to the gap between black and white students in reading and math, Minnesota is third from the bottom in 4th grade reading and third from the bottom in 4th grade mathix. In 4th grade, white students are more than twice as likely as black students to be profi cient in math and reading. By the 8th
grade, the state’s ranking with respect to racial disparities on the reading assessment was slightly better (up to 7th from the bottom), but Minnesota’s ranking on the black-white math achievement gap (2nd
from the bottom) was not. By 8th grade, the percentage of black students who scored at or above profi cient in reading increased to 16 percent (up from 14 percent in 4th grade) and the percentage at or above profi cient in math dropped to 12 percent (down from 21 percent in 4th grade).
Racial disparities in Minnesota and Twin Cities educational outcomes continue through high school graduation. According to the Minnesota Department of Education, in 2017, 88 percent of white teens graduated from high school within four years compared to 65 percent of African American teens. According to the U.S. Department of Education, 76 percent of all African American high school students graduated within four years, making Minnesota’s four-year graduation rate for black students one of the lowest in the nationx. Of Minnesota’s remaining non-graduates – those who had not completed high school within four years – 20 percent of African American students and 6 percent of white students were classifi ed as continuing, meaning
they were taking additional time to complete graduation requirements. The rest had either offi cially dropped out or their status was unknownxi.
These st atist ics are emblematic � what h� � c��e
kno�� � � sch� l-� -pris�
pipeline.
Four-year High School Graduation Rates inMinnesota, MPSD and SPPSD by Race, 2017
Status Unknown
Dropped Out
Black
100%
75%
50%
25%
0%White Black White Black White
Minnesota MPSD SPPSD
Continuing
Graduated
Figure G
18 | NAACP Economic Inclusion Plan
In the Twin Cities, the graduation rate for African
American teens varies across the two largest school
districts. In the Minneapolis Public School District
(MPSD), African American students graduate within
four years at a much lower rate (57 percent) than
African American students statewide, while the rate
in the St. Paul Public School District (SPPSD) (70
percent) is higher than the state average. However,
since more of MPSD’s non-graduates were classifi ed
as continuing students (26 percent versus 15 percent
in SPPSD), the MPSD dropout rate (9 percent) was
actually lower than that of SPPSD (12 percent). Four-
year graduation rates among white students were
similar for both districts – 86 percent in MPSD and 84
percent in SPPSDxii, xiii.
In addition to the racial differences in test scores and graduation rates described above, MPSD and SPPSD also have disproportionately higher rates of suspension among African American students relative to white students. During the 2016-17 school year in MPSD, African American students accounted for an astounding 76 percent of suspensions despite only being 36 percent of the student body populationxiv. By contrast, white students comprised 34 percent of the student body, but only 7 percent of the district’s suspensions. According to St. Paul Public School data for the 2016-17 school year, 12.7 percent of black students had been suspended at some point during their years of schooling compared to just 2.6 percent of white students.
These statistics are emblematic of what has become known as the school-to-prison pipeline. According to the NAACP Legal Defense Fund, this “funneling of students out of school and into the streets and the juvenile correction system perpetuates a cycle known as the ‘School-to-Prison-Pipeline’, depriving children and youth of meaningful opportunities for education, future employment, and participation in our democracy.xv” The racially disparate application of harsher school disciplinary practices and zero tolerance policies fuels this pipeline with a continuous stream of black and brown youth, making it an important civil rights issue.
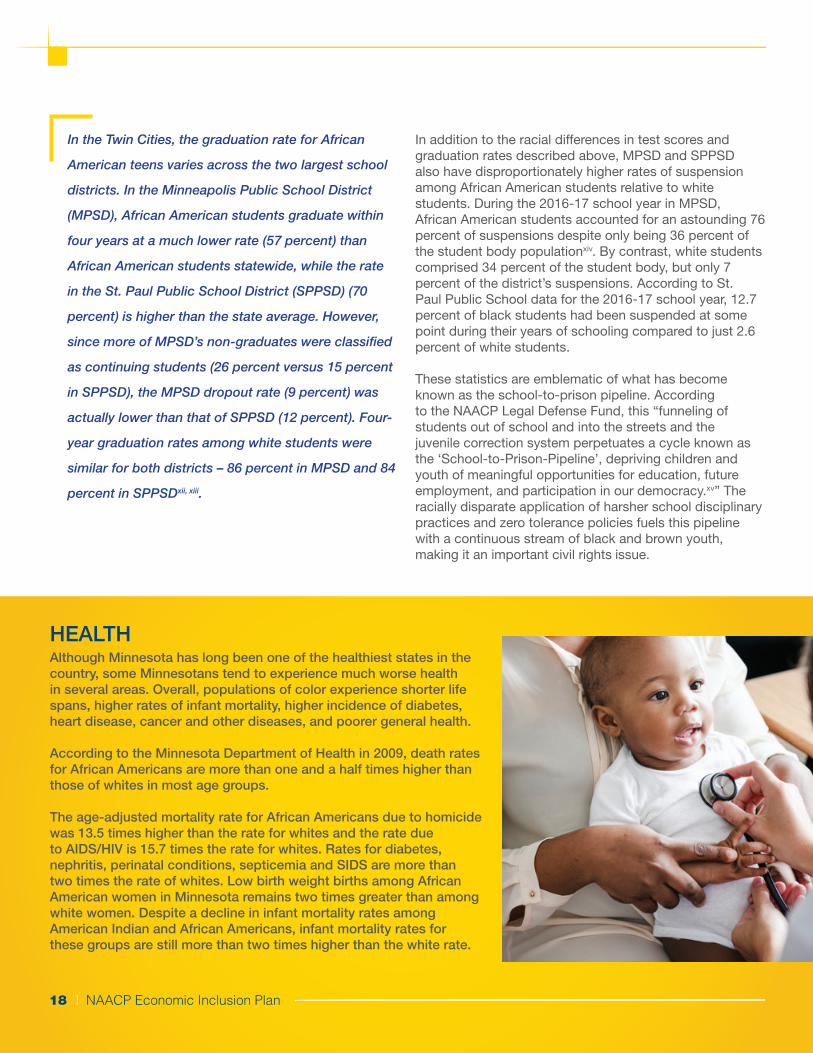
HEALTHAlthough Minnesota has long been one of the healthiest states in the country, some Minnesotans tend to experience much worse health in several areas. Overall, populations of color experience shorter life spans, higher rates of infant mortality, higher incidence of diabetes, heart disease, cancer and other diseases, and poorer general health.
According to the Minnesota Department of Health in 2009, death rates for African Americans are more than one and a half times higher than those of whites in most age groups.
The age-adjusted mortality rate for African Americans due to homicide was 13.5 times higher than the rate for whites and the rate due to AIDS/HIV is 15.7 times the rate for whites. Rates for diabetes, nephritis, perinatal conditions, septicemia and SIDS are more than two times the rate of whites. Low birth weight births among African American women in Minnesota remains two times greater than among white women. Despite a decline in infant mortality rates among American Indian and African Americans, infant mortality rates for these groups are still more than two times higher than the white rate.

NAACP Economic Inclusion Plan | 19
The issue of racism within the Twin Cities criminal justice system has been front and center in the national news in recent years. Despite video showing that the fatal 2016 shooting of Philando Castile by Offi cer Geronimo Yanez was unnecessary and unprovoked, Offi cer Yanez was acquitted of second degree manslaughter and two counts of dangerous discharge of a fi rearm just one year later. While this highly publicized case of racial injustice in the Twin Cities sparked national outrage and protests, it was not the only case of police using excessive and deadly force against members of the community from an array of racial and ethnic backgrounds. The police killings of Justine Ruszcyk Damond (a white woman), Gilbert Salas (a Latino man) and Thurman Blevins (an African American man) all made headlines in the years since.
However, injustices in Minnesota’s criminal justice system go much deeper than what has been shown in the news. The incarcerated are literally those who have been locked away from the public’s view, thus making them invisible with respect to the calculation of many of the key social and economic data points presented in this report. And here again, the racial disparities are stark. According to the Minnesota Department of Corrections, the incarceration rate for African Americans in Minnesota state
prisons is 10.5 times the rate for whites, despite the fact that African Americans are just 6 percent of Minnesota’s population compared to 80 percent for whitesxvi. African Americans are also arrested at a higher rate than any other racial or ethnic group in the state, accounting for 3,458 arrests per 10,000 residents in 2015 (8 times higher than the rate for whites)xvii.
In the Twin Cities, African Americans represent 9 percent of the overall population, but are incarcerated at 11 times the rate of whites who represent 76 percent of the populationxviii. These disproportionately high rates of incarceration among African Americans affect family and
community stability, limiting access to employment, housing, the right to vote, and other critical resources for returning citizens.
Racial disparities among juveniles involved in the criminal justice system also reveal overrepresentation of African American youth relative to their share of the population under age 18. According to the 2017 Annual Report of the Minnesota Juvenile Justice Advisory Committee, black youth in Minnesota represent 11.5 percent of the population under age 18 and 31 percent of youth detained in a juvenile correctional facility. By comparison, white youth are underrepresented, accounting for 79 percent of the youth population and 46 percent of juvenile detaineesxix.
Injust ices in Mi� esota’s criminal just ice syst em go much d� per � � what h� � en sho�� in
� e ne��.
CRIMINAL JUSTICE / JUVENILE JUSTICE SYSTEM

20 | NAACP Economic Inclusion Plan
TWIN CITIES COMMUNITY ENGAGEMENT
TWIN CITIES CONVENING:
An important part of the Economic Inclusion Plan
(EIP) is hearing from the community, capturing their
sentiments and adding their voices and input to the
report. For the Twin Cities, we convened two events
– a Leadership Roundtable and a Community Town
Hall. Both were held on December 10, 2018 at the
Minneapolis Urban League offi ce.
Leadership Roundtable Overview:The purpose of the Leadership Roundtable was to engage knowledgeable community leaders in a discussion that led to 3 to 5 broad, tangible, actionable policy proposals that could meaningfully improve the economic conditions of African Americans in the Twin Cities. Attendees included elected offi cials, grassroots leaders, leaders of community based organizations, National NAACP staff and Minnesota NAACP leaders.
Setting StageAfter a welcome and brief round of introductions, local NAACP leadership set the stage with a clear charge –we’ve researched and we’ve studied, now it is time to act. They highlighted the need, importance and role of an action driven policy agenda in addressing the glaring and well known economic disparities that exist for African Americans in the Twin Cities. These remarks were coupled with an overview of how the National NAACP is addressing similar issues through its policy agenda. National leaders also highlighted emerging policy trends – at the national level and state levels – that should be considered in the group’s discussion of a local policy agenda.
As a starting place, the group was given an opportunity to react to existing and emerging policy proposals that would have direct implications on the improvement of economic conditions for African Americans living in the Twin Cities. They were organized into three categories: 1) Economically Inclusive Family Policy; 2) Economically Inclusive Financial Policy; and 3) Economically Inclusive Criminal Justice Policy. Examples of each are listed in Table 1.
Economically InclusiveFamily Policy
Economic InclusiveFinancial Policy
Economically InclusiveCriminal Justice Policy
Increase and/or restructuringin TANF/SNAP Benefi ts
Increase in targeted grantprograms
Cap on the length ofProbation
Paid sick and family leave State and local NewHomeowner Tax Refund
Reduce uses of cash bail andbetter regulate bailcompanies
Increase public investment inaffordable housing
Enforce the Equal CreditOpportunity Act
Give the prison populationminimum wage or highereducation opportunities
Provide publicly subsidizedstudent loan forgiveness orrefi nancing
Table 1

NAACP Economic Inclusion Plan | 21
DISCUSSION HIGHLIGHTSThere were several themes to emerge throughout the discussion. They ranged from more specifi c areas of focus to a more general approach and principle to state funding. Below is a synopsis of key discussion points.
Specifi c Areas of Focus:Entrepreneurship: Entrepreneurship was identifi ed as a viable solution for addressing the racial wealth gap for African Americans (i.e. research shows that the wealth gap closes when there is an entrepreneur in the home). There was a suggestion to champion policies that support Black businesses. This included advocating for capital and business support to start, develop and grow Black businesses.
Workforce: Suggestions in this category included: (1) advocating for fair wages; (2) addressing issues of unemployment and underemployment; (3) championing policies and programs that focus on long term career options and (4) demonstrating the relationship between funding and jobs.
Criminal Justice: Emerging policy ideas in this category were diverse. To begin, there was a focus on prevention related policies. This included primary prevention activities (e.g. controlling the front door of incarceration) as well as secondary and tertiary prevention activities (e.g. post incarceration wrap around). There was a specifi c proposal to increase the Justice Reinvestment Fund–i.e. allocation of dollars to support services that reduce further involvement in the criminal justice system.
In addition, there was a focus on policies that impacted incarcerated individuals–e.g. segregation maximum. The need to pay attention to security guard training proposals were also highlighted.
Broad Areas of Focus:State and Federal Initiatives: There were a few state and federal initiatives that emerged in the discussion that leaders felt the African American community needed to be aware of, understand and leverage for greater positive economic impact for individuals, families and the broader community. Initiatives included:
Destination Medical Center (Mayo Clinic): A unique20 year economic development initiative in the State of Minnesota. The $5.6 billion dollar plan is the fi rst in the state’s history. It is a public-private partnership designed to develop the infrastructure and support needed to make Rochester, MN and Mayo a global destination for health and wellness.
New Market Tax Credits: A federal program that uses tax credits to incentivize business and real estate investment–by private investors–in low income communities.
Opportunity Zones: A new federal community development program designed to encourage economic development and job creation in distressed communities. There are tax benefi ts for investors.
Black Led Approach & Principles: Ideas in this category included: the state giving funding to the African American community to determine its priorities and to manage ourselves; indexing state equity spending; and using NAACP and the African American Leadership Forum (AALF) to disaggregate data.
OTHER POLICY IDEASDuring the session, the group also discussed: an increase in tax benefi ts; a bond proposal; and the need to consider the benefi ts of cannabis legislation both from a criminal justice and economic perspective.
WRAP UPLocal leaders thanked the roundtable participants for their attendance and participation. Ideas emerging from the discussion would be vetted and further defi ned in subsequent sessions and communication with leaders and community members. The group discussed future meetings and possibly setting a quarterly schedule.

22 | NAACP Economic Inclusion Plan
COMMUNITY TOWN HALLThe NAACP Twin Cities Economic Town Hall was a reminder that all the answers to our problems lies within our community. When we provide a platform, the people and their perspectives will come. The Black community is not a monolith and there are various strategies to restore our people to their traditional greatness.
The town hall revealed the importance of vocational training, entrepreneurship, political capital, and legal support. In addition, seemly progressive policies may really be the gateway for gentrifi cation and cause harm to small Black business owners. The most valuable reminder was that Black people need seats at the table, not just a single seat. The only way to move forward is together. Blacks need to commit to participating in all elections – big and small.
The Town Hall speakers were:
Leslie Redmond, Moderator, and Minneapolis NAACP President
Keith Ellison, Minnesota Attorney General Elect
Dr. Artika Tyner, Associate Vice President of Diversity and Inclusion at the University of St. Thomas
Me’Lea Connely, Founder of BLEXIT
Dr. Bruce Corrie, Director of the City of St. Paul’s Planning & Economic Development Department
Gary Cunningham, President and CEO of Metropolitan Economic Development Association (MEDA)
The Town Hall exceeded attendance expectations with standing room only in a large meeting room that could easily accommodate round table seating for 100. The attendees were both engaged and receptive throughout.
Leslie Redmond, President of the Minneapolis NAACP, summed up the Town Hall, “Rev. Martin Luther King Jr. was correct when he stressed the importance of poor people coming together to fi ght for human dignity. My hope is that our town hall sparked a conversation around how we can work together to ensure Minnesota’s resources, wealth, and opportunities are extended to all Minnesotans”.

NAACP Economic Inclusion Plan | 23
NAACP POLICY PRESCRIPTIONS
THE NAACP POLICY PRESCRIPTIONS:Voting is essential to securing the change needed to eliminate economic inequality and racial disparities. All elections matter; federal, state and local, and we must always hold our elected offi cials accountable. The policy prescriptions/recommendations listed below, would greatly change the living conditions, and reduce the disparities, for communities of color in the Twin Cities of Minnesota. These prescriptions refl ect our research, data gathering and the NAACP’s federal legislative priorities.
Economic Sustainability: A chance to live the American Dream for all. Every person will have equal opportunity to achieve economic success, sustainability, and fi nancial security.
Education: A free, high-quality, public education for all. Every child will receive a free, high quality, equitably-funded, public pre-K and K-12 education followed by diverse opportunities for accessible, affordable vocational or university education.
Health: Health equality for all Americans including a healthy life and high-quality health care. Everyone will have equal access to affordable, high-quality health care, and racially disparate health outcomes will end.
Public Safety and Criminal Justice: Equitable dispensation of justice for all. Disproportionate incarceration, racially motivated policing strategies, and racially biased, discriminatory, and mandatory minimum sentencing will end. Incarceration will be greatly reduced and communities will be safer. The death penalty will be abolished at the state and federal level, as well as in the military.
Voting Rights and Political Representation: Protect and enhance voting rights and fair representation. Every American will have free, open, equal, and protected access to the vote and fair representation at all levels of the political process. By protecting democracy, enhancing equity, and increasing democratic participation and civic engagement, African Americans will be proportionally elected to political offi ce.
EMPLOYMENT & ECONOMIC POLICY PRESCRIPTIONSSupport for a fair minimum wage:Since 2009, the federal minimum wage has held consistent at $7.25 an hour. Across America, 58 million workers earn less than $15 an hour. Today, a family of three living on the federal minimum wage of $7.25 would only make about $15,080 a year. This puts that family over $5,000 below the federal poverty level threshold. It’s time for Congress to Raise the Wage to $15 by 2024.
The Raise the Wage Act would: Raise the federal minimum wage from $7.25 to $15 over the next seven years; index future increases in the federal minimum wage to median wage growth; gradually phase out the outdated and unfair tipped minimum wage; gradually phase out the unused youth wage; and end subminimum wage certifi cates for individuals with disabilities.
Raising the minimum wage to $15 by 2024 would signifi cantly boost workers’ pay. The Raise the Wage Act is a win for working people. It would give more than 41 million low-wage workers an increase in wages: over 23 million women, more than 1 out of every 3 women workers, would get a raise; almost 7 million African American workers (40 percent of all African American workers) would get a raise; and 9.4 million Hispanic workers would get a raise (1 out of every 3). The average age of affected workers is 36. Prime-age workers, ages 25-54, make up half of those workers who would get a raise. Teenagers account for 10 percent of the workers that would be affected by the bill.
Enact comprehensive, aggressive job creation legislation that focuses on the needs of American communities as well:African Americans traditionally face unemployment rates nearly double the national unemployment rate: in some particular sub-groups, such as African American male teens, the rate is much higher. There is a clear need for an aggressive, national job creation program and address an issue that the NAACP has been calling a very real and crucial need for a long time.
The NAACP has consistently called for a comprehensive package which will expand opportunities for the long-term unemployed to reenter the workforce, provide incentives for businesses to hire and make investments in revitalizing schools, infrastructure and neighborhoods. We further

24 | NAACP Economic Inclusion Plan
support extending unemployment insurance to benefi t the long-term unemployed and their families and summer / year-round jobs for youth. Lastly, we have consistently called for tax cuts which will benefi t African American small businesses and will help African American owned small businesses access capital.
We have proposed investing $15 billion in a national effort to put construction workers on the job rehabilitating and refurbishing hundreds of thousands of vacant and foreclosed homes and businesses. We would also invest $25 billion in school infrastructure to modernize at least 35,000 public schools, with the funds targeted at the lowest income districts. We would also invest $35 billion to prevent layoffs of up to 280,000 public school teachers, while hiring tens of thousands more teachers and keeping fi rst responders, such as cops and fi refi ghters on the job.
Lastly, we have called for legislation which would target the long-term unemployed by proposing a tax credit of up to $4,000 to employers for hiring workers who have been looking for a job for more than 6 months. We have also called for a specifi c prohibition on employers from discriminating against unemployed workers.
The NAACP plans on keeping job creation and anti-employment discrimination a priority for American lawmakers until people and our economy are back at work. As such, we will continue to review and assess all job creation plans and strongly promote and advocate for those which will offer the greatest amount of help to those most in need.
Protect union / collective bargaining rights of public employees:The former governors of Wisconsin, Ohio and Indiana, as well as an additional two dozen other states have introduced budget proposals which attempt to limit, restrict, reduce or eviscerate the salaries, benefi ts and collective bargaining rights of state employees. Affected employees include teachers, nurses, police offi cers and fi refi ghters among others. The NAACP is steadfastly opposed to initiatives which would balance state budgets on the backs of hardworking employees and their families, and intends to fi ght them at the local, state and federal levels.
The NAACP urges state governments to focus on sustaining and creating living wage jobs and restoring the middle class. Our fi refi ghters, teachers and nurses as well as other public servants are critical, taxpaying members of our communities who provide vital services. Budgets should not be balanced by harming American families. We cannot cut our way out of the recession. Job creation, the development of living wage, sustainable employment, increases our tax revenues and consumer dollars which are the policies that will grow our economy and ultimately reduce our defi cit. We strongly urge the restoration of a balance and the growth of America’s middle class. We are further convinced that working Americans need to be able to use the strength of collective bargaining rights to fi ght for better wages and benefi ts, jobs security and safer work places for everyone.
Led by Wisconsin, Ohio and Indiana, as many as 2 dozen other states are said to be considering similar draconian cuts which may have a debilitating effect on the rights of public employees to form or join a union and bargain collectively for their salaries and benefi ts from this year on. If enacted, the impact of these cuts and new restrictions
THE NAACP URGES STATE GOVERNMENTS TO FOCUS ON SUSTAINING AND CREATING LIVING WAGE JOBS AND RESTORING THE MIDDLE CLASS.

NAACP Economic Inclusion Plan | 25
will have serious and adverse impacts on middle class Americans, as well as those aspiring to the middle class. This is especially true of the African American middle class, since 25% of all black college graduates are currently employed in the public sector.
On a larger scale, these fi scal attacks on the American middle class, American families and unions are but one of several areas in which some states are trying to turn back the clock on progress it has taken us so long to obtain. Eliminating the rights of state employees to collectively bargain is the beginning of a state strategy being implemented to curb our rights. The NAACP is also deeply concerned about state attempts to restrict voting rights through discriminatory photo identifi cation requirements and to re-segregate public education.
Develop a federal budget that invests in people and the protection of civil rights:The NAACP has historically supported budget proposals that invest in the American people, all the American people, by ensuring that the health, education, crime prevention, protection of civil rights needs and employment needs are met. Furthermore, we will continue to oppose changes to the budget which might result in a decrease in the “federal safety net,” programs that serve and assist the most vulnerable among us, including Social Security, Medicare and Medicaid and long term unemployment benefi ts.
Protect and Expand Social Security:Under the current system, Social Security will be unable to meet its fi nancial obligations to benefi ciaries by the year 2032. Therefore, over the last few years politicians and others have sought ways to “save” Social Security. While some proposals call for a reduction in benefi ts, others call for Social Security funds to be invested in the stock market, or “privatized.” Because African Americans and other ethnic minorities tend to be at the low end of the earning scale over their lifetimes, they are generally more dependent upon Social Security in their retirement years. For this reason, any changes in Social Security are of special importance to the NAACP. Specifi cally, the NAACP has pledged to oppose any proposal that would reduce monthly benefi ts or eliminate the guarantee of a minimum monthly benefi t; or that would raise the retirement age, as African Americans tend to have shorter life expectancies and would thus be disproportionately hurt by any such increase.
Eliminate high-cost loans, such as debt perpetuating “pay day” loans:Predatory lenders strip cash from the earnings of working people at astounding rates. Predatory loans, including high-cost lending such as payday loans, car title loans and refund anticipation loans cost American families nearly $5 billion in fees per year. They trap people in debt and make it impossible for individuals or families to save money, build nest eggs, or sometimes even to simply survive. Nearly 12 million Americans are caught in a cycle of fi ve or more high-cost payday loans per year.
“Payday loans” are perhaps the most common predatory loan. Payday lenders offer small, short-term loans while charging annual interest rates of up to 400%. One of the biggest problems with payday loans is that consumers who use payday lenders are often in desperate debt, and the high interest rate makes it so hard to pay back the loan that they quickly fi nd themselves on the perpetual debt treadmill. When they cannot pay back the original loan, they extend it, often paying the fees and interest several times over. The end result is that many consumers end up paying far more in fees than what they originally borrowed. This is so common that 99% of all payday loans go to repeat borrowers; the typical payday borrower pays almost $800 on a $325 loan.
The sad truth is that many payday lenders locate themselves in low-and moderate income neighborhoods as well as communities with large concentrations of racial or ethnic minorities and areas surrounding military bases. One study found that African American neighborhoods have three times as many payday lending stores per capita as white neighborhoods in North Carolina, even when the average income of the neighborhood is taken into account. Another study showed that in Texas, where 11% of the population is African American, 43% of the payday loans were taken out by blacks. In too many cases, payday lenders are the only fi nancial institutions in a community of color.
The NAACP supports legislation which would establish a new Fee and Interest Rate (FAIR) calculation that includes all interest and fees and creates a cap of 36% for all consumer credit transactions, including all open-end and closed-end consumer credit transactions, including mortgages, car loans, credit cards, overdraft loans, car title loans, refund anticipation loans, and payday loans. That rate is similar to usury caps already enacted in many states and is the same as the cap already in place for military personnel and their families, and we must also ensure that this federal law does not preempt stricter state laws.

26 | NAACP Economic Inclusion Plan
Paid Sick Leave:The Family Medical Leave Act (FMLA) was signed into law in 1993 by President Bill Clinton, and it allows workers to take up to three months of unpaid leave to care for themselves, a newborn child, an ill parent, or another family member facing a serious illness without the fear of losing their job or their health insurance. Since enactment 13 years ago, the FMLA has been used by American workers more than 200 million times. The FAMILY Act builds upon the success of the FMLA in that it provides American workers with up to three months of paid sick leave in the event of a serious illness, the birth or adoption of a new child, or if they need to care for a very sick family member.
The FAMILY Act is modeled after successful programs in several states, including California, New Jersey, Rhode Island and most recently New York. The FAMILY Act will allow employees to allocate part of their wages to take off up to 60 workdays, or 12 workweeks, in a year to address their own serious health issue or to care for a family member and will provide 66% of their highest annual earning over the last three years. Some of the covered health issues include pregnancy, childbirth, or adoption; caring for an ill family member; and for specifi c military caregiving and leave purposes. Under this legislation, both employees and employers would contribute a small amount every pay period to a self-sustaining fund. The eligibility rules of the FAMILY Act would allow younger, part-time, or low-wage workers to contribute and benefi t, regardless of their employer’s size or their length of time on the job.
Equal pay for equal work:The Equal Pay Act of 1963, mandates that employers pay equal wages to men and women who perform substantially the same work. While the Equal Pay Act has helped to narrow the wage gap between men and women in our workforce, signifi cant disparities remain and must be addressed. To eliminate these continuing disparities, the NAACP supports the Paycheck Fairness Act. The Paycheck Fairness Act closes loopholes in the Equal Pay Act of 1963 that have diluted its effectiveness in combating unfair and unequal pay.
Ban the use of credit checks by potential employers:The practice, used by a growing number of employers, to check a person’s credit score when considering him or her for a job, is both superfl uous and discriminatory. Due to misleading and miscalculated credit scores, African Americans and Hispanics have, on average, substantially lower than scores for white Americans. The practice is also counterproductive, because normally an individual’s credit score in no way indicates or predicts the type of employee he or she may be. Sadly, the use of credit checks to determine employment is not only misleading and discriminatory, but also a growing trend.
Despite the fact that several studies by well respected, unbiased groups have confi rmed that an individual’s credit history does not predict job performance, currently 60% of all employers admit to performing credit checks on potential employees. This number is up from just over 40% of all employers less than two years ago. This growing trend is extremely problematic for the NAACP, as there appears
ALLOW YOUNGER, PART-TIME, OR LOW-WAGE WORKERS TO CONTRIBUTE AND BENEFIT, REGARDLESS OF THEIR EMPLOYER’S SIZE OR THEIR LENGTH OF TIME ON THE JOB.

NAACP Economic Inclusion Plan | 27
to be a consensus that credit scores are discriminatory. According to one recent study, the average credit score of African Americans and Hispanics is roughly 5% to 35% lower than the score for white Americans. Furthermore, given the on-going and perilously high unemployment rate among Americans, and the fact that the unemployment rate is consistently almost double the national rate when you are talking about racial and ethnic minority Americans –and the impact unemployment can have on a person’s credit history – the NAACP is concerned that these disparities in credit ratings will only grow in the future. Thus reviewing a person’s credit background as part of a pre-employment check is akin to subjecting an individual to a classic “catch 22”, and this is disproportionately a predicament being faced by people of color.
Ban questions about criminal records on most employment questionnaires (“ban the box”):There are an estimated 70 million U.S. adults with arrests or convictions, many of whom are turned away from jobs despite their skills and qualifi cations. Given our nation’s unfair criminal justice system, a disproportionate number of these people are racial or ethnic minorities – and the disproportionality is growing. Removing questions about conviction history from job applications is a simple policy change that eases hiring barriers and creates a fair chance to compete for jobs. Known as “ban the box,” this change allows employers to judge applicants on their qualifi cations fi rst, without the stigma of a record. Fair-chance policies benefi t everyone, not just people with records, because they’re good for families, local communities, and the overall economy.
Nationwide, 33 states and over 150 cities and counties have adopted what is widely known as “ban the box” so that employers consider a job candidate’s qualifi cations fi rst—without the stigma of a conviction or arrest record. These initiatives provide applicants a fair chance at employment by removing the conviction history question from job applications and delaying background checks until later in the hiring process. Momentum for these policies has grown exponentially, particularly in recent years. At the national level, former President Obama endorsed ban-the-box by directing federal agencies to delay inquiries into job applicants’ records until later in the hiring process.
Expand the Earned Income Tax Credit and the Child Tax Credit:The Earned Income Tax Credit (EITC) is a proven policy success story, lifting millions out of poverty and rewarding work for millions of families. Its largest shortcoming, however, is the very small credit it provides workers who are not raising children in their homes. This is the only group of Americans that the tax code taxes into, or deeper into, poverty. We strongly support a major expansion of the EITC for childless workers, substantially raising the maximum credit and expanding its age range. We also support increasing its maximum credit and phase-in rate. The current Child Tax Credit (CTC) is only partially refundable—the refundable portion of the credit is limited to 15 percent of a family’s earnings above $2,500, up to a maximum of $1,400 per child. The NAACP supports: making the CTC fully refundable; a new Young Child Tax Credit (YCTC) in which families will receive an extra amount of CTC for each child under the age of six; and reducing the CTC phase-out threshold.
THE EARNED INCOME TAX CREDIT (EITC) IS A PROVEN POLICY SUCCESS STORY, LIFTING MILLIONS OUT OF POVERTY AND REWARDING WORK FOR MILLIONS OF FAMILIES.

28 | NAACP Economic Inclusion Plan
Support, preserve and protect equal opportunity programs:Despite the fact that equal opportunity programs, such as affi rmative action, have proven to be an effective tool that gives qualifi ed individuals equal access to participate and contribute; access that has been historically denied have come under attack again in recent years.
The fact of the matter is that our nation still needs equal opportunity programs in education, employment and contracting. Approximately 18% of all college students are African American, Latino, or American Indian compared with 28% of the college age population. African American men and women comprise less than 2.5% of total employment in the top jobs in the private sector. Based on their number, minority-owned fi rms received only 57 cents for every federal dollar they would be expected to receive if they were not a minority-owned fi rm. Equal opportunity programs are making sure that we have competent, educated leaders from and for all communities in the United States. Equal opportunity programs are the epitome of the great American ideal of self-reliance; they give people the opportunity to help themselves.
Eliminate potential discrimination in “faith based” initiatives:Because of our Nation’s sorry history of bigotry, for decades it has been illegal to discriminate in employment and make hiring decisions based on race or religion. The only exception is faith-based organizations, which are exempted from anti-discrimination provisions in programs using their own money; although until now they had to adhere to basic civil rights laws when using federal monies to support a program.
Under the existing rules, many faith-based organizations of all types get hundreds of millions of taxpayer dollars, are still able to pursue their religious missions, and comply with existing anti-discrimination laws. Yet under new proposals from the Trump Administration, faith-based organizations, some of whom, unfortunately, may use religious discrimination as a shield for racial or gender discrimination, will be allowed to legally discriminate against tax-paying Americans in the course of spending federal dollars.
The NAACP recognizes, celebrates and supports the crucial role faith-based organizations have played throughout our nation’s history in addressing some of our country’s most serious ills. Yet led by our Religious Affairs Department, the NAACP remains in fi rm opposition to any initiative, including the “faith-based” approach that may result in legalized and federally funded discrimination.
Sadly, some lawmakers appear intent on lacing provisions into individual bills that would allow faith-based institutions to discriminate against people because of their religion when implementing programs funded by federal taxpayers’ dollars while eliminating anti-discrimination safeguards.
EDUCATION POLICY PRESCRIPTIONSPublic school construction, repair and renovation:In 2014, a Department of Education study estimated that it would cost $197 billion to bring all public schools into good condition. The 2016 State of Our Schools Report determined there is an annual state and local spending gap of $46 billion on school facilities. A 2006 Building Education Success Together report found that high-poverty and minority-serving schools are unable to adequately invest in school facilities. Schools predominantly serving white students spend nearly 50% more on capital construction than those serving minority students, and wealthy districts spend nearly triple their high-poverty counterparts.
School facilities still pose signifi cant health and safety threats to more than 50 million students and 3 million teachers in public schools. A 1996 GAO Report—the most recent GAO study on this issue—determined that poor school facility conditions were concentrated in high-poverty schools serving minority students. The GAO found then that over 15,000 schools were circulating air unfi t to breathe. According to a 2014 CDC survey, only 46.5% of schools have a program in place today to address indoor air quality issues.
Too many schools lack access to suffi cient high-speed digital infrastructure needed to support 21st Century learning. A 2017 Education Super Highway report found that over 19,000 schools serving more than 11.6 million students “are without the minimum connectivity necessary for digital learning.”

NAACP Economic Inclusion Plan | 29
The Rebuild America’s Schools Act would invest $100 billion to create over 1.9 million jobs by addressing critical physical and digital infrastructure needs in schools. Upon enactment, this bill would:
• Create a $70 billion grant program and $30 billion tax credit bond program targeted at high-poverty schools with facilities that pose health and safety risks to students and staff;
• Leverage federal, state, and local resources for an overall investment of $107 billion, creating over 1.9 million jobs based on an Economic Policy Institute analysis that each $1 billion spent on construction creates 17,785 job;
• Develop a comprehensive national database on the condition of public school facilities; such a national database currently does not exist and would provide much-needed insight into the condition of our public schools; and
• Expand access to high-speed broadband to ensure that public schools have the reliable and high-speed Internet access they need for digital learning.
Oppose discriminatory “high-stakes” educational testing of public school students:Many states are relying on a single examination to determine important decisions (such as graduating from high school or promoting students to the next grade). While these “high-stakes” tests serve an important role in educational settings, they are not perfect and when used improperly can create real barriers to educational opportunity and progress. Furthermore, one-time,
standardized tests may have a disparate impact on students of color, many of whom have not had the benefi t of high quality teaching staff, adequate classroom resources, or instruction on the content and skills being tested by the standardized tests. The NAACP supports legislation to require that “high stakes” decisions be based upon multiple measures of student performance and, when standardized tests are used by schools and school districts, that the tests be valid and reliable, measure what the student was taught and provide appropriate accommodations for disabled children. The NAACP also supports legislation to require that individual students are not unfairly denied critical educational opportunities because of their performance on a single, standardized test.
Oppose publically funded private school vouchers:The NAACP has consistently supported investments in our public schools that will benefi t all students, not just potentially a few. School vouchers do not offer a collective benefi t. Vouchers take critical resources away from our neighborhood public schools, the very schools that are attended by the vast majority of African American students. Furthermore, private and parochial schools are not required to observe federal nondiscrimination laws even if they receive federal funds through voucher programs. In fact, many voucher proposals often contain language specifi cally intended to circumvent civil rights laws, and many proponents insist voucher funding does not fl ow to the school but instead to the parent or student precisely to avoid any civil rights obligations. This specifi city in language allows private institutions to discriminate on the basis of religion, gender, disability and language profi ciency – and even merit, again, despite the fact that they are receiving taxpayer funds.
MANY STATES ARE RELYING ON A SINGLE EXAMINATION TO DETERMINE IMPORTANT DECISIONS

30 | NAACP Economic Inclusion Plan
Maintain the federal role in ensuring a decent public education available to all as well as the protection of civil rights: The federal government has, for the past 50 years, played an important and historic role in public education, most notably through the Elementary and Secondary Education Act (ESEA). During the 50 years since the ESEA was originally passed the federal government has promoted educational opportunity and protected the rights and interests of students disadvantaged by discrimination, poverty, and other conditions that may limit their educational attainment. This role must be maintained in any bill to reauthorize the ESEA, along with ensuring that each state adopts college and career-ready state standards, aligned statewide annual assessments, and a state accountability system to improve instruction and learning for students in low-performing schools.
Furthermore, the mission and duty of the Department of Education’s Offi ce of Civil Right is to “ensure equal access to education and to promote educational excellence through vigorous enforcement of civil rights in our nation’s schools.” This enforcement has helped to ensure that all students have access to an education free from discrimination, harassment, and violence. These functions must not only be protected but allowed to operate to their fullest capacity to guarantee all students equal protection under the law.
Repeal law disallowing students convicted of minor drug offenses from receiving fi nancial aid:Under a current federal law that took effect in 1998, if you need some fi nancial help in order to go to college, one drug conviction can make you temporarily ineligible, and multiple convictions may lead to a permanent bar on receiving aid. While the goal of this law, to ensure that drug dealers do not set up shop on our nations college campuses with federal backing, was laudable,the result is in fact racially and economically discriminatory and adversely impacts tens ofthousands of lower-income young adults.
In fact, as a result of this law, more than 93 thousand young men and women, a disproportionate number of whom are racial and ethnic minorities and the vast majority of whom come from families with total annual incomes of less than $30,000, though they’ve paid their debt to society, are being unfairly and unnecessarily denied access to a higher education, the only sure way to end the cycle of drug addiction, crime, violence poverty and incarceration.
Instead of affecting major drug dealers, the group this law was intended to affect, this provision has in-fact primarily impacted students convicted of minor possession and nonviolent related offenses.
Increase funding for Federal Pell Grants and expand eligibility:A Pell Grant is money the federal government provides for moderate- and low-income students who need it to pay for college. Grants, unlike loans, do not have to be repaid. Students eligible for Pell grants receive a specifi ed amount each year under this program. Pell Grants are critically important in ensuring access to postsecondary education for low- and middle-income students. The program is the foundation of the federal government’s historic commitment to higher education access. Each year, more than 7.5 million students rely on Pell grants to afford college. The vast majority of Pell recipients have family incomes under $40,000. Pell grants make higher education accessible to groups which have historically been shut out of colleges and universities, including racial and ethnic minority American students: more than 60% of African-American undergraduates and more than half of Hispanic undergraduates rely on Pell Grants to attend school.
Sadly, the money available for Pell grants has been eroded for decades. Add to this the skyrocketing cost of college, and the result is that Pell grants do not go as far as they used to; in fact, the current maximum grant covers the lowest share of public college costs in over 40 years. The cost of obtaining a college degree has increased 1,120 percent over the past three decades, about fi ve times the rate of infl ation. The maximum grant in the fi rst year of the program was $452, which covered almost all of a student’s tuition, since the average tuition at public universities in 1973 was $490. By 2011 however, the average in-state tuition was $8,244, while the maximum Pell grant was $5,550. Due largely to cuts in state education budgets, college tuition has grown by 50% from 2004 to 2014. As recently as in the 1980s, the maximum Pell grant covered more than half the cost of attending a four-year public college. In the 2014-2015 school year, however, the maximum Pell Grant ($5,730) is expected to cover less than one-third of the cost of a public 4-year college—the lowest purchasing power level since the start of the program. What’s more, Pell Grants are slated to lose its annual infl ation adjustment after this year, and Congress continues to cut the money that is available for Pell grants.
The Pell Grant Preservation and Expansion Act would improve the purchasing power of Pell Grants (by providing

NAACP Economic Inclusion Plan | 31
an immediate $500 increase to the maximum award and grow the value of the Pell Grant over time by permanently indexing it to infl ation); shifts the Pell Grant program to fully mandatory funding; reduces the “work penalty” that many students face when working to support themselves and offset rising college costs; streamlines the fi nancial aid process for the poorest students and ensures they can easily access a full Pell Grant; and extends eligibility for a Pell grant from the current 12 semesters to 14. The legislation also expands eligibility by extending Pell Grant eligibility to undocumented students who were brought to this country as children (“DREAMers”), and restoring eligibility for defrauded students, incarcerated individuals, and students with non-violent drug convictions.
Making college affordable:Higher education is one of the surest paths to economic security and opportunity for Americans. College-degree holders earn over 65 percent more than workers with only high school degrees, and the unemployment rate for workers with a college degree is less than half that of high school graduates.
The cost of college, however, is astronomically high and has increased 300 percent in infl ation-adjusted dollars over the past 30 years. Beyond tuition and fees, the total cost of attendance— room and board, books and supplies, and other expenses—puts higher education out of reach for many Americans. For others, soaring college costs force them to take on debt to cover their fi nancial need. Currently, 44 million Americans have student loans. College debt has increased 170 percent since 2006 and now exceeds $1.5 trillion dollars, which is second only to mortgage debt and surpasses even credit card debt.Rising student debt is taking a toll on the economy. According to the Federal Reserve Bank of New York, student loan debt is responsible for 35 percent of the
decline in homeownership since 2007. The percentage of younger people who reported owning a business was cut in half between 2010 and 2013. And Pew Research Center found that about 50 percent of student borrowers say their loans increase their risk of defaulting on other bills. Without a solution, the economic impact of this crisis will continue to drag down new business starts, homeownership rates, and household wealth creation.
Congress must address the student debt crisis by creating a path for students to graduate without the burden of student debt. Through the Debt-Free College Act, the federal government would work in partnership with states to make debt-free college a reality for students within fi ve years.
State disinvestment in public higher education has driven up tuition prices, which has undermined public colleges’ role as an affordable option for students. State appropriations are now nearly 12% percent lower than before the recession in 2008. Public colleges have made up for those cuts by cutting costs and increasing tuition. As a result, public colleges now rely on tuition for 46 percent of their revenue, up from 36 percent in 2008, and that revenue increasingly comes from student loans.
The NAACP supports a state-federal partnership that brings states back to the table and leverages the nation’s unparalleled public higher education system to make debt-free college a reality. Under the partnership, states would receive a one-to-one federal match to state higher education appropriations in exchange for a commitment to help students pay for the full cost of attendance without having to take on debt. The partnership provides incentives to states to increase higher education appropriations and drive down the rising costs leading to student debt.
HIGHER EDUCATION IS ONE OF THE SUREST PATHS TO ECONOMIC SECURITY AND OPPORTUNITY FOR AMERICANS.

32 | NAACP Economic Inclusion Plan
HEALTH POLICY PRESCRIPTIONSRetain affordable health care coverage for all Americans:The 2010 passage of the Affordable Care Act (ACA) radically transformed our nation’s health by adding over 20 million more Americans to the rolls of the insured. The uninsured rate for African Americans dropped by almost half, from 27% in 2010 to 14.5% in 2015. Amazingly, and for the fi rst time in our nation’s history, a black child was no longer more likely to be uninsured than a white child.
Sadly, there are those who appear determined to turn back the clock and reverse this progress. On May 4, 2017, the U.S. House of Representatives passed the American Health Care Act, which will eliminate health care coverage for an estimated 23 million Americans. The Senate bill, the Better Care Reconciliation Act (BCRA), will eliminate health care coverage for an estimated 22 million Americans. It repeals the ACA, and millions more – especially low- and moderate-income and older Americans—end up paying thousands more in premiums for skimpier health plans. BRCA is nothing more than a huge tax cut for the wealthiest few, paid for by billions of dollars in cuts to Medicaid, which currently provides critical health care to 74 million Americans—or one-in-fi ve of all people in this country.
End childhood obesity:Childhood obesity occurs among African American children at disproportionate rates: African American children and adolescents are more likely to be overweight and obese than their white peers. Currently, over 35% of African American children ages 2 to 19 are overweight or obese, compared with less than 32% of the general population in the same age range. Furthermore, although
the percentage has decreased, the current obesity rate, as defi ned as being in the 95th percentile for BMI (Body Mass Index) among African American youths is still higher by almost 4% than the national average of 16.9%. The consequences of this disparity are as glaring and as dangerous as you might expect. Overweight and obese children are more likely to suffer from serious, lifelong illnesses than their healthy-weight peers. The higher prevalence of overweight and obesity among African American children places them at a greater risk of developing chronic diseases including Type 2 diabetes, high blood pressure and other cardiovascular disease risk factors, asthma, sleep apnea, and social discrimination.
To address these problems the NAACP has supported legislation which has been introduced and promoted which increases access to healthy food in many of the neighborhoods where fresh produce is rarely seen, and among many of the federal programs which serve primarily low income and disproportionately racial and ethnic minority children (such as school lunch programs); it improves prevention and treatment measures; and it promotes physical activity.
Protect Medicare & Medicaid:Created in 1965, Medicaid currently serves more than 50 million Americans. It was originally intended to provide health care to low-income Americans who would not otherwise be able to afford it. Medicaid is jointly funded by the states and the federal government, and is managed by the states.
Dramatic cuts to Medicaid would be disproportionately severe among racial and ethnic minority Americans since we currently comprise 56% of the Medicaid population. Specifi cally, in 2009, 27% of African Americans—10
FOR THE FIRST TIME IN OUR NATION’S HISTORY, A BLACK CHILD WAS NO LONGER MORE LIKELY TO BE UNINSURED THAN A WHITE CHILD.

NAACP Economic Inclusion Plan | 33
million people, including 6 million children—were covered by Medicaid. African Americans account for 1 in 5 Medicaid enrollees. In 2009, 27% of Hispanic Americans—13 million people, including 9 million children—were covered by Medicaid; Hispanics account for 1 in 4 Medicaid enrollees.
To compensate for the steep reductions in federal funding, states would be forced to make up the difference by contributing more or, if they cannot or will not provide additional funding they will likely cap enrollment, substantially scale back eligibility, and / or curtail benefi ts. Since most states in our country are suffering from budget shortfalls now, it is unlikely they will be able to compensate for any reduction in the federal contribution. Those most at risk of not receiving adequate health care under this proposal are seniors (communities of color currently make up roughly 43% of the elderly Medicaid population); people with disabilities (communities of color currently make up roughly 43% of the Medicaid population with disabilities); children (59% of children currently enrolled in Medicaid represent communities of color); working parents and pregnant women (communities of color represent 61% of the adult (parents and pregnant women) Medicaid population).
Health Equity:Despite efforts through the Affordable Care Act to eliminate health disparities, the color of your skin and your zip code can still play a signifi cant role in your health outcome. Communities of color face signifi cant barriers to culturally and linguistically appropriate care. Around the U.S. and in U.S. territories, marginalized and underserved communities suffer from discrimination, inequity, and a lack of access to quality, culturally-competent care.
The NAACP supports legislation which builds on past successes, including: expanding and updating the list of high-impact minority diseases; recognizing the role of health care disparities in any delivery system; and prevention.
HOUSING POLICY PRESCRIPTIONSEnact a comprehensive program to combat homelessness:About 3.5 million people in America are likely to experience homelessness in a given year. Of these, 39%, or 1.35 million are children. People of color – particularly African Americans – are a disproportionately large percentage of the homeless population. A 2002 study showed that the urban homeless population is estimated to be 50% African American, 35% white, 12% Hispanic American, 2% Native American and 1% Asian American. Approximately 40% of men who are homeless are American veterans. The composition of the average homeless family is a single parent household headed by an African-American female. Unfortunately, these numbers appear to be on the increase.
To try to address this problem the NAACP supports the comprehensive legislation which includes resolutions putting Congress on record as supporting housing as a basic human right, Universal Health Care and a Living Wage; a dramatic expansion of federal resources for affordable housing and homelessness programs; a dramatic expansion of health care and services for people experiencing homelessness; greater income and work supports for people experiencing homelessness; temporary worker protections; and civil rights protections for people experiencing homelessness.
THE COMPOSITION OF THE AVERAGE HOMELESS FAMILY IS A SINGLE PARENT HOUSEHOLD HEADED BY AN AFRICAN-AMERICAN FEMALE.

34 | NAACP Economic Inclusion Plan
Provide additional funds for testers to uncover housing discrimination in America:Currently, despite the enactment of the Fair Housing Law more than 40 years ago, experts estimate that as many as 4 million fair housing violations occur each year. Yet less than 8% of these violations are actually reported to federal, state or local housing authorities and only a handful of those are investigated and result in charges. The result is, sadly, that housing discrimination is alive and well and allowed to fl ourish in America today.
The NAACP therefore supports increases in funding for both the Fair Housing Initiatives Program (“FHIP”) and the Fair Housing Assistance Program (“FHAP”), through which the federal government provides assistance to states and local governments to investigate and enforce Fair Housing complaints within their jurisdictions.
Promote universal, decent & affordable housing:For close to half of American families, owning an affordable home or even fi ning a safe and affordable rental unit is fi nancially unattainable. In fact, the problem is getting worse. The number of American families with “worst case” housing needs continues to grow, while the inventory of affordable housing shrinks. Furthermore, statistics show that race and age play a signifi cant role in the ability of a family to own a home. While 71% of Caucasian households own their own home, only 47% of African American and 46% of Hispanic American families own their residences.
Renting a home has also become harder in the last decade. Between 1996 and 1998, rents rose by 1.6% while the median income of renter households grew by only .3%. From 1995 to 1997, the income of the poorest 25% of renter households fell by 2.6%, while rental costs increased by 4.5%. At the same time, well over 100,000 units of housing for very low-income families was demolished without replacement. Lack of safe affordable housing has an enormous impact on American families and our communities. Families with high housing costs are forced to choose between paying for housing and putting food on the table. Children who live in substandard housing are more likely to suffer from debilitating conditions such as asthma and lead poisoning.
In 2008, the NAACP-supported National Housing Trust Fund (NHTF) was created at the federal level. The NHTF will provide funds to states and local municipalities across
the nation for the production, construction, preservation and rehabilitation of badly needed homes that are affordable and secure for the lowest-income Americans. In his budget request for fi scal year 2010, President Obama requested that Congress fund the NHTF at $1 billion as an initial capitalization.
Under the legislation that created the NHTF, 90% of the funds must be used for rental housing that extremely low income families can afford. Data from a 2008 survey shows that nationwide, for every 100 extremely low income renter households, there were only 37 homes available which they could afford, for less than 30% of their income.
The NHTF would also create American jobs: it is estimated that a $1 billion investment in the NHTF will create 15,100 construction jobs and 3,800 jobs in on-going operations. Furthermore, when low-income Americans are not spending over 30% of their income on housing, they can afford to spend more on food, child care, transportation, and other basic human needs.
CRIMINAL JUSTICE POLICY PRESCRIPTIONSLaw enforcement trust and integrity:Police misconduct, the lack of law enforcement accountability to the communities they serve, and the fact that there are no national, uniform, use-of-force standards for law enforcement offi cers or agencies, are problems that affect every sector of our country and imperils the continued security of our nation. The fact that actions which may not be accepted or practiced in one community are regularly used in another can lead to a mistrust of law enforcement by the people they are hired to protect and serve.
Furthermore, there is a strong perception among Americans of all races that people of color are treated much more aggressively and with much more force than their white counterparts by law enforcement agents at all levels. We are subject to stories of police misconduct on an almost daily basis: acts of blatant, unwarranted brutality, and the increase in national media attention which they are receiving, have lead to a mistrust by members of every community. Something must be done to raise the level of accountability, or the situation will only continue to deteriorate.
The Law Enforcement Trust and Integrity Act provides incentives for local police organizations to adopt performance-based standards to ensure that incidents

NAACP Economic Inclusion Plan | 35
of misconduct will be minimized through appropriate management, training and oversight protocols and that if such incidents do occur, that they will be properly investigated. By doing this, not only would we be building trust between law enforcement and the communities they serve, we would also be providing police offi cers with the tools necessary to work with their communities and to enhance their professional growth and education.
Eliminate racial and religious profi ling:The End Racial and Religious Profi ling Act comprehensively addresses the insidious practice of biased treatment by law enforcement because of who you are, which God you believe in, or who you are perceived to be, by law enforcement. Specifi cally, the End Racial and Religious Profi ling Act addresses bias policing on fi ve levels: fi rst, it clearly defi nes the discriminatory practice of profi ling by law enforcement at all levels; second, it creates a federal prohibition against profi ling; thirdly, it mandates data collection so we can fully assess the true extent of the problem; fourth, it provides funding for the retraining of law enforcement offi cials on how to discontinue and prevent the use of profi ling; and fi fth, it holds law enforcement agencies that continue to use profi ling accountable.
Numerous studies over the past few years have provided us with evidence to support what we have known for decades: law enforcement agents at all levels have consistently used race, ethnicity, religion, and national origin when choosing which individuals should be stopped and searched. At the most basic level, it is diffi cult for our faith in the American judicial system not to be challenged when we cannot even drive down an interstate without being stopped merely because of the color of our skin.
We need this legislation to stop this insidious practice and to help begin to restore the confi dence of communities of color throughout the United States in federal, state and local law enforcement.
Eliminate racially disparate prosecution:While people may argue about the reasons behind it, few would disagree that extensive racial and ethnic disparities exist today in the American criminal justice system. These disparities are particularly true for African American men and boys, who are grossly overrepresented at every stage of the judicial process, from initial contacts with police to punishments. African Americans routinely receive more jail time and harsher punishments; 42% of Americans currently on death row are African American. Nearly a million African Americans today are incarcerated in prisons and in jails, and unless there is a change, a black male born today has a one-in-three chance of going to prison in his lifetime. In fact, despite the fact that numerous studies show that African Americans and whites use cocaine at roughly the same rate, statistics confi rm that over 80% of those currently in prison for crack cocaine possession are African American.
To address these disparities, the bipartisan Justice Integrity Act aims to address the issue of unwarranted racial disparities in the American criminal justice system was introduced. This important legislation would establish 10 pilot programs to create local advisory groups charged with collecting and analyzing racial and ethnic data on charging, plea negotiations, sentencing recommendations and other factors involved in creating these disparities.
FEW WOULD DISAGREE THAT EXTENSIVE RACIAL AND ETHNIC DISPARITIES EXIST TODAY IN THE AMERICAN CRIMINAL JUSTICE SYSTEM.
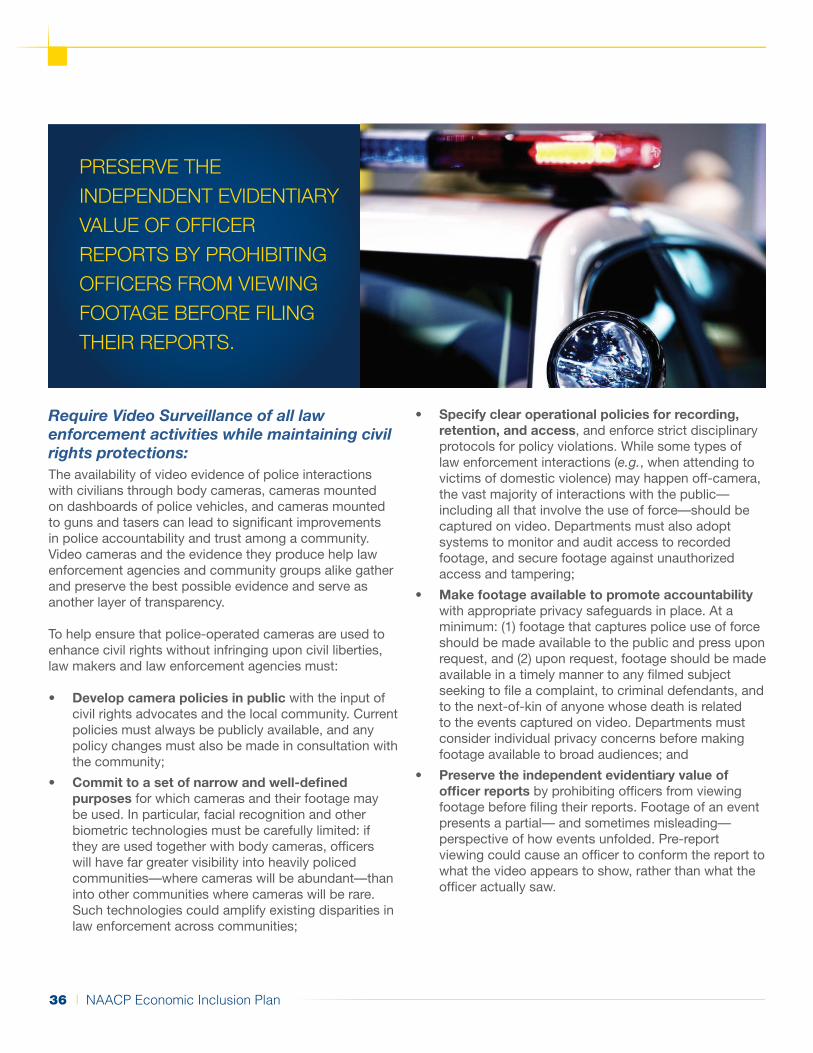
36 | NAACP Economic Inclusion Plan
Require Video Surveillance of all law enforcement activities while maintaining civil rights protections:The availability of video evidence of police interactions with civilians through body cameras, cameras mounted on dashboards of police vehicles, and cameras mounted to guns and tasers can lead to signifi cant improvements in police accountability and trust among a community. Video cameras and the evidence they produce help law enforcement agencies and community groups alike gather and preserve the best possible evidence and serve as another layer of transparency.
To help ensure that police-operated cameras are used to enhance civil rights without infringing upon civil liberties, law makers and law enforcement agencies must:
• Develop camera policies in public with the input of civil rights advocates and the local community. Current policies must always be publicly available, and any policy changes must also be made in consultation with the community;
• Commit to a set of narrow and well-defi ned purposes for which cameras and their footage may be used. In particular, facial recognition and other biometric technologies must be carefully limited: if they are used together with body cameras, offi cers will have far greater visibility into heavily policed communities—where cameras will be abundant—than into other communities where cameras will be rare. Such technologies could amplify existing disparities in law enforcement across communities;
• Specify clear operational policies for recording, retention, and access, and enforce strict disciplinary protocols for policy violations. While some types of law enforcement interactions (e.g., when attending to victims of domestic violence) may happen off-camera, the vast majority of interactions with the public—including all that involve the use of force—should be captured on video. Departments must also adopt systems to monitor and audit access to recorded footage, and secure footage against unauthorized access and tampering;
• Make footage available to promote accountability with appropriate privacy safeguards in place. At a minimum: (1) footage that captures police use of force should be made available to the public and press upon request, and (2) upon request, footage should be made available in a timely manner to any fi lmed subject seeking to fi le a complaint, to criminal defendants, and to the next-of-kin of anyone whose death is related to the events captured on video. Departments must consider individual privacy concerns before making footage available to broad audiences; and
• Preserve the independent evidentiary value of offi cer reports by prohibiting offi cers from viewing footage before fi ling their reports. Footage of an event presents a partial— and sometimes misleading—perspective of how events unfolded. Pre-report viewing could cause an offi cer to conform the report to what the video appears to show, rather than what the offi cer actually saw.
PRESERVE THE INDEPENDENT EVIDENTIARY VALUE OF OFFICER REPORTS BY PROHIBITING OFFICERS FROM VIEWING FOOTAGE BEFORE FILING THEIR REPORTS.

NAACP Economic Inclusion Plan | 37
Establish effective and independent civilian review boards to examine police activity:We must restore and give power to local communities over the agencies which are meant to “protect and serve.” The NAACP therefore strongly supports the establishment of civilian accountability review boards for every local, state, and even federal law enforcement agency.
• While the exact composition of these Boards should be determined by the needs and the make-up of the community being served, in order to be effective they must all have the following characteristics:
• The review board must be independent in that it will have the power to conduct hearings, subpoena witnesses and report fi ndings and recommendations to the public and it shall be housed away from police headquarters to maintain credibility;
• It needs to be relevant in that it will have the power to independently investigate incidents and issue fi ndings on complaints; it will be able to spot problem policies and provide a forum for developing reforms; an effective review board must have complete access to police witnesses and documents through legal mandate and subpoena power; the Board will publish, on a periodic basis, statistical reports which detail trends in allegations, to help identify offi cers or practices which are subjects of unusually numerous complaints; and Board fi ndings will be considered in determining appropriate disciplinary action. The Civilian Board will also have the capacity to compel prosecutors’ offi ces to bring charges against police offi cers to a panel or Grand Jury to try the case;
• Finally, an effective Civilian Review Board will be refl ective of the racial and ethnic make-up of the community in that the Board and staff will be broadly representative of the community it serves.
The Review Board must consistently be adequately funded to fulfi ll the obligations laid out above; it should not be a lower budget priority than police internal affairs systems.
Comprehensive sentencing reform:While the enacted First Step Act was a good beginning, Congress must do much more to fi x our broken criminal justice system and reduce the number of people who are unnecessarily sent to prison. We must curtail over-criminalization by eliminating federal criminal penalties for simple drug possession in state jurisdictions; requiring public disclosure of regulatory criminal offenses; allowing
victims of regulatory over-criminalization to contact the inspector general; restoring discretion to judges to determine to what extent manipulated conduct that results from fi ctitious law enforcement “stings” may be considered in court; protecting against wrongful convictions; and creating procedures to simplify charging and safely reduce pre-trial detention.
Furthermore, we must eliminate mandatory minimum sentences and return sentencing discretion to judges. We need to increase the use of evidence-based sentencing alternatives by expanding eligibility for pre-judgment probation; promoting greater use of probation for lower-level offenders; and encouraging judicial districts to open drug, veteran, mental health and other problem solving courts. Finally, we should be taking affi rmative steps to concentrate prison space on violent and career criminals; increases government transparency and accountability; reduces recidivism by using swift and certain responses so offenders know what will happen if they re-offend or act in a certain way, and by creating a system of rewards and incentives for good behavior; sentences strategically for drug offenders and focuses on high risk offenders; and acknowledges that age matters by implementing smart, targeted geriatric release programs which can ensure heinous offenders remain behind bars while cutting down on costs and maintaining public safety.
Establish a commission to review our nation’s criminal justice system:While people may argue about the reasons behind it, few would disagree that extensive racial and ethnic disparities exist today in the American criminal justice system. These disparities are particularly true for African American men and boys, who are grossly overrepresented at every stage of the judicial process. Initial contacts with police offi cers are often driven by racial profi ling and other racially tainted practices, and the disparities exist through the sentencing phase: African Americans routinely receive more jail time and harsher punishments. Although African Americans make up just over 12% of the national population, 42% of Americans currently on death row are African American. Nearly a million African Americans today are incarcerated in prisons and in jails, and unless there is a change, a black male born today has a one-in-three chance of going to prison in his lifetime.
This is not just a problem among African Americans or racial and ethnic minorities. Our nation has 5 percent of the world’s population. We have 25 percent of the world’s known prison population. We have an incarceration rate

38 | NAACP Economic Inclusion Plan
in the United States that is fi ve times the incarceration rate in the rest of the world. The bottom line is that under our current criminal justice system too many people are being incarcerated and otherwise caught up in the criminal justice system and we still have too many Americans who do not feel safe in their homes or their communities. Furthermore, because of the disparities that result from our current system, entire communities within our country do not have confi dence in the criminal justice system.
The NAACP supports legislation which would, for the fi rst time in almost 50 years, create a national commission to examine and review the myriad of problems that exist in our current criminal justice system. In doing so, the Commission would also be charged with looking at how we have arrived at this convoluted mess, how many of our problems are interrelated and often feed off of one another, and how we can correct a system that is badly in need of a new course.
Enactment of safe, sane and sensible laws to curb gun violence:From mass shootings, recently in El Paso, Texas and Dayton, Ohio, to street killings throughout our country, dangerously easy access to guns in the U.S. are a major and deadly problem, and one that disproportionally impacts communities of color. As of August 6, 2019, there had been 251 mass shootings in the US this year; that’s more than 1 per day.
Gun violence kills an average of 35,000 people each year in the U.S., with experts predicting that it will continue to increase if nothing is done. Furthermore, gun violence disproportionately impacts communities of color in the United States. Gun violence is the number one killer of African Americans aged 15 to 34. Despite the fact that African Americans make up only 13% of the U.S. population, we represent nearly 50% of all gun homicide victims. 49% of deaths of African-American males between ages 15 and 19 are gun-related homicides — more than the next nine leading causes of death combined. Their white counterparts report gun-related homicides less than 8% of deaths. In 2016, the number of African Americans who died from fi rearms was almost twice the number of White Americans. In 2017, guns became the third leading cause of death for all children and teens in the U.S. Being African American increases a child’s likelihood of dying from gun violence tenfold. Moreover, the “survivors” of gun violence often suffer from untold damages, both physical and mental.
Given the disproportionate damage gun violence is having on our communities, the NAACP has advocated for a number of sane, sensible laws which will help eliminate or at least decrease the damage and death caused by gun violence. We strongly support several sensible proposals which together will do a lot to help keep dangerous fi rearms off our streets and out of the hands of those who should not have access to them. These measures include:
• Requiring universal background checks on all gun sales and transfers;
• Ban military-style semi-automatic assault guns and military high capacity ammunition clips;
• Enact tough new criminal penalties for straw purchasers and gun traffi ckers;
• Ban suspects on the terror watch list from purchasing fi rearms;
• Allow the Center for Disease Control to research gun violence as a major public health issue;
• Maintain current law requiring background checks and permits for gun silencers;
• Allow states to maintain and enforce their own “concealed carry” laws;
• Require microstamping or ballistic fi ngerprinting of all new fi rearms and ammunition sold in the U.S.;
• Repeal all state “stand your ground” laws;
• Encourage local jurisdictions to utilize their “buyer power” to create incentives for fi rearm manufacturers to employ “countermarketing” strategies to ensure that their retailers are using all available procedures to prevent illegal fi rearms diversion.
Death penalty abolition:From the days of slavery, through years of lynchings and Jim Crow laws, and even today capital punishment has always been deeply affected by race. Although African Americans make up only 13% of the overall population, 42% of the people currently on death row are black, and 35% of those who have been executed in the United States are African American. A recent study by the Death Penalty Information Center, in fact, found that in Philadelphia the odds of receiving the death sentence are nearly four times higher if the defendant is African American. The NAACP supports an abolition of the death penalty.

NAACP Economic Inclusion Plan | 39
Require cultural training of law enforcement and independent investigations of deadly force:The majority of law enforcement offi cers are hard working men and women, whose concern for the safety of those they are charged with protecting and serving is often paramount, even when their own safety is on the line. However, if and when even one of their colleagues engages in behavior that is seen as insensitive to the culture of a community, whether it be conscious or subconscious, the trust of the entire community can be, and will be, lost. The NAACP supports legislation making receipt of federal funds contingent upon enrollees at law enforcement academies receiving sensitivity training on ethnic and racial bias, cultural diversity, and police interaction with the disabled, mentally ill, and new immigrants will help build the trust that is necessary. This training is required in the “Police Training and Independent Review Act of 2017.” The legislation also mandates that states adopt independent investigations and prosecutions of law enforcement offi cers in cases where one or more of the alleged offenses involves an offi cer’s use of deadly force in the course of carrying out his or her offi cial duties will help solidify that trust to ensure that concerns of the community are heard.
Bail Reform:A fair, equal, and effective justice system means one that protects our public safety and ensures that all people – regardless of their income level or their race, ethnicity, or gender – are treated equally. State and local governments from across the country continue to impose money bail by
requiring that individuals who have not yet been convicted remain in jail unless they can pay some amount of money; an amount that is often set arbitrarily without consideration for the person’s ability to pay or an analysis of the person’s actual risk to the public.
The injustice of money bail is compounded by the fact that a disproportionate amount of the harm impacts communities of color. Indeed, studies have shown that African American and Hispanic defendants are more likely to be detained pretrial than white defendants and less likely to be able to post money bail so they can be released. Moreover, race and money bail amounts are signifi cantly correlated: Nationally, African American men pay 35% higher money bail amounts than white men, and Hispanic men pay 19% higher money bail amounts than white men. The effects of money bail systems can be crippling. Research shows that just three days in jail pretrial can cause people to lose employment, housing and destabilize families – all leading to increased likelihood of future criminality. This system is both ineffective and expensive. Taxpayers now spend approximately $38 million per day to jail people who are awaiting trial. Annually, this adds up to $14 billion.
The Pretrial Integrity and Safety Act of 2017, introduced in the US Senate, would: Authorize a $10 million grant over a three-year period to incentivize and encourage states to end the practice of money bail; Sets forth principles to obtain grants, including: Replacing money bail systems with individualized, pretrial assessments with risk-based decision-making; providing for a presumption of release unless the judicial offi cer determines that such release
THE INJUSTICE OF MONEY BAIL IS COMPOUNDED BY THE FACT THAT A DISPROPORTIONATE AMOUNT OF THE HARM IMPACTS COMMUNITIES OF COLOR.

40 | NAACP Economic Inclusion Plan
would not result in the appearance of the person at trial or would endanger the safety of others in the community; if pretrial release requires imposing conditions, it should be based on the least restrictive, non-fi nancial conditions that a judicial offi cer determines is necessary; supervision of bail conditions should be based on evidence-based practices; appointment of counsel at the earliest possible stage of pretrial detention; instituting a system of data collection and reporting to show effectiveness of system improvements.
Incentivize states and jurisdictions to provide annual credible hate crimes statistics:One of our biggest current problems is the incomplete collection of accurate hate crimes data. The Hate Crime Statistics Act, as amended and made permanent in 1996 requires the Attorney General to collect data on crimes committed because of the victim’s race, religion, disability, sexual orientation, or ethnicity. Data must drive policy. The fi rst step in addressing hate violence in America is to know its nature and magnitude. Though clearly incomplete, the FBI’s annual Hate Crime Statistics Act (HCSA) reports now provide the most comprehensive single national snapshot of bias-motivated criminal activity in the United States. The National Opposition to Hate, Assault and Threats to Equality (No Hate) Act incentivizes and encourages state and local law enforcement agencies to more comprehensively collect and report credible, reliable hate crimes data to the FBI. It also allows a judge, at his or her discretion, to sentence an individual convicted of perpetrating a hate crime to undergo a period of supervised release to include community service or education centered on the community targeted by the hate crime.
In 2015, the most current HCSA data available, almost 15,000 law enforcement agencies participated in the HCSA data collection effort – more than ever before. The FBI report documented that hate crimes against African Americans, LGBT community members, Native Americans, Jews, and Muslims all increased in 2015. Indeed, hate crimes against Muslim surged by 67% in 2015. However, the FBI also documented 87 cities over 100,000 in population that either affi rmatively reported zero (0) hate crimes – or did not participate in the program at all. DOJ should incentivize and encourage state and local law enforcement agencies to more comprehensively collect and report credible, reliable hate crimes data to the FBI. Furthermore, DOJ should also collect data from every federal law enforcement agency. According to press reports, dozens of federal law enforcement agencies are not currently reporting hate crimes to the FBI at all.
Reauthorize and update the Violence Against Women ActThe NAACP-supported Violence Against Women Act of 1994 (VAWA) was originally signed into law in 1994. The original law expired on September 30th, 2018, and received extensions until December 15, 2018. By all accounts, VAWA has proven to be a tremendous success. Since VAWA was enacted more victims report episodes of domestic violence to the police and the rate of non-fatal intimate partner violence against women has decreased by almost two-thirds. In just the fi rst 15 years of VAWA’s work, rates of serious intimate partner violence declined by 72% for women and 64% for men. VAWA is crucial in our efforts to fi ght the epidemic of domestic, sexual dating violence, and stalking. What is called for now is legislation to reauthorize, strengthen, and further improve VAWA; we must continue the momentum. We have the opportunity
ONE OF OUR BIGGEST CURRENT PROBLEMS IS THE INCOMPLETE COLLECTION OF ACCURATE HATE CRIMES DATA.

NAACP Economic Inclusion Plan | 41
to build on VAWA’s successes and reach more victims. We must pass a VAWA reauthorization that focuses on young women, women who are incarcerated, and women who live on or near tribal lands. The NAACP supports legislation which will: invest in prevention; end impunity for non-Native perpetrators of sexual assault, child abuse co-occurring with domestic violence, stalking, sex traffi cking, and assaults on tribal law enforcement offi cers on tribal lands; improve enforcement of court orders that require adjudicated domestic abusers to relinquish their fi rearms; improve access to housing for victims and survivors; protect victims of dating violence from fi rearm homicide; help survivors gain and maintain economic independence; update the federal defi nition of domestic violence for the purposes of VAWA grants only to acknowledge the full range of abuse victims suffer (does not impact the criminal defi nition of domestic violence); maintains existing protections for all survivors; and improve the healthcare system’s response to domestic violence, sexual assault, dating violence, and stalking.
VOTING RIGHTS POLICY PRESCRIPTIONSRepair, restore, and strengthen the 1965 Voting Rights Act:The Voting Rights Act of 1965 (VRA) was enacted to insure that no one, including federal, state or local government may in any way impede people from registering to vote or voting because of their race or ethnicity. Most provisions in the VRA, and specifi cally the portions that guarantee that no one may be denied the right to vote because of his or her race or color, are permanent.
Section 5 of the VRA requires certain states or jurisdictions, which have an established history of laws or policies which result in the disenfranchisement of a group of racial or ethnic minority voters to obtain advance approval or “preclearance” from the US Department of Justice or the US District Court in D.C. before they can make any changes to voting practices or procedures. Examples of these changes also include “redistricting,” or the re-drawing of congressional district boundaries or any change in the date, time, place, or manner under which an election is held. Federal approval is to be given as soon as the state or jurisdiction proves that the proposed change would not abridge the right to vote on account of race or color.
In 2013 the United States Supreme Court heard the case of Shelby County, Alabama v. Holder, which challenged the constitutionality of the “preclearance” provisions of the VRA. On June 25, 2013, the Supreme Court issued its decision in which the Court did not invalidate the principle that preclearance can be required. The Supreme Court did decide, however, that Section 4(b) of the VRA, which establishes the formula that is used to determine which states and jurisdictions must comply with Section 5’s preclearance, is antiquated and thus unconstitutional and can no longer be used. Thus, although Section 5 survives, it is currently not being used and will not be used until Congress enacts a new formula to determine who should be covered by it.
The Voting Rights Advancement Act would: modernize the preclearance formula to cover states with a pattern of discrimination that puts voters at risk; ensure that last-minute voting changes won’t adversely affect voters; protect voters from the types of voting changes most likely to discriminate against people of color and language
NO ONE MAY BE DENIED THE RIGHT TO VOTE BECAUSE OF HIS OR HER RACE OR COLOR.

42 | NAACP Economic Inclusion Plan
minorities; enhance the ability to apply a preclearance review when needed; expand the effective Federal Observer Program; and improve voting Rights protections for Native Americans and Alaska Natives. Furthermore, this legislation includes all of the priorities necessary for a strong VRA restoration as established by the NAACP National Board of Directors.
We must tell Congress – both the House and the Senate – that the time to act is now! We must not delay and allow one more American to face unnecessary, unconstitutional, and undemocratic obstacles as they try to vote.
Expand access to the polls for all eligible voters:In 2002, following the 2000 Presidential election debacle, Congress passed the Help America Vote Act. The NAACP supported the Help American Vote Act as we saw it as an important step toward ensuring that every eligible American who wants to vote can, and that every vote is counted. While we have seen some real progress since the enactment of the Help America Vote Act, the 2004 and 2008 Presidential elections and the 2006 mid-term election clearly demonstrated that there is still much more to be done.
To address many of these problems, the NAACP calls for stronger federal laws to protect and enhance the rights of all Americans to cast a free and unfettered vote and to ensure that their vote is counted. Specifi cally, the NAACP supports the Voter Empowerment Act, would expand and protect voters’ access to the polls and would increase accountability and integrity among election offi cials and poll workers. It also would expand eligibility to allow all ex-offenders who have been released from prison (even those
who may still be on probation or parole) to register and vote in federal elections.
Specifi cally, the Voter Empowerment Act would:
• guarantee early voting – require that every state establish early voting sites that are open at least 15 days prior to a general election day;
• require automatic registration – the bill would use modern technology to automatically and permanently register all eligible voters;
• allow same-day registration throughout the country – it would ensure/allow voters to register to vote on election day at their polling place;
• ensure on-line voter registration – the Voter Empowerment Act would ensure that on-line voter registration is a viable option nationally;
• outlaw “voter caging” – makes illegal a practice by which mail is sent to a registered voter’s address and, if the mail is returned as “undeliverable” or if it is delivered and the voter does not respond, his or her registration is challenged; clarify and strengthen the use of provisional ballots – ensures that provisional ballots are counted;
• make voter intimidation and deception punishable by law – with strong and tough penalties so that people who commit these crimes suffer more than just a slap on the wrist, and establish a process for reaching out to misinformed voters with accurate information so they can cast their votes in time;
• encourage youth voters – the Voter Empowerment Act requires colleges and universities to offer and encourage voter registration to all students;
WE MUST TELL CONGRESS – BOTH THE HOUSE AND THE SENATE – THAT THE TIME TO ACT IS NOW!

NAACP Economic Inclusion Plan | 43
• assure voting by overseas residents – it increases assurances that Americans who may be living overseas, especially those serving our country in the armed services, can cast a valid vote and be assured that their vote was counted.
The right of all eligible citizens to vote and to have their vote count is the cornerstone of our democracy, and it is a fundamental civil right guaranteed by our Constitution. The NAACP believes strongly that it is the obligation of Congress to ensure that everything that can be done will be done to ensure that every eligible American is allowed to vote and to be sure that his or her vote has been counted.
Automatic Voter Registration:Automatic voter registration (AVR) makes two transformative, yet simple, changes to voter registration: Eligible citizens who interact with government agencies are registered to vote unless they decline, and agencies transfer voter registration information electronically to election offi cials. AVR is already the law in several states, with even more considering it. This policy has been found to boost registration rates, clean up the rolls, make voting more convenient, and reduce the potential for voter fraud, all while lowering costs.
Oppose photo identifi cation requirements for voting:The right of all eligible citizens to vote and to have their vote count is the cornerstone of our democracy, and it is a fundamental civil right guaranteed by our Constitution. The NAACP believes strongly that it is the obligation of Congress to ensure that everything that can be done will be done to ensure that every eligible American is allowed to vote and to be sure that his or her vote has been counted.
Unfortunately, some Members of Congress are also seeking to limit voting rights by introducing legislation to require that all Americans present a government-approved photo identifi cation before voting. Specifi cally, some bills would place an added burden of requiring a government-approved photo identifi cation before voting. This fl ies in the face of our Constitutionally guaranteed right to cast a free and unfettered ballot, as well as the intent of the 1965 Voting Rights Act, which prohibits state and local governments from establishing laws or policies which would have a discriminatory effect on the ability of certain groups to vote. This requirement would have a disparate
impact on the ability of certain groups, most notably racial and ethnic minority Americans, the elderly and low-income Americans, many of whom are less likely to have or carry a photo ID or have the means to secure such an identifi cation. Lastly, these bills do nothing to address many of the actual, documented problems of election and voter fraud which continue to plague our electoral process and our democracy, including the improper purges of voters, distributing false information about when and where to vote, stuffi ng ballot boxes, and tampering with registration forms, most of which are perpetrated by corrupt election offi cials, not voters.
Promote civic participation and rehabilitation by reinstating voting rights for felony offenders who are no longer incarcerated:Felony disenfranchisement laws, which vary from state to state, currently disqualify almost 4 million, or 1 in 50, American adults from voting. 13% of African American males are prohibited from voting because of these laws. Three-fourths of these disqualifi ed voters are not in prison, but are on probation, parole or are ex-offenders. Moreover, the removal of voting privileges is imposed regardless of the nature or seriousness of the offense; thus in some states, you can lose your right to vote forever because you once wrote a bad check. The Democracy Restoration Act would allow felons who are no longer incarcerated to reintegrate themselves back into society and vote in federal elections, as would a provision in the Voter Empowerment Act.
Ensure an accurate, fair, and credible 2020 Census:The federal government has always played a vital role in developing the data that Americans rely on to make well-informed decisions. As mandated in the U.S. Constitution, the U.S. Census Bureau counts the U.S. population every 10 years. The 2020 Census must count roughly 334 million people in homes and group facilities across our country as of Census Day, which is April 1, 2020. The information which is gathered will be used for everything from determining political representation at the federal, state, and local levels to the allocation of tax dollars. Businesses and industry also use census data to plan investments which result in economic development, jobs, and prosperous communities.
Given that Census data is used for the apportionment of seats in the U.S. House of Representatives, as well as the drawing of districts including those for the US

44 | NAACP Economic Inclusion Plan
House, state legislatures, city councils, school boards and other municipal bodies, the NAACP and other civil rights organizations are reliant on as accurate a count as possible to ensure the Constitutional principle of “one person, one vote.” Census and American Community Survey (or “ACS”, which is an ongoing survey that provides vital information on a yearly basis about our nation and its people) data are also used to implement the Voting Rights Act and to ensure that citizens whose fi rst language is not English can participate in the electoral process.
The decennial census fi gures are also used by the federal government when allocating roughly $450 billion a year, or nearly one-third of all federal grants to state and local governments. Congress also uses the decennial census fi gures, along with those derived through the ACS to allocate grants for almost everything, including for school districts; homeland security; transportation; Medicaid; community development; housing; business and industry loans; water and waste disposal systems; public safety; and so much more.
End “prison-based gerrymandering”:The American constitution requires a census every 10 years to count all residents in the United States, regardless of background. Not only is the census central to apportioning political power, but the data also infl uence the allocation of more than $800 billion every year for services like schools, fi re departments, and hospitals and much more.
The majority of state and federal prisons are built in disproportionately white rural areas; given that the U.S. Census Bureau counts people in prison as residents of the community that contains the prison, not the community that they are legal residents of, and that African Americans are incarcerated at a rate six (6) times higher than whites, these areas benefi t fi nancially and politically from how the Census Bureau counts prisoners. Counting incarcerated people as residents of the prison community has a particularly negative effect on the voting strength of African-American communities.
Protect DREAMERs:The NAACP supports the DREAM Act; legislation which impact nearly 800,000 people under the age of 31 who were brought to the US as children and grew up here; many have known no other country. The DREAM Act would allow these young people to earn lawful permanent residence and eventually American citizenship if they: are longtime residents who came to the U.S. as children; graduate from high school or obtain a GED; pursue higher education, work lawfully for at least three years, or serve in the military; pass security and law enforcement background checks and pay a reasonable application fee; demonstrate profi ciency in the English language and a knowledge of United States history; and have not committed a felony or other serious crimes and do not pose a threat to our country.
THE MAJORITY OF STATE AND FEDERAL PRISONS ARE BUILT IN DISPROPORTIONATELY WHITE RURAL AREAS.

NAACP Economic Inclusion Plan | 45
CONCLUDING STATEMENT
CONCLUDING STATEMENT
Changing the outcomes described in this report begins with an honest acknowledgement
and assessment of the facts, including the role that racism continues to play in perpetuating
inequities. However, that is only the fi rst step. Real progress will require a movement driven
by collaboration among researchers, activists, community leaders, concerned citizens and
those in positions of power at all levels of government to speak truth to power and develop
solutions for lasting change. The political will to move such an agenda will be determined by
the will of voters.
In the closing of his 2018 keynote address, Rev. Barber concluded that, “people are ready
for a grown up, researched movement that can handle dealing with race and poverty and
ecological devastation and the war economy all in the same space and can use that kind
of power and research to register people for the movement who vote.” If his words are
a reliable barometer of the will of the people, the time for action – in the Twin Cities, in
Minnesota and across the United States – is now.
Real progre� wi� re� ire a mo��ment dri��n � co� ab��ati�
NAACP Economic Inclusion Plan | 45

46 | NAACP Economic Inclusion Plan
ACKNOWLEDGMENTS
We would like to sincerely thank our Minnesota NAACP Leaders; Joel Franklin, Former
Minnesota/Dakotas State Conference President and Leslie Redmond, Minneapolis NAACP
President for their partnership and support in the development of this report. We also want
to thank the Northwest Area Foundation for their support and continued work throughout
Minnesota and the other communities they serve.
William C. Jordan, Jr. NAACP President, Minnesota/Dakotas State Conference
Farhio Khalif President, St. Paul, Minnesota
Dr. Valerie Rawlston Wilson Economic Data Consultant
Cherie Collins Simms Consultant
Yusef Mgeni 1st Vice President, Minnesota/Dakotas State Conference
Hilary O. Shelton Senior Vice President for Advocacy and Policy Director, NAACP Washington Bureau
Devon Nielsen Intern/Legislative Assistant, NAACP Washington Bureau
William Moore Minnesota/Dakotas State Conference
Steven Belton Minneapolis Urban League President & CEO
Art Comp & Design
For additional information concerning this report please contact Lisa Bland Malone, NAACP Economic Programs Department

NAACP Economic Inclusion Plan | 47
REFERENCES
i Janelle Jones, John Schmitt and Valerie Wilson, “50 Years After the Kerner Commission: African Americans are Better Off in Many Ways but are Still Disadvantaged by Racial Inequality“, 2018. Available at https://www.epi.org/publication/50-years-after-the-kerner-commission/
ii William J. Barber, II, “PREE 10th Anniversary Symposium Keynote Address”, Economic Policy Institute, Mayfl ower Hotel, Washington, DC, November 14, 2018.
iii Bureau of Labor Statistics, Current Population Survey Table, “States: Employment Status of the civilian noninstitutional population by sex, race, Hispanic or Latino ethnicity, and detailed age, 2017 annual averages.” Available at https://www.bls.gov/lau/ptable14full2018.pdf.
iv United States Census Bureau, American Community Survey, 2017 1-year estimates.
v Income estimates from the American Community Survey (ACS) differ slightly from offi cial estimates based on the Annual Social and Economic Supplement (ASEC) of the Current Population Survey (CPS) because the surveys uses different reference periods. The ASEC asks respondents about the previous calendar year (January-December), while the ACS asks about the prior 12 months (not necessarily January-December). ACS estimates are used in this report for the purpose of making a time-consistent comparison of national, state and Twin Cities estimates.
vi Lisa J. Dettling, et. al., “Recent Trends in Wealth-Holding by Race and Ethnicity: Evidence from the Survey of Consumer Finances”, 2017. Available at https://www.federalreserve.gov/econres/notes/feds-notes/recent-trends-in-wealth-holding-by-race-and-ethnicity-evidence-from-the-survey-of-consumer-fi nances-20170927.htm
vii Emma Garcia and Elaine Weiss, “Education Inequalities at the School Starting Gate: Gaps, Trends and Strategies for Addressing Them”, 2017. Available at https://www.epi.org/publication/education-inequalities-at-the-school-starting-gate/.
viii The Nation’s Report Card. Available at https://www.nationsreportcard.gov/
ix Racial achievement gaps are only reported for states with large enough minority populations to produce reliable results. Rankings are relative only to this subset of states.
x U.S. Department of Education, Offi ce of Elementary and Secondary Education, Consolidated State PerformanceReport, 2010-11 through 2015-16. This report cities the four-year graduation rate for black students in Minnesota as 65 percent in 2015, the same rate reported by the Minnesota Department of Education in 2017.
xi Minnesota Report Card. Accessed at http://rc.education.state.mn.us/#mySchool/p–3
xii Minneapolis Public Schools Data Dashboard. Accessed at https://insights.mpls.k12.mn.us/SchoolBoardPortal/index.html.
xiii Saint Paul Public Schools Data Center. Accessed at https://www.spps.org/data.
xiv Student demographics are based on 2018 enrollment.
xv NAACP Legal Defense Fund. 2018. Case: School to Prison Pipeline. Accessed January 28, 2019 at https://www.naacpldf.org/case-issue/school-prison-pipeline/.
xvi Minnesota Department of Public Safety, Minnesota Department of Corrections, State Prison Dashboards. Accessed at https://dps.mn.gov/divisions/ojp/statistical-analysis-center/Pages/state-prison-dashboards.aspx
xvii Minnesota Department of Public Safety, Minnesota Bureau of Criminal Apprehension, Arrest Dashboards. Accessed at https://dps.mn.gov/divisions/ojp/statistical-analysis-center/Pages/Criminal-Justice-Dashboards.aspx
xviii Twin Cities incarceration rates are based on IHS calculations, using Bureau of Justice Statistics, Annual Survey of Jails, 2014 and Census population estimates.
xix Minnesota Juvenile Justice Advisory Committee, 2017 Annual Report. Accessed at https://dps.mn.gov/entity/jjac/Documents/JJAC%20Annual%20Report%202017.pdf