
CORPORATE BONDS - Trusted partner of institutional investors for

216, 13, 48
Investors PresentationAug 2021
The Trusted Communication Platform
Copyright © Kaleyra, Inc. 2021

216, 13, 48
Copyright © Kaleyra, Inc. 2021
LEGAL DISCLAIMERINVESTOR PRESENTATIONThis communication is for informational purposes only. The information contained herein does not purport to be all-inclusive and includes information that has been prepared to assist parties in making their own evaluation with respect to Kaleyra, Inc (“Kaleyra” or the “Company”). The data contained herein is derived from various internal and external sources. No representation is made as to the reasonableness of the assumptions made within or the accuracy or completeness of any projections, modelling or back-testing or any other information contained herein. Any data on past performance, modelling or back-testing contained herein is no indication as to future performance. Kaleyra assumes no obligation to update the information in this communication. This presentation is not an offer to buy or the solicitation of an offer to sell Kaleyra securities.
FORWARD LOOKING STATEMENTSThis presentation contains forward-looking statements within the meaning of U.S. federal securities laws. Such forward-looking statements include, but are not limited to, statements regarding the expectations, hopes, beliefs, intentions, plans, prospects or strategies regarding the future business plans of Kaleyra’s management team and the Company’s financial results. Any statements contained herein that are not statements of historical fact may be deemed to be forward-looking statements. In addition, any statements that refer to projections, forecasts or other characterizations of future events or circumstances, including any underlying assumptions, are forward-looking statements. The words "anticipate," "believe," "continue," "could," "estimate," "expect," "intends," "may," "might,” "plan," "possible," "potential," "predict," "project," "should," "would" and similar expressions may identify forward-looking statements, but the absence of these words does not mean that a statement is not forward-looking. The forward-looking statements contained in this presentation are based on certain assumptions of Kaleyra’s management in light of its experience and perception of historical trends, current conditions and expected future developments and their potential effects on Kaleyra as well as other factors Kaleyra’s management believes are appropriate in the circumstances. There can be no assurance that future developments affecting Kaleyra will be those anticipated. These forward-looking statements involve a number of risks, uncertainties (some of which are beyond the control of Kaleyra) or other assumptions that may cause actual results or performance to be materially different from those expressed or implied by these forward-looking statements. Should one or more of these risks or uncertainties materialize, or should any of the assumptions being made prove incorrect, actual results may vary in material respects from those projected in these forward-looking statements. Kaleyra undertakes no obligation to update or revise any forward-looking statements, whether as a result of new information, future events or otherwise, except as may be required under applicable securities laws.Certain industry and market data information in this presentation is based on the estimates of Kaleyra’s management. Kaleyra’s management obtained the industry, market and competitive position data used throughout this presentation from internal estimates and research as well as from industry publications and research, surveys and studies conducted by third parties. Kaleyra’s management believes these estimates to be accurate as of the date of this presentation. However, this information may prove to be inaccurate because of the method by which management obtained some of the data for its estimates or because this information cannot always be verified due to the limits on the availability and reliability of raw data, the voluntary nature of the data gathering process.NON-GAAP FINANCIAL MEASURE AND RELATED INFORMATIONThis presentation includes reference to Adjusted EBITDA, Adjusted Gross Margin and Adjusted Earnings Per Share (EPS), i.e. financial measures that are not prepared in accordance with U.S. generally accepted accounting principles (“GAAP”). Adjusted EBITDA is defined as of any date of calculation, the consolidated earnings of Kaleyra and its subsidiaries, before finance income and finance cost (including bank charges), tax, depreciation and amortization calculated from the unaudited consolidated financial statements of such party and its subsidiaries, plus (i) transaction expenses, (ii) without duplication of clause (i), severance or change of control payments, (iii) any expenses related to company restructuring, (iv) the Adjusted EBITDA for pre-acquisition period of subsidiaries, (v) any compensation expenses relating to stock options, restricted stock units, restricted stock or similar equity interests as may be issued by Kaleyra or any of its subsidiaries to its or their employees and (vi) any provision for the write down of assets. Adjusted Gross Margin is defined as of any date of calculation, the consolidated revenues of Kaleyra and its subsidiaries, net of the cost of goods sold calculated from the unaudited consolidated financial statements of such party and its subsidiaries, plus (i) the amortization of acquired intangible assets. Adjusted EPS is calculated by dividing adjusted net income (loss) by the weighted number of shares outstanding. Adjusted net income (loss) is net income (loss), plus: (i) transaction expenses, (ii) without duplication of clause (i), severance or change of control payments, (iii) any expenses related to company restructuring, (iv) any compensation expenses relating to stock options, restricted stock units, restricted stock or similar equity interests as may be issued by Kaleyra or any of its subsidiaries to its or their employees, (v) any provision for the write down of assets, (vi) the amortization of acquired intangible assets and (vii) the amortization of debt discount and issuance costs of convertible financial instruments. The pre-2019 pro forma earnings of Kaleyra, which is an Italian company, and its subsidiaries, which include subsidiaries outside of the U.S., may not be prepared in conformance with Article 11 of Regulation S-X of the U.S. Securities and Exchange Commission (the "SEC"). Kaleyra’s management believes that these non-GAAP measures of Kaleyra’s financial results will provide useful information to investors regarding certain financial and business trends relating to Kaleyra’s anticipated financial condition and results of operations. Investors should not rely on any single financial measure to evaluate Kaleyra’s anticipated business. Certain of the financial metrics in this presentation can be found in Kaleyra’s Form 10-K for the fiscal year ended December 31, 2020, filed with the “SEC” on March 16, 2021, and in Kaleyra's Form 10-Q for the quarter ended June 30, 2021 filed with the “SEC” on August 9, 2021, and the reconciliation of Adjusted EBITDA, Adjusted Gross Margin and Adjusted EPS can be found on slide 23-25 of this presentation.
TRADEMARKS AND INTELLECTUAL PROPERTYAll trademarks, service marks, and trade names of Kaleyra and its subsidiaries or affiliates used herein are trademarks, service marks, or registered trademarks of Kaleyra as noted herein. Any other product, company names, or logos mentioned herein are the trademarks and/or intellectual property of their respective owners.

216, 13, 48
Copyright © Kaleyra, Inc. 2021
Large B2C and B2B2C companies have a common challenge.
3
Consumers want to connect with brands on multiple channels. And, they are everywhere.

216, 13, 48
Copyright © Kaleyra, Inc. 2021
How do B2C companies connect with their customers wherever they are?
4
Options:
Build channel capabilities internally?
Use a different product/platform for each channel?
Takes too long, costs too much, and rarely hits big.
Creates data silos, difficult integration and vendor sprawl.
Or they can decide to use Kaleyra...

216, 13, 48
Copyright © Kaleyra, Inc. 2021
Kaleyra
5
The Trusted Communication Platform as a Service,or The Trusted CPaaS, in short.

216, 13, 48
Copyright © Kaleyra, Inc. 2021
Founded in 1999 and listed on the NYSE in 2019.
6

216, 13, 48
Copyright © Kaleyra, Inc. 2021 7
Why leading enterprises choose to work with us
The Trusted CPaaS
Enterprise Focused
Global Footprint with Localized
Servicing
Experience With Highly-regulated
Sectors
High Quality, Security, and
Reliability
Track Record in Transactional
Communications

216, 13, 48
Copyright © Kaleyra, Inc. 2021
Mobile business communication servicesKaleyra offers a wide variety of mobile communications channels, tools, solutions, and services that developers and enterprises can access through APIs or a user-friendly web interface.
BFSI Messaging Solutions
K-LabBFSI Solutions PluginsSOLUTIONS
Analytics
SERVICES
Billing
Customer Portal
Chatbots
Campaign Builder
Flow Builder
Conversations Lookup
Template Editor
Contact Manager
PushNotification
TOOLS
CHANNELS
Anti-Fraud Services Mobile Payment Communicate Pro
WebRTC Video/Audio
vCallsCall Masking
Voice InstantMessagingRBM/RCS
Verify
Fallback
10DLC SC
Numbers
RBM/RCSMessaging
MMS vSMSSMS
Messaging
8
216, 13, 48
Copyright © Kaleyra, Inc. 2021
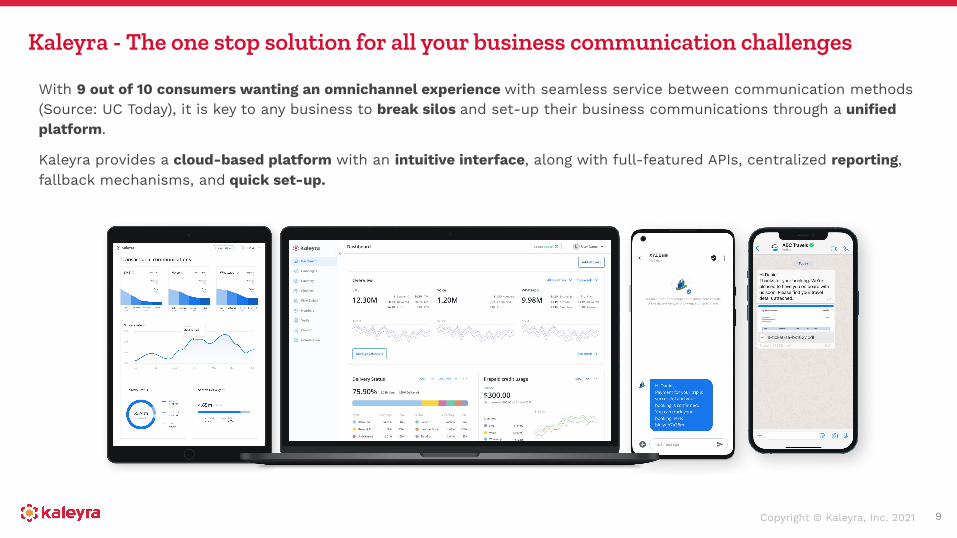
Kaleyra - The one stop solution for all your business communication challenges
With 9 out of 10 consumers wanting an omnichannel experience with seamless service between communication methods (Source: UC Today), it is key to any business to break silos and set-up their business communications through a unified platform.
Kaleyra provides a cloud-based platform with an intuitive interface, along with full-featured APIs, centralized reporting, fallback mechanisms, and quick set-up.
9

216, 13, 48
Copyright © Kaleyra, Inc. 2021
CPaaS: Multiple Use Cases in Many Industries
Food Delivery(Click-to-Call)
E- Commerce (OTP)
Financial KYC (virtual visit)
Whether it’s for OTPs, transactional alerts, promotional communications, video applications, or making phone calls to customers, almost any enterprise makes use of communication services.
We cater to businesses across many verticals including financial services, e-commerce, retail, healthcare, travel, education.
10

216, 13, 48
Copyright © Kaleyra, Inc. 2021
The Large, High-Growth CPaaS Market
Source: Juniper Research, CPaaS-2020-2025-Deep-Dive-Data-and-Forecasting
Average Expected CAGR: +29.5%
How the adjacent markets will evolve
A2P Messaging Market(1)
Total operator revenue from A2P services will reach $54.5 billion in 2025; rising from $42.7 billion in 2020. Total number of A2P messages across all channels will surpass 4.3 trillion in 2025; rising from 2.7 trillion in 2020.
Video Conferencing Market (2)
The global video conferencing market size was $5.32 billion in 2019 and is projected to reach $10.92 billion by 2027, exhibiting a CAGR of 9.7% during the forecast period. Asia Pacific video conferencing market revenue is predicted to expand at 23% CAGR through 2026.
(1) Source: Juniper Research, A2P Messages (2020)(2) Source: Fortune Business Insights (2020)
29.5% CAGR
CPaaS market is expected to reach $25.9 billion in 2025
from $7.2 billion in 2020
11

216, 13, 48
Copyright © Kaleyra, Inc. 2021
Globally Recognized for Excellent Products, Customer Service, and Security
12

216, 13, 48
Copyright © Kaleyra, Inc. 2021 13
Our HistoryOur Offices

216, 13, 48
Copyright © Kaleyra, Inc. 2021
Kaleyra’s Q2 2021 at a glance
14
Global Customers
Messages
8.5BVoice Calls
1.4B
Network Operator Connections
1,600+
Global Offices (APAC - EU - US)
16
Employees Worldwide
510+
3,800+
Q2 2021 data
Customer Highlights for Fiscal Quarter Ended June 30th• 75.1% of revenue came from customers which have been on the
platform for at least one year• 43.7% of revenue is related to the top 10 customers with a churn
rate of zero in the last year• Revenue by country breakdown: Italy (35.5%), India (25.2%), US
(20.3%), South America (4.5%) and Other European and Asian Countries (14.5%)
• No individual customer accounting for more than 10% of revenue• Over 3,800 customers
Latest news of 2021• May - Kaleyra Announces Agreement with Trellance to Build
Communication Solutions for Credit Unions• May - Kaleyra recognized as one of the Top Chatbot Solution
Providers by CIO Applications• June - Kaleyra Closes Landmark Acquisition of Mobile Messaging
Solution Provider mGage for approximately $215 Million to Become Tier-1 Messaging Provider in US
• July - Kaleyra Acquires Bandyer to Expand Communication Solutions to include Programmable Video APIs

216, 13, 48
Copyright © Kaleyra, Inc. 2021
Top-notch Partnerships Platform Integration
15

216, 13, 48
Copyright © Kaleyra, Inc. 2021Copyright © Kaleyra, Inc. 2021
Kaleyra’s global and diversified customer base
Q2 2021 Geographic Mix
16
• $54.0M of revenue in Q2 2021, i.e. +73% compared to same period last year, thereof +40% organic growth• Highly predictable revenue with 55%+ of Kaleyra’s growth in Q2 2021 coming from its existing customers• No individual customer accounting for more than 10% of revenue• About 39% of revenue generated in Europe, 25% from India, 20% from the US and 5% from South America
Q2 2021 Revenue Split

216, 13, 48
Copyright © Kaleyra, Inc. 2021
Some of our customers
17
OXFAM GB

216, 13, 48
Copyright © Kaleyra, Inc. 2021
FINANCIAL OVERVIEW (*)
18(*) Financial information is including the consolidation of mGage from the date of closing of the plan of merger ( June
1, 2021)

216, 13, 48
Copyright © Kaleyra, Inc. 2021
Q2 2021 Financial Information
1See definition on slide 2 and reconciliation of non-GAAP measures on slides 23 and 24
Revenue by Geography
June
30,
202
1Ju
ne 3
0, 2
020
$54.0M+73% period over period
Revenue
• Consistent double-digit increase in revenue • Organic growth of +40% period over period• Solid customer-base revenue with zero churn rate on the
top 10 customers • Over 55% of quarterly growth from existing customers
20.6%vs. 14.5% prior year comparable period
Adj. Gross Margin(1)
• Largest period over period percentage increase (+147% vs Q2 2020) as a public company
• Organic growth of +81% period over period• Main drivers of gross margin expansion are the organic
growth of Kaleyra legacy business and the effects of the business combination with mGage
$2.2Mvs. $(0.3)M prior year comparable period
Adj. EBITDA(1)
• Backs out $6.0M of stock-based compensation and $4.5M of transaction and one-off costs
• Adj. EBITDA is $2.2M compared to $(0.3)M of prior year, comparable period, the increase is mainly due to the organic growth of Kaleyra legacy business and to the effects of the business combination with mGage
$107M net current assets vs. $(4)M net current liabilities year end 2020
Current assets vs. current liabilities
• Net proceeds from the PIPE and the issuance of convertible notes after the payment of mGage consideration
• Final settlement of notes payable due to related parties• Significant amount of cash & equivalents and short term
investments ($125M) in order for the Group to be focused on organic and external growth
19

216, 13, 48
Copyright © Kaleyra, Inc. 2021
APPENDIX
20

216, 13, 48
Copyright © Kaleyra, Inc. 2021
Quarterly consolidated statements of operations
The following table shows the quarterly condensed consolidated statements of operations prepared in accordance with US GAAP.
21

216, 13, 48
Copyright © Kaleyra, Inc. 2021
Balance Sheet
Note: Figures derived from US GAAP financials, except as otherwise indicated.
22

216, 13, 48
Copyright © Kaleyra, Inc. 2021
Quarterly Non-GAAP Adjusted EBITDA Reconciliation
The following table shows the reconciliation of the unaudited Non-GAAP Adjusted EBITDA as reported in the investors presentation. The unaudited figures have been derived from financials prepared in accordance with US GAAP.
Note: Management uses non-GAAP financial measures such as Adjusted EBITDA to evaluate period-to-period comparisons. Management believes these measures provide useful information about the Company’s operating results and financial performance. These non-GAAP financial measures are not measures prepared in accordance with GAAP and might not be consistent with similar measures used by other companies. These non-GAAP financial measures shall not considered as an alternative to any other measures of performance prepared under generally accepted accounting principles.
The “Transaction and one-off costs” for Q2 2021 include $3.7M incurred for mGage’s acquisition.
23

216, 13, 48
Copyright © Kaleyra, Inc. 2021
Quarterly Non-GAAP Adjusted Gross Margin Reconciliation
The following table shows the reconciliation of the unaudited Non-GAAP Adjusted Gross Margin as reported in the investors presentation. The unaudited figures have been derived from financials prepared in accordance with US GAAP.
Note: Management uses non-GAAP financial measures such as Adjusted Gross Margin to evaluate period-to-period comparisons. Management believes these measures provide useful information about the Company’s operating results and financial performance. These non-GAAP financial measures are not measures prepared in accordance with GAAP and might not be consistent with similar measures used by other companies. These non-GAAP financial measures shall not considered as an alternative to any other measures of performance prepared under generally accepted accounting principles.
Amortization of acquired intangible assets in Q2 2021 is mainly driven by the Purchase Price Allocation of mGage’s consideration under ASC 805.
24

216, 13, 48
Copyright © Kaleyra, Inc. 2021
Quarterly Non-GAAP Adjusted Earnings Per Share (EPS) Reconciliation
The following table shows the reconciliation of the unaudited Non-GAAP Adjusted Gross Margin as reported in the investors presentation. The unaudited figures have been derived from financials prepared in accordance with US GAAP.
Note: Management uses non-GAAP financial measures such as Adjusted EPS to evaluate period-to-period comparisons. Management believes these measures provide useful information about the Company’s operating results and financial performance. These non-GAAP financial measures are not measures prepared in accordance with GAAP and might not be consistent with similar measures used by other companies. These non-GAAP financial measures shall not considered as an alternative to any other measures of performance prepared under generally accepted accounting principles.
(1) The Non-GAAP estimated tax effects of adjustments is determined by using the Effective Tax Rate (ETR) calculated for the three-months period, excluding discrete tax items.
25

216, 13, 48
Copyright © Kaleyra, Inc. 2021
Shares Count of Kaleyra Common Stock
26
Note: Employees’ RSUs are included in the Implied Retail Float
KLR (NYSE American) shares of Common Stock as of June 30, 2021: - issued and outstanding: 41,307,336
Note: Shares beneficially owned by management (other than Directors and Officers) are included in the Implied Retail Float
Board members, Officers (and Affiliates) 31.1%
Implied Retail Float 68.9%

216, 13, 48
For further details, scan this QR code:
Copyright © Kaleyra, Inc. 2021
Thank You


![arXiv:1707.03613v2 [quant-ph] 25 Aug 2017 · existing trusted-courier systems for secure transmission of encryption keys. ... arXiv:1707.03613v2 [quant-ph] 25 Aug 2017. the ground.](https://static.fdocuments.in/doc/165x107/5f5cbca2d6b1a20b85705184/arxiv170703613v2-quant-ph-25-aug-2017-existing-trusted-courier-systems-for-secure.jpg)